Article

A Study on the Deduction and Diffusion of Promising Artificial Intelligence Technology for Sustainable Industrial Development

Department of Industrial and Management, Kyonggi University, Suwon 443760, Gyeonggi, Korea
*
Author to whom correspondence should be addressed.
Sustainability 2020, 12(14), 5609; https://doi.org/10.3390/su12145609
Submission received: 14 May 2020 / Revised: 1 July 2020 / Accepted: 8 July 2020 / Published: 13 July 2020
(This article belongs to the Section Economic and Business Aspects of Sustainability)

Abstract

:
Based on the rapid development of Information and Communication Technology (ICT), all industries are preparing for a paradigm shift as a result of the Fourth Industrial Revolution. Therefore, it is necessary to study the importance and diffusion of technology and, through this, the development and direction of core technologies. Leading countries such as the United States and China are focusing on artificial intelligence (AI)’s great potential and are working to establish a strategy to preempt the continued superiority of national competitiveness through AI technology. This is because artificial intelligence technology can be applied to all industries, and it is expected to change the industrial structure and create various business models. This study analyzed the leading artificial intelligence technology to strengthen the market’s environment and industry competitiveness. We then analyzed the lifecycle of the technology and evaluated the direction of sustainable development in industry. This study collected and studied patents in the field of artificial intelligence from the US Patent Office, where technology-related patents are concentrated. All patents registered as artificial intelligence technology were analyzed by text mining, using the abstracts of each patent. The topic was extracted through topic modeling and defined as a detailed technique. Promising/mature skills were analyzed through a regression analysis of the extracted topics. In addition, the Bass model was applied to the promising technologies, and each technology was studied in terms of the technology lifecycle. Eleven topics were extracted via topic modeling. A regression analysis was conducted to identify the most promising/mature technology, and the results were analyzed with three promising technologies and five mature technologies. Promising technologies include Augmented Reality (AR)/Virtual Reality (VR), Image Recognition and Identification Technology. Mature technologies include pattern recognition, machine learning platforms, natural language processing, knowledge representation, optimization, and solving. This study conducts a quantitative analysis using patent data to derive promising technologies and then presents the objective results. In addition, this work then applies the Bass model to the promising artificial intelligence technology to evaluate the development potential and technology diffusion of each technology in terms of its growth cycle. Through this, the growth cycle of AI technology is analyzed in a complex manner, and this study then predicts the replacement timing between competing technologies.

1. Introduction

The Business Phenomenon

Industries worldwide, including manufacturing, are preparing for a paradigm shift as a result of the Fourth Industrial Revolution. Artificial intelligence (AI) technology has emerged as a key growth engine in the Fourth Industrial Revolution. In the past, artificial intelligence has repeatedly experienced stagnation due to the limitations of technology, but advancements have recently been made due to the rapid development of information and communication technology (ICT). According to an International Data Corporation (IDC) report on the “Artificial Intelligence System Market”, the global cognitive computing and artificial intelligence system market is expected to grow at an annual average of 55.1% over the next five years from 2016 to 2020. Tractica forecasts that the AI market will expand from about USD 60,000 in 2016 to about USD 368 billion in 2025 in the Global Market Forecast report [1]. In addition, McKinsey predicted that the ripple effect of knowledge and labor automation through artificial intelligence would range from USD 5.2 trillion to USD 6.7 trillion per year by 2025.
Hence, it is important to study the prospects of leading technologies in the field that can utilize artificial intelligence because companies are curious about which AI technologies to use and the lifecycle length of the technology. In other words, to ensure industrial growth, it is necessary to present the leading research and direction of AI technology in the industry based on the importance, maturity, and market acceptance of this technology. This will lead to continuous development and enhanced competitiveness.
Thus, this paper analyzed AI patent technology and AI technology trends. Patents are known to contain more than 90% of the technical information existing in the world, and 80% of the technical information existing in patent documents is not published in any other form of document [2]. Therefore, patents are a major competitive strategy to categorize commercial value based on the source information of technology; researchers use patent analysis as a practical tool to infer various types of information [3,4].
The patent analysis is obtained from various pieces of information included in the patent documents. The patent documents consist of technology implementation contents, the technology classification code, citation information, and owner information [5]. Analyzing these patents is important because it means that technology changes, trends, levels, and commercial values can be identified [6,7].
Information about the technology contained in the patent document can be used to explore changes in the field and obtain information for technological innovation. In addition, it is possible to monitor the technology to be analyzed and develop a technology development strategy [8]. Accordingly, many researchers have conducted studies using patent information to analyze and predict technology trends, establish strategic technology plans, and explore promising technologies [9].
The following research questions were prepared to solve this realistic problem:
  • First, which AI technology will be most useful in future industrial sites?
  • Second, in which direction is the most promising AI technology developing?
  • Third, how can one predict the lifecycle of AI technology?
This study used topic modeling to derive detailed technologies (topics) in the field of artificial intelligence. For the detailed technology (topics) derived, promising technology is derived through periodic trend analysis and prospect/decrease analysis. The growth cycle of technology was analyzed via the Bass diffusion model, which can predict the growth curve of promising technology. Through the abstracts of patents, this paper explored artificial intelligence technology and studied promising technologies via topic modeling to analyze the connectivity and potential of keywords using text mining.

2. Theoretical Background

2.1. Diffusion of Technology

The diffusion of technology can be seen as innovation occurring by exchange and distribution within a social system for a certain amount of time, through a diffusion channel [10]. The form of diffusion is expressed in a cumulative graph over time, which is generally called the Growth Curve Model [11]. The growth pattern assumed by the growth curve model shows the overall cumulative rate in the form of an S shape, as the growth rate increases at the beginning and then decreases after a certain period of time [12]. The growth model is used to predict the demand and diffusion pattern of new technologies and new products and to establish the time of new product launches, the time of disposal of existing products, and the time of research and development [12]. The growth curve model is used as a representative analysis method to analyze the development stage of specific technologies. The model can be used to monitor the level of development or to predict the development of technology [13], and research is being conducted to analyze the technology’s lifecycle.
The lifecycle of technology consists of four steps: introduction, growth, maturity, and decline. This can be schematized as in Figure 1 [14].

2.2. Bass Diffusion Model

As a method for analyzing the technology lifecycle, the Bass diffusion model is known to show the size of the market based on past data [15]. It was first proposed by Frank M. Bass in 1969 [16] and is a mathematical conversion model based on Rogers’ (1962) [10] innovation diffusion theory. The model is used to predict the demand for new products or services. It is a typical method to express the spread of innovation as an initial model of the S-shaped function model.
The Bass model currently considers only two segments, the market and potential market, and assumes that two factors, innovation and imitation, have the greatest impact on innovation [15]. The innovation effect is defined as an innovator for a group that adopts new technologies and new products by making independent decisions without external influence, and uses the innovation coefficient (p) as a parameter to reflect this. The imitation effect defines a group that imitates other people to purchase new products due to internal influences, and uses the imitation coefficient (q) as a parameter to reflect this. The assumption is that someone who has not yet adopted an innovation follows the linear function. This can be expressed as Equation (1). F(t) is the differentiation of F(t).
f ( t ) 1 F ( t ) = p + q F ( t )
where F(t): probability of total potential demand being adopted by time t (cumulative probability density function); f(t): probability that some of the potential demand for innovative technologies will be adopted at time t (probability density function); p: innovation factors affecting the adoption of innovative technologies (independent influence independent of existing demand); q: imitation coefficient (how the existing demand affects the demand at time t) indicating how much people are trying to imitate innovative technology.
When the total new demand (potential demand) of the product for the entire period at time t is m, and the number of existing adopters is N(t), it can be expressed as F ( t ) = N ( t ) m . Using this, we can derive F(t) from Equation (1) as in Equation (2).
F ( t ) = 1 e ( p + q ) t 1 + q p e ( p + q ) t
f ( t ) = d F ( t ) d t = p ( p + q ) 2 e ( p + q ) t ( p + q e ( p + q ) t ) 2
Multiplying Equation (2) by the potential demand m and F(t) yields N(t), the cumulative number of adopters for innovative technologies at time t, as in Equation (4). In the Bass diffusion model, N(t) is determined by the expression of the innovation coefficient p, the imitation coefficient q, and the potential demand m, and the demand model is determined by estimating it.
N ( t ) = m ( 1 e ( p + q ) t ) ( 1 + q p e ( p + q ) t )
n ( t ) = d N ( t ) d t = p ( p + q ) 2 e ( p + q ) t ( p + q e ( p + q ) t
In the Bass model, the left and right sides are asymmetrical around the inflection point. In addition, even if the scale of m is unknown, the parameters p and q can be directly estimated if only the accumulated demand N(t) is known. However, because the estimates of m and p, q are closely related, if the estimation is inaccurate due to insufficient data, the probability of the incorrect estimation of both p and q increases [17].

3. Literature Review

3.1. Method of Patent Analysis

It is statistically simple to compile and compare patents filed in the general way. However, recent studies have been changing to apply a precise patent analysis methodology using large amounts of bibliographic information [9]. At the macroscopic level of patent analysis, studies measuring the economic impact of technology development or evaluating the technological competitiveness of the country are common. Through this, it is possible to grasp the internal and external linkage structure of technology development trends. In the microscopic aspect of patent analysis, studies are being conducted to determine the technical strengths and weaknesses of competitors, plan corporate technology development activities, derive the priorities of research and development, find technical gaps, and present opportunities for new technologies [18,19].
Suzuki et al. (2008) [20] used International Patent Classification (IPC) codes to classify the Research and development status of companies in terms of the integration of technologies in the same field and the integration of heterogeneous technologies and judged them from a technology convergence perspective through simultaneous classification analysis.
Jeong (2011) [21] developed a technology roadmap through patent analysis and applied text mining to perform technology planning based on a technology roadmap. Through this, undeveloped technologies and characteristics of technologies that need to be developed in the future were proposed.
Curran and Leker (2011) [22] observed a convergence between technologies using the simultaneous classification analysis of IPC and grasped the degree of convergence technology based on the possibility that the IPC of a specific patent appears simultaneously in patents in other fields.
Kim et al. (2012) [23] studied a methodology and system for expressing technology causality in technology information as a network using patent information and providing knowledge to support technology convergence.
Karvonen et al. (2012) [24] analyzed the technology convergence using the patent’s bibliographic information and conducted a patent citation relationship analysis at the intersection of the traditional paper industry and the electronic industry via Radio-Frequency Identification (RFID) cases.

3.2. Promising Technology Analysis Method

Today, the rapid development of technology has shortened the lifecycle of technology, and the need for continuous technology development is increasing. Accordingly, many companies and countries are focusing on discovering core technologies that can lead industries, products, and services. As the importance of technology grows, it is, in turn, becoming increasingly important to analyze the technology information that emerges globally and predict new technologies. However, predicting technologies is time-consuming and costly; it is difficult to obtain corresponding results.
Therefore, researchers are studying various technology forecasting methodologies to analyze promising technologies that can lead to new technologies and innovative ideas [25]. The concept of a promising technology can be interpreted in various ways depending on the viewpoint. It is often referred to as a future technology, promising technology, emerging technology, new technology, breakthrough technology, or key technology.
Promising technologies can be found by predicting the trend and status of technologies that can be noticed in the future for technologies in a specific field. There are two main approaches to finding promising technologies [5]: first, there are trend analyses and bibliometrics as methods of quantitative technology prediction, using statistical analysis and machine learning algorithms [5]. The second is a qualitative technology prediction methodology for observing technology trends via expert meetings and disagreements; this includes scenario analysis, tree relevance methods, and the Delphi method.

4. Research Method

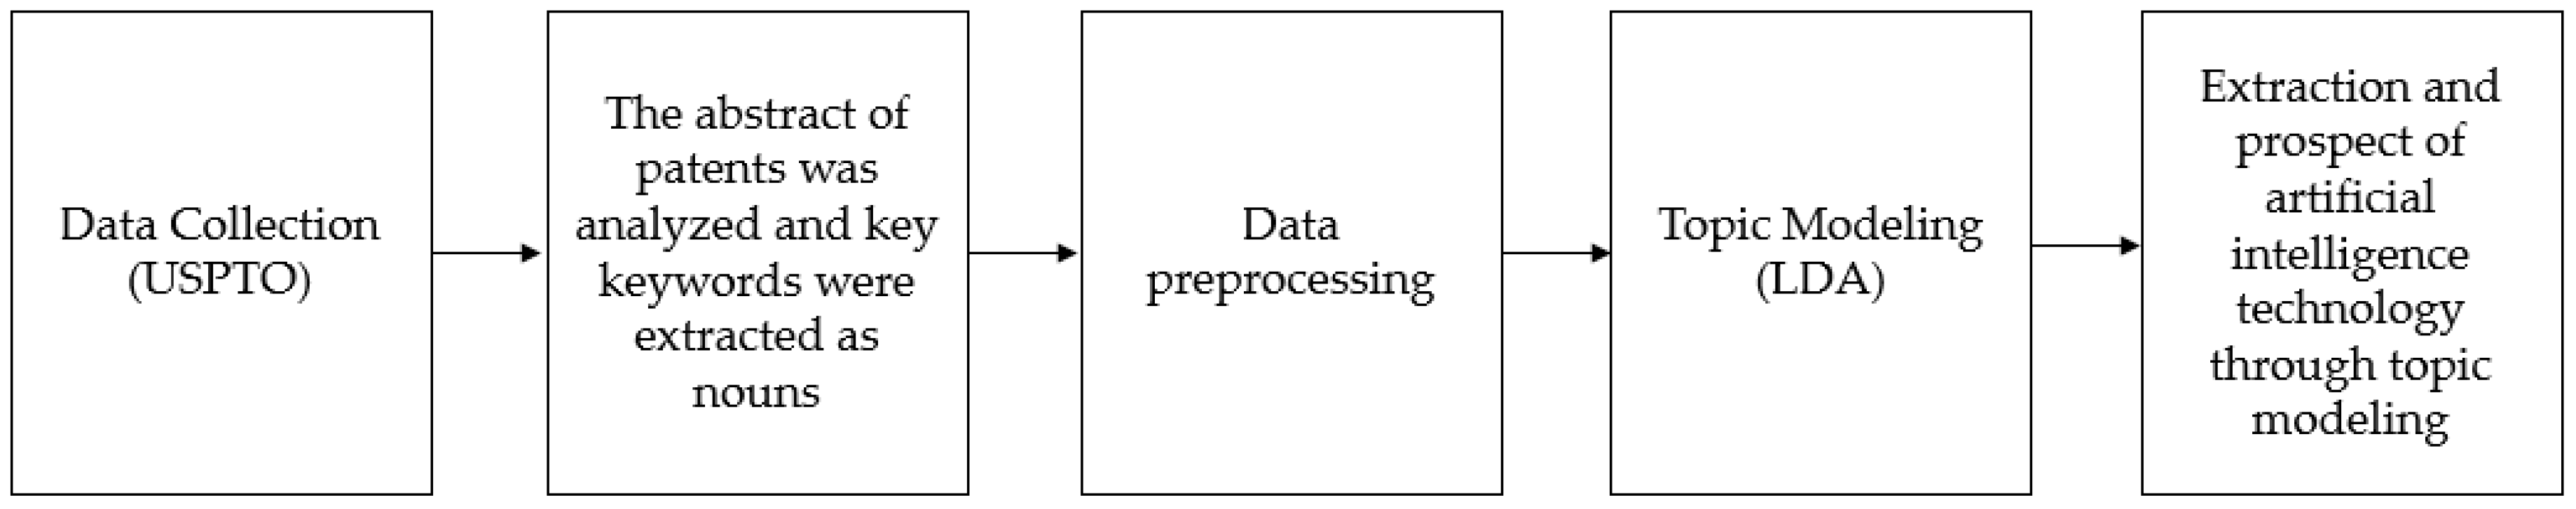
4.1. Research Process

The research process for this study is as Figure 2. First, patent data in the field of artificial intelligence were collected from the United States Patent and Trademark Office (USPTO) website. Second, the abstracts of patents were analyzed, and the main keywords were extracted as nouns.
Third, a data preprocessing process was conducted for analysis. Fourth, artificial intelligence technology was extracted and defined using the topic modeling technique. Finally, promising technologies were studied through a regression analysis of the extracted technologies.

4.2. Data Collection

In this study, patent data registered in the United States Patent and Trademark Office (USPTO) were used to determine the scope of patents in the field of artificial intelligence. This study collected 9556 registered patents from the US Patent and Trademark Office website between 2010 and 2019.
Table 1 shows that Class 706 (the classification code assigned by the USPTO to the field of artificial intelligence technology) includes patents that describe the use of artificial intelligence technology in data processing. The USPTO further defines Class 706 as “the classification of patents for artificial intelligence computers, digital data processing systems, and corresponding data processing methods and knowledge processing systems”. Table 1 shows the classifications of sub-technologies in the AI field.
However, the USPTO changed the patent classification system to Cooperative Patent Classification (CPC) instead of US Class classification system in 2015 and the USPTO has been using the CPC instead of the US Class for international universality. In this paper, patents registered after 2016 in the artificial intelligence field were collected from the CPC codes G06N, G06K, and G06Q.
The registered patents were more valuable than patent pending because they recognize patent registration for technologies with a certain level of newness. In general, after a patent is filed, it goes through a review process, and the patent is released after about 18 months [2]. In this paper, the registered patents were collected and analyzed from 2010, and the number of patents collected is the same as Table 2.

4.3. Data Processing

This study utilized the abstracts of the patents that summarize key elements of the patent. Since the patent document is text-based, unstructured data and a preprocessing process that can standardize the data that are required for analysis. The entire process of data preprocessing was performed with the statistical package R via a text mining package. Here, 9556 patent documents were collected and refined based on five criteria (Table 3). Thus, words were extracted in noun units from the abstract of the patent. In addition, uppercase letters were changed to lowercase letters for the extracted words (lowercase). In addition, stop words such as surveys, articles, and special characters included in the extracted words were removed. Next, stemming was performed for the plural and past forms of each standard English word.
Based on the keywords created through the above process, this paper created a matrix between documents and keywords and constructed a document-term matrix (DTM)—a matrix with a frequency value. Finally, this study constructed and analyzed DTMs with 9556 documents and 10,098 keywords.

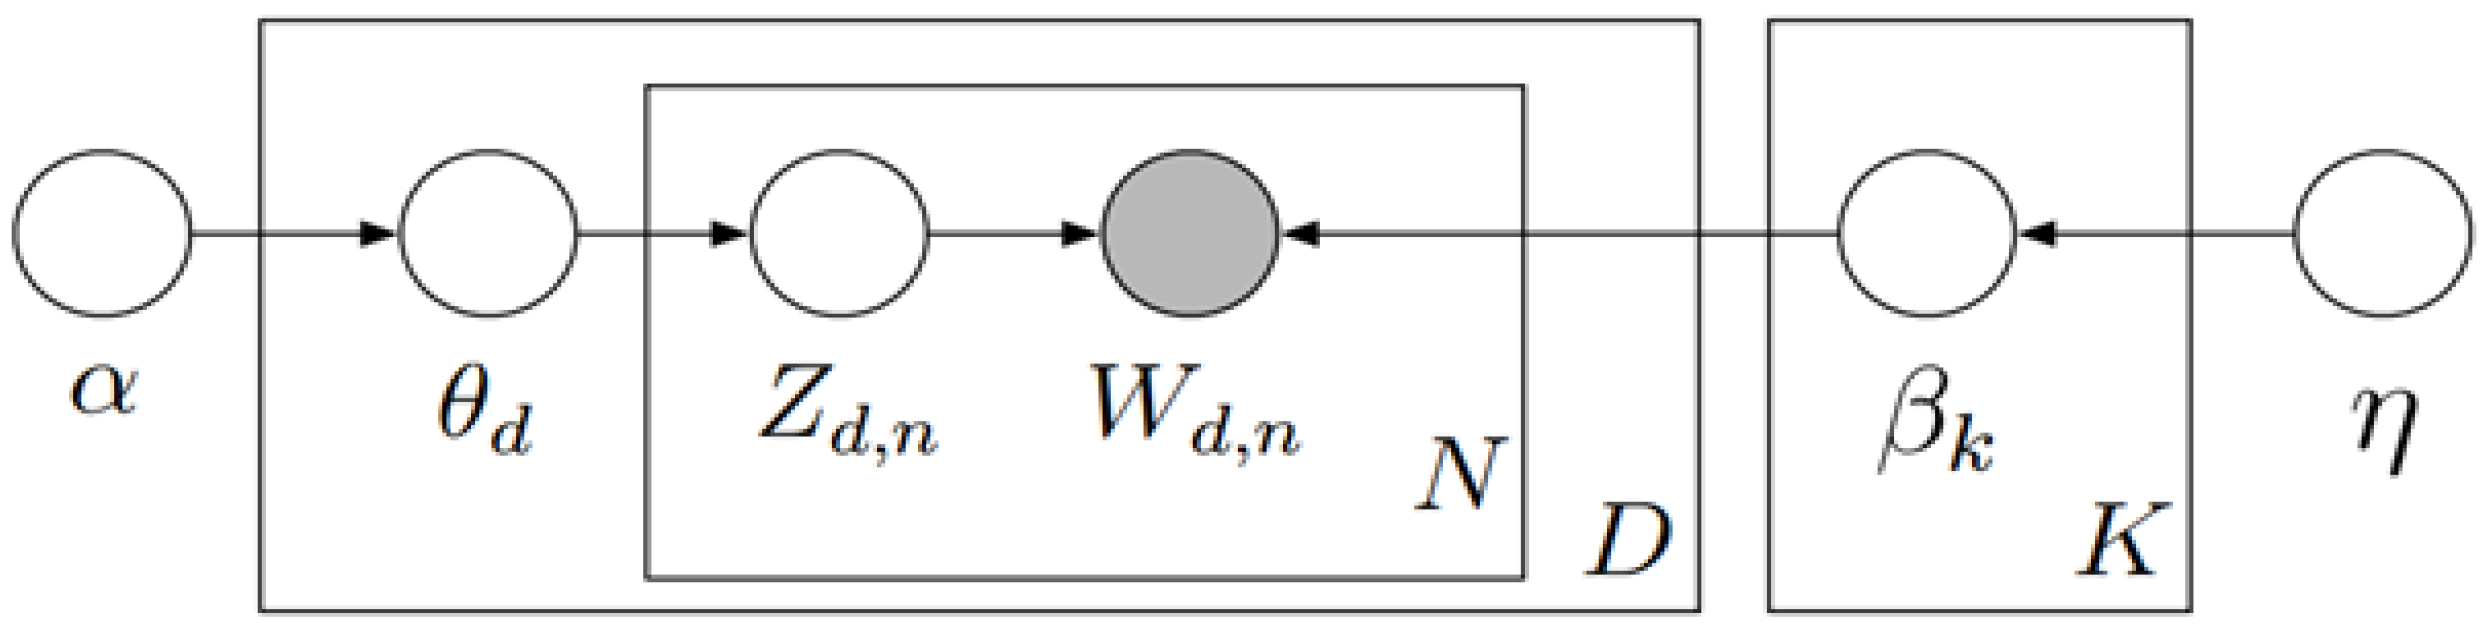
4.4. Patent Abstract Topic Modeling

The topic model is a method for finding a topic within a document cluster and classifying the documents according to the topic. It is a generative probabilistic model that allows the subject to be extracted through a grouping technique that has a similar meaning to words that are latent in the document group. The algorithms used in the topic model include Latent Semantic Indexing (LSI), Probabilistic Latent Semantic Indexing (pLSI), and Latent Dirichlet Allocation (LDA). In general, the LDA algorithm is widely used [26]. The LDA was suggested by supplementing the absence of a document-level probability model in the existing pLSI. The LDA algorithm is a probabilistic algorithm based on a Dirichlet distribution, where each document is considered to have multiple subjects. In addition, a word is generated for each subject, and the probability of generating a document is derived by modeling the distribution of subjects in the document and the probability that a word is generated for each subject [26].
In addition, LDA makes the basic assumption of words interchangeable. The bag-of-words method focuses on which words appear rather than the order in which they appear. For example, “The apple is red” and “Red is the apple” are recognized as the same sentence. LDA estimates the parameters (α, β) through the word distribution and frequency of the received documents. Through these parameters, the word (W) is determined for each topic via the topic ratio (θ) of each document and the allocation topic (Z) of each word. Figure 3 is a model that visually shows the process of LDA [27]. Topic modeling can classify documents more flexibly because it uses a method of estimating the posterior probability under conditions that are not independent of words in each document in the parameter estimation process.
Therefore, in this study, topic modeling characteristics were applied to analyze patents in the field of artificial intelligence. Through this, technologies in the field of artificial intelligence were extracted, and prospective technologies were studied for extracted technologies.

5. Research Results

5.1. Topic Modeling

Topic modeling was conducted to extract technologies in the field of artificial intelligence. Topic modeling requires researchers to select the number of topics in advance. One of the methods for determining the optimal number of topics is to select the lowest number of topics measured in the LDA result, i.e., the topic-keyword matrix [28].
In this study, the cosine similarity for each document was used to determine the optimal number of topics (=K). The cosine similarity is closer to one as the similarity between documents becomes higher. Therefore, there is less topic similarity with a lower cosine similarity. The selection criteria for the number of topics were based on the low cosine similarity. Figure 4 shows how the similarity value changes with the K value, such as from K = five to 11. These are clear data that show the K selection.
In this study, the number of topics was set from five to 11 by referring to Table 1, and the results of cosine similarity by topic number were equal to Table 4.
Finally, in this study, the number of topics was 11, and the number of sampling repetitions was 5000. The basic values of α and β for LDA were used, and the Gibbs sampling method was used. For the entire process of topic modeling, R packages “topic models” [29] and “LDA” [30] were used.
The LDA model should estimate the post-probability of the latent variable when the document is given. One of the inference methods for this is Gibbs sampling [31]. Gibbs sampling is a probabilistic algorithm that generates a series of samples from a combined probability distribution of two or more random variables [31]. Gibbs sampling is one of the Markov chain Monte Carlo (MCMC) algorithms that estimates the distribution mix [31]. The Gibbs Sampler has a disadvantage in that the convergence is slow due to the large dependence between variables. To improve this, the Collapsed Gibbs Sampler omits some unnecessary variables from the sampling [32].

5.2. Extraction and Prospect of Artificial Intelligence Technology through Topic Modeling

The results for 11 topics are summarized in Table 5 due to the analysis of patents in the field of artificial intelligence since 2010 via topic modeling. Topics were selected from the top 50 words by topic, and 15 words representing each topic are shown in Table 5. To verify the topic labeling suggested in Table 5, this paper administered a questionnaire to some 30 experts. Table 5 shows the analysis results of reliability verification through the Cronbach’s Alpha coefficient. Experts participating in the survey are those who have been involved in research and work for more than 20 years in the field of AI technology.

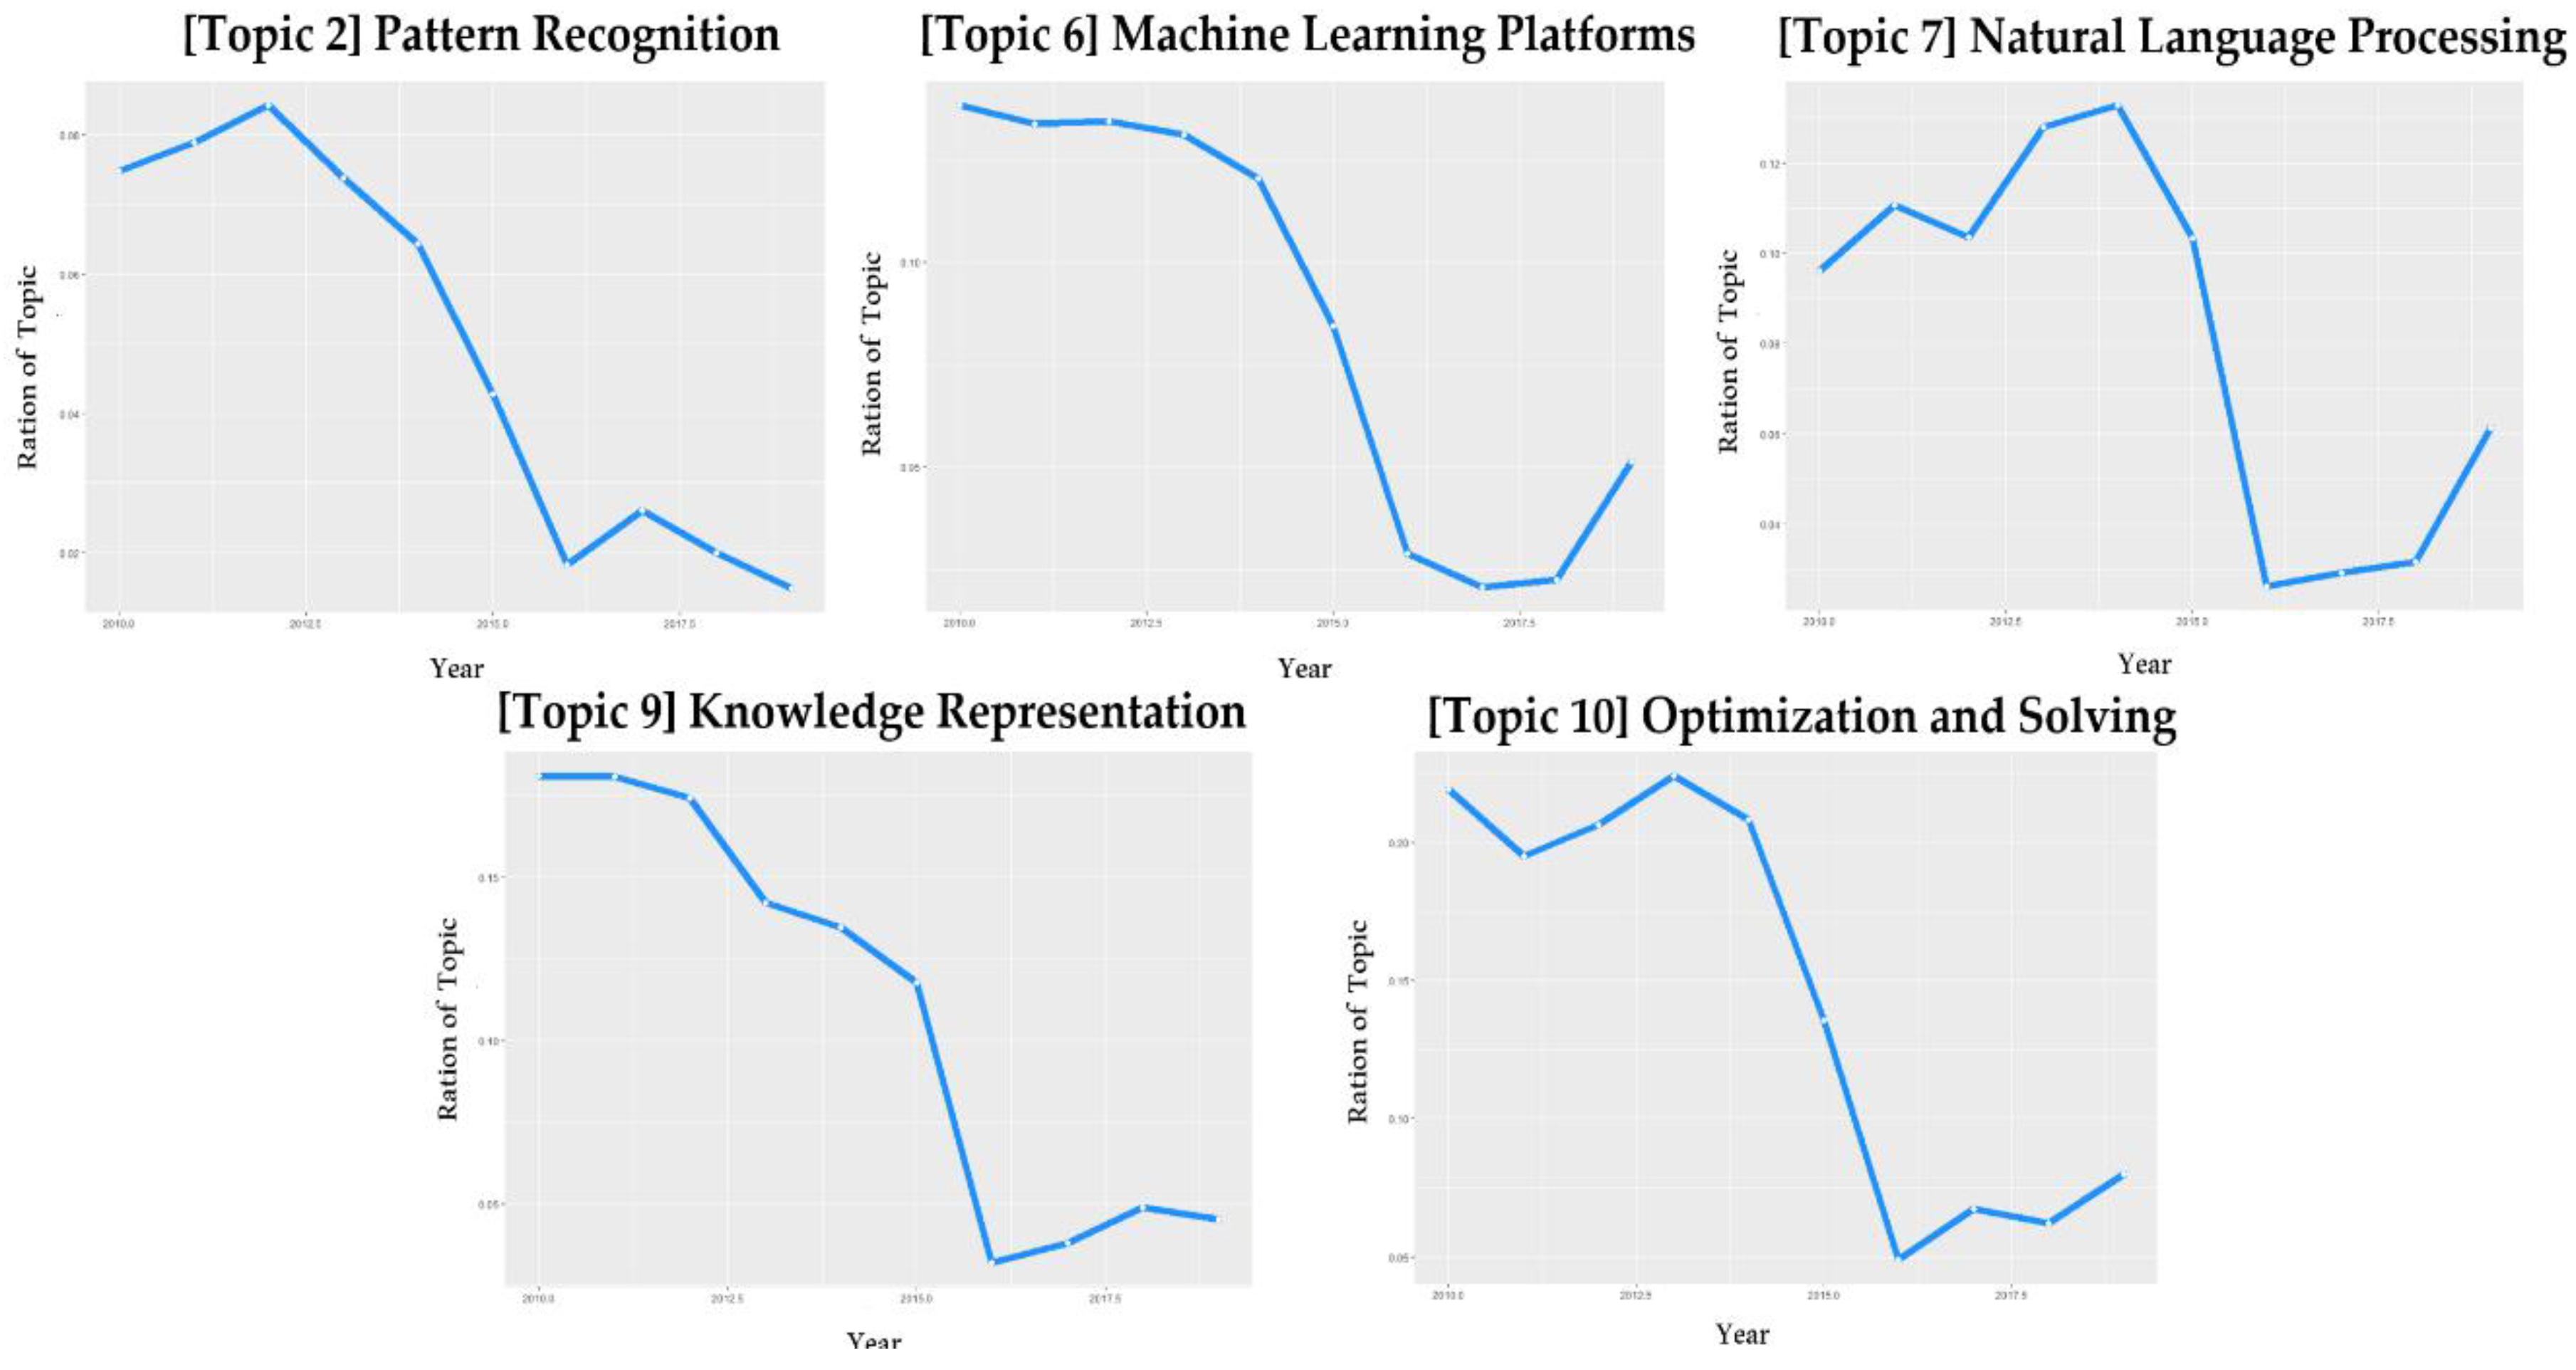
5.3. Analysis of Promising and Declining Technologies in Artificial Intelligence

Prospective and mature technologies were analyzed through linear regression analysis by using the trend of the specific gravity of topics by year for each technology (topic), extracted through the topic model.
A regression analysis was also performed using year as an independent variable and the weight of each technology (topic) as a dependent variable. The coefficient of regression (slope) of linear regression was used as a criterion for determining the rise and fall of each technique (topic) [33].
In addition, in this study, the Durbin–Watson value was used to test the suitability of the regression model [31]. The regression analysis assumes the independence of the residuals. In particular, time series data can suffer from the independence of the residuals. This is because the residuals of the previous period are more likely to affect the residuals of the later period. Among the topics with significant probability within the significance level (p-value < 0.05) of the regression analysis, the subjects were those with Durbin–Watson values greater than one and less than three.
The frequency of the appearance of artificial intelligence technologies over time was also analyzed (Figure 4 and Figure 5) via the technology analyzed in Table 6.
The results are summarized in Table 6. The technique (topic) showing a positive regression coefficient was analyzed in three categories: Topic 3, 4, and 11. An analysis of the promising technologies is shown in Augmented Reality (AR)/Virtual Reality (VR), Image Recognition, and Identification Technology (Table 6); these are marked as Hot. Five technologies (topics) classified as mature technologies (pattern recognition, machine learning platform, natural language processing, knowledge representation and optimization and solving) were analyzed, and described as Cold in Table 6.
In addition, the range of the utilization of AR/VR technology expanded with the recent development of 5G technology, and the market (equipment, content, etc.) using realistic media has been attracting attention. The market was originally formed in entertainment industries such as games and videos, but it has recently been spreading to various industries such as medical care, education, shopping, and manufacturing.
In addition, the development of image Identification Technology such as facial recognition can be used for crime investigation, smart cities, etc. It can improve the safety and convenience of life. Meanwhile, the development of technologies related to identification seems to be expected, as the importance of information protection and security becomes more important due to the development of new technologies.
The technologies classified as mature technologies are early technologies in the field of artificial intelligence or technologies that have appeared actively in the past and are not dealt with much at present. Mature technologies are actively developed and have reached a plateau of development. Figure 6 is a result of analyzing the mature (cold) artificial intelligence technology by year and ration of topic.

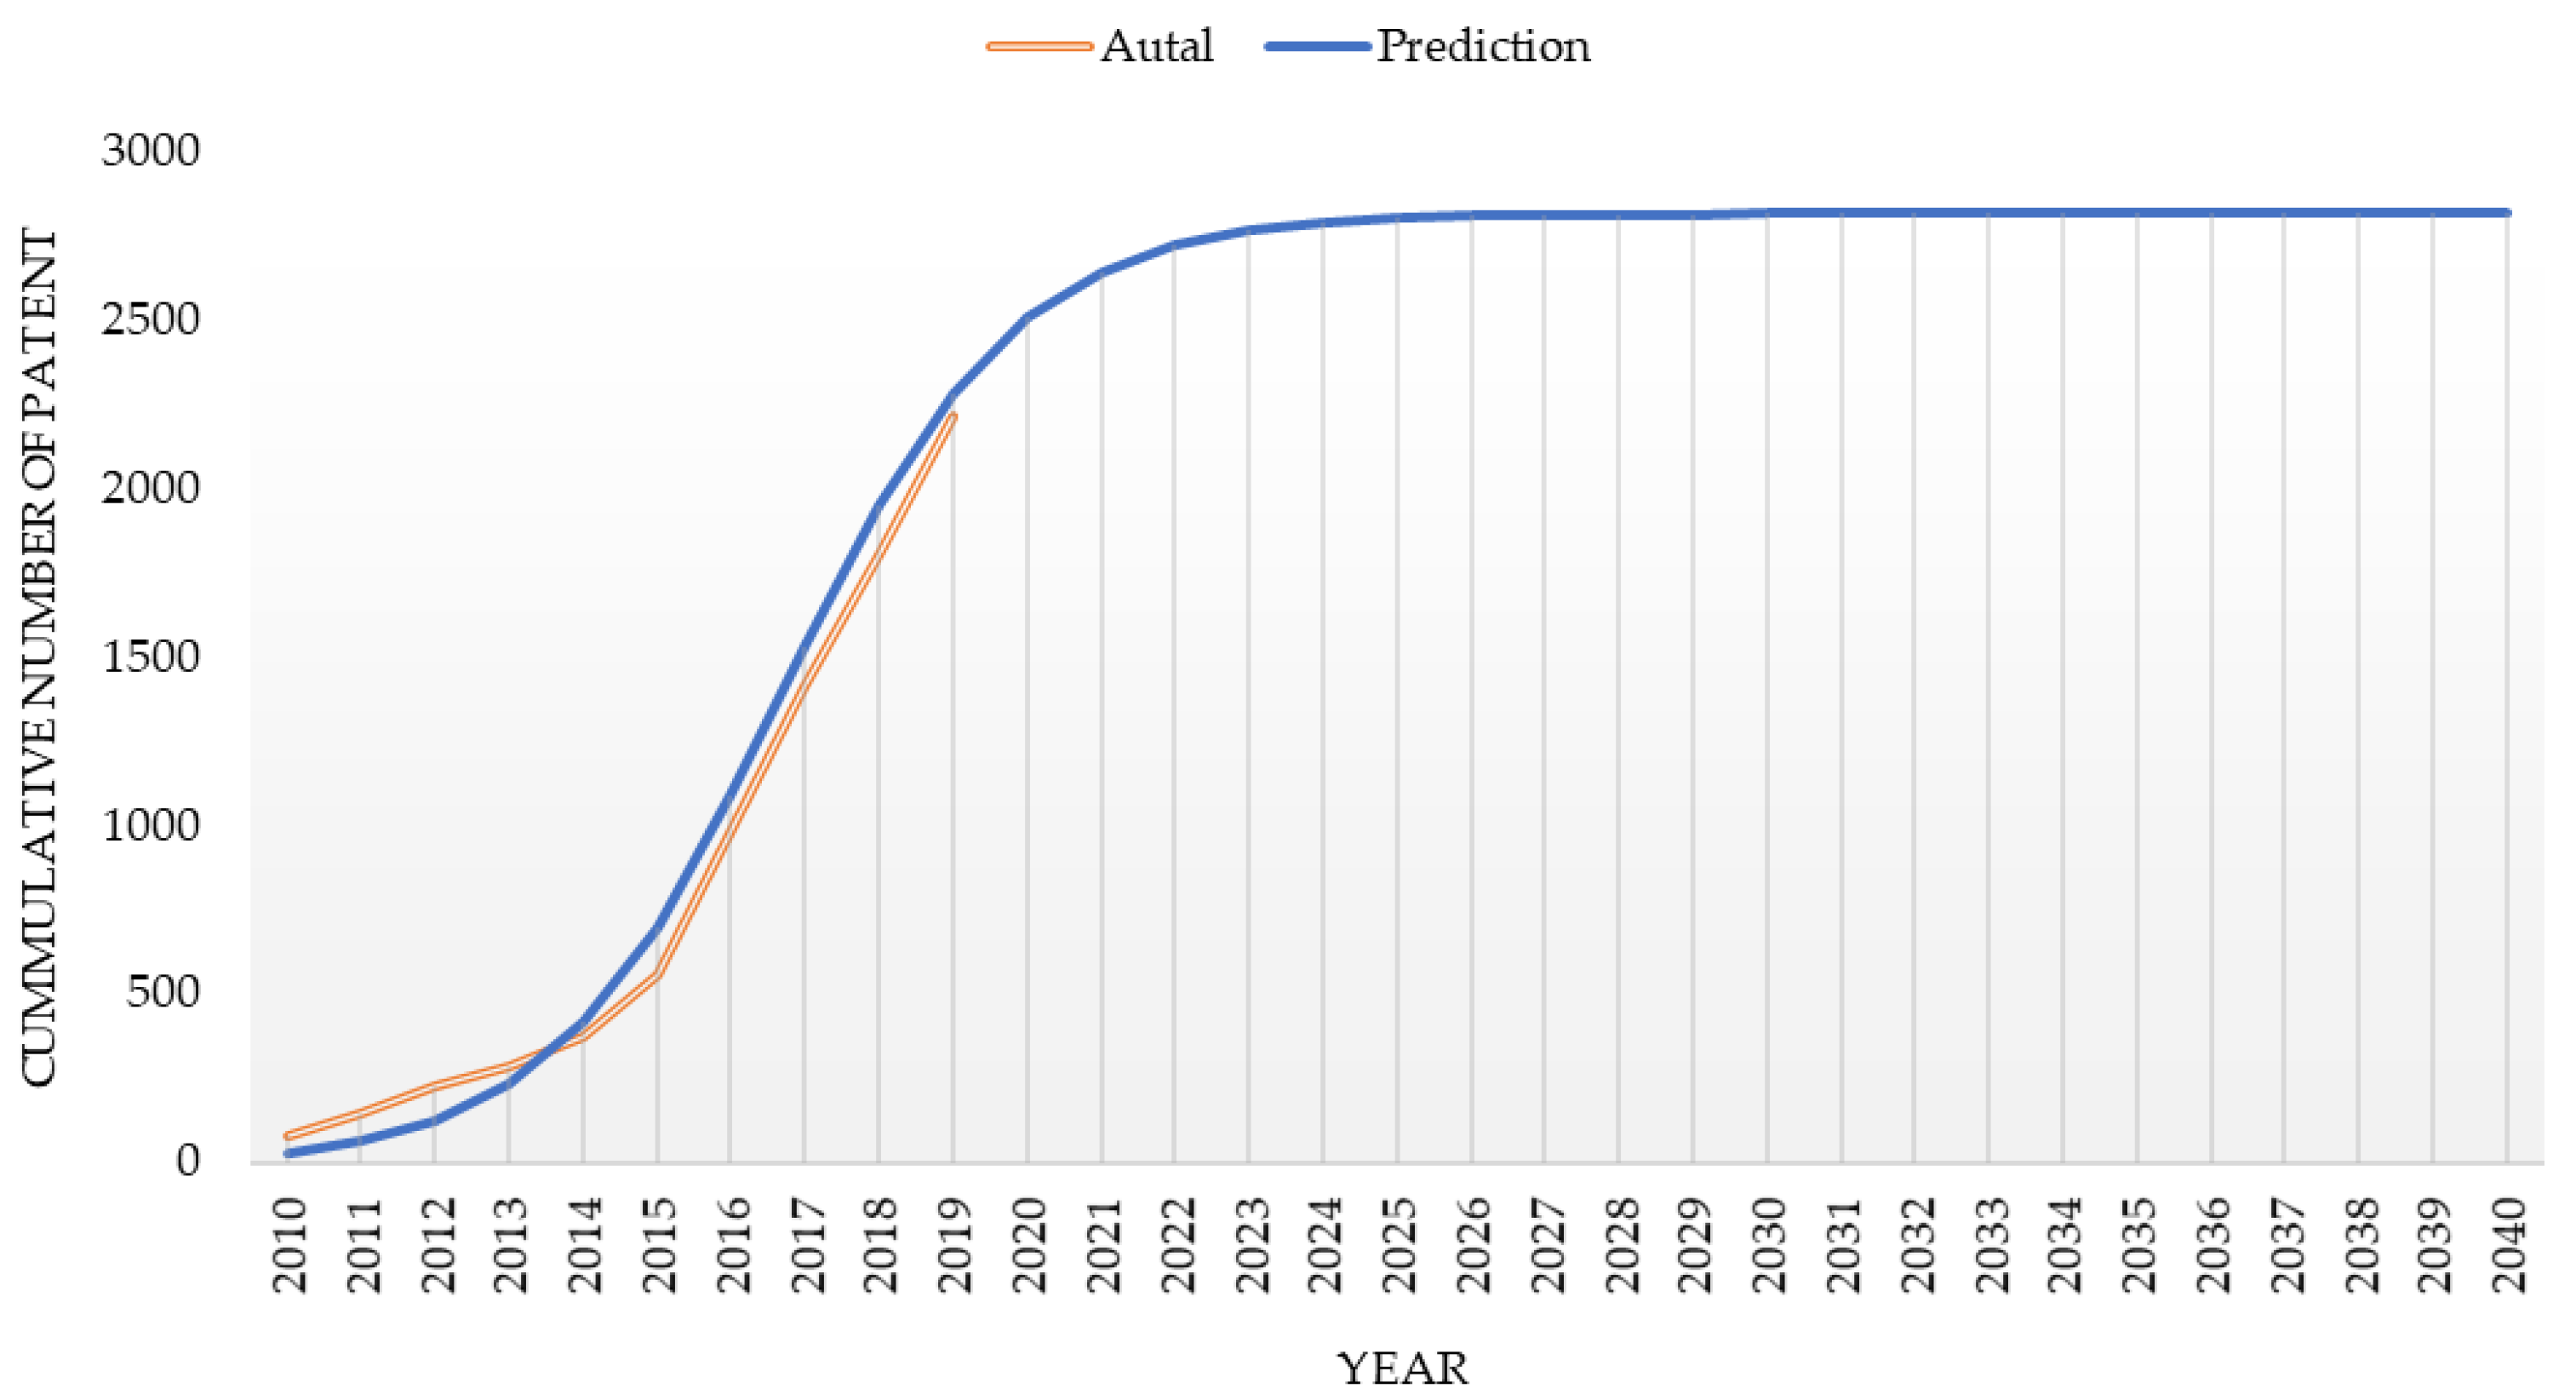
5.4. Diffusion Model of Promising Artificial Intelligence Using the Bass Diffusion Model

Three promising technologies were derived through regression analysis among 11 technologies (topics) extracted by analyzing patents in the field of artificial intelligence via topic modeling. In this study, three promising technologies (topics) were analyzed using the Bass diffusion model using the cumulative number of each year; these were then analyzed in terms of the technology growth cycle to examine the development stage of each technology until 2040. In addition, when the number of patents expected for each year reached the maximum value, the maturity period was analyzed, and the growth period and the maturity period were classified based on the maximum. In addition, the data were analyzed when the rate of patent production flattened or began to decline.

Bass Diffusion Model Parameter Estimation Method

The Bass diffusion model should estimate three parameters: potential market size m, innovation coefficient p, and imitation coefficient q. Methods for estimating parameters include initial data utilization, expert experience, and similar case application [31]. There are three methods for estimating parameters using the initial data.
First, there is an ordinary least squares approach using the parameter estimation method of the multiple regression equation [15]. Second, there is maximum likelihood estimation that establishes the likelihood function using the probability function of given data; this is used to estimate the parameter [31]. Third, there is a nonlinear least square (NLS) method—a multidimensional nonlinear parameter estimation method that minimizes the sum of squared errors between the difference between the estimated value and the measured value [34]. Of these, the NLS method is known to have the highest prediction accuracy [33]. Therefore, the NLS method was used in this study, and the innovation coefficient (p), imitation coefficient (q), and potential market (m) were estimated. The NLS analysis was carried out using R’s “nls” function.

5.5. Diffusion Analysis of AI Technology

5.5.1. Augmented Reality and Virtual Reality (AR/VR)

AR/VR technology is forecast to have 2899 cumulative patents by 2040; it likely matured in 2018 and will decline in 2027. In the “Top 10 Strategic Technology Trends For 2019” announced by Gartner, technology for immersive experiences has been selected as a core future technology for building next-generation digital business ecosystems. It is expected to create innovative services via integration with various industries. AR/VR technology is used for rehabilitation treatment in the medical field and monitoring and quality control in the manufacturing field. It is expected that AR/VR technology will be used in other fields such as education to create new added value. Figure 7 is the result of analyzing the spread trend of AR/VR technology.

5.5.2. Image Recognition

Image Recognition technology is expected to have 2814 cumulative patents by 2040; its maturity likely occurred in 2018, and a decline is expected in 2028. Image Recognition technology allows one to accurately distinguish and recognize the shape of things rather than people. This offers appropriate information and services to users.
These technologies will enable companies to innovate products and services. Given that all of the information we use is imageable, Image Recognition technology can likely be applied to most industries. Figure 8 is the result of analyzing the spread trend of image recognition technology.

5.5.3. Identification Technology

Identification Technology is estimated to have matured in 2016 with peak technological development in 2025. The number of cumulative patents in 2040 is estimated to be 2373. This certifies that individuals can use biometrics as an Identification Technology. Biometrics will be a key authentication means for information and communication technology (ICT) services.
Automatically identified results have reduced the hassle of processes, and users are provided with convenience and efficiency. These technologies will be used to detect personal security and risk situations such as airport search stations or to customize the personalized automation used in autonomous vehicles. Figure 9 is the result of analyzing the spread trend of identification technology.

6. Conclusions

This study analyzed three promising technologies from the perspective of technology growth cycles by applying the Bass model; these were summarized in Table 7. The technologies with the highest cumulative number of patents (market size) appeared as AR/VR, Image Recognition, and Identification Technology, in that order. The results suggest that Image Recognition will likely have the greatest development potential in the future.
This study can find meaning as an early piece of academic research exploring artificial intelligence technology using patents in the field of artificial intelligence. In addition, a quantitative analysis using patent data as a method of deriving promising technologies was conducted to present objective results.
In addition, while exploring promising technologies, we applied the Bass model to predict the maturity and decline stages through a detailed analysis of the technology growth cycle. We then suggested the development potential of each technology. The results can be used as basic data for R&D and product and service planning for each technology.

Research Limitations and Future Research

In this paper, USPTO patent data were collected and analyzed, but the data provided were limited and difficult to analyze. Therefore, it is necessary to collect and analyze patent data from other leading countries.

Author Contributions

Conceptualization, H.J.L. and H.O.; data curation, H.J.L. and H.O.; formal analysis, H.J.L. and H.O.; funding acquisition, H.J.L.; methodology, H.J.L. and H.O.; resources, H.J.L. and H.O.; Validation, H.J.L. and H.O.; Visualization, H.J.L. and H.O.; writing and editing, H.J.L. and H.O. The views and opinions expressed in this paper are those of the authors alone. All authors have read and agreed to the published version of the manuscript.

Funding

This work was supported by the Gyeonggi-do Regional Research Center (GRRC) program of Gyeonggi province.

Conflicts of Interest

The author declares no conflict of interest.

References

  1. Tractica. Artificial Intelligence for Enterprise Applications. Tractica. 2015. Available online: https://tractica.omdia.com/research/artificial-intelligence-for-enterprise-applications/ (accessed on 7 May 2020).
  2. Zha, X.; Chen, M. Study on early warning of competitive technical intelligence based on the patent map. J. Comput. 2010, 5, 274–281. [Google Scholar] [CrossRef]
  3. Campbell, R.S. Patent trends as a technological forecasting tool. World Pat. Inf. 1983, 5, 137–143. [Google Scholar] [CrossRef]
  4. Lee, S.; Yoon, B.; Park, Y. An approach to discovering technology opportunities: Keyword-based patent map approach. Technovation 2009, 29, 481–497. [Google Scholar] [CrossRef]
  5. Choi, J.; Kim, H.; Im, N. Keyword network analysis for technology forecasting. J. Intell. Inf. Syst. 2011, 17, 227–240. [Google Scholar] [CrossRef]
  6. Yoon, B.; Park, Y. Development of new technology forecasting algorithm: Hybrid approach for morphology analysis and conjoint analysis of patent information. IEEE Trans. Eng. Manag. 2007, 54, 588–599. [Google Scholar] [CrossRef]
  7. Von Wartburg, I.; Teichert, T.; Rost, K. Inventive progress measured by multi-stage patent citation analysis. Res. Policy 2005, 34, 1591–1607. [Google Scholar] [CrossRef] [Green Version]
  8. Tseng, Y.H.; Lin, C.J.; Lin, Y.I. Text mining techniques for patent analysis. Inf. Process. Manag. 2007, 43, 1216–1247. [Google Scholar] [CrossRef]
  9. Abbas, A.; Zhang, L.; Khan, S.U. A literature review on the state-of-the-art in patent analysis. World Pat. Inf. 2014, 37, 3–13. [Google Scholar] [CrossRef]
  10. Rogers, E.M. Diffusion of Innovations; Simon and Schuster: New York, NY, USA, 1962. [Google Scholar]
  11. Kim, D.H.; Part, S.S.; Shin, Y.G.; Jang, D.S. Forecasting the diffusion of technology using patent information: Focused on information security technology for network-centric warfare. J. Korea Contents Assoc. 2009, 9, 125–132. [Google Scholar] [CrossRef]
  12. Lee, D.U. Exploratory Research on the Analysis of National R&D Programs Using Growth Model; Korea Institute of S&T Evaluation and Planning: Chungcheongbuk-do, Korea, 2013. [Google Scholar]
  13. Liu, C.Y.; Wang, J.C. Forecasting the development of the biped robot walking technique in Japan through S-curve model analysis. Scientometrics 2010, 82, 21–36. [Google Scholar] [CrossRef]
  14. Gao, L.; Porter, A.L.; Wang, J.; Fang, S.; Zhang, X.; Ma, T.; Wang, W.; Huang, L. Technology life cycle analysis method based on patent documents. Technol. Forecast. Soc. Chang. 2013, 80, 398–407. [Google Scholar] [CrossRef]
  15. Norton, J.A.; Bass, F.M. A diffusion theory model of adoption and substitution for successive generations of high-technology products. Manag. Sci. 1987, 33, 1069–1086. [Google Scholar] [CrossRef] [Green Version]
  16. Bass, F.M. A new product growth for model consumer durables. Manag. Sci. 1969, 15, 215–227. [Google Scholar] [CrossRef]
  17. Park, D.; Chung, J.; Chung, Y.; Lee, D. Development of market growth pattern map based on growth model and self-organizing map algorithm: Focusing on ICT products. J. Intell. Inf. Syst. 2014, 20, 1–23. [Google Scholar] [CrossRef] [Green Version]
  18. Cho, Y.; Kim, E.A. Corporate strategy on technological convergence through analyzing patent networks and strategic indicators. J. Intellect. Prop. 2014, 9, 191–221. [Google Scholar] [CrossRef]
  19. Lee, W.; Park, Y.T.; Yoon, B.U.; Shin, J.; Choi, C.W.; Han, Y.J.; Kim, E.H. Analysis of Technology-Industry Linkage and Korean Firm’s Patent Strategy utilizing Information from Patent Database. Available online: http://www.stepi.re.kr/module/pubDownFile.jsp?categCd=A0201&ntNo=344&r= (accessed on 13 May 2020).
  20. Suzuki, K.; Sakata, J.; Hosoya, J. Innovation position: A quantitative analysis to evaluate the efficiency of research and development on the basis of patent data. In Proceedings of the 41st Annual Hawaii International Conference on System Sciences, Waikoloa, HI, USA, 7–10 January 2008. [Google Scholar]
  21. Jeong, B.G.; Kim, J.W.; Yoon, J.H. Patent-based competitive intelligence analysis of augmented reality technology: Application of topic modeling. In Proceedings of the Conference on Smart Industry and Future, Seoul, Korea, 7 November 2015; pp. 2265–2270. [Google Scholar]
  22. Curran, C.S.; Leker, J. Patent indicators for monitoring convergence–examples from NFF and ICT. Technol. Forecast. Soc. Chang. 2011, 78, 256–273. [Google Scholar] [CrossRef]
  23. Kim, H.; Park, H.; Lim, J.; Jung, C.; Kim, K. Function-property based causality network of patents for technology convergence. In Proceedings of the Conference on Overcoming the Global Economic Crisis, Ansan, Korea, 2 November 2012; pp. 1205–1219. [Google Scholar]
  24. Karvonen, M.; Lehtovaara, M.; Kässi, T. Build-up of understanding of technological convergence: Evidence from printed intelligence industry. Int. J. Innov. Technol. Manag. 2012, 9. [Google Scholar] [CrossRef]
  25. Jun, S. Technology forecasting using bayesian discrete model. J. Korean Inst. Intell. Syst. 2017, 27, 179–186. [Google Scholar] [CrossRef]
  26. Blei, D.M.L.; Ng, A.Y.; Jordan, M.I. Latent dirichlet allocation. J. Mach. Learn. Res. 2003, 3, 993–1022. Available online: http://www.jmlr.org/papers/v3/blei03a (accessed on 4 May 2020).
  27. Wang, B.; Liu, S.; Ding, K.; Liu, Z.; Xu, J. Identifying technological topics and institution-topic distribution probability for patent competitive intelligence analysis: A case study in LTE technology. Scientometrics 2014, 101, 685–704. [Google Scholar] [CrossRef]
  28. Blei, D.M. Probabilistic topic models. Commun. ACM 2012, 55, 77–84. [Google Scholar] [CrossRef] [Green Version]
  29. Hornik, K.; Grün, B. Topic models: An R package for fitting topic models. J. Stat. Softw. 2011, 40, 1–30. [Google Scholar] [CrossRef] [Green Version]
  30. Griffiths, T.L.; Steyvers, M. Finding scientific topics. Proc. Natl. Acad. Sci. USA 2004, 101, 5228–5235. [Google Scholar] [CrossRef] [Green Version]
  31. Kim, Y.; Jeong, K. Micro-segmentation strategy for big data analytics using a topic model. J Korean Off. Stat. 2016, 17–44. [Google Scholar]
  32. Chang, J.; Chang, M.J. Package ‘lda’. Available online: http://citeseerx.ist.psu.edu/viewdoc/download?doi=10.1.1.216.2273&rep=rep1&type=pdf (accessed on 4 May 2020).
  33. Kim, T.; Choi, H.; Lee, H. A study on the research trends in fintech using topic modeling. J. Korea Acad.-Ind. Coop. Soc. 2016, 17, 670–681. [Google Scholar] [CrossRef]
  34. Schmittlein, D.C.; Mahajan, V. Maximum likelihood estimation for an innovation diffusion model of new product acceptance. Mark. Sci. 1982, 1, 57–78. [Google Scholar] [CrossRef]
Figure 1. Technology lifecycle.
Sustainability 12 05609 g001
Figure 2. Research process.
Sustainability 12 05609 g002
Figure 3. Latent Dirichlet Allocation (LDA) processing. Note: whole documentation (D), each individual document (d), number of words (N), number of topics (K), determining the parameters (θ) that indicate which subject proportions the document will make up (α), Dirichlet distribution (β), topic ratio for document d (θd), topic assignment for the nth word in document d (Zd,n), and nth word observed in document d (Wd,n).
Sustainability 12 05609 g003
Figure 4. Analysis of cosine similarity value change with K value.
Sustainability 12 05609 g004
Figure 5. Promising (Hot) artificial intelligence technology.
Sustainability 12 05609 g005
Figure 6. Mature (Cold) artificial intelligence technology.
Sustainability 12 05609 g006
Figure 7. Augmented Reality (AR)/Virtual Reality (VR).
Sustainability 12 05609 g007
Figure 8. Image Recognition.
Sustainability 12 05609 g008
Figure 9. Identification Technology.
Sustainability 12 05609 g009
Table 1. USPTO artificial intelligence technology classification code.
Artificial Intelligence FieldTechnology CodeSub-Technology CodeMajor Technology
Problem inference and solution7061~11-Fuzzy logic hardware
-Multiple treatment system
-Specific user interface
Machine learning70612~25-Machine learning
Network structure70626~44-Adaptation system
-Neural network
Knowledge processing system70645~62-Knowledge processing system
-Knowledge expression and reasoning technology
-Rule-based reasoning system
AI application706900~934-Fuzzy logic
-AI application
Table 2. Number of patent applications for each year subject to analysis.
YearNumber of Patent ApplicationsYearNumber of Patent Applications
201010112015852
201111952016399
201212502017497
201314822018566
201415772019727
Table 3. Preprocessing standard of patent abstract.
CriteriaMethodExample
1TokenizationSeparate by keywordDistributed // management // with // embedded // agents // in // enterprise // apps // is // disclosed
2Lowercase conversionLowercase conversiondistributed // management // with // embedded // agents // in // enterprise // apps // is // disclosed
3Stop words removedEliminate stop words such as articles, investigations, and conjunctionsdistributed // management //   // embedded // agents //   // enterprise // apps //   // disclosed
4Stem extractionExtract words that are the root of keywords (remove -es, -s, -ed, etc.)distribute // management //    // embed // agent //   // enterprise // app //   // disclose
5Low-frequency removalRemove words used less than 10 timesdistribute // management //    // embed // agent //       //    // app //    // disclose
Table 4. Cosine similarity by number of topics.
KCosine SimilarityKCosine Similarity
50.031090.0296
60.0307100.0285
70.0296110.0276
80.0295
Table 5. Technology and core linked words by artificial intelligence field.
TopicArtificial Intelligence TechnologyCore Linked WordsCronbach’s Alpha Coefficient
Topic 1Action Recognitionuser, predict, content, event, recommend, behavior, item, interaction, service, social, model, action, web, profile, media0.6977
Topic 2Pattern Recognitionnode, graph, state, pattern, problem, network, constraint, tree, transit, variable, quantum, path, sequence, layer, match0.7188
Topic 3Augmented Reality (AR)/Virtual Reality (VR)image, video, reality, augment, optic, recognition, audio, scene, virtual, display, motion, garment, signal, individuality, content0.6258
Topic 4Image Recognitionimage, document, item, color, user, product, identification, object, device, person, capture, content, account, card, digit0.7244
Topic 5Vision AIprint, image, inform, code, locate, product, item, medic, device, tag, vehicle, transport, object, patient0.6081
Topic 6Machine Learning Platformstrain, feature, classification, vector, predict, model, set, cluster, value, data, sample, learn, class, probable, weight0.7931
Topic 7Natural Language Processingdocument, train, score, classification, feature, query, set, model, rank, predict, text, word, entity, page, search0.6571
Topic 8VLSIneuron, signal, card, magnet, neural, spike, circuit, emulation, payment, synapse, layer, pulse, stripe, input, reader0.7240
Topic 9Knowledge Representationrule, knowledge, service, semantic, policy, decision, ontology, set, engine, system, execution, manage, event, request, application0.6235
Topic 10Optimization and Solvingmodel, predict, parameter, solution, control, optimal, state, estimate, value, conditional, calculation, measure, behavior, learn, time0.6939
Topic 11Identification Technologydevice, image, wireless, authenticator, communication, tag, mobile, secure, access, reader, capture, RFID, card, object, biometric0.7231
Table 6. Technology and key link words by artificial intelligence (AI) field.
TopicNameCoefficientp-ValueDurbin–WatsonHot/Cold
Topic 1Action Recognition−0.006860.0480.945X
Topic 2Pattern Recognition−0.008670.0001.114Cold
Topic 3Augmented Reality (AR)/Virtual Reality (VR)0.012790.0021.343Hot
Topic 4Image Recognition0.021680.0011.071Hot
Topic 5Vision AI0.026150.0000.928X
Topic 6Machine Learning Platforms−0.014950.0011.006Cold
Topic 7Natural Language Processing−0.009530.0261.095Cold
Topic 8VLSI0.001240.3110.917X
Topic 9Knowledge Representation−0.019240.0001.543Cold
Topic 10Optimization and Solving−0.021090.0011.087Cold
Topic 11Identification Technology0.018480.0131.135Hot
Table 7. Technology lifecycle of promising technologies in artificial intelligence.
TopicPromising Technology in Artificial IntelligenceCumulative Number of Patents (Market Size)MaturityTechnology Limits (Decline)
Topic 3AR/VR289920182027
Topic 4Image Recognition281420182028
Topic 11Identification Technology237320162025

