Article

Sustainable Location Selection for Investing in Public–Private Partnership Infrastructure Projects: From a Developing Country’s Perspective

1
Department of Civil Engineering, Pukyong National University, Busan 48513, Korea
2
Department of Construction Management, Pukyong National University, Busan 48513, Korea
*
Author to whom correspondence should be addressed.
Sustainability 2020, 12(15), 5914; https://doi.org/10.3390/su12155914
Submission received: 22 June 2020 / Revised: 19 July 2020 / Accepted: 19 July 2020 / Published: 23 July 2020

Abstract

:
Location selection is one of the most important aspects of feasibility studies in all types of businesses and construction fields. However, poor project location selection is one of the leading causes of project failure, adversely affecting the cost, schedule, and other benefits of investors. This paper proposes an evaluation framework for selecting a sustainable location for investing in public–private partnership (PPP) infrastructure projects in Vietnam. Nine success criteria are identified via a literature review and expert judgments. Then, the fuzzy technique for order of preference by similarity to ideal solution (TOPSIS) method is applied to compute the success index and rank three alternatives: Southern (A1), Northern (A2), and Mekong Delta (A3) regions. Finally, a sensitivity analysis is conducted to examine the certainty and effectiveness of the model. The result indicates that alternative A1 is the best location for investing in the PPP form with a closeness coefficient (CCi) value of 0.555 and a sensitivity ratio of 11/13. This finding obtained using the proposed framework may be a helpful reference for practitioners and investors in selecting a sustainable location for PPP investment in Vietnam as well as other developing countries.

1. Introduction

Infrastructure development facilitates growth and stable macroeconomics in developing countries, where an effective business climate with positive macroeconomic and reasonable policy frameworks will attract more investment in infrastructure services [1]. Infrastructure investment played an important role in enhancing the economic market, however, it exerted huge pressure on the government’s budget. In addition, the public sector witnessed a lack of experience and expertise in developing infrastructure facilities [2]. To address these issues, public–private partnership (PPP) emerged as an effective procurement method for delivering infrastructure and public services. The PPP form is a participation of both public and private parties based on their expertise, with different levels of contribution and commitment in delivering public services [3]. The experience and knowledge of the private sector were exploited via PPP investment [4]. Since the 1990s, developing countries in regions such as Latin America, Africa, and Asia have begun to adopt PPPs to finance and develop local infrastructure projects and more than 6000 PPP projects have been invested in [5,6]. PPP projects have the following general characteristics: (1) A private sector provides the design, construction, financing, and operation of the infrastructure, in return for payments from the users of the infrastructure or the public client; (2) public and private sectors share risks and responsibilities during the project implementation process, and (3) PPP projects are usually based on a long-term contract and low life cycle costs [2]. PPP projects provide advantages to the public sector, such as reducing budget pressure, achieving social targets and productive efficiency [2,7]. For the private sector, it ensures proper returns to capital investment through a long-term contract and reliable service delivery [2]. Nevertheless, not all PPP projects are successful [8]. Many PPP projects have failed in many countries (e.g., Australia, Thailand, Malaysia, and the Netherlands), owing to improper risk-sharing, insufficient demand, and unreasonable repayment structures [8,9]. However, there is another cause that few studies have mentioned—project location selection. Poor project location selection is one of the leading causes of project failure, adversely affecting costs, schedules, and other benefits [10]. For example, an investor would like to invest in one of several potential locations. Then, the following question arises: Which place would be the best option for investment through the PPP model? Moreover, PPP projects might be affected by factors of each location, such as population, living standard, culture, demand for service, and local policy. Hence, evaluating and selecting the project location is extremely important for overcoming unexpected obstacles and resolving any potential risks that may arise during the execution and operation. Nevertheless, it is difficult to be successful without consideration of the project location. Over the last two decades, many researchers have focused on several topics of the PPP model, such as risk management, critical success factors, value for money, economic feasibility, government role, and concessionaire selection [11]. However, attention in selecting the location of PPP implementation is scarce, especially from the perspective of developing countries. To address this gap, the present paper aims to propose an evaluation framework for selecting a sustainable location for PPP investment in Vietnam, by evaluating the success index. First, the success criteria are identified through a literature review and expert opinion. Second, based on the selected criteria, the fuzzy technique for order of preference by similarity to ideal solution (TOPSIS) method is applied to define the success level of each project location. Along with the sensitivity analysis, the most reasonable location is chosen for investing PPP projects successfully and achieving sustainable development in infrastructure construction [12]. The rest of this paper is organized as follows. Section 2 describes the perception of project location selection and success criteria in PPP projects. Section 3 presents the research methodology. Section 4 explains a numerical example of fuzzy TOPSIS and a sensitivity analysis for measuring and selecting a sustainable location for PPP investment in Vietnam. Section 5 presents the conclusions and recommendations for future research.

2. Literature Review

2.1. Public–Private Partnership (PPP) Context in Vietnam

The huge demand for infrastructure services has created a major challenge in improving the economic market in Vietnam [13]. According to the PPP Knowledge Lab [14], since 1990, an estimated $18.5 billion has been invested in maintaining infrastructure systems, such as roads, bridges, ports, water treatment, and power. However, the Vietnamese government cannot cover enough money through state budgets or official development assistance loans. Thus, the PPP model has been proposed as an alternative for infrastructure development.
Although Vietnam has great potential for PPP development, there remain significant difficulties in attracting investors’ participation, such as the lack of a clear policy framework, financial feasibility of the project, unstable financial structure, improper risk-sharing, and the ability of the public sector [13]. Indeed, many investors are seeking new opportunities for PPP projects in Vietnam, but they only participate in these projects when they find a stable investment environment that meets their expectations through commitments from the Vietnamese government. Despite publishing the Guideline of PPP Investment in 2018, PPP procurement remains in the initial stage of development in Vietnam. Notwithstanding, it is expected to be one of the keys to meet the nation’s infrastructure demand. Table 1 presents the prioritized PPP infrastructure projects in Vietnam during 2016–2020 [15].

2.2. Perception of Project Location Selection

Location selection is one of the most important aspects in all types of businesses, such as service, manufacturing, and construction [16,17]. Identifying a suitable location should be considered in the assessment and analysis of several factors [17]. The investor needs to answer two basic questions before making the decision about project investment location as:
Where is the best location for investing in the project?
Which successful opportunities are expected to be generated when the project is implemented in that location?
In the business and manufacturing field, Onut et al. [16] combined fuzzy analytical hierarchy process (AHP) and fuzzy TOPSIS to select a potential location for a shopping center in Istanbul. Finally, Kozyatagi was selected as the best place. Athawale et al. [18] expressed that facility location selection significantly affected the performance of manufacturing and service delivery. Changing the location of the existing facility may lead to increasing or minimizing the total cost over a defined time. The authors used the preference ranking organization method for enrichment evaluation (PROMETHEE) II method to address this problem by analyzing two real-time case studies.
In the transportation sector, Awasthi et al. [19] proposed a model for identifying a suitable location for urban planning by meeting evaluation criteria such as accessibility, security, connectivity to multimodal transport, costs, environmental impact, proximity to customers, proximity to suppliers, resource availability, conformance to sustainable freight regulations, possibility of expansion, and quality of services. Sennaroglu and Celebi [20] integrated AHP with PROMETHEE and Vise Kriterijumska Optimizacija I Kompromisno Resenje (VIKOR) methods to select a reasonable location for a military airport in Turkey according to the following nine principle criteria: Military criteria, expansion potential, cost, environment and social effects, climate conditions, infrastructure facilities, land, geographical characteristics, and needs.
In supply chain management, Rao et al. [21] ranked and selected the best location for constructing a city logistic center based on economic, environmental, and social criteria, whereby the city logistic center can be located in the city, near the highway and the consignees.
In the construction industry, Mulholland and Christian [22] noticed that poor location planning resulted in unsuccessful construction projects. Bian [23] identified six key factors for selecting the best location for dry port construction projects in China: Transportation, economic level, infrastructure facilities, trade level, political environment, and cost. Seven alternatives were proposed, including Zhengzhou, Xian, Kaifeng, Lanzhou, Xuzhou, Xinyi, and Yinchuan. The analysis result indicated Zhengzhou and Xian as the best locations for constructing a dry port. From the results of the feasibility study conducted in the planning stage, Zhao and Lee [24] stated that the location selection of the rock cavern project in Singapore needed to rely on the rock structure. In addition, the location selection of caverns must consider the geologic, social-economic, environmental, surface development, and political factors. Meanwhile, Rezaeiniya et al. [17] emphasized that the location selection of greenhouse projects played the most important role in investors’ success. They applied the analytical network process (ANP) model based on seven criteria: Government, labor, physical condition, environment condition, raw material, special condition, and type of greenhouse, for selecting the best greenhouse location in Iran with five alternatives: Amol, Sari, Mahmoodabad, Ramsar, and Chaloos. Cheng and Li [25] applied quantitative methods for location selection in a construction project, including a data envelopment analysis model and a binary integer linear program model.
Considering the above literature review, we identified that selecting a suitable location is crucial for a successful investment in the private sector. Location selection has important strategic implications because a location decision normally will involve a long-term commitment of resources and be irreversible in nature [26]. Specifically, the location choice may have a significant impact on investment objectives. Therefore, reasonable location selection contributes to the success in project execution and operation.
This problem has been studied in various fields, such as manufacturing, business service delivery, supply chain, urban planning, and construction. However, it has received limited attention in the PPP area. Only a few articles have mentioned location selection in PPP projects, although project location strongly impacts the outcome in the construction and operation stages of a project. Thus, the present study may bridge this gap with a model of sustainable location selection for successfully investing PPP projects.

2.3. Criteria of Sustainable Location Selection

Sustainability is a modern paradigm that considers the balance among the economic, social, and environmental effects of investment [27]. So far, several definitions of sustainability and sustainable development have been proposed, but most of them agree that the concept aims to satisfy social, environmental, and economic goals [28]. Therefore, the criteria for sustainable location selection need to be considered in the sustainable objectives of the project. Although different criteria have been proposed for project location selection in previous studies, there is no clear framework that simultaneously considers the financial, non-financial, and sustainable criteria in a unique standard [26]. Moreover, PPP projects are different from other conventional projects in nature [29]. To select a sustainable location for investing in the PPP model, it is necessary to satisfy the general criteria of project success in the construction industry [30].
An extensive literature review in both construction and PPP projects has been undertaken to select suitable criteria for the evaluation model. A successful project should adhere to specific criteria to achieve the desired outcomes [31]. Moreover, if success criteria are not considered, it will be difficult for investors to define whether their projects have been successful [32]. Lim and Mohamed [33] argued that the criterion is a standard or principle for value measurement. In the last decade, several studies have identified success criteria for construction projects. According to the traditional approach, a successful project needs to meet the “iron triangle,” namely, time, cost, and quality [34]. Over time, researchers have debated on the limitations of the traditional method in evaluating the success of construction projects by constructing new success criteria [35]. Baccarini [36] separated project success into two aspects: Project management success and product success. The project management success encompassed three criteria: Meeting the project’s output (time, cost, and quality), quality of the project management process, and stakeholder satisfaction. In contrast, product success comprised meeting the owners’ strategic objectives, users’ satisfaction, and stakeholders’ satisfaction. Chan et al. [37] proposed a new framework for success in a design/build project at the pre-construction, construction, and post-construction stages. Here, the success criteria were divided into two dimensions: Objective factors, including time, cost, safety, and profitability; and subjective factors, including quality, technical performance, functionality, productivity, satisfaction, and environmental sustainability. Lim and Mohamed [33] observed the construction project’s success using macro-criteria and micro-criteria. The macro-criteria included completion in time, satisfaction, utility, and operation while the micro-criteria encompassed completion in time, cost, quality, performance, and safety. From this viewpoint, establishing a set of success criteria is necessary for practitioners and researchers to measure success in construction projects [38].
From the participants’ perspective, the nature of PPP is complex because of the huge investment and long-term contractual periods [39]. Therefore, many authors have sought various ways for meeting criteria that are considered as objectives to gain success in PPP projects. Tam [40] denoted completion in time and budget, service quality, well-structured agreement, and the equitable legal system as the important components for the build–operate–transfer (BOT) project’s success in Southeast Asia, through case studies in Hong Kong. Akintoye et al. [3] indicated a difference in success criteria between PPP and traditional projects. Yuan et al. [41] analyzed 15 successful objectives in PPP projects based on the opinions of different stakeholders, whereby project quality, reliability service, and budget completion were ranked the top three performance objectives in PPP projects. Similarly, Abdul-Aziz and Kassim [42] identified 17 success objectives for the housing PPP model in Malaysia, including five highly important objectives and 12 important objectives. Mladenovic et al. [43] established two layers for the performance evaluation of PPP transportation projects, based on a brainstorming approach. They revealed that the PPP project success should be defined in the accomplishment of the ultimate objectives of different stakeholders in the first stage, including profitability, stakeholders’ satisfaction, value for money, effectiveness, environmental influence, and level of service. The fulfilment of the performance objectives of each stakeholder would be examined in the second stage, to assess whether the project was successful. Villalba-Romero and Liyanage [44] proposed 29 performance measures and nine key performance indicators to define the success level of 13 road projects in the United Kingdom (UK), Spain, Belgium, Portugal, the Netherlands, and Greece. In another review, from the judgments of international experts in Hong Kong and Ghana, Osei-Kyei and Chan [32] collected 15 critical success criteria for PPP projects, of which seven were considered critical, including meeting standard output, adherence to budget, adherence to time, profitability, effective risk management, service quality, and environmental performance.
Through a literature review, the nine selected criteria are presented in Table 2.

3. Research Methodology

3.1. Muti-Criteria Decision Making and Fuzzy Set Theory

Multi-criteria decision making (MCDM) was widely applied in many fields, such as economics, social science, construction, etc. [45]. MCDM involves making decisions with multiple criteria (usually being in contradiction) and multiple objectives in an uncertain environment [46,47]. Due to the uncertainty, the outcome of implementing a decision can become undesired. In recent years, both researchers and practitioners have begun to show interest in dealing with multiple criteria and the related uncertainty simultaneously. The problems can be solved efficiently relying on the available data and expert knowledge of the decision maker [47].
Sustainable location selection is a MCDM process because it needs to satisfy numerous criteria under uncertain and complex conditions of consideration. Hence, the fuzzy set theory (FST) has been exploited for modeling decision-making problems in the context of uncertainty, which relies on an imprecise and ambiguous judgment of decision-makers [19,48,49].
The FST was first introduced by Bellman and Zadeh [50], where decisions relied on the evaluation of multiple quantitative and qualitative criteria performed by multiple decision-makers [48]. The results obtained from previous studies indicated that FST is an effective decision-making tool based on expert judgment and the weights of the criteria [45,51]. The basic definitions of fuzzy set theory are presented in Appendix A.1.

3.2. Fuzzy TOPSIS

Various MCDM methods have been used to solve the multi-criteria problem [48], such as fuzzy TOPSIS, fuzzy AHP, fuzzy ANP, fuzzy decision-making trial and evaluation laboratory (DEMATEL). Thus, choosing a reasonable method played a crucial role in the decision-making process [52]. In this study, the fuzzy TOPSIS method was used in the location selection process. Fuzzy TOPSIS is an extension of the TOPSIS method for solving MCDM issues in a fuzzy environment [53]. It has the following strengths: (1) There is no limit to the number of criteria even if they are positive or negative criteria as well as qualitative or quantitative criteria [54]; (2) it creates a consistent preference order for alternatives and criteria [48]; (3) it exhibits good ability and support for the decision-makers [48]; (4) it requires fewer judgments as compared to other methods (e.g., fuzzy AHP, fuzzy DEMATEL, and fuzzy ANP) [48], and (5) similar to other models, fuzzy TOPSIS efficiently computes in an uncertain environment [53]. Thus, several previous studies have introduced fuzzy TOPSIS for selecting the project location in many fields. For instance, Awasthi et al. [55] proposed a fuzzy TOPSIS approach to select a sustainable transportation system in infrastructure development in La Rochelle, France. Beskese et al. [56] presented a fuzzy TOPSIS model to select a possible landfill location for assuring urbanization for Turkey. Onut et al. [16] applied fuzzy TOPSIS to select a potential location for a shopping center in Istanbul. Awasthi et al. [19] proposed the model for identifying a suitable location for urban planning. Therefore, the fuzzy TOPSIS method is considered suitable for this study. Its implementation process is presented in Figure 1.
The process of fuzzy TOPSIS is described in Appendix A.2.

4. Numerical Example of Fuzzy Technique for Order of Preference by Similarity to Ideal Solution (TOPSIS) Application

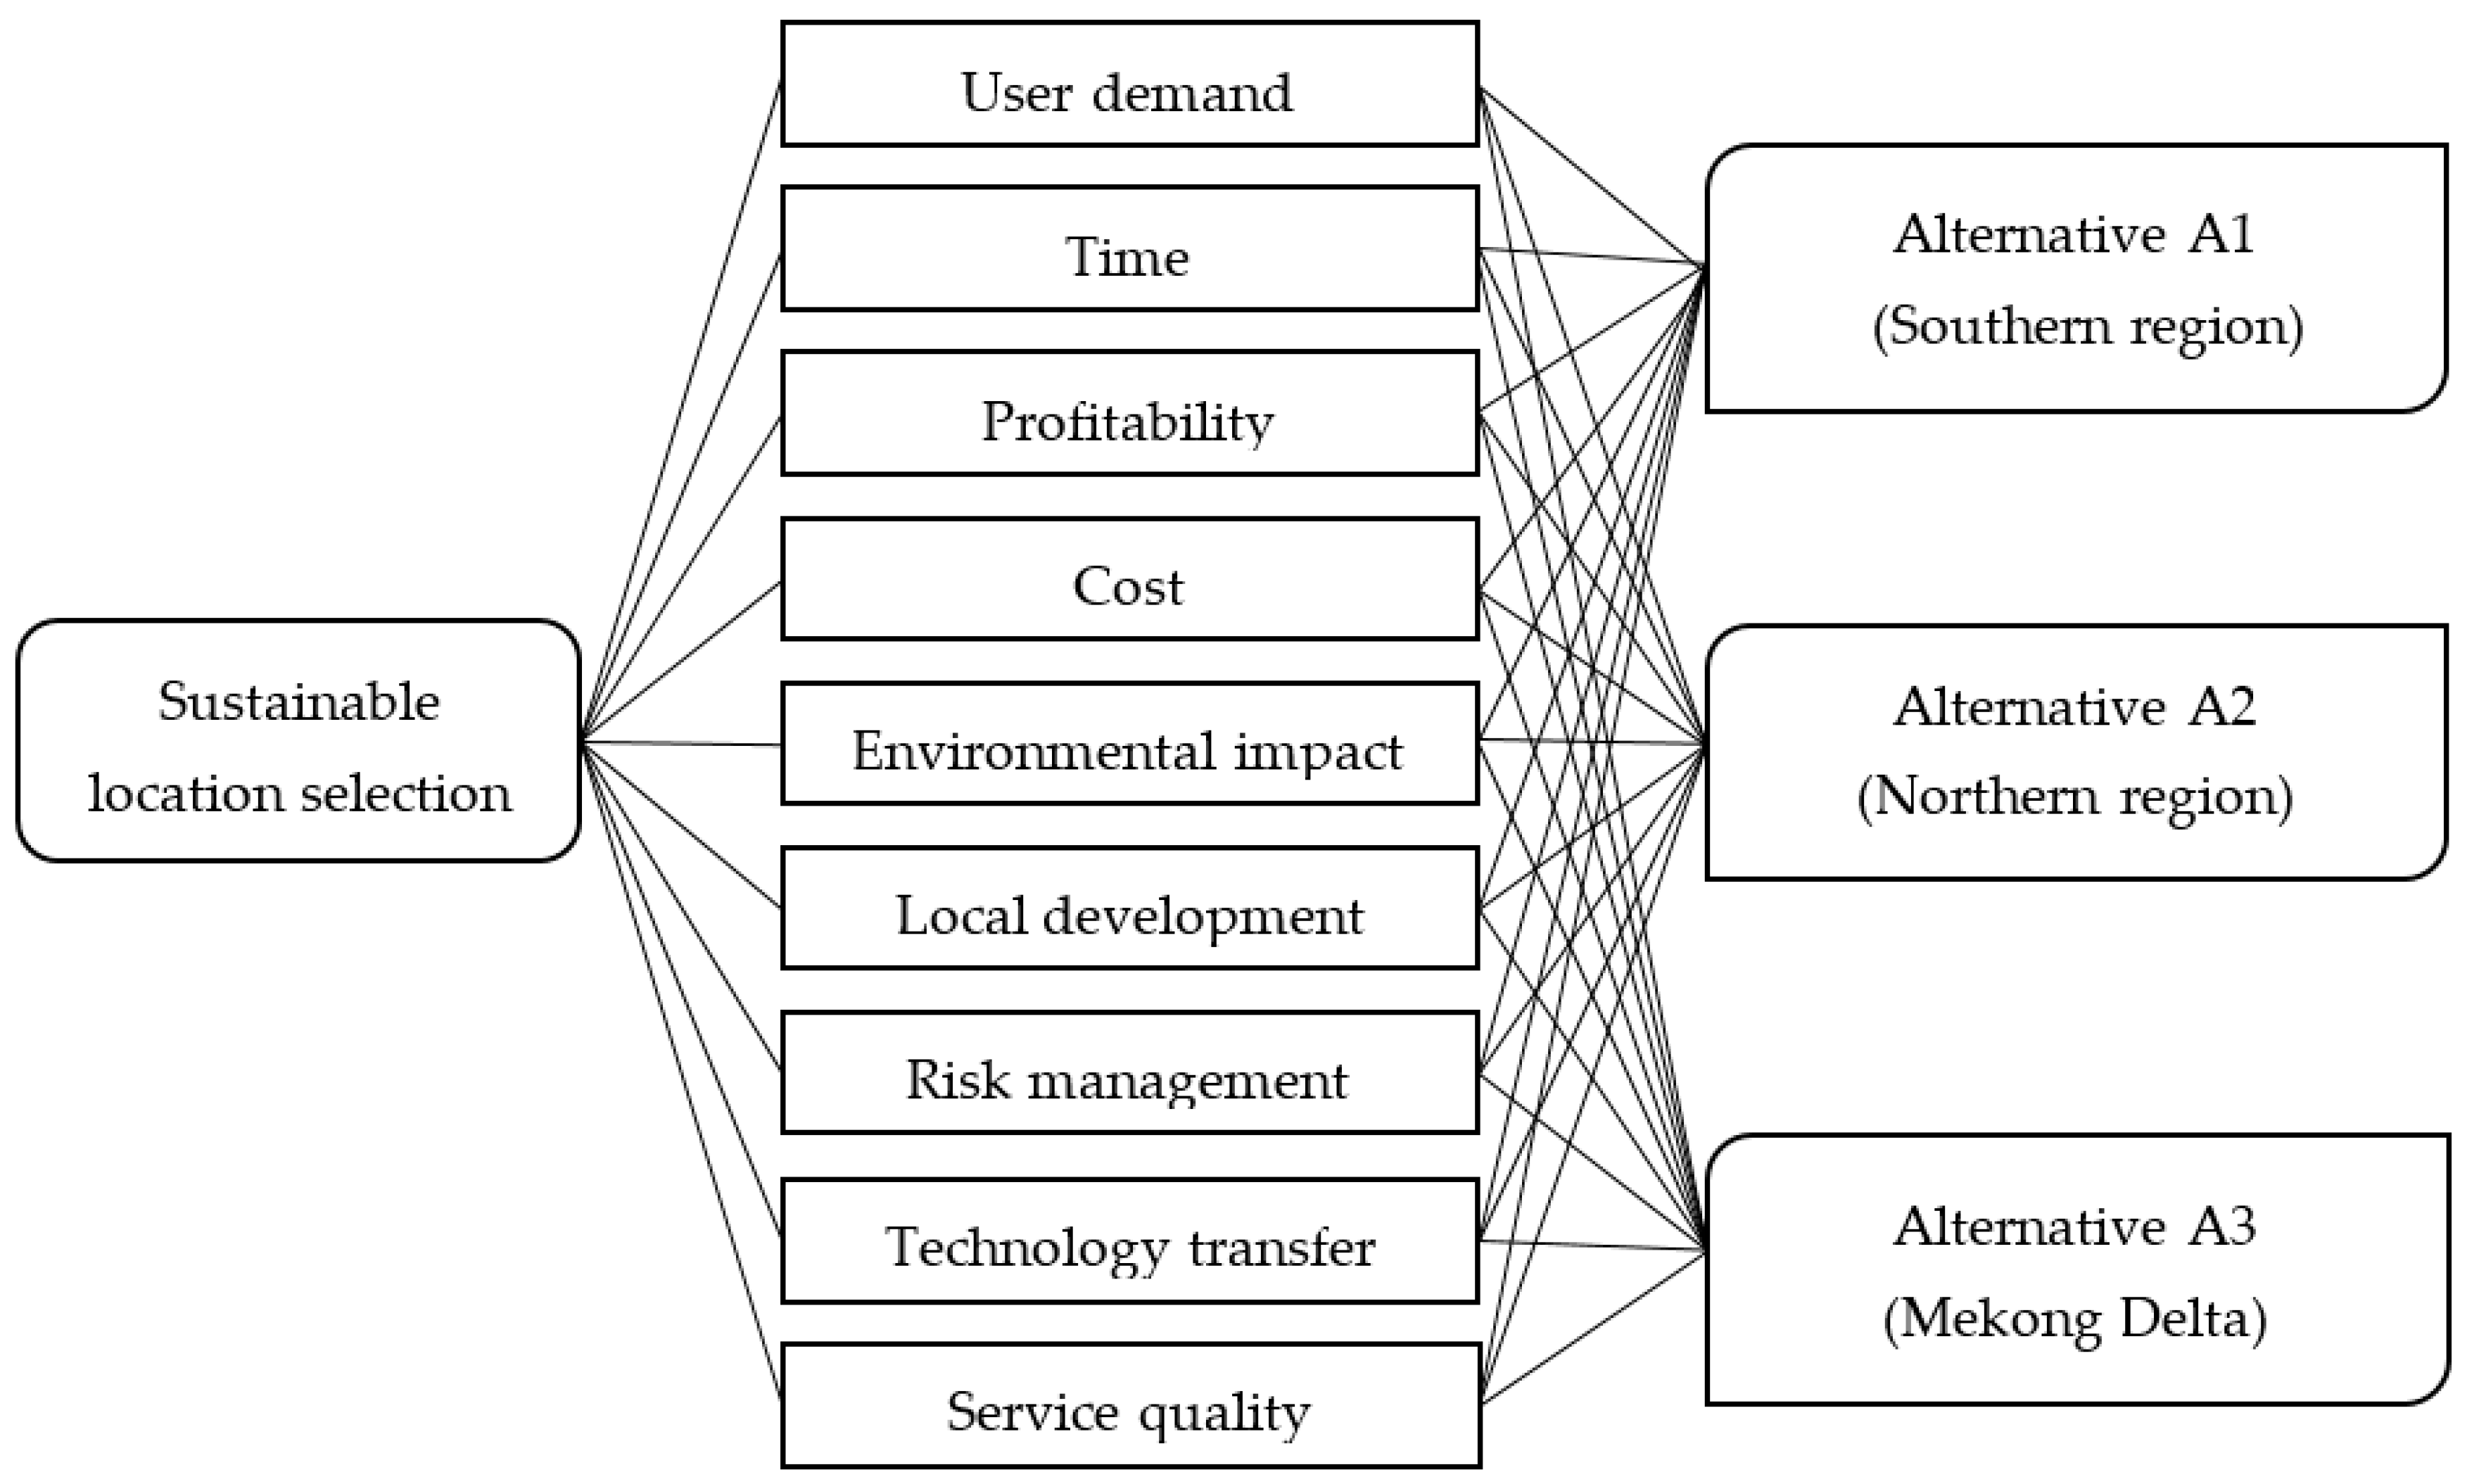
4.1. Identification of Success Criteria

To ensure the adequacy of this research, the obtained criteria in Table 2 were interviewed with a group of four experts with more than 10 years of experience in PPP projects. One expert was from the Ministry of Construction and three professionals worked for private investors in Vietnam. Each expert was asked to examine the suitability of the criteria for sustainable location selection based on their experience. The pilot test in round 1 was completed for two weeks. Finally, nine success criteria were adopted with high consensus and no additional criteria were suggested to be added to the list, where, C3 and C4 belong to the cost criteria (C) and the remaining criteria belong to the benefit criteria (B) (see Table 3). This classification of these criteria is adopted for reasonable computing at the further steps in the fuzzy TOPSIS method [53,55].

4.2. Selection of Alternatives

Let us assume that an investor intends to exploit the PPP market in Vietnam, where they are encouraged to participate in PPP projects for developing local infrastructure in three key strategic regions: Southern region, Northern region, and Mekong Delta. These regions had rapid economic growth; nevertheless, there is a huge shortage of infrastructure services for satisfying people’s needs. In addition, the population, culture, environmental conditions, and transportation demand in each area have different characteristics. To ensure effective investment, therefore, they need to carefully consider which region is suitable for investing. In such a case, Figure 2 shows the hierarchy structure of the MCDM problem considered in the present study.

4.3. Measuring the Success Index of PPP Projects

A group of four decision makers (E1, E2, E3, and E4) was established to examine the success index of PPP projects for the best reasonable region selection. In the assessment process, they utilized the linguistic variables in Table A1 and Table A2 to directly rate the important weight (w) of nine success criteria and three alternatives, i.e., Southern region (A1), Northern region (A2), and Mekong Delta (A3). In this round, a questionnaire survey was carried out to evaluate the success index regarding location selection for PPP investment. Each professional of round 1 received a cover letter and survey content. The cover letter explained the purpose of the study and ensured the confidentiality of the answers given by decision-makers. Four professionals were asked to (1) rate the importance of nine criteria via the linguistic variable in Table A1, and (2) judge success level of alternatives with respect to each criterion through the linguistic variable in Table A2. The questionnaire was sent to the respondents via email and telephone for one month. This result is presented in Table 4.
The fuzzy attribute weightings and the fuzzy decision matrix can be transformed from the linguistic variables into triangular fuzzy numbers according to Table A1 and Table A2. Then, the aggregated fuzzy weights of each criterion and ratings of alternatives are calculated using Equations (A9) and (A10). The results are shown in Table A3 and Table A4 (Appendix A.3).
Continuously, we compute the normalized fuzzy decision matrix for alternatives using Equation (A13). For example, the normalized decision matrix of criteria C2 (time) in A1 is calculated as:
c 2 * = max i ( 9.38 ,   6.88   7.50 )   =   9.38 ; ( C 2   is   a   benefit   criterion )
r ˜ 12 = ( 4.38 9.38 , 6.88 9.38 , 9.38 9.38 ) =   ( 0.47 ,   0.73 ,   1.00 ) ;
The normalized matrix of C3 (profitability) in A1 is given by:
c 3 * = min i ( 5.00 ,   3.75 ,   5.00 ) = 3.75 ;   ( C 3   is   a   cos t   criterion )
r ˜ 13 = ( 3.75 10.0 , 3.75 7.50 , 3.75 5.00 ) =   ( 0.38 ,   0.50 ,   0.75 )
Similarly, the normalized decision matrix for the remaining criteria is evaluated in Table A5 (Appendix A.3).
Then, the weighted normalized matrix for three alternatives is computed using Equation (A14), where r ˜ i j is given in Table A5 and w ˜ j is given in Table A3. For example, the fuzzy weight of criterion C2 in A1 is defined as:
v ˜ 12 = ( 0.47 ,   0.73 ,   1.00 )   ×   ( 0.63 ,   0.88 ,   1.00 ) = ( 0.292 ,   0.642 ,   1.00 )
Likewise, the remaining values are computed and shown in Table A6 (Appendix A.3).
The distances of each alternative from the fuzzy positive ideal solution (FPIS) and fuzzy negative ideal solution (FNIS) are then calculated using Equations (A17), (A18) and (A19), with A+ = (1, 1, 1) and A = (0, 0, 0) according to Equations (A15) and (A16). Taking C2 in alternative A1 as an example, d v ( A 1 , A + ) and d v ( A 1 , A ) are evaluated as follows:
d v ( A 1 , A + ) = 1 3 [ ( 0.292     1 ) 2 + ( 0.642 1 ) 2 + ( 1.00     1 ) 2 ]   = 0.458
d v ( A 1 , A ) = 1 3 [ ( 0.292     0 ) 2 + ( 0.642     0 ) 2 + ( 1.00     0 ) 2 ]   = 0.706
d i + ( A 1 ) = 0.351 + 0.458 + + 0.515 = 4.553
d i ( A 1 ) = 0.783 + 0.706 + + 0.642 = 5.669
The remaining criteria are similarly computed for three alternatives, and the results are presented in Table A7 (Appendix A.3).
Finally, based on Equation (A20), the success indicator is ranked by the closeness coefficient CCi. For example, the success index of alternative A1 is evaluated as:
C C i ( A 1 ) = 5.669 4.553 + 5.669 = 0.555
Two remaining alternatives are similarly computed and presented in Table A8 (Appendix A.3).
Table A8 clearly shows A1 > A2 > A3, meaning that the Southern region is the most sustainable location for providing service by the PPP model, with a success index of 0.555. It is the top-motive economic region, which is the center of high-quality economic, commerce, culture, and training human resources in Vietnam [57]. At the same time, it is the leading area of science and technology transfer and application of the whole country, acting as a bridge to the Mekong Delta, Northern region, and Central Highlands region [58]. In addition, the living standard in this region is higher than in other regions [59]. Therefore, the demand for infrastructure service development is huge. With high-quality resources, PPP projects will be implemented with high performance, such as reduced time and cost of the project during the construction and operation processes. In addition, the technology method might be improved, which encourages investors to improve the quality of service for providing infrastructure facilities. The following ranking is that of the Northern region, with a success index of 0.523. So far, the business investment environment in this region has clearly been improved, and the transportation infrastructure is modern and synchronous [60]. By attracting huge resources and improving people’s income, it will encourage investors to participate in many fields under the PPP form. The Mekong Delta area is ranked the lowest, with an index of 0.493. It is a large agricultural and fishery region in Vietnam, with potential for water, fishery resources, agricultural production, and waterway transportation [61]. This region has many opportunities for sustainable economic-social development, as it is well-connected to the transportation network of other locations throughout the nation. However, so far, the problems of human resources and climate change have proved highly challenging for developing infrastructure and economy in this region.

4.4. Sensitivity Analysis

Sensitivity analysis may answer the question of whether small changes in the specific weights impact the final decision. This question can be answered by slightly varying the weights of the success criteria and observing the effects on the decision. This is useful in situations where uncertainties exist in the definition of the importance of different factors. In such cases, a sensitivity analysis will be conducted to determine the importance of success criteria weights in selecting the best region for PPP investment.
Thirteen assumptions were proposed to examine the sensitive results in ranking alternatives, which are detailed in Table A9 (Appendix A.4) and Figure 3.
From Table A9 and Figure 3, there is an insignificant variation in the ranking (A2 > A1 > A3) as the weights of the success criteria are changed under assumptions 7 and 8. Notwithstanding, alternative A1 is still considered the best choice with 11 over 13 assumptions. Therefore, the South region is the most sustainable location for investing in the PPP model.

5. Conclusions

This paper proposed a framework for selecting a sustainable location for PPP projects in Vietnam. Nine success criteria were identified via a comprehensive review and expert opinions, including user demand, time, profitability, cost, environmental impact, local development, risk management, technology transfer, and service quality. The fuzzy TOPSIS method was utilized to evaluate the success index and ranked three alternatives based on CCi value. Finally, a sensitivity analysis was conducted to examine the certainty of the model and select the most suitable location for PPP investment.
In practice, sustainable location selection is more complex. It requires top managers to use their experience for the final decision. With preferable tax policies along with improving the legal framework of the Vietnamese government, private investors have more opportunities for providing local infrastructure services through PPP procurement and maintaining their business. However, there is a need for an evaluation method to assist them in making a good decision. The result of this study indicated the suitability of fuzzy TOPSIS method in project location selection for PPP investment in Vietnam as well as other developing countries. Besides, to attract more investors in local infrastructure development via PPP implementation, the study recommends as follows:
  • Carefully assessing the project feasibility before calling the investment.
  • Maintaining tax preferential policies for PPP projects.
  • Completing the legal framework of the PPP model.
  • Ensuring the stability of the financial structure.
  • Reasonably allocating risks between the public and private sectors.
The contribution of this study is significant. First, the findings provide the Vietnamese government with valuable knowledge about the identification and classification of PPP project locations. Second, it provides a helpful reference for practitioners and investors in selecting a sustainable location for PPP investment. In addition, this study enriches the studies on the MCDM problem in the PPP model. With the above contributions, this paper might provide readers with more knowledge regarding location selection for PPP infrastructure projects as few studies have mentioned this topic. Thus, it can be the basic foundation for further research.
This paper also has limitations. Because the PPP model remains in the initial stage of development in Vietnam, criteria identification cannot be perfect. In addition, only four experts were interviewed for the evaluation framework—they might not fully represent the actual conditions. In the future, this method can be proposed for selecting the PPP project location in a specific sector (e.g., transport, water supply, wastewater treatment, and energy) with a higher sample size of decision-makers.

Author Contributions

Conceptualization, S.-Y.K. and L.D.T.; methodology, L.D.T.; formal analysis, L.D.T.; investigation, L.D.T.; data curation, L.D.T.; writing—original draft preparation, L.D.T.; writing—review and editing, S.-Y.K.; supervision, S.-Y.K. All authors have read and agreed to the published version of the manuscript.

Funding

This research was funded by a Research Grant of Pukyong National University (2019).

Acknowledgments

This study would like to thank experts of the Ministry of Construction in Vietnam, and private investors who have contributed their opinions in accomplishing the data in this research.

Conflicts of Interest

The authors declare no conflict of interest.

Appendix A. Fuzzy Set Theory and Fuzzy TOPSIS

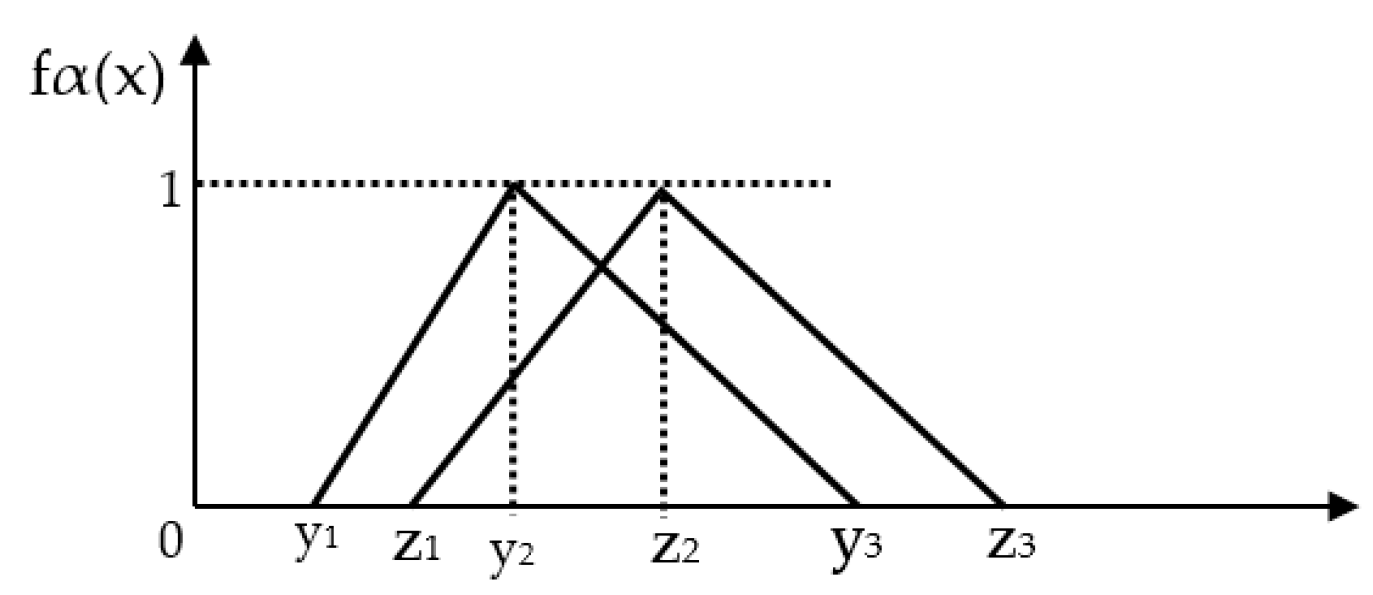
Appendix A.1. Fuzzy Set Theory

The basic definitions of fuzzy set theory are presented as follows [19,45,49,62]:
Concept 1. A fuzzy number α belonging to R is described by the membership function fα(x) which is defined as the membership score of x in α: α = {(x, fα(x))| x∈ R: R→ [0,1]}.
Concept 2. A triangular fuzzy number α = (x1, x2, x3) is established (see Figure A1). Then, the membership function of α is determined as:
f α ( x ) = { 0 ,   x     x 1 x   -   x 1 x 2 - x 1 ,   x 1     x     x 2 x 3   -   x x 3   -   x 2 , x 2     x     x 3 0 ,   x   >   x 3  
where x1, x2, and x3 represent the left, mean, and right-bound real values in a triangular fuzzy number, respectively, x1 < x2 < x3. The value of x at x2 provides the maximal grade of fα(x), i.e., fα(x) = 1; it is the most probable value of the evaluation data. The value of x at x1 gives the minimal grade of fα(x), i.e., fα(x) = 0; it is the least probable value of the evaluation data. Constants x1 and x3 are the lower and upper bounds of the available area for the evaluation data. These constants reflect the fuzziness of the evaluation data [63]. The narrower the interval [x1, x3], the lower is the fuzziness of the evaluation data.
Concept 3. Let y ˜ = ( y 1 , y 2 , y 3 ) and z ˜ = ( z 1 , z 2 , z 3 ) be two triangular fuzzy numbers (see Figure A2). The basic operators for triangular fuzzy numbers are as follows:
z ˜ y ˜ = ( z 1 y 1 , z 2 y 2 , z 3 y 3 ) ; y 1 0 , z 1 0
y ˜ + z ˜ = ( y 1 + z 1 , y 2 + z 2 , y 3 + z 3 ) ; y 1 0 , z 1 0
y ˜ × z ˜ = ( y 1 z 1 , y 2 z 2 , y 3 z 3 ) ; y 1 0 , z 1 0
y ˜ / z ˜ = ( y 1 z 1 , y 2 z 2 , y 3 z 3 ) ; y 1 0 , z 1 0
y ˜ 1 = ( 1 y 1 , 1 y 2 , 1 y 3 ) ; y 1 0 , z 1 0
β y ˜ = ( β y 1 β y 2 β y 3 ) ; y 1 0 , β > 0 ; β R
y ˜ β = ( y 1 β , y 2 β , y 3 β ) ; y 1 0 , β > 0 ; β R
Figure A1. A triangular fuzzy number.
Sustainability 12 05914 g0a1
Figure A2. Two triangular fuzzy numbers.
Sustainability 12 05914 g0a2

Appendix A.2. Fuzzy TOPSIS

The process of fuzzy TOPSIS is described as follows [51,54,64]:
Step 1: Let us assume a group of decision makers with k experts. Each expert will assess the weight of criterion Cj (j = 1, 2,..., m) and ratings of alternatives Ai (i = 1, 2,..., n) by using linguistic variables in Table 3; Table 4.
Table A1. Linguistic variable for the weight of the criteria.
Linguistic VariableFuzzy Numbers
Low importance (LI)(0.00, 0.00, 0.25)
Relatively importance (RI)(0.00, 0.25, 0.50)
Important (I)(0.25, 0.50, 0.75)
Very important (VI)(0.50, 0.75, 1.00)
Extremely important (EI)(0.75, 1.00, 1.00)
Table A2. Linguistic variable for the rating of the alternatives.
Linguistic VariableFuzzy Numbers
Very poor (VP)(0.0, 0.0, 2.5)
Poor (P)(0.0, 2.5, 5.0)
Medium (M)(2.5, 5.0, 7.5)
Good (G)(5.0, 7.5, 10.0)
Very good (VG)(7.5, 10.0, 10.0)
Step 2: Construct the aggregated fuzzy ratings for the criteria and alternatives, which are defined as follows:
w ˜ j = 1 k [ w ˜ j 1 + w ˜ j 2 + + w ˜ j k ]
x ˜ i j = 1 k [ x ˜ i j 1 + x ˜ i j 2 + + x ˜ i j k ]
where, w ˜ j k is the weight of the jth criterion and x ˜ i j k is the aggregated fuzzy rating x ˜ i j k = ( a i j k , b i j k , c i j k ) of the i th   criteria within each alternative.
Step 3: Construct a fuzzy decision matrix of the alternatives ( A ) and the criteria ( W ), which are presented as follows:
A = A 1 A n C 1 C m [ x 11 x 1 n x m 1 x m n ]
W ˜ = w ˜ 1 , w ˜ 2 , , w ˜ m
Step 4: Establish a normalized fuzzy decision matrix for alternatives, which can be given as follows:
R ˜ = [ r ˜ i j ] m × n
where:
r ˜ i j = ( a i j c j , b i j c j , c i j c j ) , c j = m a x i   c i j ( If   j th   criterion   is   a   benefit   one )
r ˜ i j = ( a j c i j , a j b i j , a j a i j ) , a j = m i n i   a i j ; ( If j th   criterion   is   a   cos t   one )
Step 5: Install the weighted normalized matrix as:
V ˜ = [ v ˜ i j ] m × n
where v ˜ i j = r ˜ i j × w ˜ j .
Step 6: Calculate fuzzy positive ideal solution (FPIS) and fuzzy negative ideal solution (FNIS). FPIS (A+) and FNIS (A) are determined as follows:
A + = ( v 1 + ,   v 2 + , , v m + )
where   v j + = ( 1 ,   1 ,   1 )
A = ( v 1 ,   v 2 , , v m )
where   v j = ( 0 ,   0 ,   0 ) .
Step 7: Determine the distance of each alternative from FPIS and FNIS. The distance ( d i + , d i ) of each alternative from A + and A is computed as:
d i + = j = 1 n d ( v i j k , v j + ) ,   i = 1 ,   2 , ,   n ;   j = 1 ,   2 , ,   m
d   i = j = 1 n d ( v i j k , v j ) ,   i = 1 ,   2 , ,   n ;   j = 1 ,   2 , ,   m
where, d(..) denotes the distance between two triangular fuzzy numbers y ˜   and z ˜   . This is illustrated by the following formula:
d ( y ˜ , z ˜ ) = 1 3 [ ( y 1 z 1 ) 2 + ( y 2 z 2 ) 2 + ( y 3 z 3 ) 2 ]
Step 8: Calculate the closeness coefficient ( C C i ) of each alternative:
C C i = d i d i + + d i ;   C C i   [ 0 , 1 ]   ,   i = 1 ,   2 , ,   n
Step 9: Rank the success index of all alternatives, based on the descending results of closeness coefficient ( C C i   ). The alternative with the highest C C i value is considered the best option.

Appendix A.3. Numerical Application

The numerical application of fuzzy TOPSIS is presented in the following table.
Table A3. Aggregated fuzzy weight of criteria.
CriteriaE1E2E3E4Aggregated Fuzzy Weight
C1(0.75, 1.00, 1.00)(0.75, 1.00, 1.00)(0.75, 1.00, 1.00)(0.75, 1.00, 1.00)(0.75, 1.00, 1.00)
C2(0.50, 0.75, 1.00)(0.75, 1.00, 1.00)(0.75, 1.00, 1.00)(0.50, 0.75, 1.00)(0.63, 0.88, 1.00)
C3(0.50, 0.75, 1.00)(0.75, 1.00, 1.00)(0.75, 1.00, 1.00)(0.75, 1.00, 1.00)(0.69, 0.94, 1.00)
C4(0.25, 0.50, 0.75)(0.50, 0.75, 1.00)(0.75, 1.00, 1.00)(0.75, 1.00, 1.00)(0.56, 0.81, 0.94)
C5(0.50, 0.75, 1.00)(0.50, 0.75, 1.00)(0.50, 0.75, 1.00)(0.75, 1.00, 1.00)(0.56, 0.81, 1.00)
C6(0.50, 0.75, 1.00)(0.50, 0.75, 1.00)(0.50, 0.75, 1.00)(0.75, 1.00, 1.00)(0.56, 0.81, 1.00)
C7(0.50, 0.75, 1.00)(0.50, 0.75, 1.00)(0.50, 0.75, 1.00)(0.75, 1.00, 1.00)(0.56, 0.81, 1.00)
C8(0.50, 0.75, 1.00)(0.25, 0.50, 0.75)(0.25, 0.50, 0.75)(0.50, 0.75, 1.00)(0.38, 0.63, 0.88)
C9(0.50, 0.75, 1.00)(0.75, 1.00, 1.00)(0.25, 0.50, 0.75)(0.50, 0.75, 1.00)(0.50, 0.75, 0.94)
Table A4. Aggregated fuzzy ratings of alternatives.
Cri.Alter.E1E2E3E4Aggregated Fuzzy Weight
C1A1(7.5, 10.0, 10.0)(5.0, 7.5, 10.0)(5.0, 7.5, 10.0)(5.0, 7.5, 10.0)(5.63, 8.13, 10.0)
A2(2.5, 5.0, 7.5)(5.0, 7.5, 10.0)(2.5, 5.0, 7.5)(5.0, 7.5, 10.0)(3.75, 6.25, 8.75)
A3(2.5, 5.0, 7.5)(2.5, 5.0, 7.5)(2.5, 5.0, 7.5)(2.5, 5.0, 7.5)(2.50, 5.00, 7.50)
C2A1(5.0, 7.5, 10.0)(5.0, 7.5, 10.0)(2.5, 5.0, 7.5)(5.0, 7.5, 10.0)(4.38, 6.88, 9.38)
A2(0.0, 2.5, 5.0)(2.5, 5.0, 7.5)(2.5, 5.0, 7.5)(2.5, 5.0, 7.5)(1.88, 4.38, 6.88)
A3(5.0, 7.5, 10.0)(0.0, 2.5, 5.0)(2.5, 5.0, 7.5)(2.5, 5.0, 7.5)(2.50, 5.00, 7.50)
C3A1(5.0, 7.5, 10.0)(5.0, 7.5, 10.0)(5.0, 7.5, 10.0)(5.0, 7.5, 10.0)(5.00, 7.50, 10.0)
A2(2.5, 5.0, 7.5)(5.0, 7.5, 10.0)(2.5, 5.0, 7.5)(5.0, 7.5, 10.0)(3.75, 6.25, 8.75)
A3(5.0, 7.5, 10.0)(5.0, 7.5, 10.0)(5.0, 7.5, 10.0)(5.0, 7.5, 10.0)(5.00, 7.50, 10.0)
C4A1(5.0, 7.5, 10.0)(5.0, 7.5, 10.0)(5.0, 7.5, 10.0)(5.0, 7.5, 10.0)(5.00, 7.50, 10.0)
A2(2.5, 5.0, 7.5)(2.5, 5.0, 7.5)(2.5, 5.0, 7.5)(2.5, 5.0, 7.5)(2.50, 5.00, 7.50)
A3(2.5, 5.0, 7.5)(2.5, 5.0, 7.5)(2.5, 5.0, 7.5)(7.5, 10.0, 10.0)(3.75, 6.25, 8.13)
C5A1(5.0, 7.5, 10.0)(5.0, 7.5, 10.0)(5.0, 7.5, 10.0)(5.0, 7.5, 10.0)(5.00, 7.50, 10.0)
A2(2.5, 5.0, 7.5)(5.0, 7.5, 10.0)(2.5, 5.0, 7.5)(5.0, 7.5, 10.0)(3.75, 6.25, 8.75)
A3(5.0, 7.5, 10.0)(2.5, 5.0, 7.5)(5.0, 7.5, 10.0)(2.5, 5.0, 7.5)(3.75, 6.25, 8.75)
C6A1(5.0, 7.5, 10.0)(5.0, 7.5, 10.0)(5.0, 7.5, 10.0)(7.5, 10.0, 10.0)(5.63, 8.13, 10.0)
A2(5.0, 7.5, 10.0)(5.0, 7.5, 10.0)(5.0, 7.5, 10.0)(5.0, 7.5, 10.0)(5.00, 7.50, 10.0)
A3(5.0, 7.5, 10.0)(7.5, 10.0, 10.0)(5.0, 7.5, 10.0)(7.5, 10.0, 10.0)(6.25, 8.75, 10.0)
C7A1(2.5, 5.0, 7.5)(5.0, 7.5, 10.0)(5.0, 7.5, 10.0)(5.0, 7.5, 10.0)(4.38, 6.88, 9.38)
A2(2.5, 5.0, 7.5)(5.0, 7.5, 10.0)(2.5, 5.0, 7.5)(5.0, 7.5, 10.0)(3.75, 6.25, 8.75)
A3(2.5, 5.0, 7.5)(2.5, 5.0, 7.5)(5.0, 7.5, 10.0)(2.5, 5.0, 7.5)(3.13, 5.63, 8.13)
C8A1(5.0, 7.5, 10.0)(5.0, 7.5, 10.0)(5.0, 7.5, 10.0)(5.0, 7.5, 10.0)(5.00, 7.50, 10.0)
A2(2.5, 5.0, 7.5)(5.0, 7.5, 10.0)(2.5, 5.0, 7.5)(5.0, 7.5, 10.0)(3.75, 6.25, 8.75)
A3(2.5, 5.0, 7.5)(2.5, 5.0, 7.5)(2.5, 5.0, 7.5)(2.5, 5.0, 7.5)(2.50, 5.00, 7.50)
C9A1(5.0, 7.5, 10.0)(5.0, 7.5, 10.0)(2.5, 5.0, 7.5)(5.0, 7.5, 10.0)(4.38, 6.88, 9.38)
A2(2.5, 5.0, 7.5)(2.5, 5.0, 7.5)(2.5, 5.0, 7.5)(5.0, 7.5, 10.0)(3.13, 5.63, 8.13)
A3(5.0, 7.5, 10.0)(2.5, 5.0, 7.5)(2.5, 5.0, 7.5)(5.0, 7.5, 10.0)(3.75, 6.25, 8.75)
Table A5. Normalized fuzzy decision matrix for alternatives.
CriteriaA1A2A3
C1(0.56, 0.81, 1.00)(0.38, 0.63, 0.88)(0.25, 0.50, 0.75)
C2(0.47, 0.73, 1.00)(0.20, 0.47, 0.73)(0.27, 0.53, 0.80)
C3(0.38, 0.50, 0.75)(0.43, 0.60, 1.00)(0.38, 0.50, 0.75)
C4(0.25, 0.33, 0.50)(0.33, 0.50, 1.00)(0.31, 0.40, 0.67)
C5(0.50, 0.75, 1.00)(0.38, 0.63, 0.88)(0.38, 0.63, 0.88)
C6(0.56, 0.81, 1.00)(0.50, 0.75, 1.00)(0.63, 0.88, 1.00)
C7(0.47, 0.73, 1.00)(0.40, 0.67, 0.93)(0.33, 0.60, 0.87)
C8(0.50, 0.75, 1.00)(0.38, 0.63, 0.88)(0.25, 0.50, 0.75)
C9(0.47, 0.73, 1.00)(0.33, 0.60, 0.87)(0.40, 0.67, 0.93)
Table A6. Weighted normalized matrix for three alternatives.
CriteriaA1A2A3
C1(0.422, 0.813, 1.00)(0.281, 0.625, 0.875)(0.188, 0.50, 0.75
C2(0.292, 0.642, 1.00)(0.125, 0.408, 0.733)(0.167, 0.467, 0.80)
C3(0.258, 0.469, 0.75)(0.295, 0.563, 1.00)(0.258, 0.469, 0.75)
C4(0.141, 0.271, 0.469)(0.188, 0.406, 0.938)(0.173, 0.325, 0.625)
C5(0.281, 0.609, 1.00)(0.211, 0.508, 0.875)(0.211, 0.508, 0.875)
C6(0.316, 0.66, 1.00)(0.281, 0.609, 1.00)(0.352, 0.711, 1.00)
C7(0.263, 0.596, 1.00)(0.225, 0.542, 0.933)(0.188, 0.488, 0.867)
C8(0.188, 0.469, 0.875)(0.141, 0.391, 0.766)(0.094, 0.313, 0.656)
C9(0.233, 0.55, 0.938)(0.167, 0.45, 0.813)(0.20, 0.50, 0.875)
Table A7. Distance of each alternative from fuzzy positive ideal solution (FPIS) and fuzzy negative ideal solution (FNIS).
Criteria   d i +       d i    
  d v ( A 1 , A + )       d v ( A 2 , A + )       d v ( A 3 , A + )       d v ( A 1 , A + )       d v ( A 2 , A + )       d v ( A 3 , A + )    
C10.3510.4740.5690.7830.6420.532
C20.4580.6290.5830.7060.4900.543
C30.5460.4790.5460.5320.6840.532
C40.7190.5820.6530.3230.6000.419
C50.4720.5420.5420.6950.5970.597
C60.4410.4720.4100.7160.6950.737
C70.4860.5210.5600.6890.6360.584
C80.5650.6230.6860.5830.5030.423
C90.5150.5870.5490.6420.5450.593
  d v   4.5534.9095.0995.6695.3914.960
Table A8. Closeness coefficient C C i   and ranking.
Alternatives   d i +     d i     C C i   Ranking
A14.5535.6690.5551
A24.9095.3910.5232
A35.0994.9600.4933

Appendix A.4. Assumptions for Sensitivity Analysis

The result of sensitivity analysis is shown in Table A9.
Table A9. Result of sensitivity assumptions.
No.DescriptionCCiRanking
A1A2A3
1wC1-C9 = (0.00, 0.25, 0.50)0.2580.2520.232A1 > A2 > A3
2wC1-C9 = (0.25, 0.50, 0.75)0.4030.3870.360A1 > A2 > A3
3wC1-C9 = (0.50, 0.75, 1.00)0.5370.5110.481A1 > A2 > A3
4wC1-C9 = (0.75, 1.00, 1.00)0.6150.5750.544A1 > A2 > A3
5wC1 = (0.75, 1.00, 1.000)
wC2-C9 = (0.00, 0.25, 0.50)
0.3050.2800.262A1 > A2 > A3
6wC2 = (0.75, 1.00, 1.000)
wC1,C3-C9 = (0.00, 0.25, 0.50)
0.3010.2800.264A1 > A2 > A3
7wC3 = (0.75, 1.00, 1.000)
wC1-C2, C4-C9 = (0.00, 0.25, 0.50)
0.2900.2910.265A2 > A1 > A3
8wC4 = (0.75, 1.00, 1.000)
wC1-C3, C5-C9 = (0.00, 0.25, 0.50)
0.2790.2870.259A2 > A1 > A3
9wC5 = (0.75, 1.00, 1.000)
wC1-C4, C6-SC9 = (0.00, 0.25, 0.50)
0.3020.2890.269A1 > A2 > A3
10wC6 = (0.75, 1.00, 1.000)
wC1-C5, C7-C9 = (0.00, 0.25, 0.50)
0.3050.2960.282A1 > A2 > A3
11wC7 = (0.75, 1.00, 1.000)
wC1-C6, C8-C9 = (0.00, 0.25, 0.50)
0.3010.2910.268A1 > A2 > A3
12wC8 = (0.75, 1.00, 1.000)
wC1-C7, C9 = (0.00, 0.25, 0.50)
0.3020.2890.262A1 > A2 > A3
13wC9 = (0.75, 1.00, 1.000)
wC1-C8 = (0.00, 0.25, 0.50)
0.3010.2870.272A1 > A2 > A3

References

  1. Asian Development Bank (ADB). Public—Private Partnership Development in Southest Asia. 2018. Available online: https://www.adb.org/sites/default/files/publication/444631/ewp-553-ppp-development-southeast-asia.pdf (accessed on 16 November 2019).
  2. Zhang, X.; Chen, S. A systematic framework for infrastructure development through public private partnerships. IATSS Res. 2013, 36, 88–97. [Google Scholar] [CrossRef] [Green Version]
  3. Akintoye, A.; Hardcastle, C.; Beck, M.; Chinyio, E.; Asenova, D. Achieving best value in private finance initiative project procurement. Constr. Manag. Econ. 2003, 21, 461–470. [Google Scholar] [CrossRef]
  4. Skietrys, E.; Raipa, A.; Bartkus, E.V. Dimensions of the efficiency of the public—Private partnership. Eng. Econ. 2008, 58, 3–45. [Google Scholar]
  5. Kang, S.; Mulaphong, D.; Hwang, E.; Chang, C.K. Public-private partnerships in developing countries: Factors for successful adoption and implementation. Int. J. Public Sect. Manag. 2019, 32, 334–351. [Google Scholar] [CrossRef]
  6. Ahmadabadi, A.A.; Heravi, G. The effect of critical success factors on project success in Public-Private Partnership projects: A case study of highway projects in Iran. Trans. Policy 2019, 73, 152–161. [Google Scholar] [CrossRef]
  7. Kwak, Y.H.; Chih, Y.Y.; Ibbs, C.W. Towards a comprehensive understanding of Public-Private Partnerships for infrastructure development. Calif. Manag. Rev. 2009, 51, 51–78. [Google Scholar] [CrossRef]
  8. Zou, P.X.W.; Wang, S.; Fang, D. A life-cycle risk management framework for PPP infrastructure projects. J. Financ. Manag. Prop. Constr. 2008, 13, 123–142. [Google Scholar] [CrossRef]
  9. Rahman, I.A.; Memon, A.H.; Zulkiffli, N.S.M. Failure reasons of PPP infrastructure projects: Case study of Kuala Lumpur LRT project. Life Sci. J. 2014, 11, 238–246. [Google Scholar]
  10. Cho, C.S.; Gibson, G.E. Building project scope definition using definition rating index. J. Archit. Eng. 2001, 7, 115–125. [Google Scholar] [CrossRef]
  11. Ke, Y.; Wang, S.Q.; Chan, A.P.C.; Cheung, E. Research trend of Public—Private Partnership in Construction Journals. J. Constr. Eng. Manag. 2009, 135, 1076–1086. [Google Scholar] [CrossRef]
  12. Kim, S.Y.; Nguyen, M.V.; Luu, V.T. A performance evaluation framework for construction and demolition waste management: Stakeholder perspectives. Eng. Constr. Archit. Manag. 2020, 0969–9988. [Google Scholar] [CrossRef]
  13. Sy, T.D.; Likhitruangsilp, V.; Onishi, M.; Nguyen, T.P. Impacts of risk factors on the performance of Public-Private Partnership transportation projects in Vietnam. ASEAN Eng. J. 2017, 7, 30–52. [Google Scholar]
  14. PPP Knowledge Lab. Vietnam: PPP Projects in Infrastructure. 2020. Available online: https://pppknowledgelab.org/countries/vietnam (accessed on 20 May 2020).
  15. JICA (Japan International Cooperation Agency). Final Report: VGF Survey for PPP Projects in Vietnam. 2017. Available online: https://openjicareport.jica.go.jp/pdf/12292850.pdf (accessed on 16 June 2020).
  16. Onut, S.; Efendigil, T.; Kara, S.S. A combined fuzzy MCDM approach for selecting shopping center site: An example from Istanbul, Turkey. Expert Syst. Appl. 2010, 37, 1973–1980. [Google Scholar] [CrossRef]
  17. Rezaeiniya, N.; Ghadikolaei, A.S.; Tekmeh, J.M.; Rezaeiniya, H. Fuzzy ANP approach for new application: Greenhouse location selection; a case in Iran. J. Math. Comput. Sci. 2014, 8, 1–20. [Google Scholar] [CrossRef] [Green Version]
  18. Athawale, V.M.; Chatterjee, P.; Chakraborty, S. Decision making for facility location selection using PROMETHEE II method. Int. J. Ind. Syst. Eng. 2012, 11, 16–30. [Google Scholar] [CrossRef]
  19. Awasthi, A.; Chauhan, S.S.; Goyal, S.K. A multi-criteria decision making approach for location planning for urban distribution centers under uncertainty. Math. Comput. Model. 2011, 53, 98–109. [Google Scholar] [CrossRef]
  20. Sennaroglu, B.; Celebi, G.V. A military airport location selection by AHP integrated PROMETHE and VIKOR methods. Transp. Res. Part D 2018, 29, 160–173. [Google Scholar] [CrossRef]
  21. Rao, C.; Goh, M.; Zhao, Y.; Zheng, J. Location selection of city logistics centers under sustainability. Transp. Res. Part D 2015, 36, 29–44. [Google Scholar] [CrossRef]
  22. Mulholland, B.; Christian, J. Risk Assessment in construction schedules. J. Constr. Eng. Manag. 1999, 125, 8–15. [Google Scholar] [CrossRef]
  23. Bian, K. Application of fuzzy AHP and ELECTRE to China dry port location selection. Asian J. Shipp. Logis. 2011, 27, 331–353. [Google Scholar]
  24. Zhao, J.; Lee, K.W. Construction and ultilization of rock caverns in Singapore Part C: Planning and location selection. Tunn. Undergr. Space Technol. 1996, 11, 81–84. [Google Scholar] [CrossRef]
  25. Cheng, E.W.L.; Li, H. Exploring quantitative methods for project location selection. Build. Environ. 2004, 39, 1467–1476. [Google Scholar] [CrossRef]
  26. Yang, J.; Lee, H. An AHP decision model for facility location selection. Facilities 1997, 15, 241–254. [Google Scholar] [CrossRef]
  27. Khalili-Damghani, K.; Sadi-Nezhad, S. A decision support system for fuzzy multi-objective multi-period sustainable project selection. Comp. Ind. Eng. 2013, 64, 1045–1060. [Google Scholar] [CrossRef]
  28. Labuschagne, C.; Brent, A.C. Sustainable projectlife cycle management: The needto integrate life cycles in the manufacturing sector. Int. J. Proj. Manag. 2005, 23, 159–168. [Google Scholar] [CrossRef] [Green Version]
  29. United Nations Economic and Social Commission for Asia and the Pacific (ESCAP). A Primer to Public-Private Partnerships Infrastructure Development. 2008. Available online: https://www.unescap.org/ttdw/ppp/ppp_primer/04_differences_between_ppp_and_conventional_projects.html#:~:text=A%20PPP%20project%20is%20different,managed%20like%20a%20construction%20project.&text=The%20focus%20of%20a%20PPP,specified%20services%20at%20defined%20levels (accessed on 16 June 2020).
  30. Liu, J.; Love, P.E.D.; Smith, J.; Regan, M.; Palaneeswaran, E. Review of performance measurement: Implications for public-private partnerships. Built Environ. Proj. Asset Manag. 2015, 5, 35–51. [Google Scholar] [CrossRef]
  31. Chan, A.P.C.; Chan, A.P.L. Key performance indicators for measuring construction success. Benchmarking Int. J. 2004, 11, 203–221. [Google Scholar] [CrossRef]
  32. Osei-Kyei, R.; Chan, A.P.C. Comparative analysis of the success criteria for Public—Private Partnership projects in Ghana and Hong Kong. Proj. Manag. J. 2017, 48, 80–92. [Google Scholar] [CrossRef] [Green Version]
  33. Lim, C.S.; Mohamed, M.Z. Criteria of project success: An exploratory re-examination. Int. J. Proj. Manag. 1999, 17, 243–248. [Google Scholar] [CrossRef]
  34. Atkinson, R. Project management: Cost, time, and quality, two best guesses and a phenomenon, it’s time to accept other success criteria. Int. J. Proj. Manag. 1999, 17, 337–342. [Google Scholar] [CrossRef]
  35. Al-Tmeemy, S.M.H.M.; Rahman, H.A.; Harun, Z. Future criteria for success of building projects in Malaysia. Int. J. Proj. Manag. 2011, 29, 337–348. [Google Scholar] [CrossRef]
  36. Baccarini, D. The logical framework method for defining project success. Proj. Manag. J. 1999, 30, 25–32. [Google Scholar] [CrossRef]
  37. Chan, A.P.C.; Scott, D.; Lam, E.W.M. Framework of success criteria for design/build projects. J. Manag. Eng. 2002, 18, 120–128. [Google Scholar] [CrossRef]
  38. Cox, R.F.; Issa, R.R.A.; Ahrens, D. Management’s perception of key performance indicators for construction. J. Constr. Eng. Manag. 2003, 129, 142–151. [Google Scholar] [CrossRef]
  39. Zhang, S.; Chan, A.P.C.; Feng, Y.; Duan, H.; Ke, Y. Crirical review on PPP Research—A search from the Chinese and International Journals. Int. J. Proj. Manag. 2016, 34, 597–612. [Google Scholar] [CrossRef]
  40. Tam, C.M. Build—Operate—Transfer model for infrastructure developments in Asia: Reasons for success and failures. Int. J. Proj. Manag. 1999, 17, 377–382. [Google Scholar]
  41. Yuan, J.; Zeng, A.Y.; Skibniewski, M.J.; Li, Q. Selection of performance objectives and key performance indicators in public—Private partnership projects to achieve value for money. Constr. Manag. Econ. 2009, 27, 253–270. [Google Scholar] [CrossRef]
  42. Abdul-Aziz, A.R.; Kassim, P.S.J. Objectives, success and failure factors of housing public-private partnerships in Malaysia. Habitat Int. 2011, 35, 150–157. [Google Scholar] [CrossRef]
  43. Mladenovic, G.; Vajdic, N.; Wundsch, B.; Temeljotov-Salaj, A. Use of key performance indicators for PPP transport projects to meet stakeholders’ performance objectives. Built Environ. Proj. Asset Manag. 2013, 3, 228–249. [Google Scholar] [CrossRef]
  44. Villalba-Romero, F.; Liyanage, C. Evaluating success in PPP road projects in Europe: A comparison of performance measurement approachs. Transp. Res. Proced. 2016, 14, 372–381. [Google Scholar] [CrossRef] [Green Version]
  45. Nadaban, S.; Dzitac, S.; Dzitac, I. Fuzzy TOPSIS: A general review. Proce. Comput. Sci. 2016, 91, 823–831. [Google Scholar] [CrossRef] [Green Version]
  46. Erdogan, S.A.; Saparauskas, J.; Turskis, Z. A Multi-Criteria Decision-Making Model to Choose the Best Option for Sustainable Construction Management. Sustainability 2019, 11, 2239. [Google Scholar] [CrossRef] [Green Version]
  47. Kangas, Y.Z.; Miettinen, K. Decision making in multiobjective optimization problems under uncertainty: Balancing between robustness and quality. OR Spectr. 2019, 41, 391–413. [Google Scholar] [CrossRef] [Green Version]
  48. Junior, F.R.L.; Osiro, L.; Carpinetti, L.C.R. A comparison between fuzzy AHP and fuzzy TOPSIS methods to supplier selection. Appl. Soft. Comp. 2014, 21, 194–209. [Google Scholar] [CrossRef]
  49. Tan, Y.T.; Shen, L.Y.; Langston, C.; Liu, Y. Construction project selection using fuzzy TOPSIS approach. J. Model. Manag. 2010, 5, 302–315. [Google Scholar] [CrossRef]
  50. Bellman, R.E.; Zadeh, L.A. Decision-making in a fuzzy environment. Manag. Sci. 1970, 17, 141–164. [Google Scholar] [CrossRef]
  51. Islam, M.S.; Nepal, M.P.; Skitmore, M.; Attarzadeh, M. Current research trend and application areas of fuzzy and hybrid methods to risk assessment of construction projects. Adv. Eng. Infom. 2017, 33, 112–131. [Google Scholar] [CrossRef]
  52. De Boer, L.; Wegen, L.V.D.; Tegen, J. Outranking methods in suppot of supplier selection. Eur. J. Purch. Supply Manag. 1998, 4, 109–118. [Google Scholar] [CrossRef]
  53. Liu, J.; Wei, Q. Risk evaluation of electric vehicle charging infrastructure public–private partnership projects in China using fuzzy TOPSIS. J. Clean. Prod. 2018, 189, 211–222. [Google Scholar] [CrossRef]
  54. Maghsoodi, A.I.; Khalilzadeh, M. Identification and evaluation of construction projects’ critical success factors employing fuzzy-TOPSIS approach. KSCE J. Cilvil Eng. 2018, 22, 1593–1605. [Google Scholar] [CrossRef]
  55. Awasthi, A.; Chauhan, S.S.; Omrani, H. Application of fuzzy TOPSIS in evaluating sustainable transportation systems. Expert Syst. Appl. 2011, 38, 12270–12280. [Google Scholar] [CrossRef]
  56. Beskese, A.; Demir, H.H.; Ozcan, H.K.; Okten, H.E. Landfill site selection using fuzzy AHP and fuzzy TOPSIS: A case study for Istanbul. Environ. Earth Sci. 2015, 73, 3513–3521. [Google Scholar] [CrossRef]
  57. Vietnam National University Ho Chi Minh City. The Economic Region of South Area Must be the Driving Force in the Innovation. 2019. Available online: https://vnuhcm.edu.vn/tin-tuc_32346864/vung-kinh-te-trong-diem-phia-nam-phai-la-dong-luc-trong-doi-moi-sang-tao/323336336864.html (accessed on 2 June 2020).
  58. Review of Finance. The Southern Key Economic Regions must Play the Leading Role. 2019. Available online: http://tapchitaichinh.vn/su-kien-noi-bat/cac-vung-kinh-te-trong-diem-phia-nam-phai-giu-vai-tro-la-dau-tau-306627.html (accessed on 15 June 2020).
  59. The Organ of Dong Nai Province’s Vietnam Communist Party. Southern Key Economic Region: Leading Role in Development. 2019. Available online: http://www.baodongnai.com.vn/kinhte/201905/vung-kinh-te-trong-diem-phia-nam-vai-tro-dan-dat-trong-phat-trien-2944651/ (accessed on 2 June 2020).
  60. Nhan Dan-Electronic. Developing the Northern Key Economic Region. 2020. Available online: https://www.nhandan.com.vn/kinhte/item/44549602-phat-trien-vung-kinh-te-trong-diem-bac-bo.html (accessed on 20 June 2020).
  61. Wikipedia. Key Economic Region of the Mekong Delta. 2019. Available online: https://vi.wikipedia.org/wiki/V%C3%B9ng_kinh_t%E1%BA%BF_tr%E1%BB%8Dng_%C4%91i%E1%BB%83m_v%C3%B9ng_%C4%91%E1%BB%93ng_b%E1%BA%B1ng_s%C3%B4ng_C%E1%BB%ADu_Long#:~:text=V%C3%B9ng%20kinh%20t%E1%BA%BF%20tr%E1%BB%8Dng%20%C4%91i%E1%BB%83m%20v%C3%B9ng%20%C4%91%E1%BB%93ng%20b%E1%BA%B1ng%20s%C3%B4ng%20C%E1%BB%ADu,16%20th%C3%A1ng%204%20n%C4%83m%202009 (accessed on 2 June 2020).
  62. Azari, A.R.K.; Mousavi, N.; Mousavi, S.F.; Hosseini, S.B. Risk assessment model selection in construction industry. Expert Syst. Appl. 2011, 38, 9105–9111. [Google Scholar]
  63. Liang, G.S. Fuzzy MCDM based on ideal and anti-ideal concepts. Eur. J. Oper. Res. 1999, 112, 682–691. [Google Scholar] [CrossRef]
  64. Chen, C.T. Extension of the TOPSIS for group decision-making under fuzzy environment. Fuzzy Sets Syst. 2000, 114, 1–9. [Google Scholar] [CrossRef]
Figure 1. The implementation process of fuzzy technique for order of preference by similarity to ideal solution (TOPSIS) method.
Sustainability 12 05914 g001
Figure 2. Hierarchy structure of sustainable location selection of PPP projects.
Sustainability 12 05914 g002
Figure 3. Illustration of sensitivity analysis.
Sustainability 12 05914 g003
Table 1. Prioritized public–private partnership (PPP) infrastructure projects in Vietnam during 2016–2020.
SectorProject Location (No. of Project)Total Investment (Million USD)
Southern RegionNorthern RegionMekong Delta Region
Water supply1293.043
Wastewater treatment21166.556
Solid water2447.913
Transportation
Highway1242962.213
Provincial road, bridge1345736.162
Port111579.439
Urban train11365.217
Other infrastructure 284.058
Total81585434.602
1 Project types of transportation sectors.
Table 2. Criteria for PPP project location selection.
Success Criteria[32][33][35][37][41][42][43][44]
1User demand× ×
2Time×××××× ×
3Profitability× × ×× ×
4Cost××××××××
5Environmental impact ×
6Local development× ×
7Risk management× × × ×
8Technology transfer× ××× ×
9Service quality ×××× ×
Table 3. Criteria of PPP project location selection.
CriteriaCodeDefinitionType
User demandC1Demand for service facilities of local peopleB (more is better)
Time C2Accomplishing the project on timeB (more is better)
ProfitabilityC3Assuring operating cost during the project operationC (less is better)
Cost C4Completing the project within the estimated cost C (less is better)
Environmental impact C5Do not affect the health and safety of local people and environment conditionB (more is better)
Local development C6Creating jobs, improving sustainable local infrastructure, and managing local resources.B (more is better)
Risk management C7Identifying and sharing risks effectively between both the public and private sectorsB (more is better)
Technology transferC8Encouraging innovation and transfer of design and construction methodB (more is better)
Service quality C9Providing good services for satisfying the usersB (more is better)
Table 4. Weight of criteria and rating of alternative.
CriteriaE1E2E3E4
A1A2A3wA1A2A3wA1A2A3wA1A2A3w
C1VGMMEIGGMEIGMMEIGGMEI
C2GPGVIGMPEIMMMEIGMMVI
C3GMGVIGGGEIGMGEIGGGEI
C4GMMIGMMVIGMMEIGMVGEI
C5GMGVIGGMVIGMGVIGGMEI
C6GGGVIGGVGVIGGGVIVGGVGEI
C7MMMVIGGMVIGMGVIGGMEI
C8GMMVIGGMIGMMIGGMVI
C9GMGVIGMMEIMMMIGGGVI

