Article

Assessment of Wetland Ecosystem Health Using the Pressure–State–Response (PSR) Model: A Case Study of Mursidabad District of West Bengal (India)

1
Department of Geography, Raja N.L.Khan Womens College (autonomous), Gope Palace, Midnapore 721102, West Bengal, India
2
Centre for Advanced Modelling and Geospatial Information Systems (CAMGIS), School of Information, Systems & Modelling, Faculty of Engineering and IT, University of Technology Sydney, Sydney, NSW 2007, Australia
3
Department of Geology & Geophysics, College of Science, King Saud University, Riyadh 11451, Saudi Arabia
*
Author to whom correspondence should be addressed.
Sustainability 2020, 12(15), 5932; https://doi.org/10.3390/su12155932
Submission received: 24 June 2020 / Revised: 14 July 2020 / Accepted: 21 July 2020 / Published: 23 July 2020

Abstract

:
Wetlands are essential for protein production, water sanctification, groundwater recharge, climate purification, nutrient cycling, decreasing floods and biodiversity preservation. The Mursidabad district in West Bengal (India) is situated in the floodplain of the Ganga–Padma and Bhagirathi rivers. The region is characterized by diverse types of wetlands; however, the wetlands are getting depredated day-by-day due to hydro-ecological changes, uncontrolled human activities and rapid urbanization. This study attempted to explore the health status of the wetland ecosystem in 2013 and 2020 at the block level in the Mursidabad district, using the pressure–state–response model. Based on wetland ecosystem health values, we categorized the health conditions and identified the blocks where the health conditions are poor. A total of seven Landsat ETM+ spaceborne satellite images in 2001, 2013 and 2020 were selected as the data sources. The statistical data included the population density and urbanization increase rate, for all administrative units, and were collected from the census data of India for 2001 and 2011. We picked nine ecosystem indicators for the incorporated assessment of wetland ecosystem health. The indicators were selected considering every block in the Mursidabad district and for the computation of the wetland ecosystem health index by using the analytical hierarchy processes method. This study determined that 26.92% of the blocks fell under the sick category in 2013, but increased to 30.77% in 2020, while the percentage of blocks in the very healthy category has decreased markedly from 11.54% to 3.85%. These blocks were affected by higher human pressure, such as population density, urbanization growth rate and road density, which resulted in the degradation of wetland health. The scientific protection and restoration techniques of these wetlands should be emphasized in these areas.

1. Introduction

Environmental systems are considered benefitting from wetlands through protein production, water sanctification, groundwater recharge, climate purification, nutrient cycling, flood mitigation and biodiversity preservation [1,2]. From the mid-twentieth century, the world’s wetland ecosystems have faced several difficulties due to intensive economic development, rapid recovery of farmland, overuse of organic resources, overexploitation for tourism development, etc. In India, many wetland ecosystems have witnessed a rapid detraction, including a reduction in area, deterioration in water quality and loss of biodiversity [3]. The combined processes of wetland degradation is seen in the structural and functional disorder of the wetlands.
The concept of ecosystem health was first mooted by Aldo Leopold in 1941 [4]. He defined that ecosystem health can be understood as a management concept that contributes to solve environmental problems. Rapport et al. [5] popularized the word “ecosystem health”. They characterized it as a form of biological system dependability and maintainability, which has the capacity for keeping up its organisational structure as well as natural regulating and recuperation capacity after resilience. An evaluation of wetland environment wellbeing is done by using qualitative assessment methods and techniques to combine quantitative and qualitative assessments. Most of the common methods include landscape development intensity (LDI), synoptic assessment, hydrogeomorphic (HGM), indices of biological intensity (IBI), landscape pattern indices (ILP) and pressure–state–response (PSR) modelling methods. The landscape development intensity index (LDI) is used in quantitative measurements, where the intensity and areal extent of human activities in a landscape have been tested [6]. The researchers used the indices of landscape pattern (ILP) to evaluate human activities and practices, which are responsible for wetlands degradation [7]. Their results showed that landscape patterns are modified with an increase in artificial wetland patches. LDI and ILP approaches have been very useful in measuring the extension of uncontrolled human activities, but are not useful for measuring the degree of deterioration in the health of wetland ecosystems. The biological intensity index (IBI) is a qualitative measure used to explore the condition of habitat type with relation to its biological communities [8]. The hydrogeomorphic model (HGM) is helpful to develop a functional classification of the wetlands, which provides a basis for generalizing the hydrological characteristics of a specified wetland class [9]. IBI and HGM approaches are considered the functional efficiency of wetlands and estimates the ecosystem services of the wetlands, but do not review the consequences of the spread of human civilization. The synoptic approach raises a generalized view from the ecological perspective of wetlands [10]. It is helpful to understand the cumulative effects of the physical, chemical or biological changes of a particular region [11]. Therefore, the synoptic approach provides a broad perspective but cannot analyse a detailed view. The pressure–state–response (PSR) model presents a scientific perspective on the health status of wetlands by observing the cause and effect relationship and maintaining a balance between the above approaches.
Wetland ecosystem health has gained wide attention and popularity among the scholars of India as well as the world. Researchers have used water, soil, vegetation and other related indicators for determining the health conditions of wetlands [12,13,14]. Traditionally, scholars have used field observation data and models to assess the wetland ecology [15,16]. Person et al. [17] and Ogden et al. [18] observed water birds as an indicator of wetland health. Albert et al. [14] indicated plants as regional indicators of lake ecosystem health. Shil and Singh [13] and Kangabam et al. [19] used water quality data for determining the health condition of a wetland. Field observation data cannot trace out the spatial and temporal scenarios of wetland ecosystem health. Remote sensing data have a high efficiency and contain multi-phase information that can be used for determining and observing ecosystem health at various spatio-temporal scales across widespread regions. Many research studies in China have used remote sensing data for the assessment of wetlands in a river basin or coastal region [20,21]; however, the health conditions in inland wetlands are neglected.
India is gifted with a massive amount of wetland area, covering approximately 18.4% of the land surface (MoEF, [22]), and they play a pivotal role in landscape by providing beneficial natural resources and services to human beings. The wetlands in India are mainly inland in nature. According to the Indian Space Research Organization [23], India has 69.23% of the area under inland wetlands and 30.77% of the area belongs to coastal wetland. The Mursidabad district in West Bengal is situated in a floodplain of the Ganga–Padma and Bhagirathi rivers. The region is characterized by a diverse type of wetlands and these wetlands hold a vital role for their hydro-ecological functions and economic values, serving as a reservoir for agriculture, fishing grounds, bird sanctuaries, visiting centres, etc. However, the wetlands are getting depredated day-by-day because of hydro-ecological changes, uncontrolled human activities and rapid urbanization. Most of the studies in India have tried to investigate wetland loss that resultant in the shrinking of valuable biodiversity and precious habitat [24]. Das et al. [25] tried to address the household use of wetlands.
In this context, there is a need to discuss systematic assessments of wetland health status at a regional level. The main objectives of this study are (1) to explore the status of the wetland ecosystem health (WEH) of the Mursidabad district in the year 2013 and 2020; and (2) on the basis of the WEH value, to categorize the health conditions and identify the blocks where the health condition is decreasing or increasing from 2013 to 2020. Wetland ecosystem health and human wellbeing is essential for the conservation of wetland ecosystems and for the maintenance of environmental regulations/flows [26]. The environmental regulations can help accommodate the various requirements for water and decrease the degradation and loss of wetlands, protect and re-establish their ecological integrity and stop the loss of biodiversity [27]. Within the context of wetland ecosystem health, an understanding of environmental flows can provide a better understanding of the changing nature of wetland landscapes. The outcomes from this study could contribute to the establishment of ecological restoration policies and environmental protection strategies for the Mursidabad district.

2. Materials and Methods
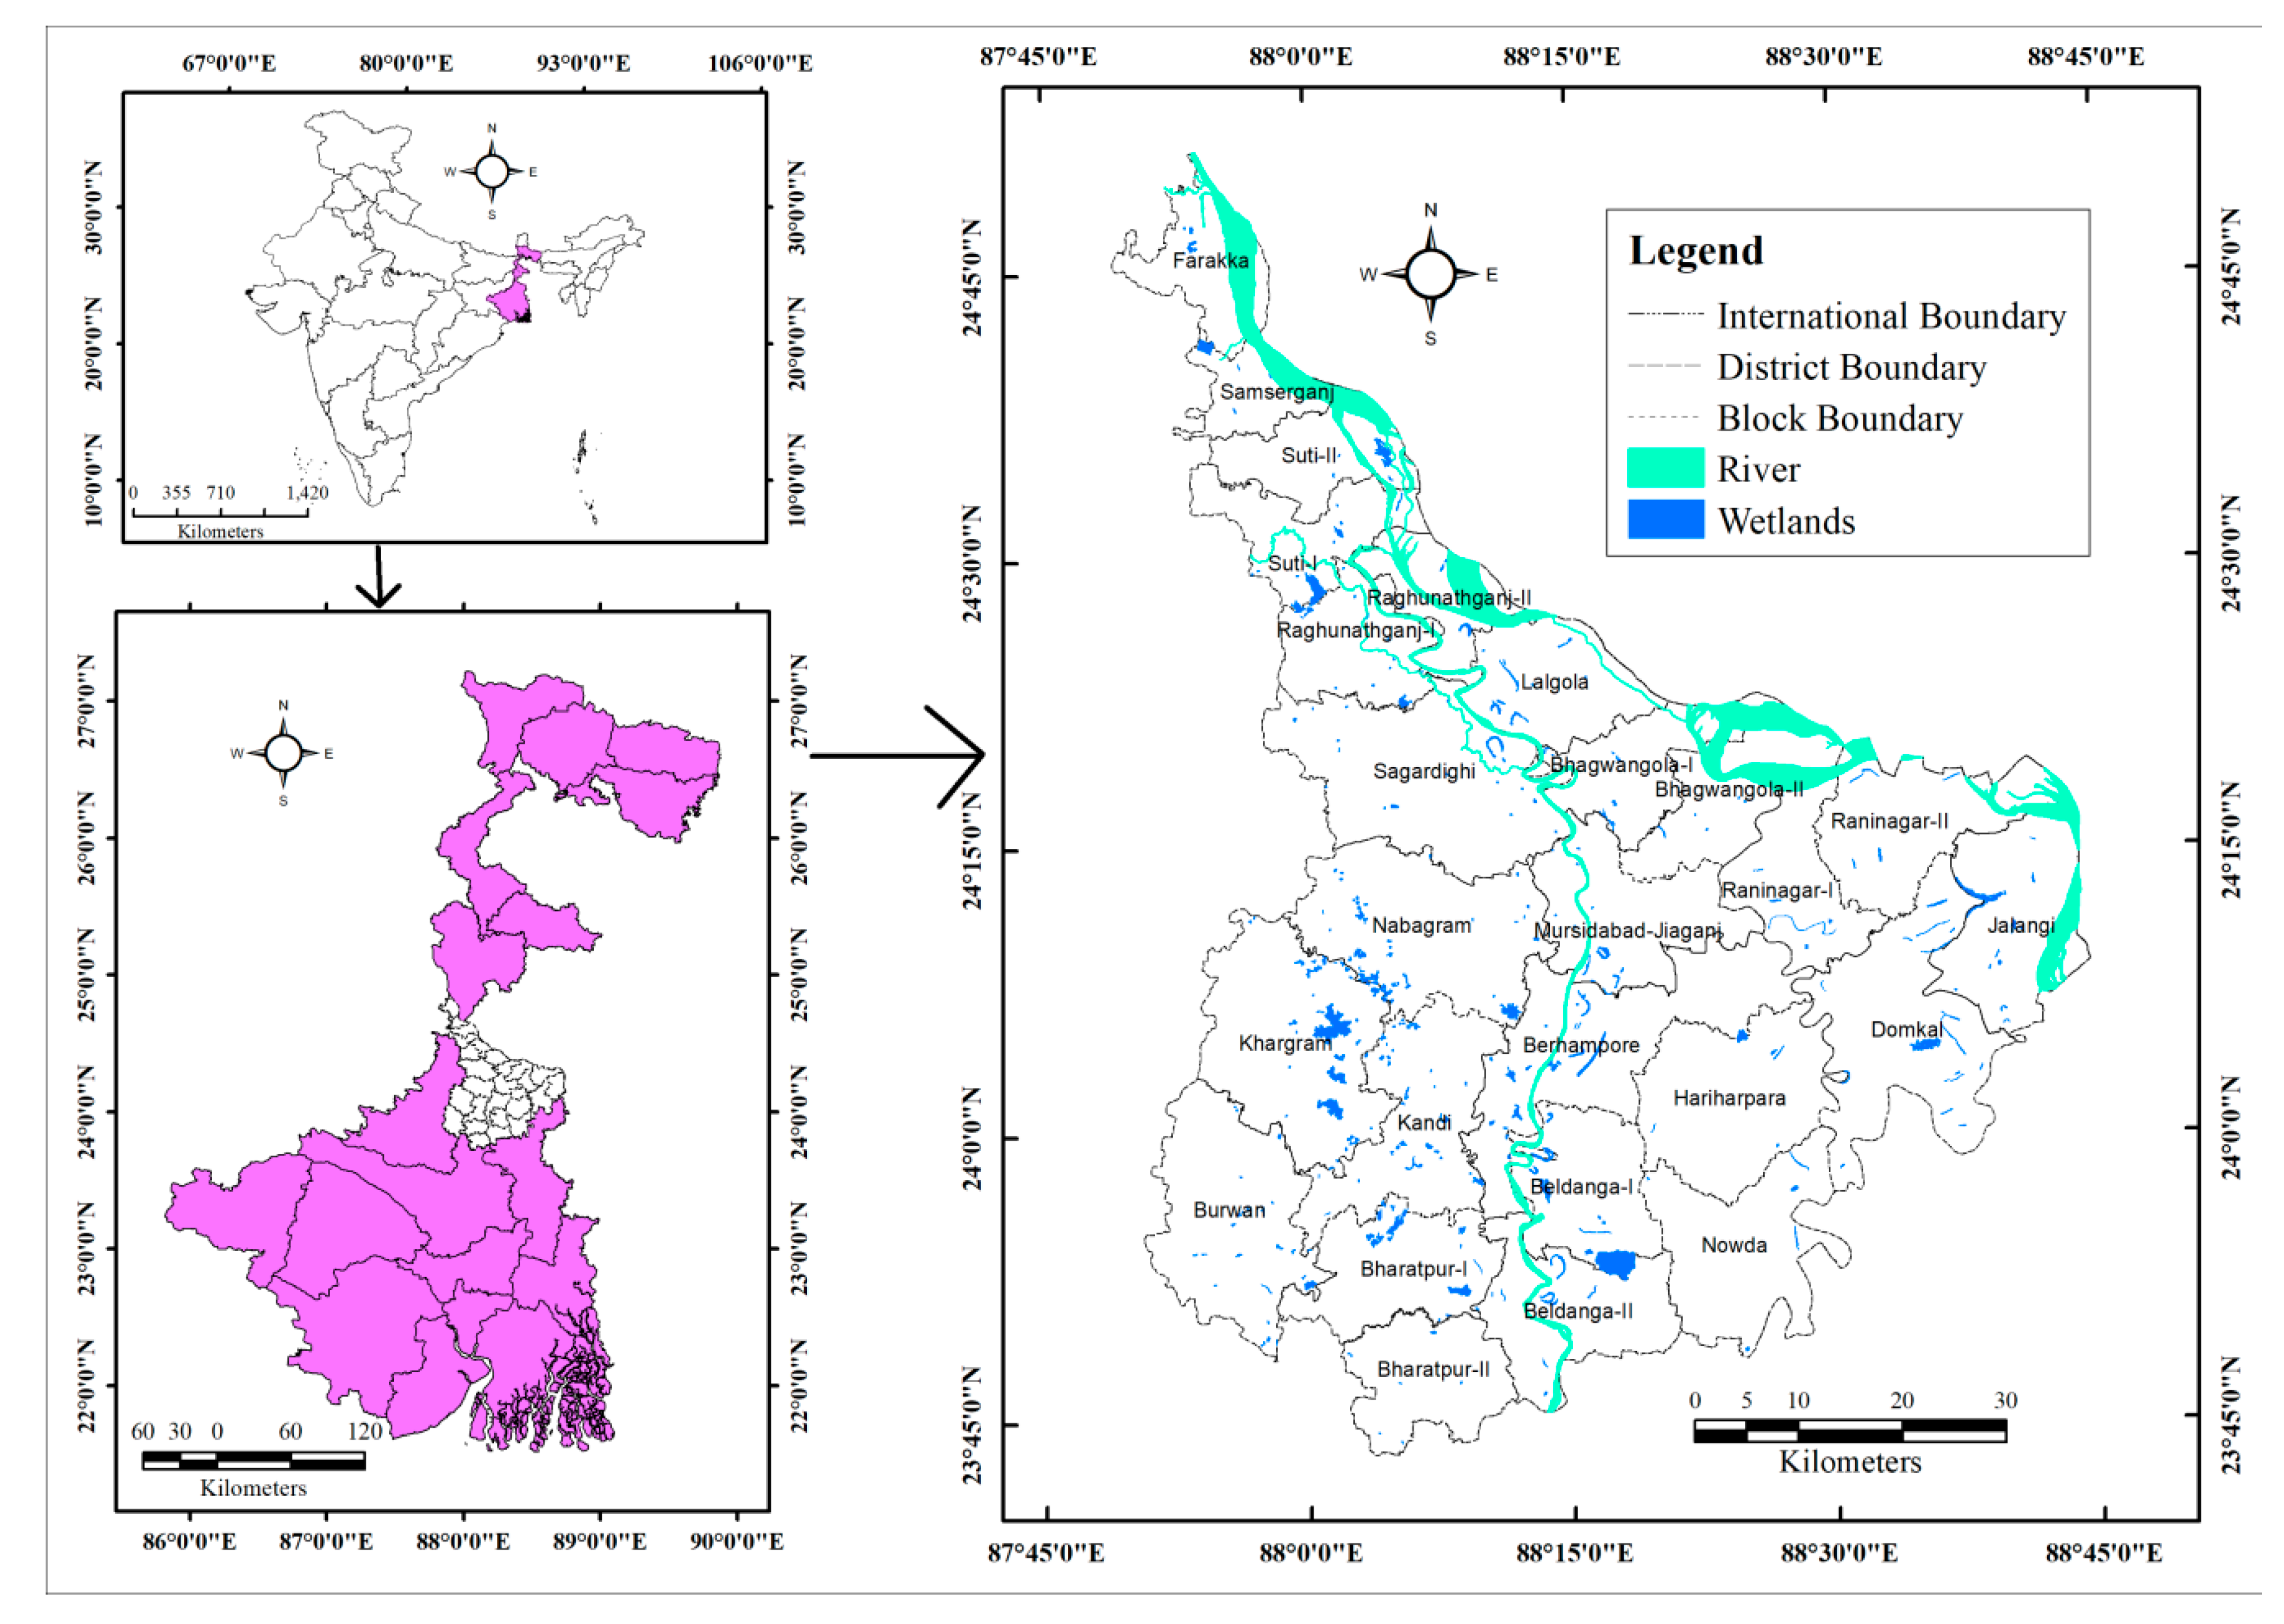
2.1. Study Area

The study area includes the Mursidabad district of West Bengal in India between 87°48′50.03″ E to 88°44′47″ E and 23°43′5.7″ N 24°51′15.6″ N (Figure 1). It comprises 26 blocks, with 5 sub-divisions, namely Berhampore, Kandi, Jangipur, Lalbagh and Domkal. The total geographical area of the Mursidabad district is about 5324 km2. The total population is 7,103,807 and the average population density 1334 persons per square kilometre in 2011. The river Bhagirathi divides this district into two zones viz. the west part or Rarh and the eastern part or Bagri. The structure and texture of the soil of the two zones are different. The Rarh has a slightly undulating topography, having a gentle slope from west to east with clay and reddish lateritic clay soil. The Bagri is generally of the alluvial type, with a relatively light texture and low in organic carbon content. The Mursidabad district is characterized by a moist sub-humid climate with precipitation is about 140 cm/year. The Mursidabad district has many types of wetlands, such as lakes, ponds, rivers, riverine areas, ox-bow lakes, waterlogged areas, reservoirs, etc. In the Murshidabad district, the Ganga–Padma and Bhagirathi rivers are two Himalayan-source rivers that are characterized by being shallow braided to meandering; they also control the drainage system of the Murshidabad district. The continuous shifting of these rivers creates numerous meander scars, paleo-channels, cut-off meanders, etc.

2.2. Data and Methods

2.2.1. Data Resources and Processing

Our study involved a systematic approach for data collection for deriving the wetland health indicators. A block-level vector map of the Mursidabad district was prepared from the administrative atlas of West Bengal; the statistical data included the population density and urbanization growth rate for all administrative units, collected from census of India 2001 and 2011. The Google Earth road network data map was used to prepare the road density wetland area, wetland types and various landscape indices, including the patch richness (PR), patch density (PD), largest patch index (LPI) and landscape diversity index (LDI), which were the spatial-scale data used for this study. A total number of seven Landsat ETM+ satellite images from 2001 to 2020 were used as the data sources. We used the ecosystem function value index for the calculation of ecosystem service value in the wetlands of the Mursidabad district [28].

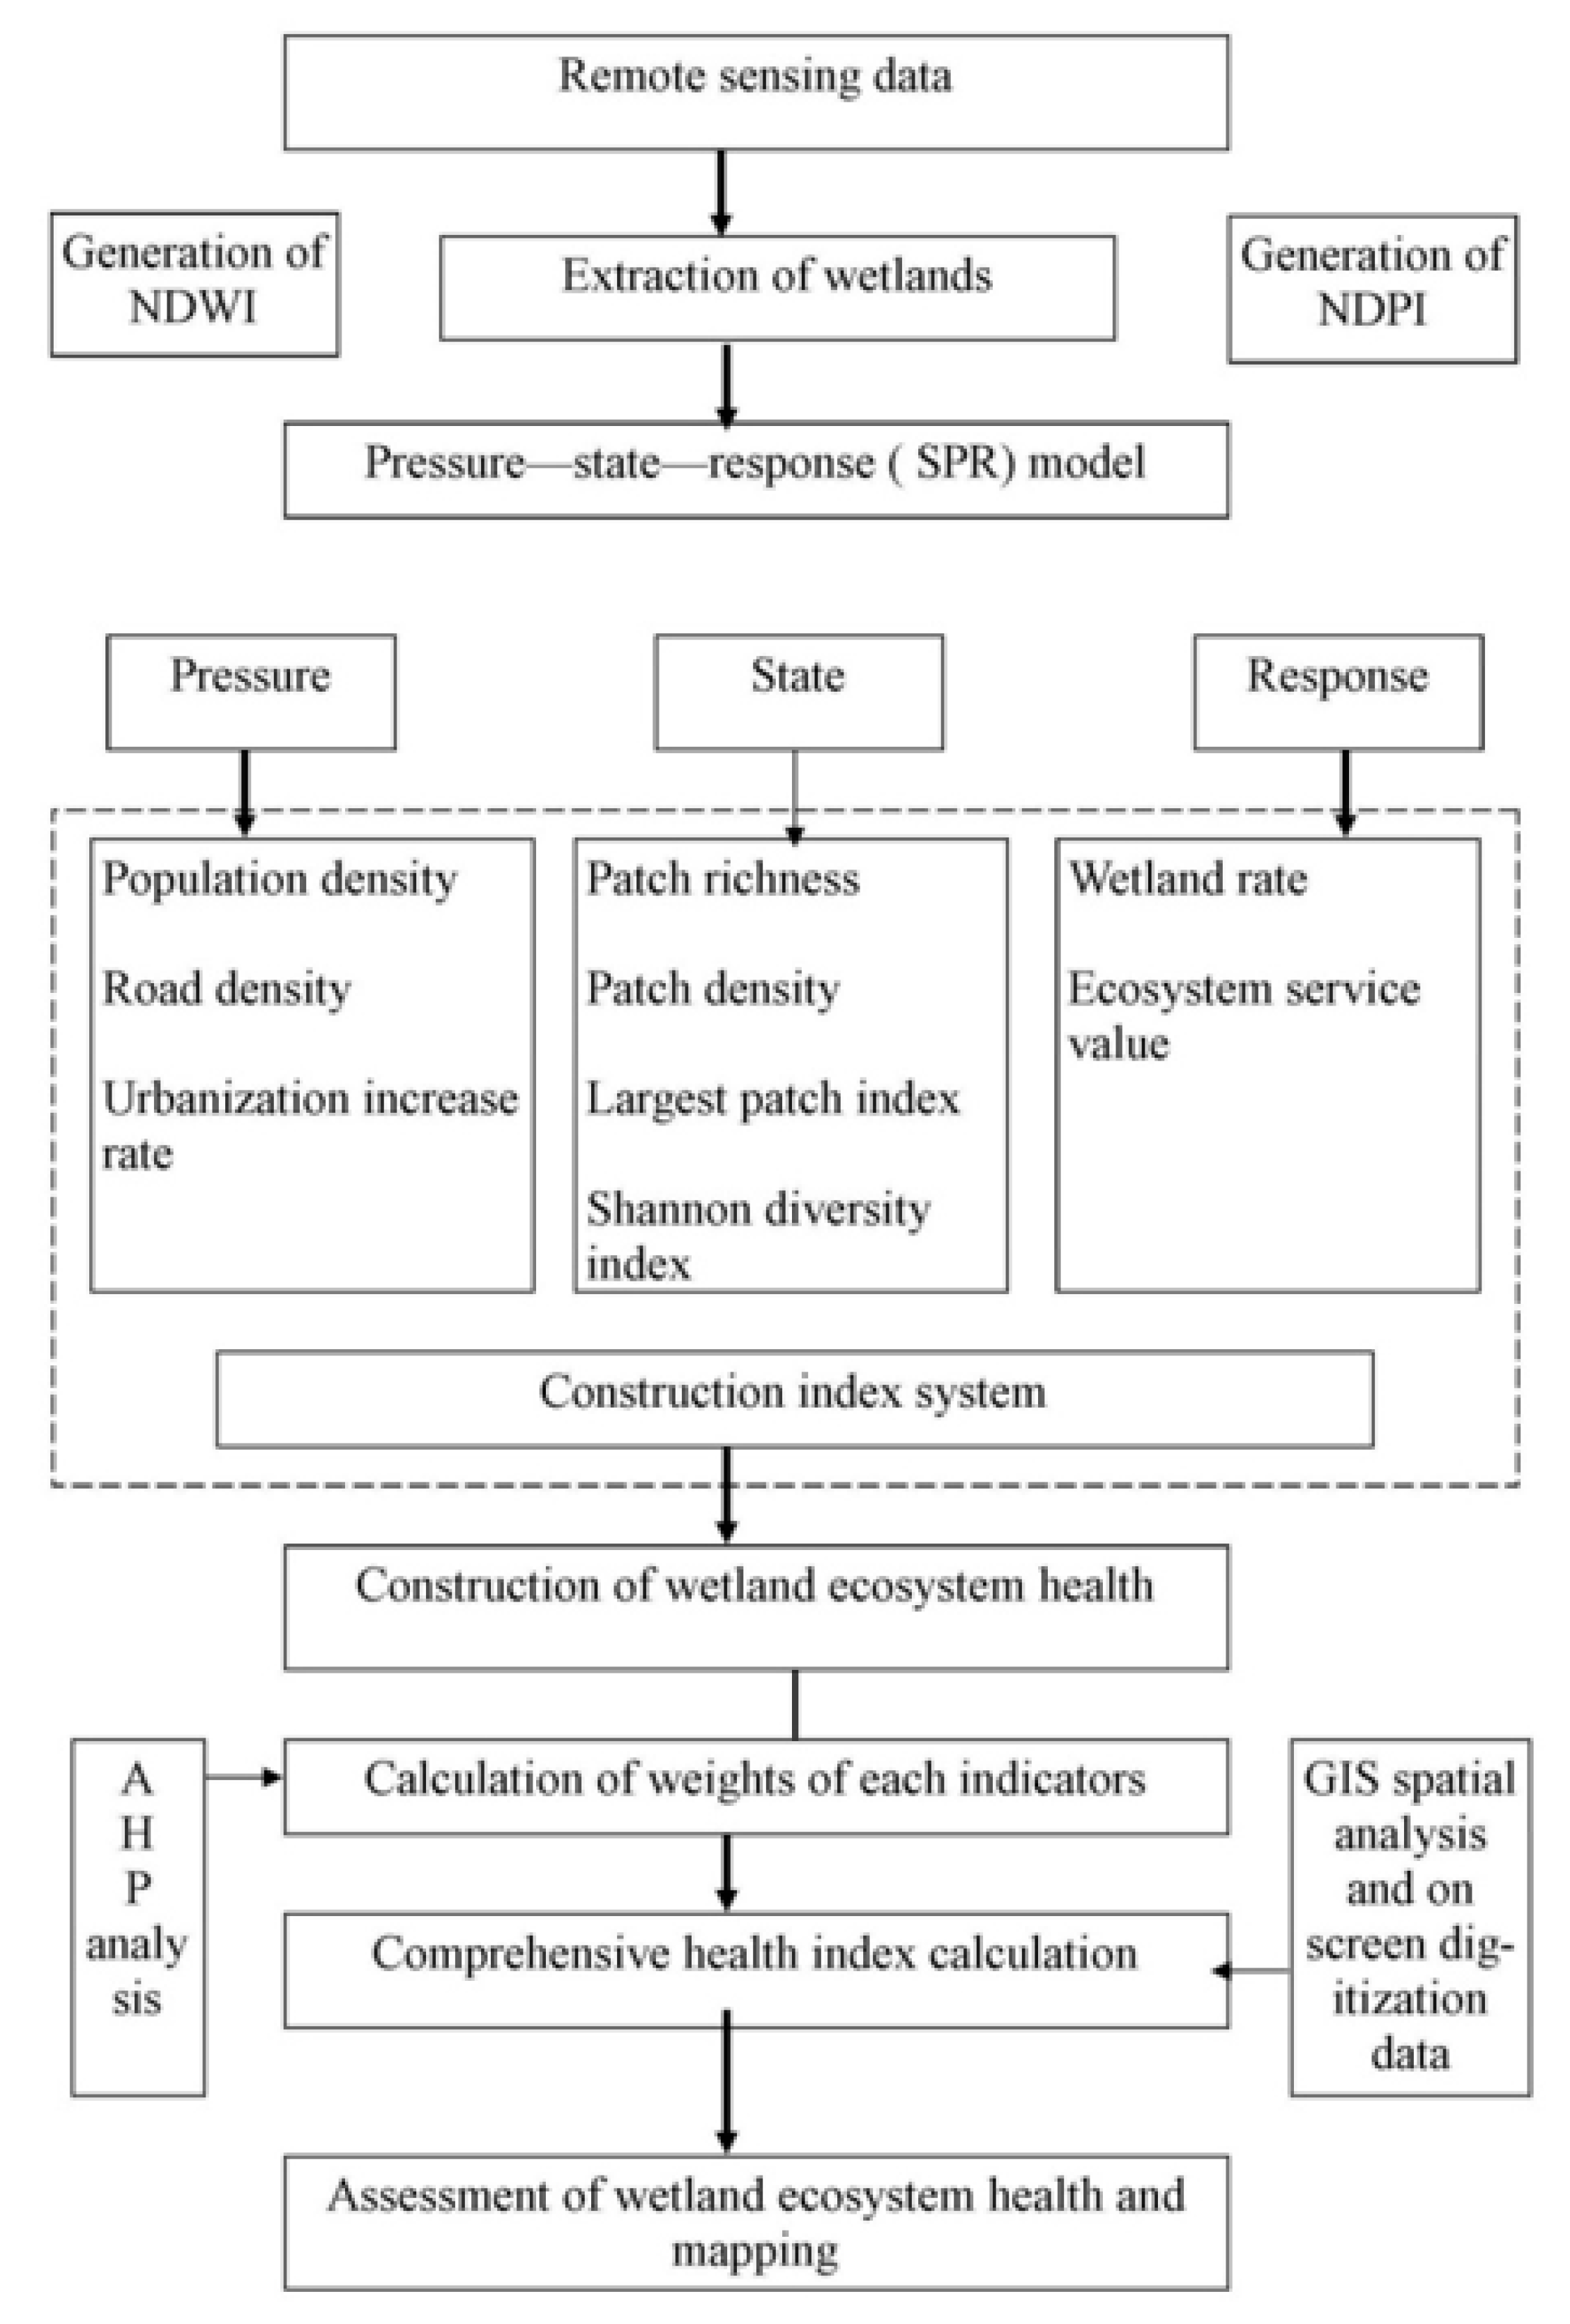
2.2.2. Assessment of Wetland Ecosystems Health

Several researchers [29,30] introduced the PSR model and used it for the establishment of the wetland ecosystem health in the Mursidabad district. The PSR model is based on the cause–effect relationship between human pressures on the ecological environment cause and the degradation of the wetland ecosystem. Particularly, it can be used when various pressures on the wetland environment, like human exercises, human unconscious use of modes and economic activities, could transform the characteristic of the natural habitat as well as the resources. However, humans have useful alternatives to mitigate the risk factors through sustainable practice of economic activities and environmental policies for the restoration of wetland ecosystem health. The PSR model separates the indicators into three groups of categories: (1) the “pressure” indicator has a destructive factor that reflects the human activities and leads to degradation of ecosystem health; (2) the “state” indicator, which illustrates the structural status and functional processes of the wetland ecosystem; and (3) the “response” indicator, which measures its vigour, elasticity and ecological service. With the consideration of the data sources, we chose nine indicators in total for the integrated evaluation of the health status of the wetland ecosystem. The indicators were selected to consider every block in the Mursidabad district and for computation of the wetland ecosystem health index by using the analytical hierarchy processes (AHP) method. The flow chart of the assessment of wetland ecosystem health in the Mursidabad district is shown on Figure 2.

2.2.3. Wetland Classification

Identification of the wetlands and categorizing them were the preliminary stages of this study. In this study, over 2.25 hectares in area of wetlands were extracted based on remote sensing data from 2001 to 2020. These nine Landsat images covered the whole study area. Before preparing the Normalized Difference Water Index (NDWI), atmospheric and radiometric corrections of all 9 Landsat images were done using ENVI software, version (Harris Geospatial Solutions, Boulder, CO, USA). After the calibrations, ArcGis software, version 10.3.1 (Esri, Redlands, CA, USA) was used for calculation and mapping. The NDWI was calculated using Equation (1).
NDWI = (RGreen − R NIR)/(RGreen + R NIR)
McFeeters et al. [31] used this equation to extract the open waterbodies from the multispectral satellite images. The inland open waterbodies retain continuity with the parent river either for the whole year or at least during the rainy season; however, we know that wetlands include the open waterbodies and small ponds. For identifying those pond areas, the NDPI equation was applied (Equation (2)).
NDPI = (R MIR − RGreen)/(R MIR + RGreen)
In these two equations, the NIR (Near Infra-Red), MIR (Medium Wave Infra-Red) and Green bands of the LANDSAT data were used. The values of the NDWI range between −1 and 1, where a positive value indicates waterbodies. High NDWI values correspond to a high vegetation water content and high vegetation fraction cover. A low NDWI value corresponds to a low vegetation water content and low vegetation fraction cover. The generated NDPI for the image has values ranging from −0.6 to +0.8. Google Earth data were used for the validation of the common waterbody area.
WI Y1 = (NDWI + NDPI) − NWp
where, WI Y1 is the wetland inventory of the initial year (here 2001), NDWI and NDPI are the results of Equations (1) and (2) and NWp is the non-water pixels that are removed from the combined image of that particular year. The waterbody pixels value is above zero and below zero in case of non-waterbody pixels. The wetland inventory was done after the binarization of the NDWI and NDPI with respect to zero. Thus, all the values above zero were changed to 1 and below zero to zero. The same procedure was applied for the years 2013 and 2020.
After the extraction, the wetlands were classified into six categories based on the Indian Space Research Organization (ISRO) National Wetland Atlas classification scheme [22,23]: natural lakes, natural ponds, ox-bow type or cut-off meander, natural waterlogged, natural riverine and man-made ponds.

2.2.4. Indicator System Establishment

This systematic study involved the selection of indicators and standardizing them to generate a score that describes the actual scenario of the study area on a particular topic. To build the systematic and scientific indicator arrangement of the PSR model is very complicated, on the grounds that the units of selecting the indicators are unique in nature and are difficult to covert to the same. To reach the goal, three pressures, four states and two response indicators were selected (Table 1). To unify the indicators, we followed the max–min normalization method to scale the data ranging from 0 to 1.
The pressure factors incorporate the direct (economic activities) and indirect (pollution emission for resource use) pressure for measuring wetland utilization intensity and wetland resources loss within a specific time span. This pressure intensity is brought about by the density of the population, the road density and the pressure of the urbanization rate. It is reasonable to acknowledge that a high population density has a greater negative impact on wetland ecosystem health [21,32]. Road networks force a reduction in wetland area [32,33]. After the review of previous research papers [7,12,20,21], we chose population density, road density and pressure of urbanization to indicate wetland ecosystem health. The road density was calculated as the road length per square kilometre of area. The pressure of urbanization growth rate was calculated by subtracting the urbanization rate from a previous census year’s urbanization rate.
The state factors highlight the actual ecological condition of the wetland ecosystem, which were utilized to define the structural integrity and functional complexity of the wetland environment under pressure. To know the structural and spatial information of a wetland landscape, various indexes were chosen based on previous studies [20,21,34,35]. Patch richness (PR) is one of the most important elements of the landscape structure in light of the fact that the landscape elements present in a landscape can have a significant influence on a variety of ecological processes. Patch density (PD) represents the degree of landscape fragmentation of different types of landscapes. The smaller value of PD denotes greater wetland fragmentation and more isolated wetland patches. The largest patch index (LPI) was selected from the patch-type levels as a measure to know the impact of the largest patch on that landscape area. Therefore, the LPI value was calculated in percentage. The Shannon diversity index (SHDI) is a very common indicator that has been used to measure diversity in community ecology [35,36,37], but here we applied it at the landscape level because it was useful to characterize wetland diversity in a wetland landscape. An SHDI = 0 means the landscape contains only one patch and has no diversity. The SHDI increases when the number of patches increase or the proportional distribution of an area among the patch types becomes more equitable. River density, slope of the topography and climatic factors were not included as a state indicator, because the characteristics of these indicators were more or less all the same from 2001 to 2020. In this study, PR, PD, LPI and SHDI were calculated by using ArcGIS software. We chose wetland degradation rate and ecosystem service value as the response factors. Xie et al. [38] calculated the ecosystem service value of per hectare area of the water bodies. The researchers considered the economic contribution of the wetlands in climate regulation, water supply, soil formation and retention, waste treatment, biodiversity protection and flood control.
The patch richness (PR) was calculated using Equation (4):
PR = m
where m is the number of patch category.
The patch density (PD) was calculated as Equation (5):
PD = ni/A
where ni is the area (ha) of patch category (class) i and A is landscape area in hectares.
The largest patch index (LPI) was calculated as Equation (6):
LPI = aij/A
where aij is the area (ha) of the largest patch and A is landscape area in hectares.
The Shannon diversity index (SHDI) was calculated using Equation (7):
SDi = {(n − 1)/i)}
where n is the number of patch types (Class i), and i is the number of patch types in the landscape.
Each score in the analytic hierarchy process (AHP) matrix (Table 2) describes the relative significance of an indicator in a row contrasted with an indicator in a column. We have used the functional scale of the absolute numbers given by T.L. Saaty in 2008 [39], where a value of 1 means that the indicator in the row is equally important to the indicator in the column, while the value of 9 means that the indicator in the row has extreme importance over the indicator in the column.

2.2.5. Determination of Indicator Weights and Assessment Methods

After the indicator system’s establishment, we applied the AHP method to determine the weight of the indicators. The AHP is a conventional, popular, multi-criteria decision-making method, as proposed by Thomas L. Satty, an expert in the field of operational research in the 1970s [39,40]. According to their observations, the AHP method is for the most part followed in four phases: (1) the deterioration of a choice issue and the development of a hierarchical model of the criteria and choice variations influencing the solution of the problem; (2) the pairwise comparison of the criteria and the generation of vectors for the weights of individual criteria; (3) the pairwise comparison of the choice variations in relation to individual criteria and the generation of local weight vectors for those variations comparable to the criteria; and (4) determination of the vector of the worldwide executions of choice variations organized in relation to the contribution of the variations to achieving the goal of the definitive choice issue.
In the present study, the AHP analysis was done by using the AHP priority calculator, which is open access and available via the website (https://bpmsg.com). By completing these steps, we have calculated the priority and weight of all the selected indicators. The correlation matrix and weight of each indicator using the AHP are given in Table 2.
To generate the wetland health score, the weight of each indicator is multiplied by its respective standardized value (Equation (8)):
WHI = Wi × Ci
where WHI is the value of the wetland ecosystem health, Wi is the weight of the ith indicator and Ci is the standardized value of the ith indicator.

3. Results

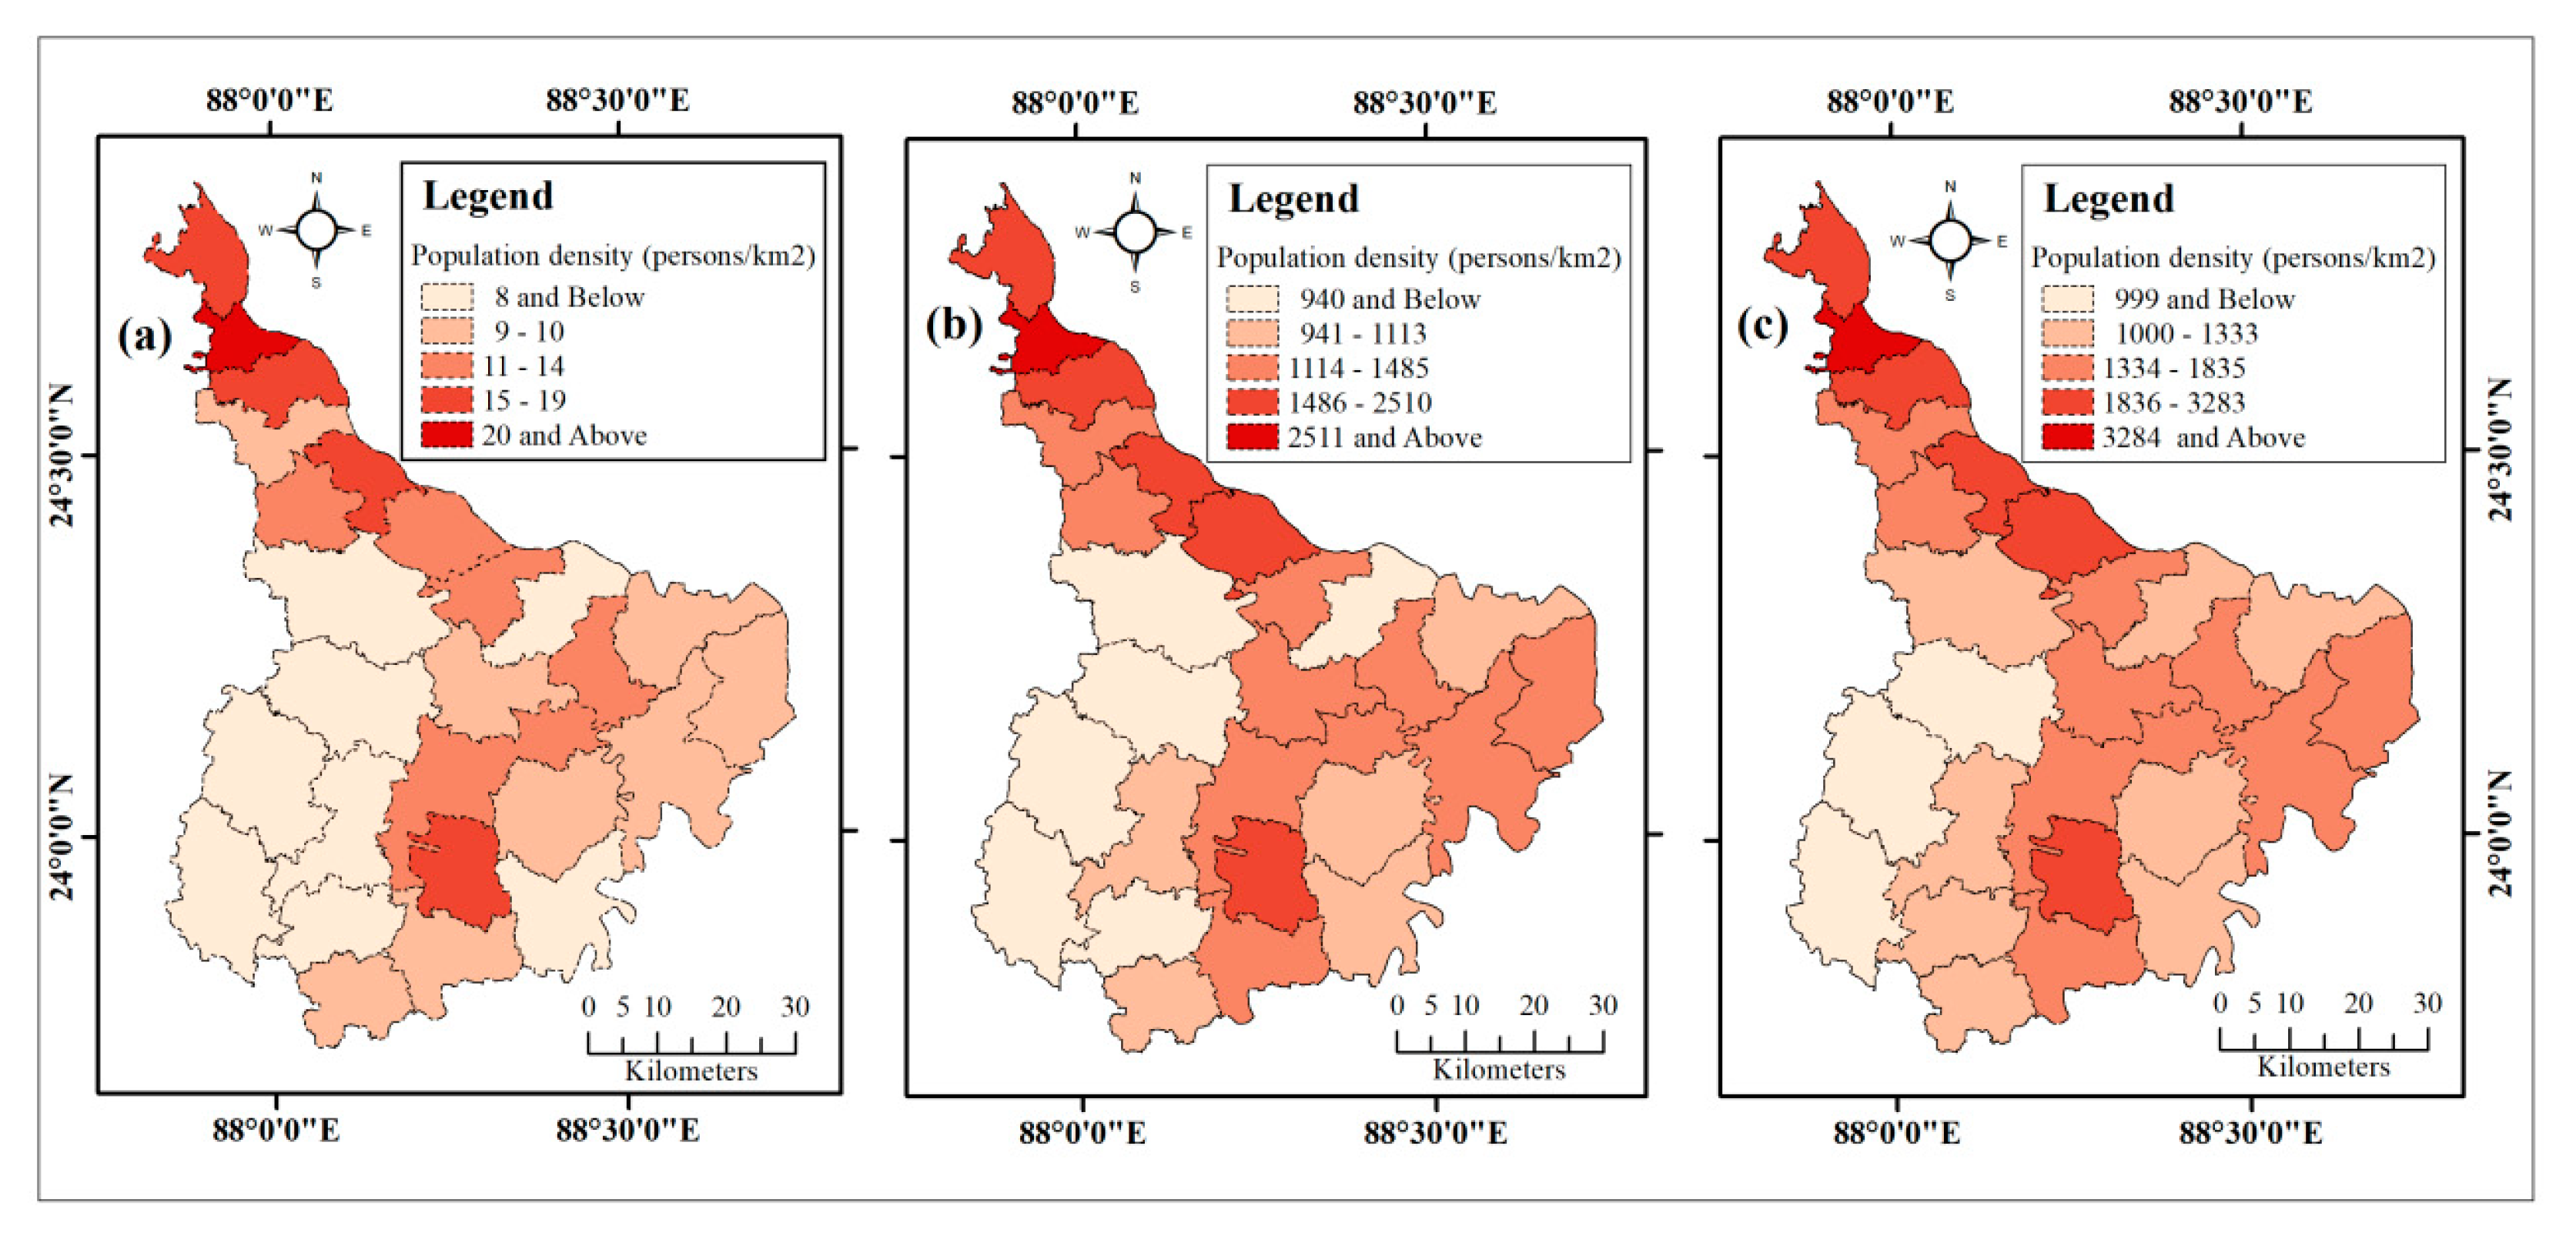
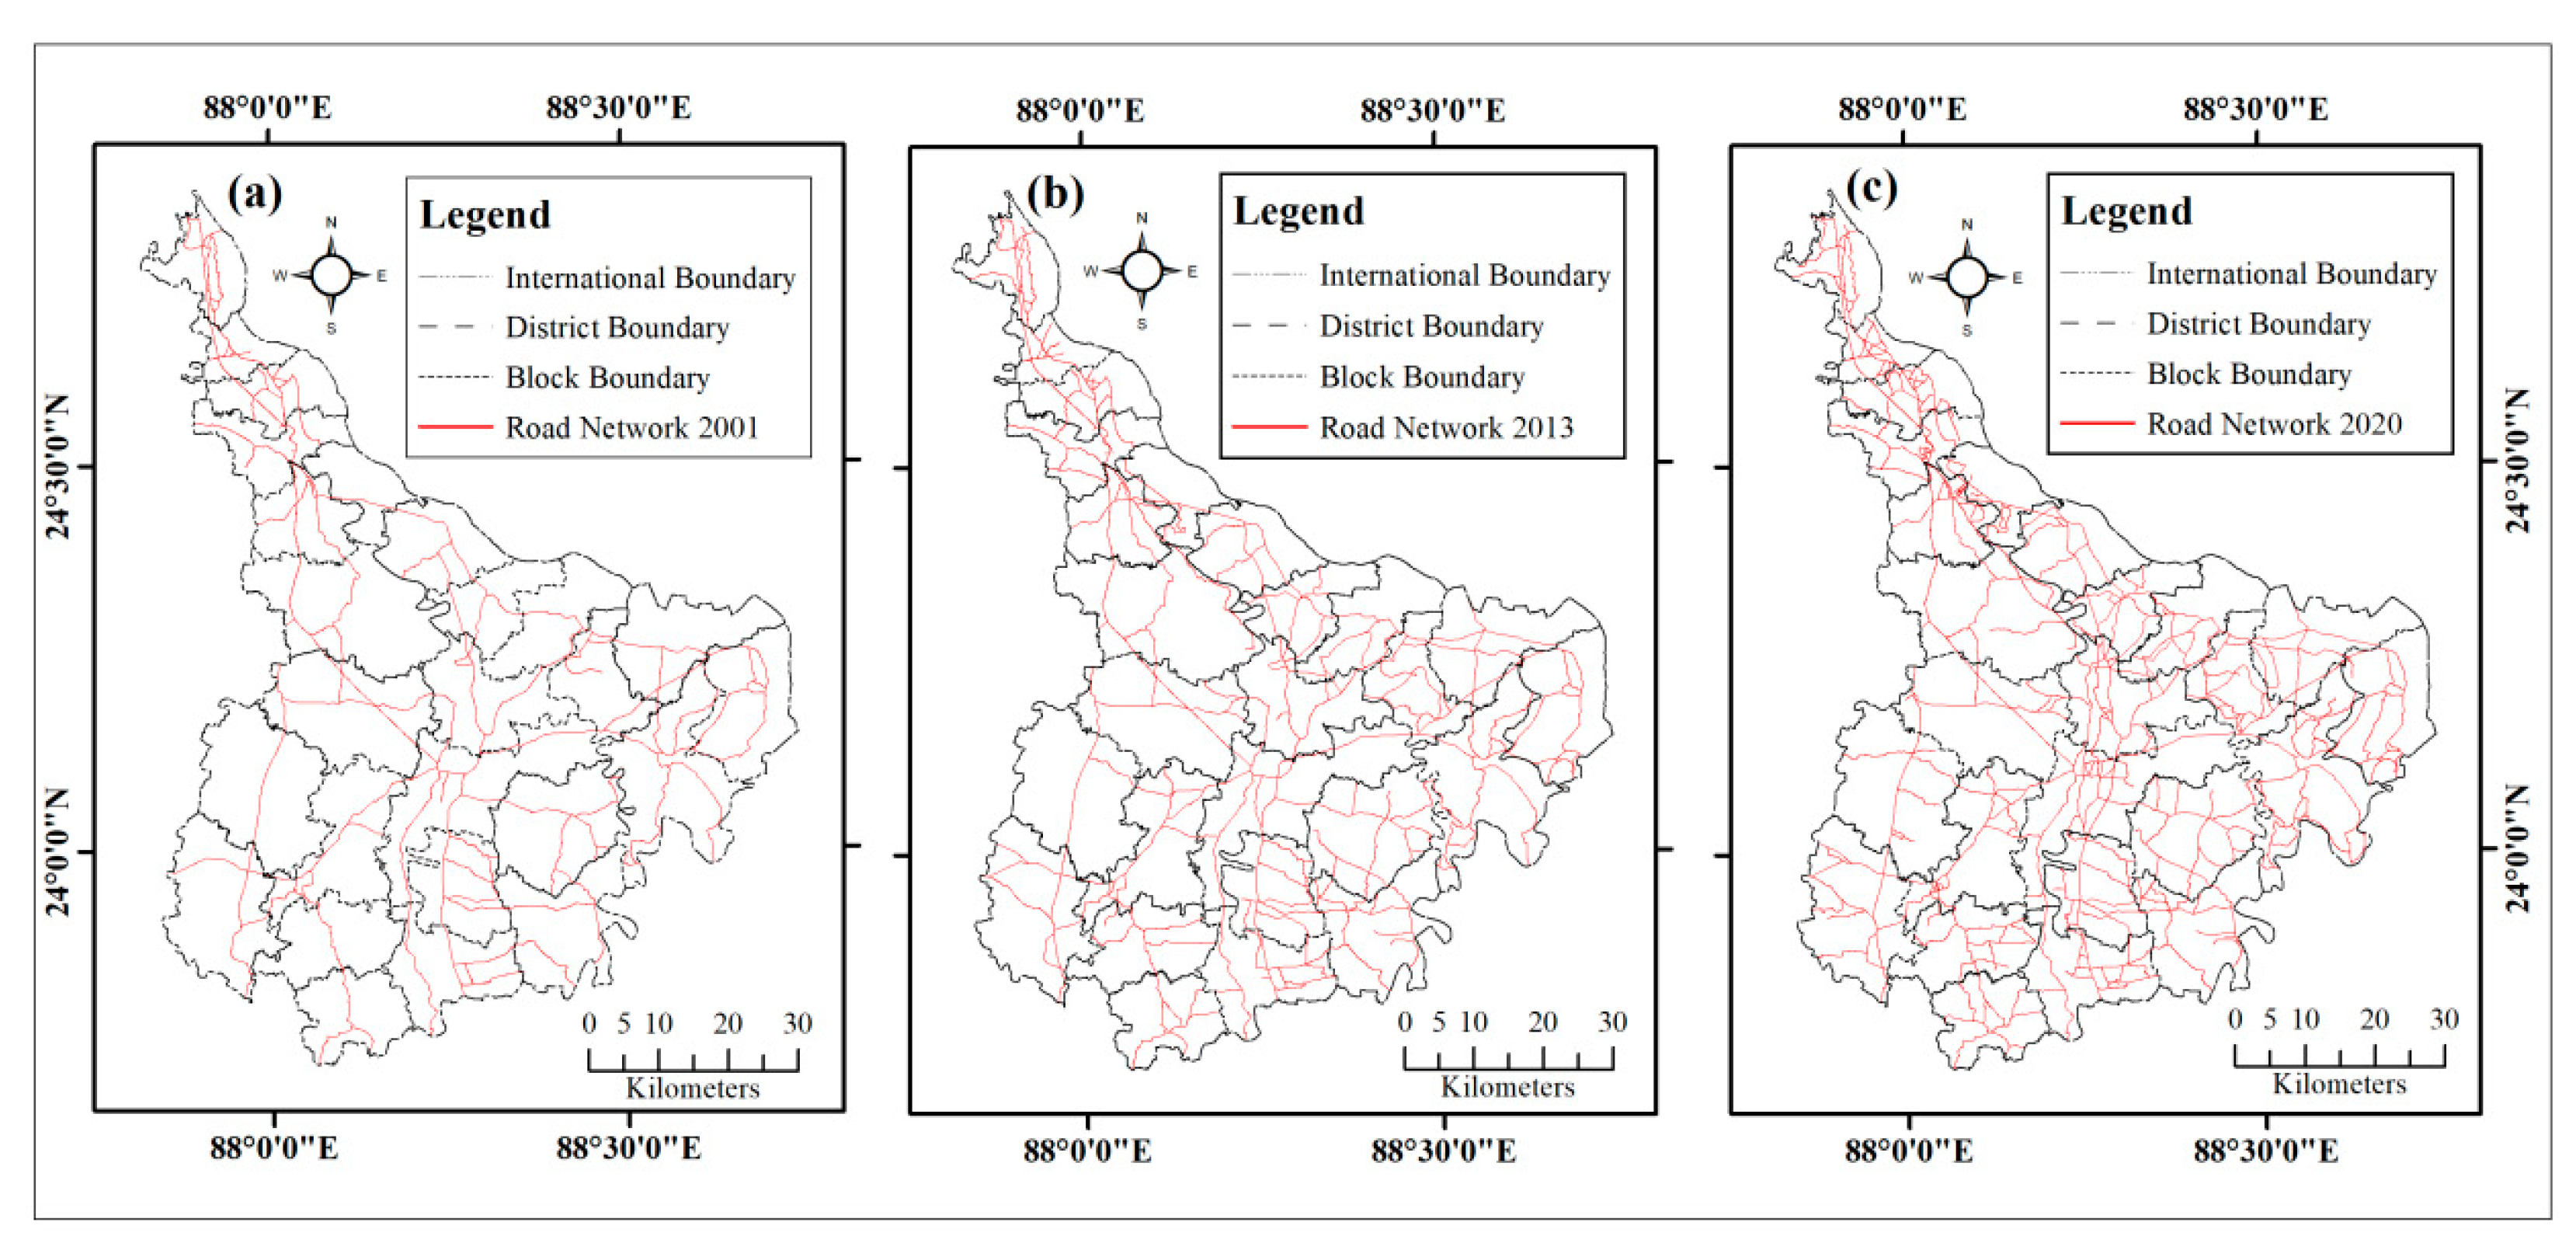
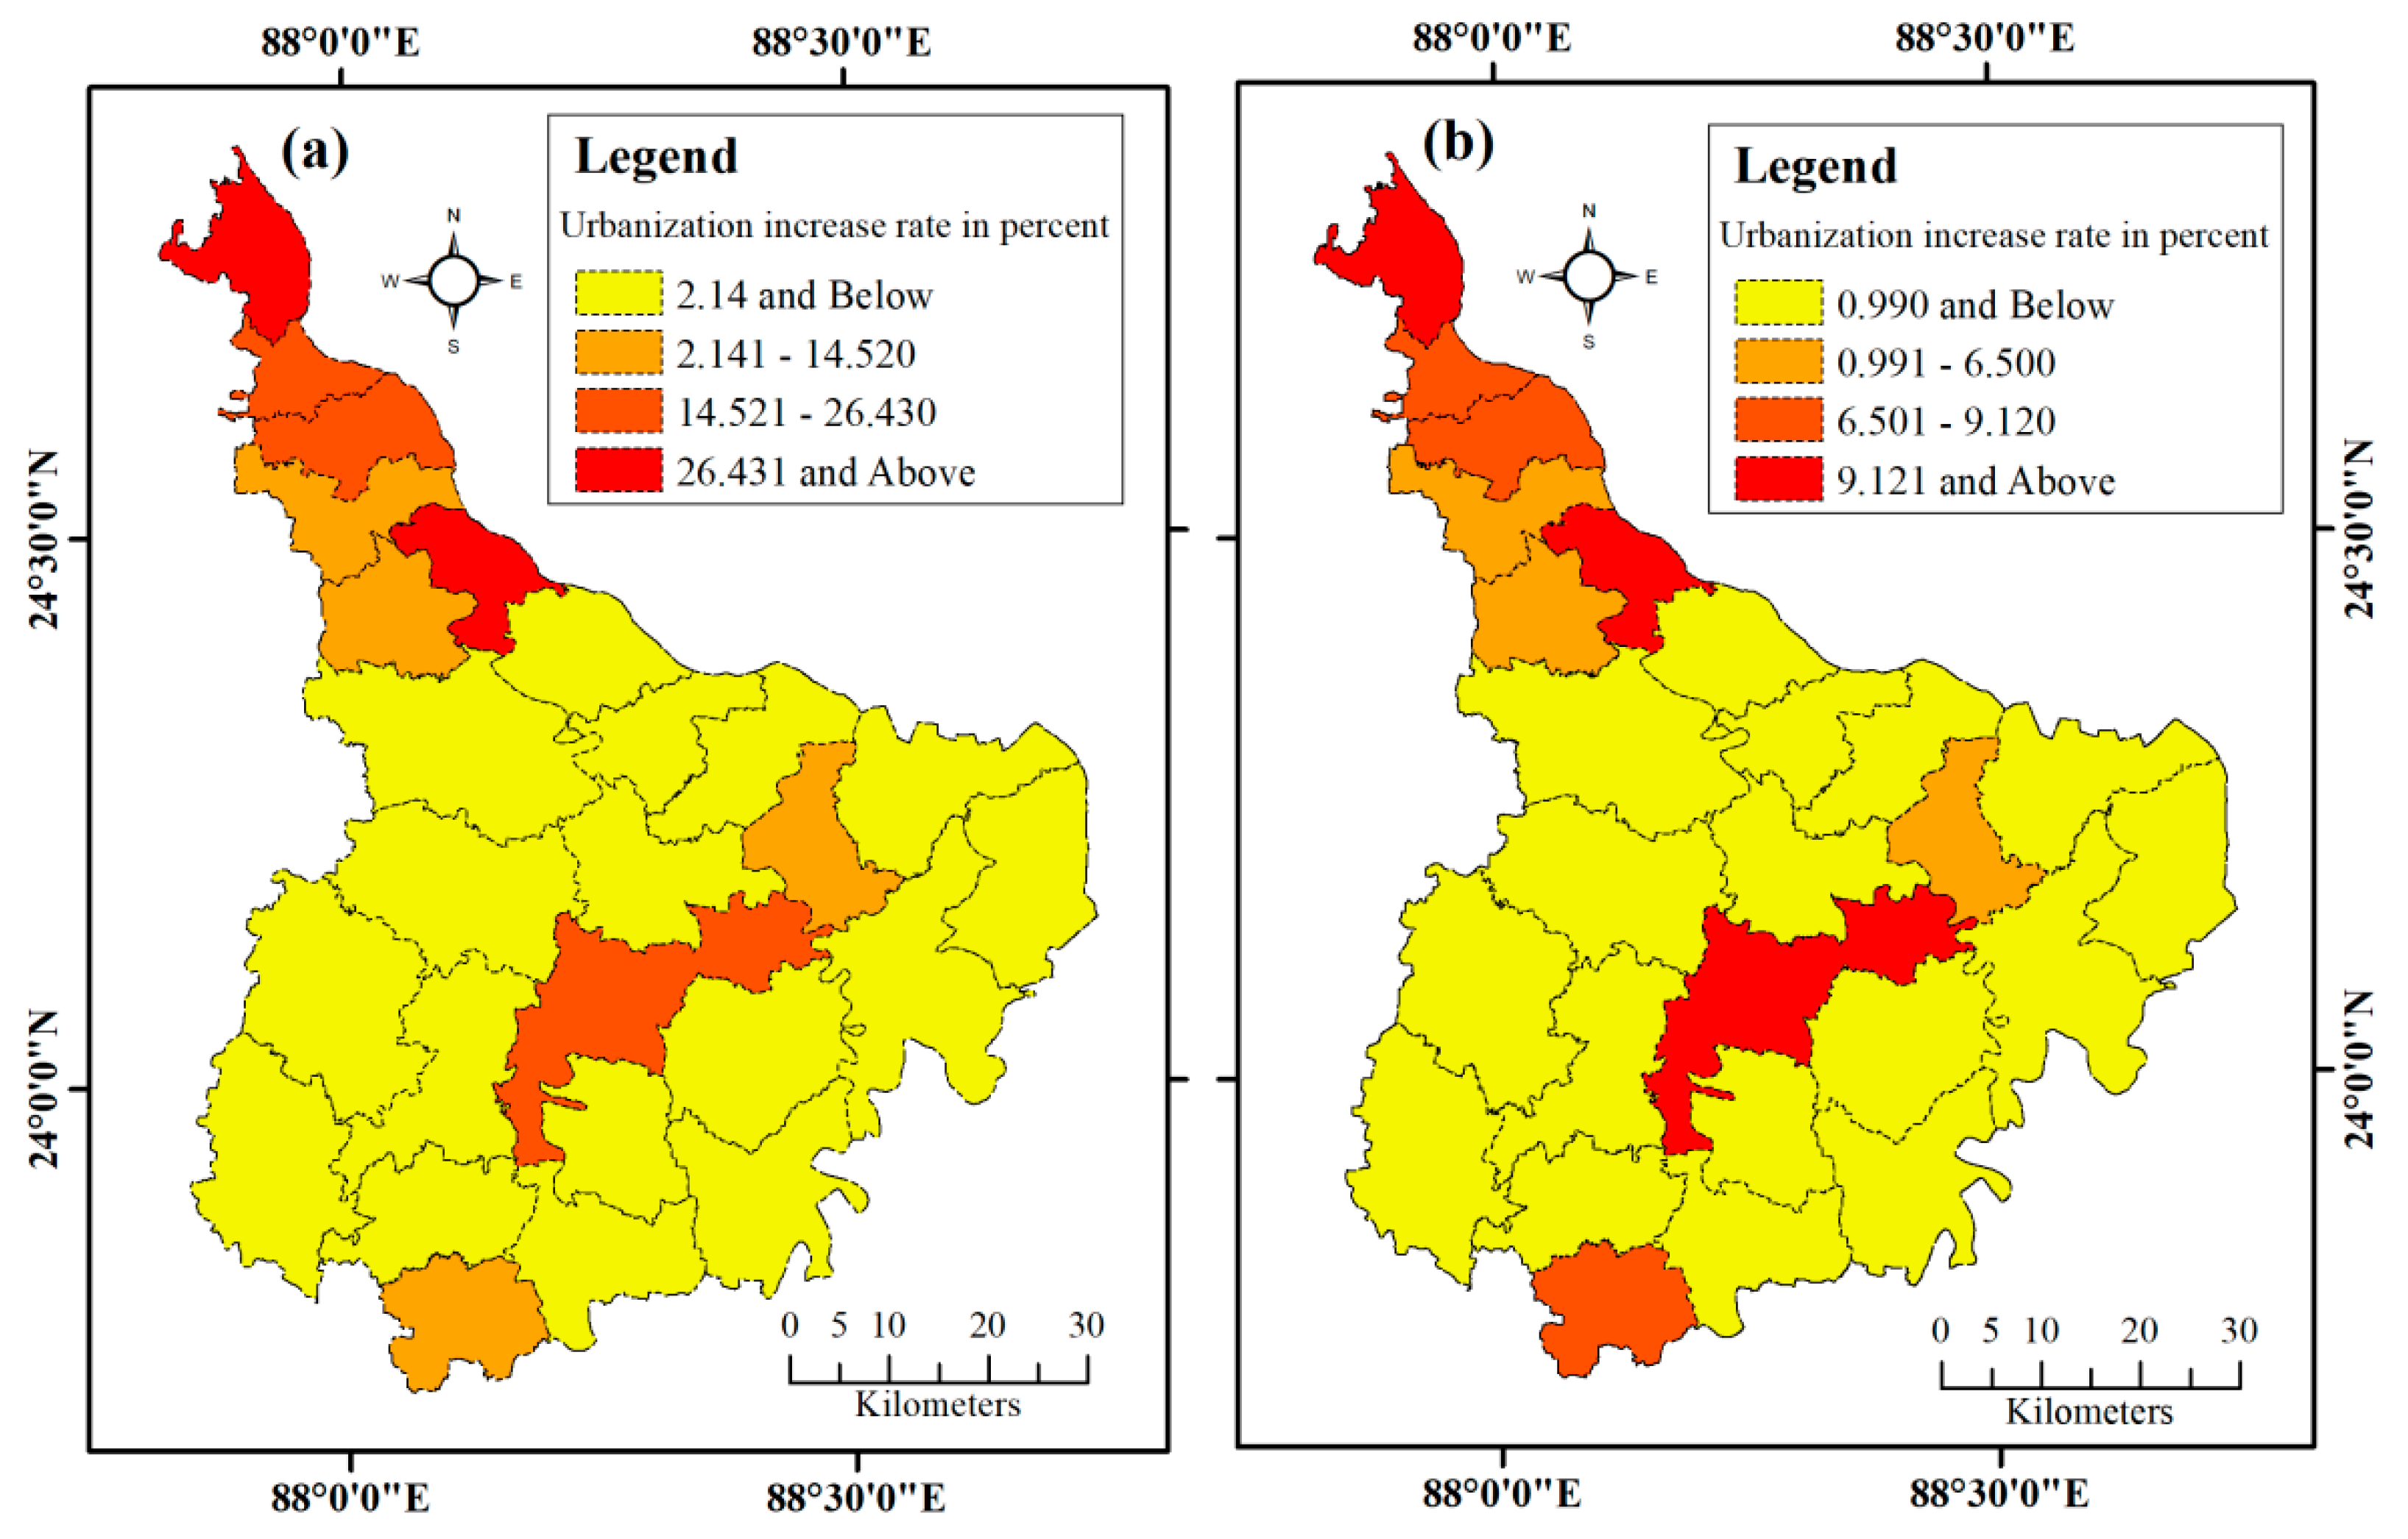
3.1. Wetland Ecosystem Pressure

The external interferences have slowly downed the direction of the wetland biological system’s progression. The external interferences due to the unorganized human activities are disturbing the forward succession processes. Subsequently, it is hard to actualize effective management measures and the ecological degradation only accounts for a small proportion of the wetlands. The selection of pressure indicators can alert us to the nature and trends of the wetland degradation process.
In a recent paper, the authors showed that most rural and urban communities have heavily used their wetland resources [41]. In another work, it was determined that demographic factors have influenced the household use of wetlands, and this greater household use of wetlands is responsible for the degradation of wetland ecosystem health in West Bengal [25]. According to the 2011 census, the population density was around 1334 persons per square kilometre area. From 2001 to 2011, the population growth rate was 21.09%. In terms of the population growth rate between 2001 and 2011, the district is residing in the 3rd position in comparison to other districts of West Bengal. As a result, the population density is also gradually increased. Figure 3 shows that the Samserganj block has the highest population density and the Nabagram block has the lowest population density in 2001, 2013 and 2020. It is also observed that the population density increase rate is the highest in the Raghunathganj-II block followed by the Samserganj and Suti-II block in 2001 to 2011 and 2011 to 2020. The population density increase rate is lowest in the Kandi block following by the Bharatpur-I and Burwan block in 2001 to 2011 and 2011 to 2020. The growing population and pressure led to a reduction in wetland area, also as a result of the road density consistently increasing from 2001 to 2020.
The road network has interfered with the wetlands and subsequently damaged them [33]. National highways, state highways, major district road, arterial road, etc., create pressure on ecosystem health. In the Mursidabad district, the road network has been developed from 2001 to 2020, leading to the acquisition and fragmentation of the wetland area. The study shows that the Domkal block has the highest road density and the Raghunathganj-II block has the lowest road density (Figure 4).
In a recent study [42], it was shown that the water of the wetlands has been heavily polluted due to industrial and municipal wastewater discharges. With the increase in urbanization rate, the protection and regulation of ecosystem health is facing many challenges. Figure 5 shows that the urbanization increase rate from 2001 to 2013 and 2013 to 2020 is the highest in the Raghunathganj-II block, followed by Farakka and Samseganj, and the urbanization increase rate from 2001 to 2013 is negative in the Kandi and Mursidabad–Jiaganj blocks.

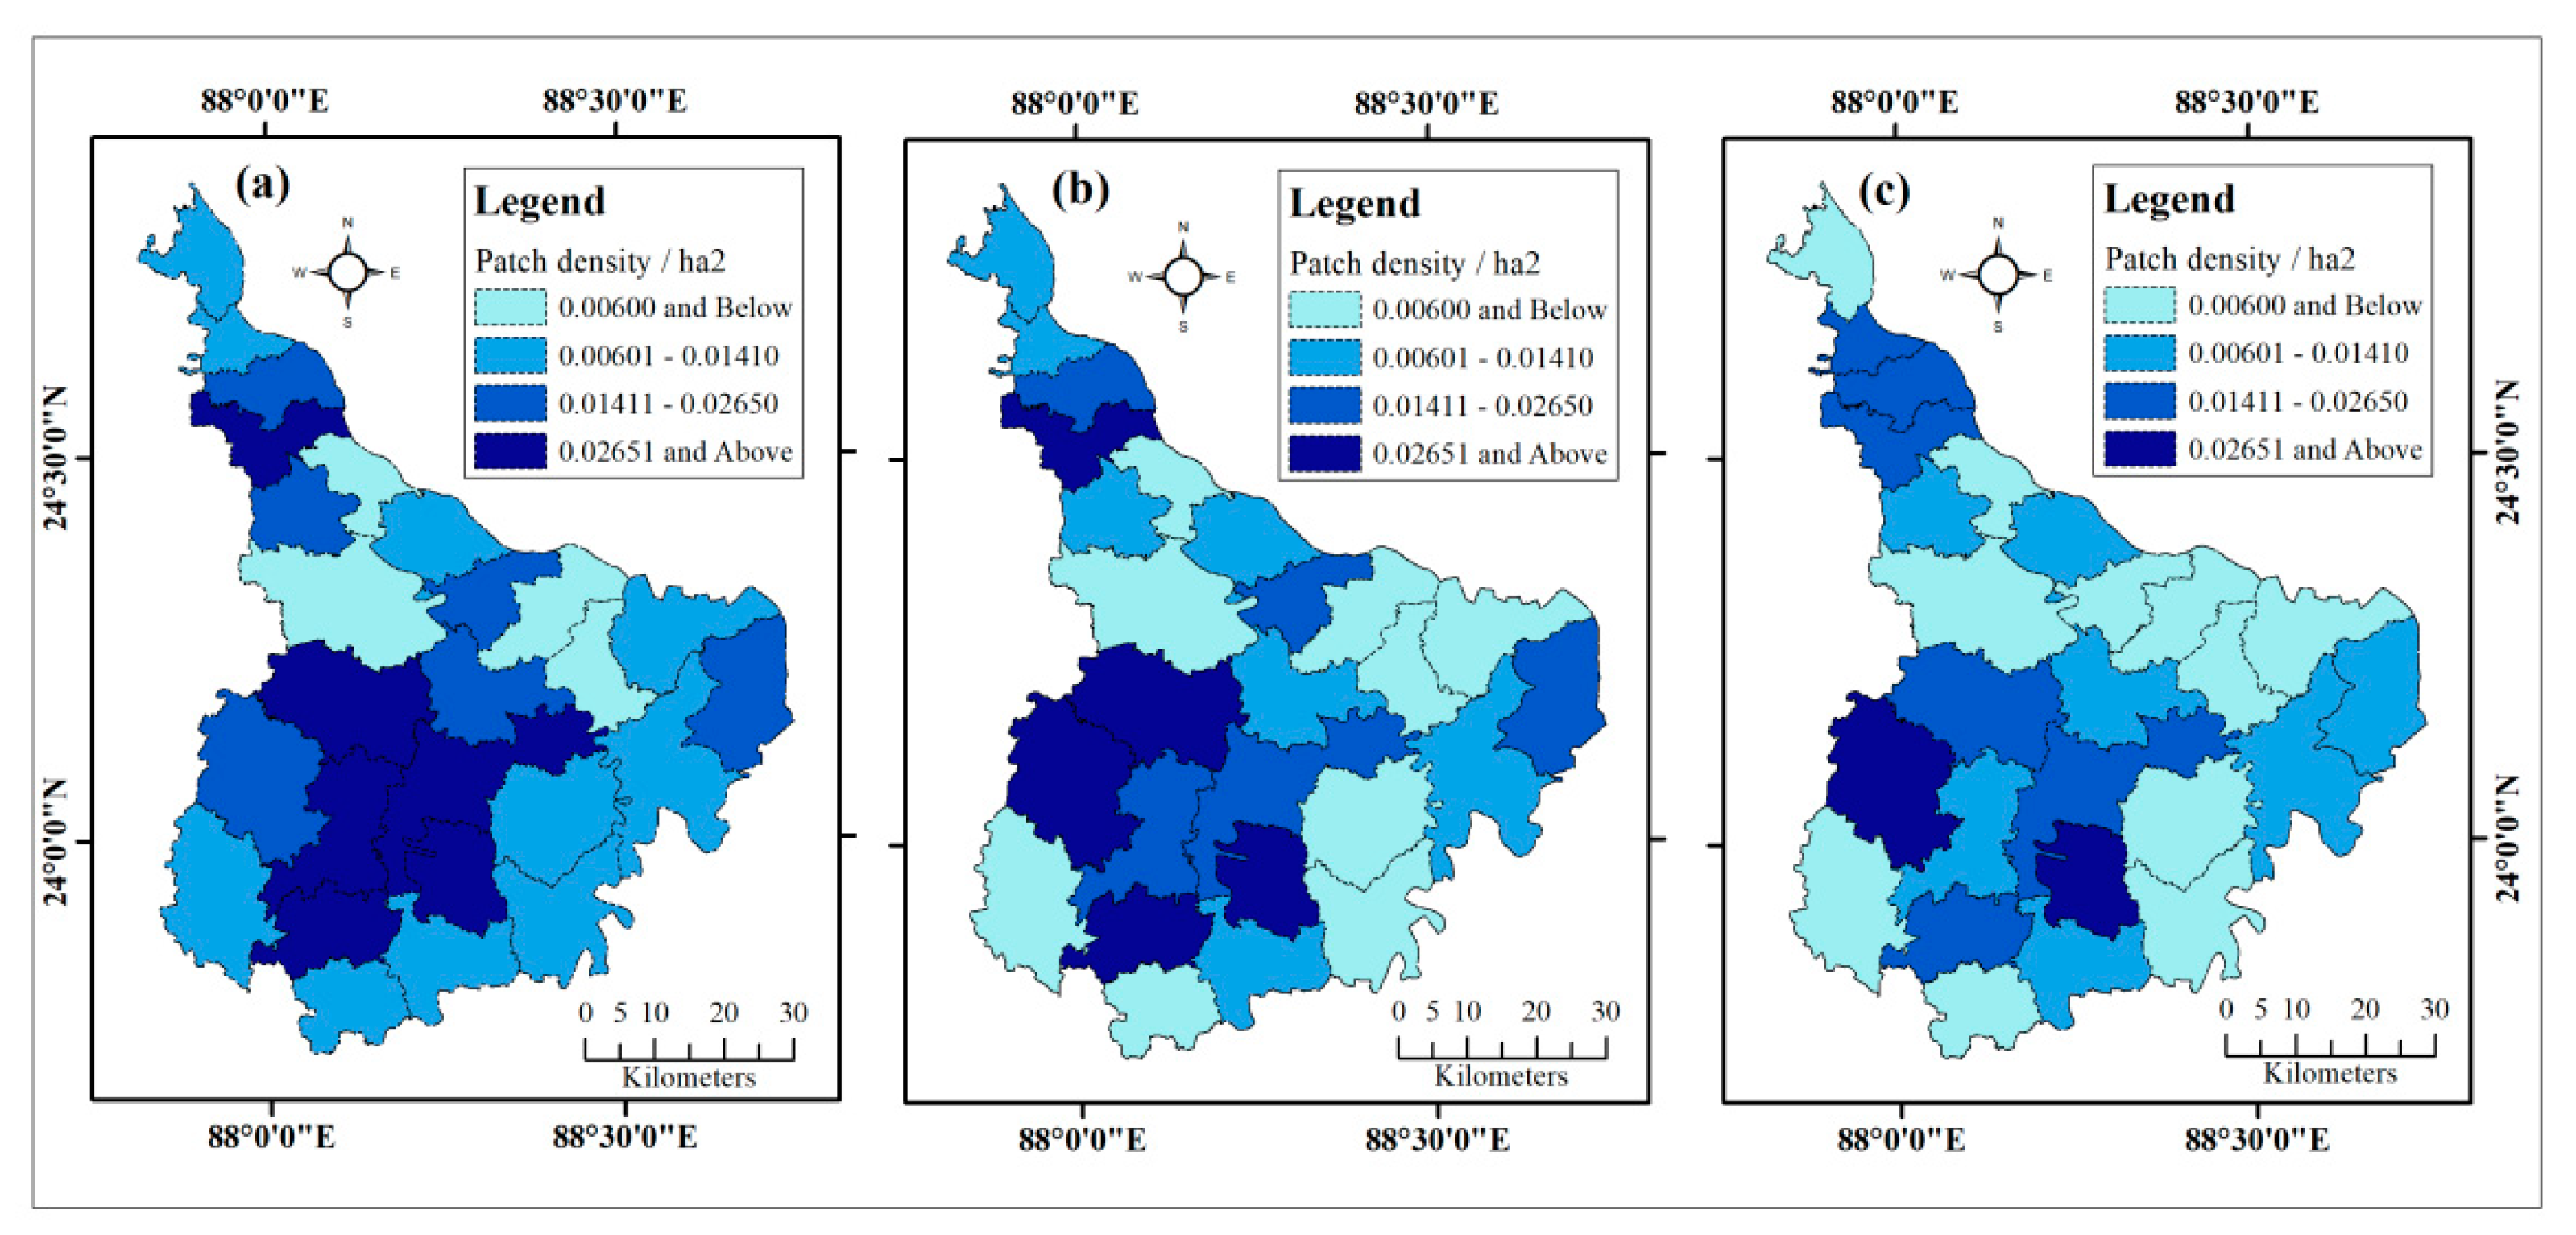
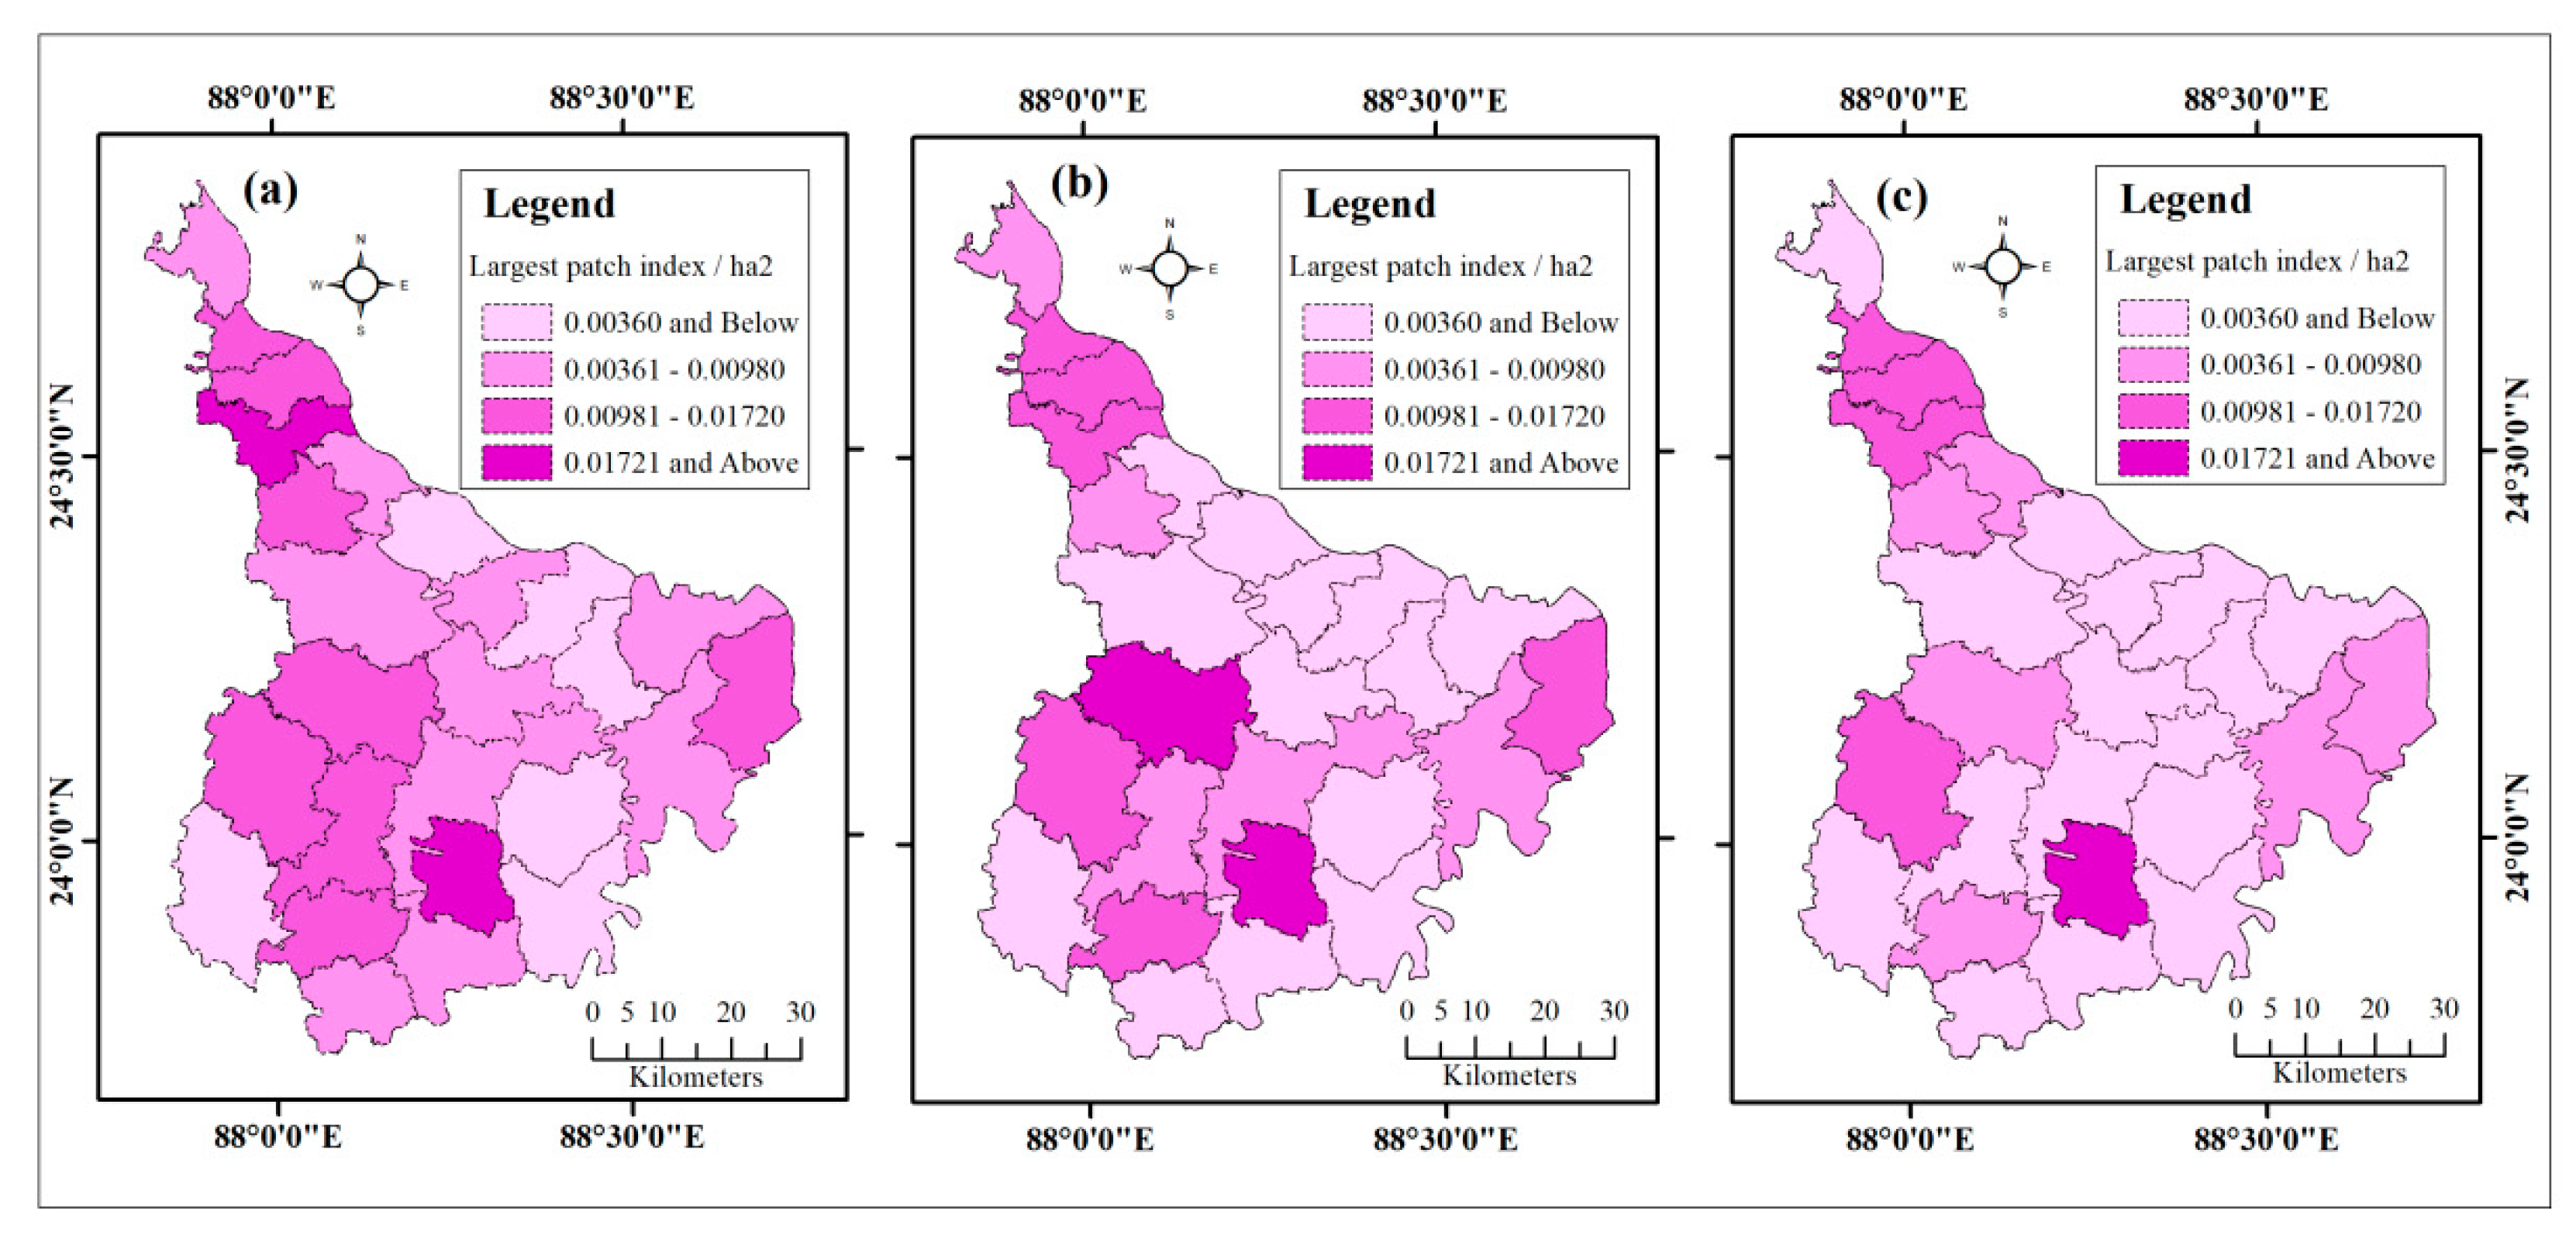
3.2. Wetland Ecosystem Health State

This study considered four state indicators to establish wetland ecosystem health. The indicators were selected because they have a direct relationship with wetland ecosystem functions and services. The selection of the wetland state indicators highlights the nature and characteristics of the wetland ecosystem.
The entire region of the Mursidabad district is concentrated in the inland wetland area, with high potential resources and natural importance. Patch density is one of the most important indicators to establish wetland ecosystem health. This is because of the highest patch density per square hectare area that has a greater economic, social and natural importance, whose importance are degraded with a decrease in patch density. Percentage of patch density decreased from 2001 to 2022 (Table 3). Figure 6 shows that the Kandi, Nabagram and Khargram blocks have highest patch density in 2001, 2013 and 2020, and that the Raghunathganj-II, Hariharpara and Bhagwangola-II blocks have the lowest patch density.
The largest wetlands of the Mursidabad district are diverse and dynamic in nature. Belun beel, sheeal lake, patan beel, ahiran bird sanctuary, sankura beel, balagachir beel, balagachhir beel, kanchanpukur and matijhil are the key wetlands in this group. The largest wetlands have rich biodiversity; they contribute to wetland habitat and climate regulation. The study observed that four wetlands have been identified that had a more than 500 ha area in 2001. These wetlands were found in the Suti-I, Nabagram, Khargram and Beldanga-I blocks (Figure 7). However, only two of these wetlands have a more than 500 ha area in 2020, and these wetlands are found in the Khargram and Beldanga-I blocks.
Patch richness may also contribute to enhancing wetland ecosystem health. Patch richness has a proportional relation with ecosystem health. The study observed that the number of patches decreased from 2001 to 2020. In 2001, 2013 and 2020, the patch richness was highest in the Berhampore, Kandi and Nabagram blocks, and lowest in the Samseganj, Raghunathganj-II and Farakka blocks (Figure 8).
The Shannon diversity index is also a very useful indicator to show the diversity of wetlands in each and every block. The highest value describes a relatively better health state and the health state decreases with the decrease in Shannon diversity index value. From 2001 to 2020, the LPI value was the highest in the Domkal and Hariharpara block and the value is lowest in the Bharatpur-II block.

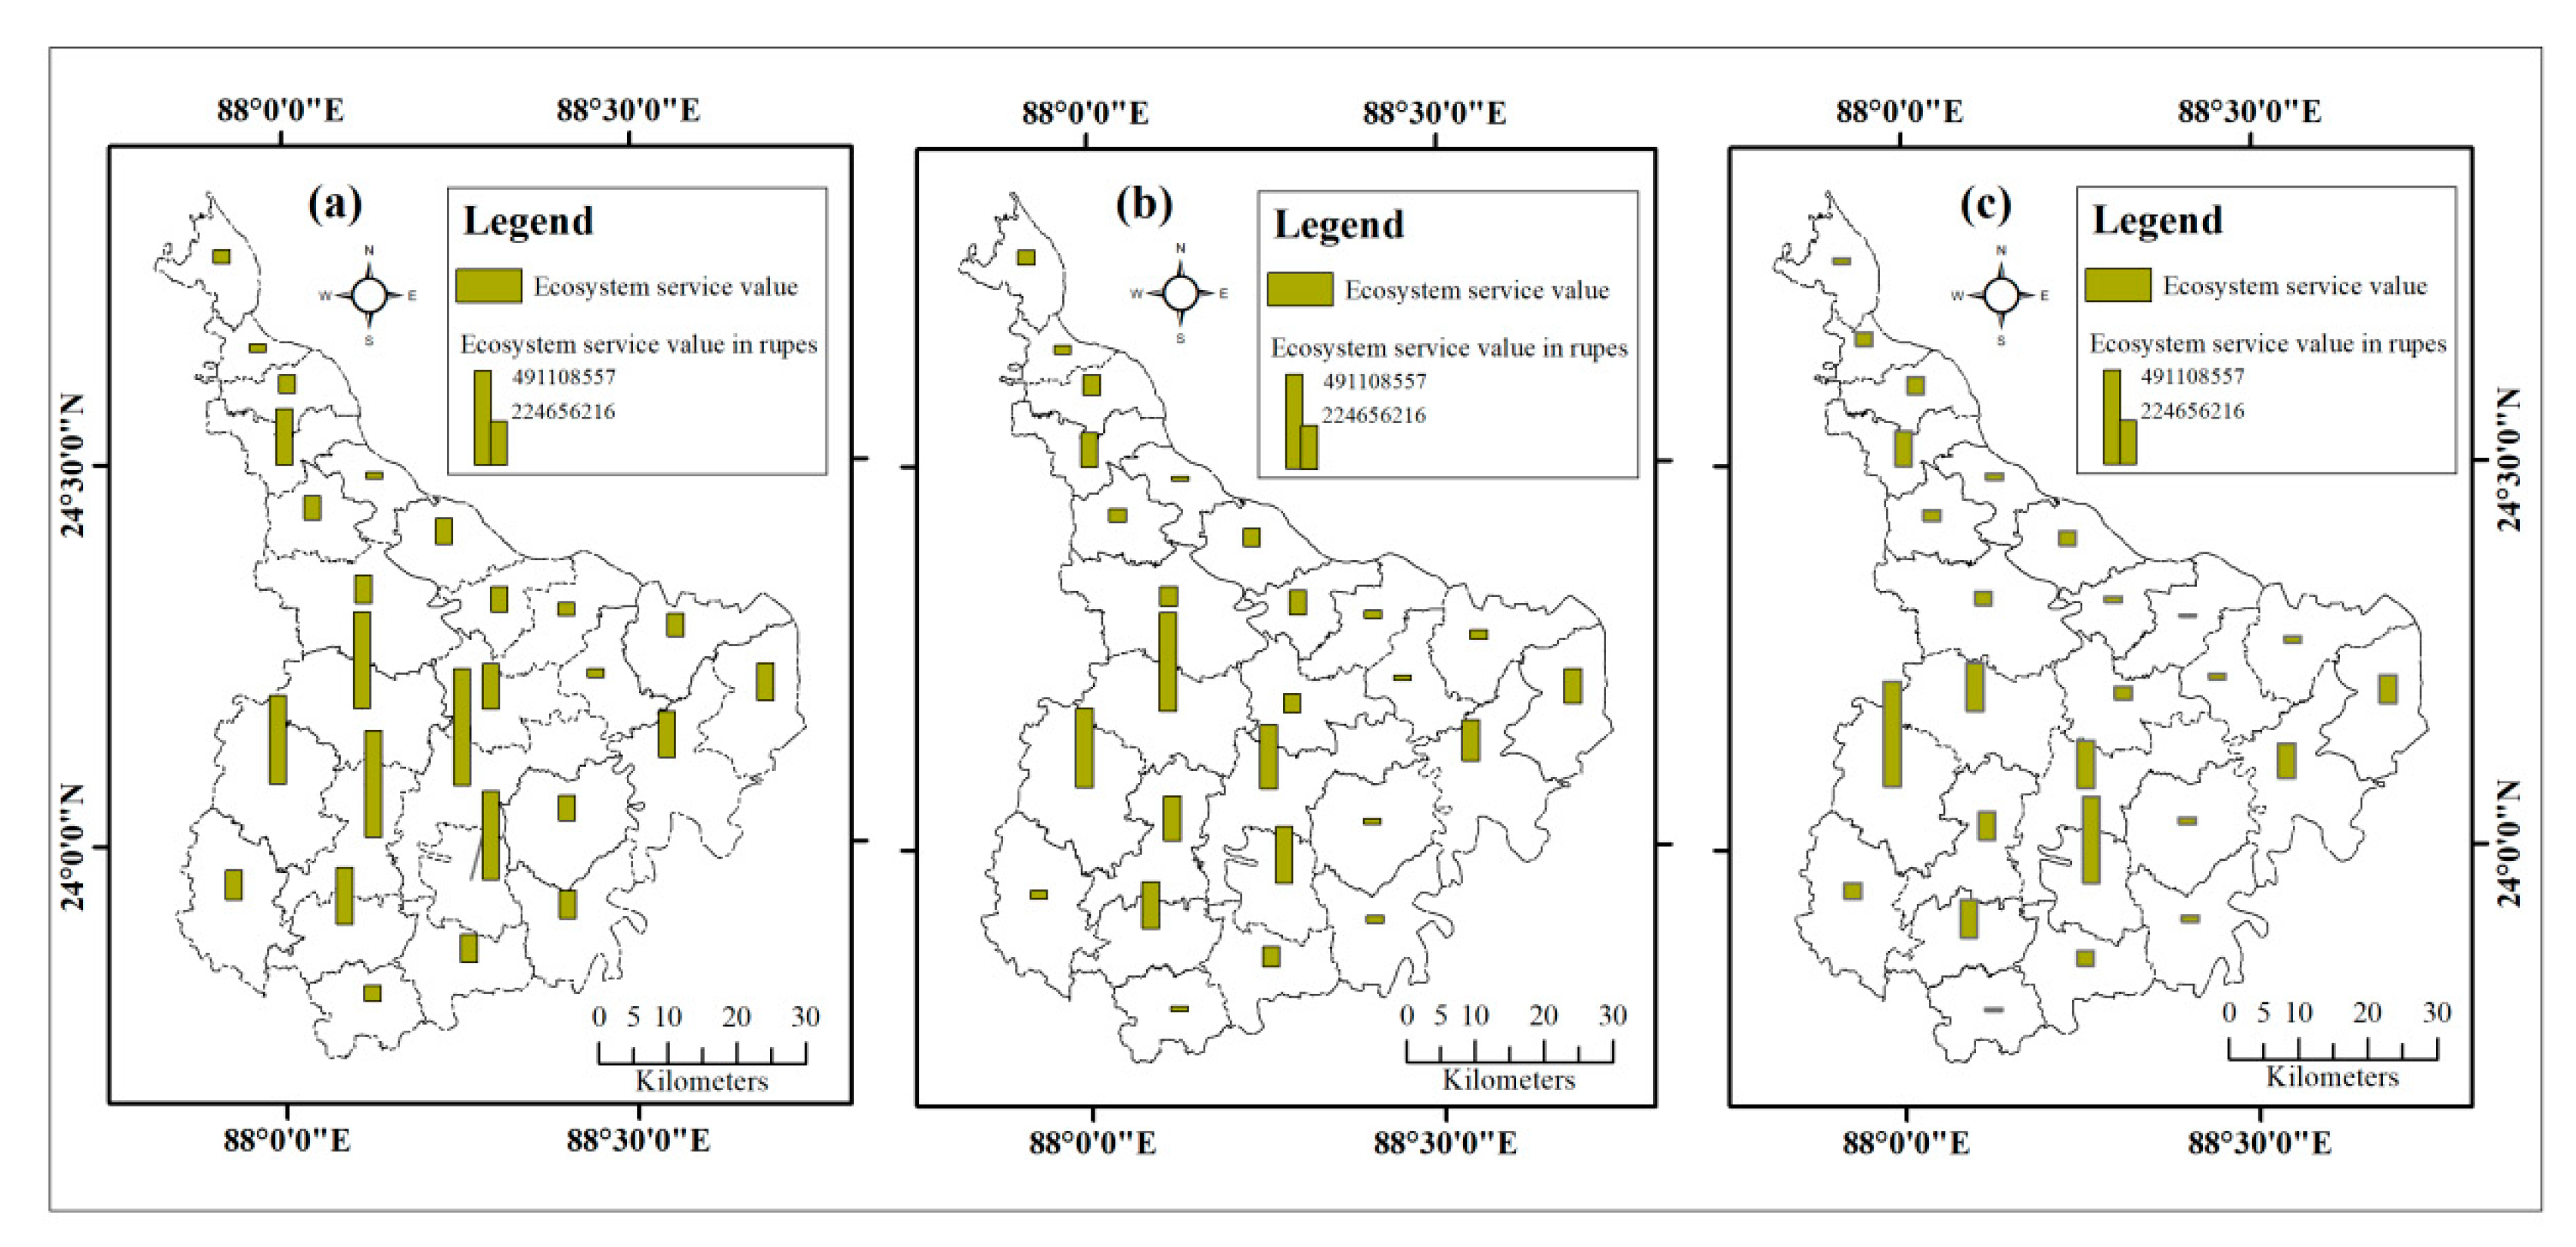
3.3. Wetland Ecosystem Health Response

The wetland degradation rate of each block of the Mursidabad district was determined by the insights of wetland area. Table 3 shows that the wetland area is 5.32%, 2.94% and 1.25% in the year 2001, 2013 and 2020, respectively. This study identified that the wetland area has decreased from 2001 to 2020 (Figure 9). The wetland degradation rate is highest in the Hariharpara block and lowest in the Suti-II block from 2001 to 2013. From 2013 to 2020, the wetland degradation rate was highest in the Bharatpur-II block and lowest in the Samseganj block.
The ecosystem service values directly reflect the water supply, water treatment, biodiversity protection, climatic regulation, etc. The ecosystem service value has a proportional relation to wetland area. The study determined that the Berhampore, Nabagram and Khargram blocks have the highest ESV and the Raghunathganj-II, Samserganj and Bhagwangola-II blocks have the lowest ESV in 2001, 2013 and 2020, respectively (Figure 10).

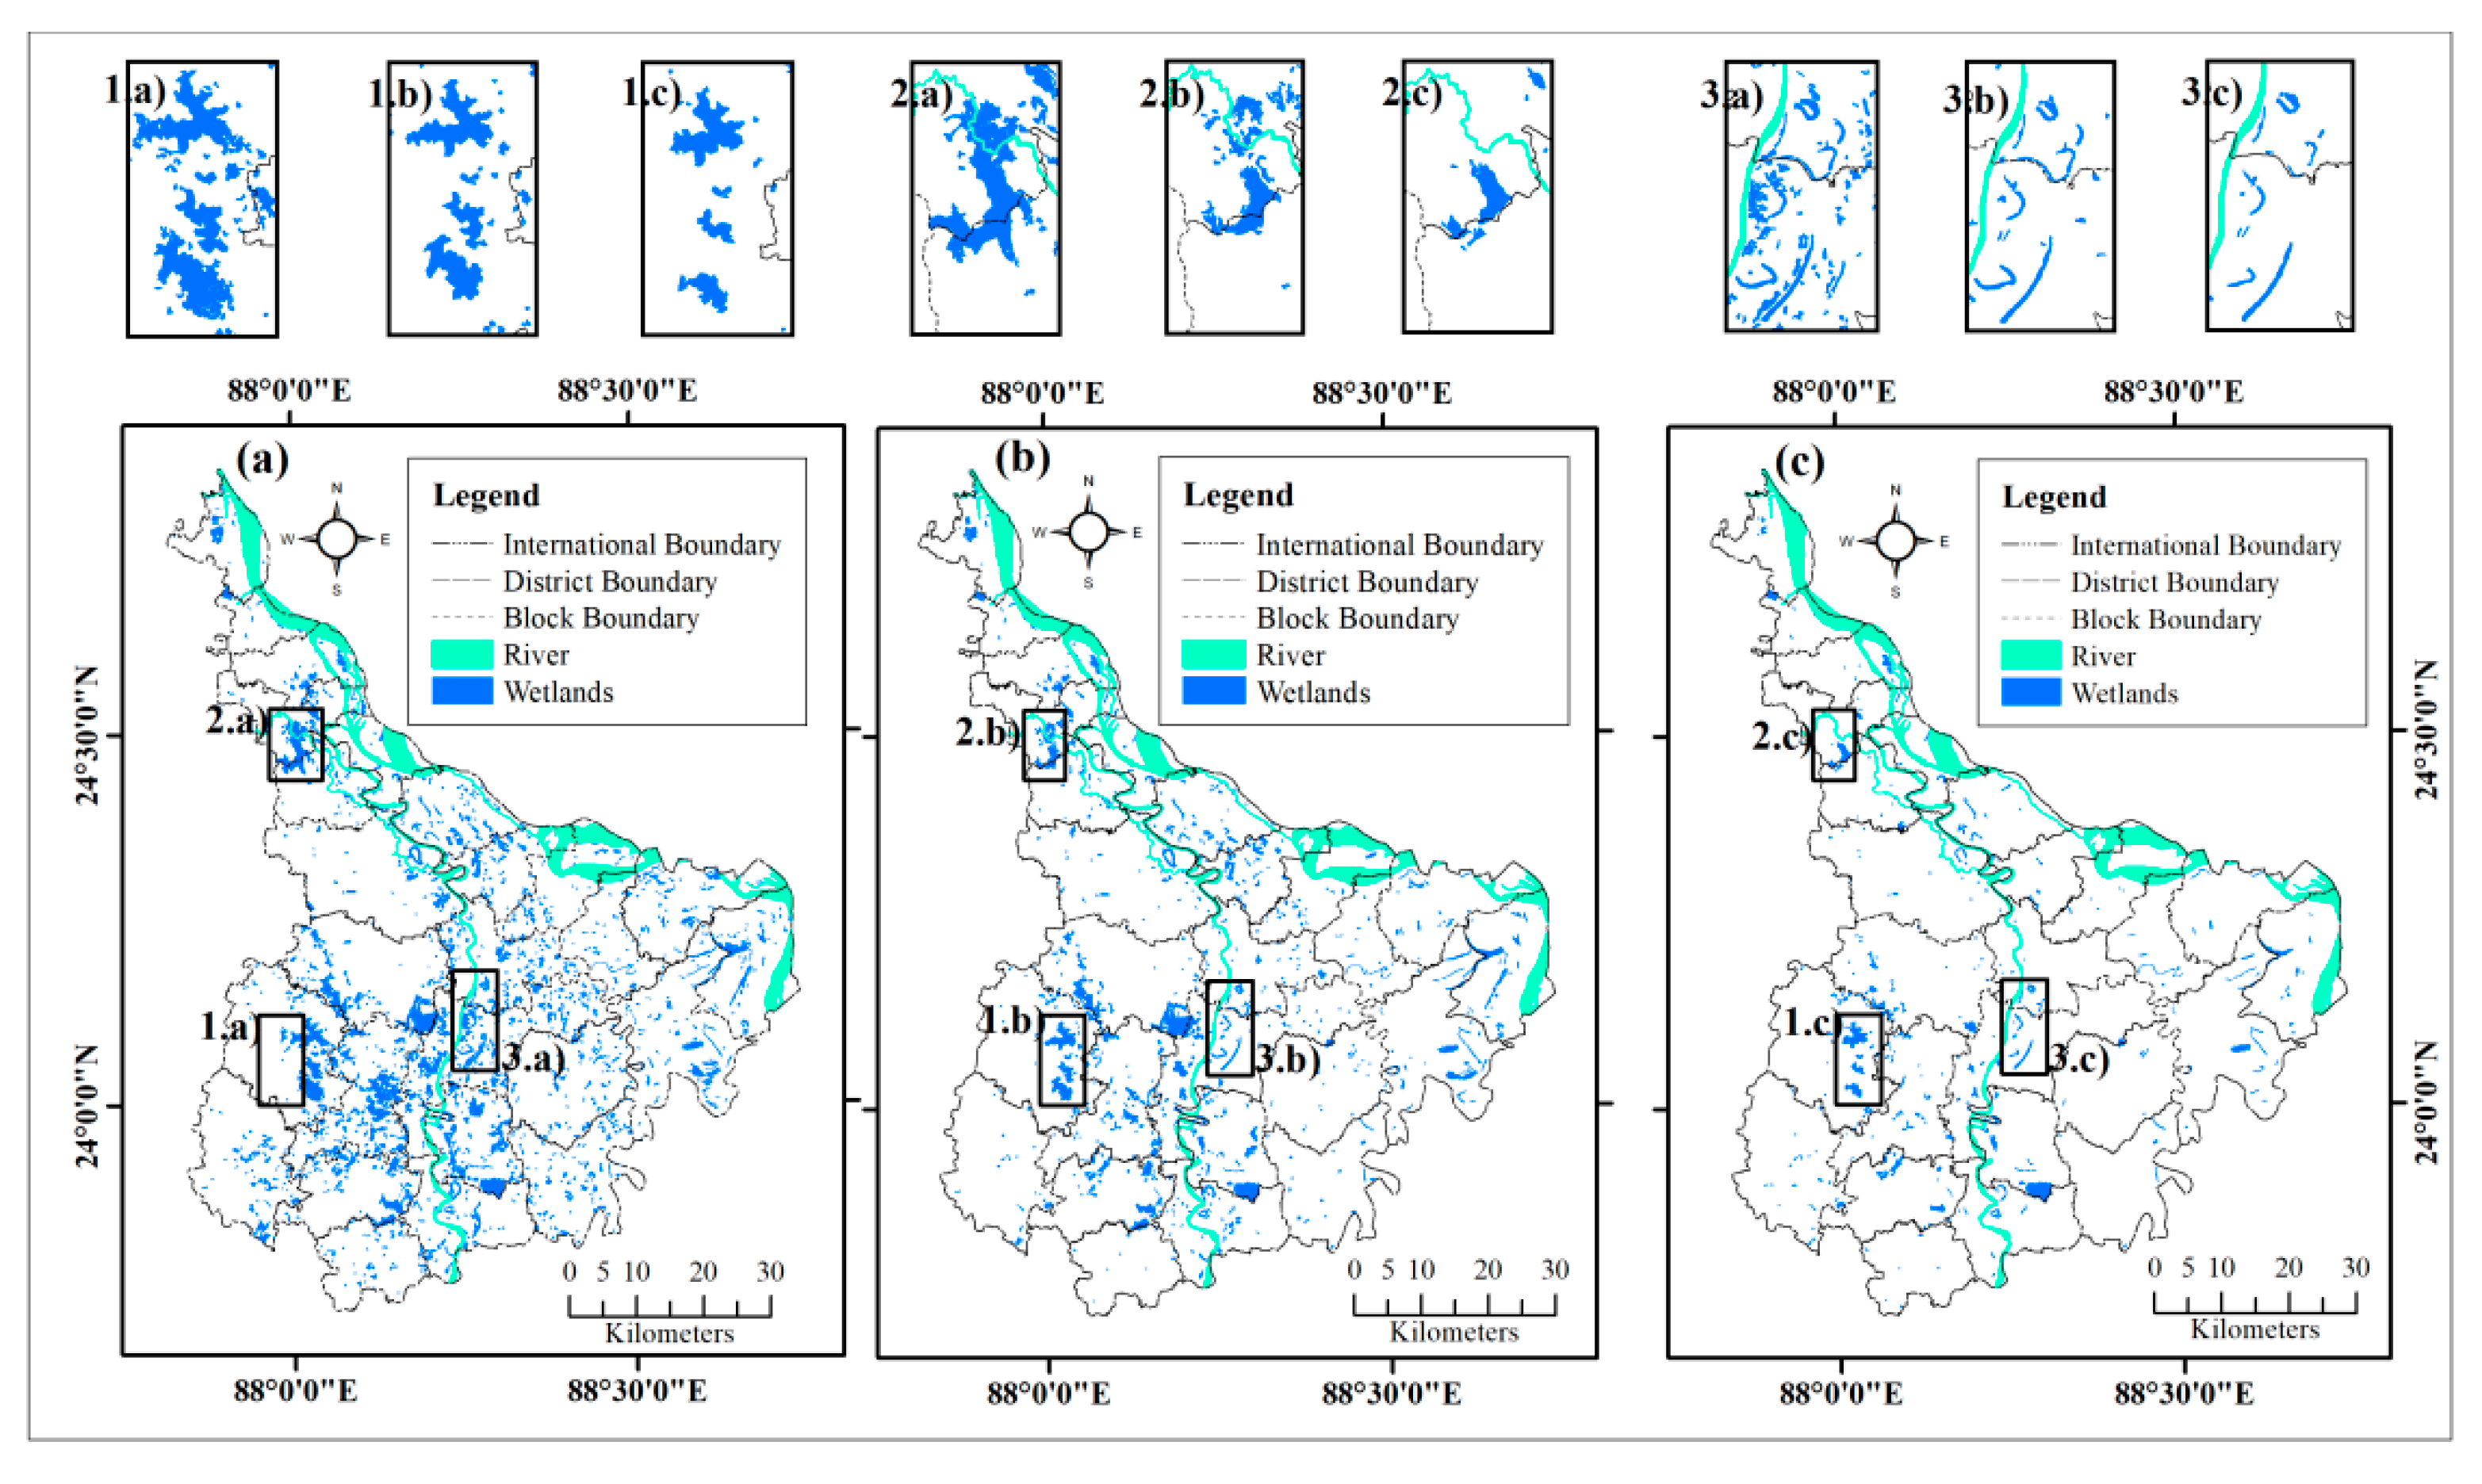
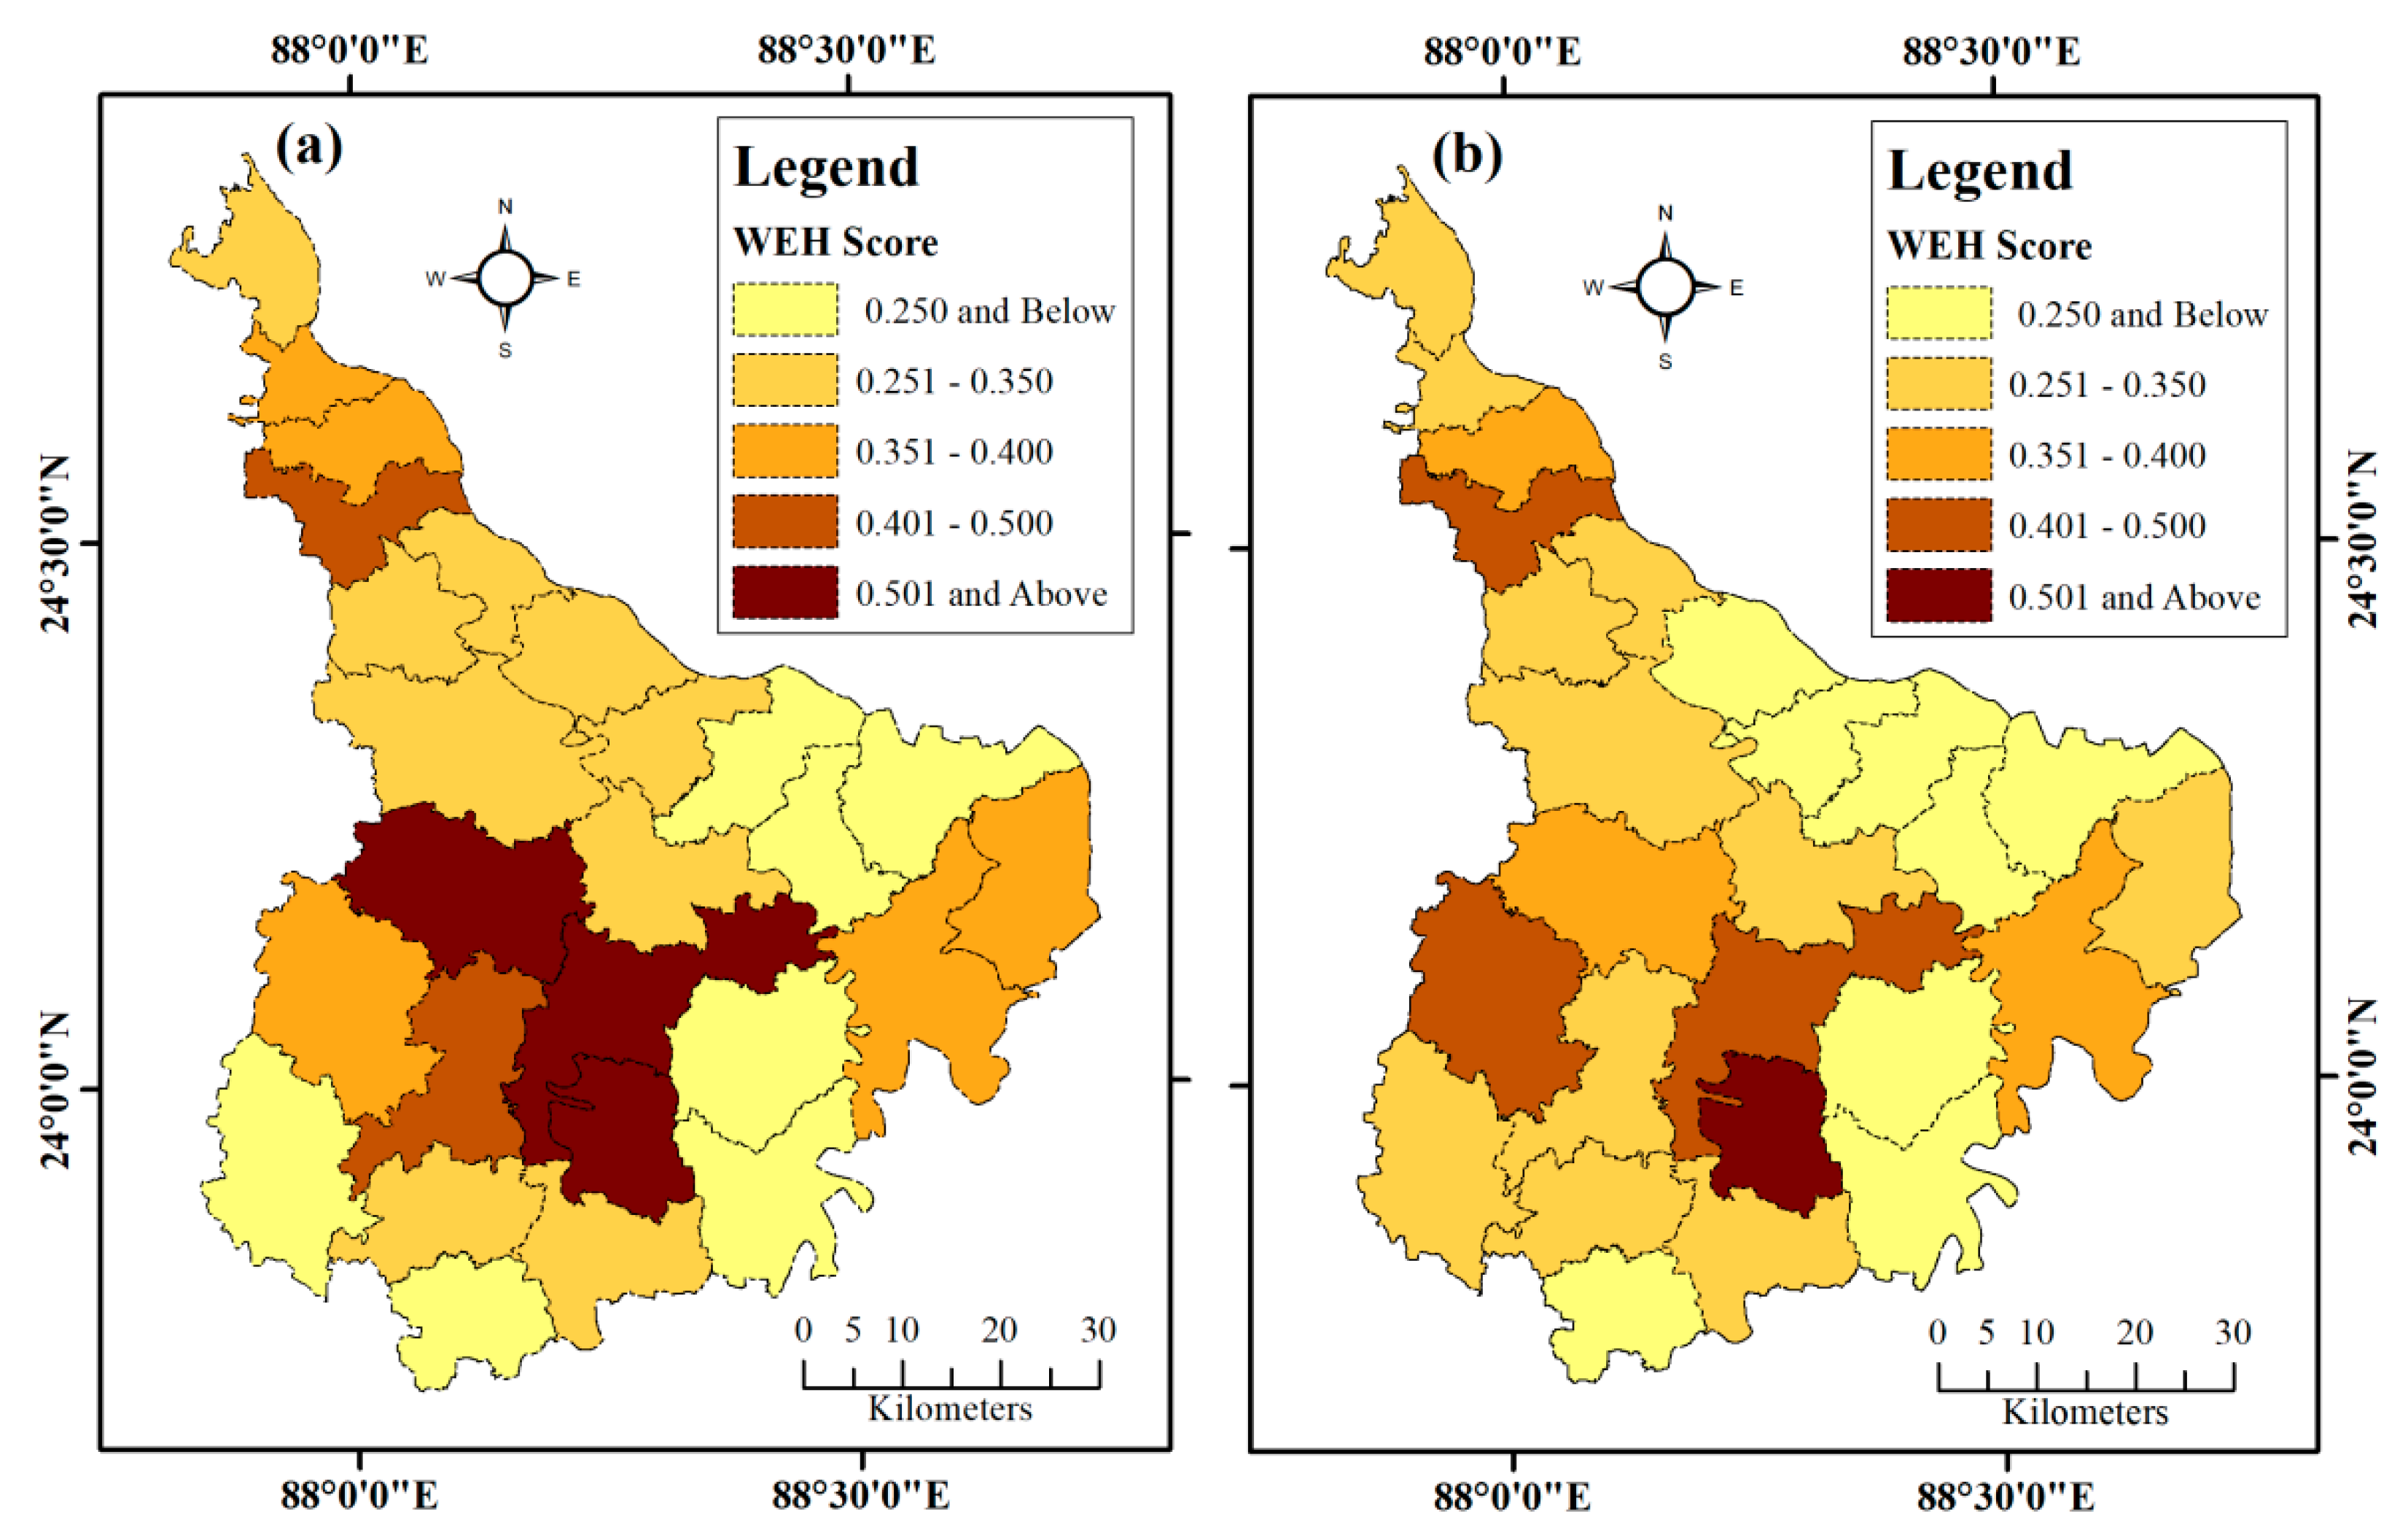
3.4. Spatial-Temporal Variations and Levels in the Health Status of Wetland Ecosystem

With reference to earlier research works and based on the current observation of the wetland characteristics in the Mursidabad district, the wetland’s ecosystem health level can be classified into five ranges, such as very-healthy, healthy, sub-healthy, unhealthy and sick [21]. The detailed WEH score classification is given in Table 4, where a higher value denotes a relatively healthy ecosystem health status, while lower values represent a poor ecosystem health. The researchers have observed that the WEH score changes with the difference in time and space, because human and environmental pressures influence the degradation of the health status [34]. The present study shows that, in 2013, the average WEH score was 0.338, which decreased to 0.311 in 2020. It means the wetland ecosystem health in the Mursidabad district has degraded from 2001 to 2020. The percentage of blocks placed in the sick category increases from 26.92% to 30.77% from 2013 to 2020, while the percentage of blocks in the very healthy class has decrease markedly from 11.54% to 3.85% (Table 5).
An assessment of the trends and levels of wetland ecosystem health (Figure 11) displays that the Beldanga-I, Berhampore and Nabagram blocks fell under the very healthy category in 2013; but, in 2020, only the Beldanga-I block is very healthy. The Berhampore and Nabagram blocks were degraded but became healthy and sub-healthy again. Furthermore, this study determined that 61.54% of the block has resided in an unhealthy and sick category in 2013, but it has increased to 73.08% in 2020. The Lalgola, Bhagwangola-I, Bhagwangola-II, Raninagar-II, Raninagar-I, Hariharpara, Nowda and Bharatpur-II blocks were identified as where the wetland health conditions are extremely poor. These blocks were affected by higher human pressure, such as population density, urbanization growth rate and road density, and thus the resultant degradation in wetland health status.
Human activities, such as converting wetland to cultivable land, over irrigation and canalization, have the destroyed wetland ecosystems. This has led to shrinking of the wetland area, water loss, soil erosion, desertification and degraded water quality, creating an unhealthy and sick situation for the flora and fauna. The habitat, food, shelter and protection of the living organisms are highly affected. In addition, seasonal rainfall variability is quite high in this region. As a result, the amount of water in the wetlands decreases during the dry season, which in turn reduces the surface runoff and groundwater level. In the eye of the human civilization system, the combined practice of using the wetland ecosystems of the Mursidabad district is making it even more dangerous. That the livelihood of the people is dependent on the wetlands is also becoming alarming. Therefore, scientific protection and restoration techniques of these wetlands should be emphasized in these areas.

4. Discussion

Wetland ecosystems are considered the most ecologically diverse; the nature of these ecosystems is also very dynamic. Therefore, the assessment of wetland ecosystem health is a very complicated task, because the impacts of the controlling factors vary spatially and temporally. The study reveals that the health status of the wetland ecosystems in the Mursidabad district has declined from 2013 to 2020. Natural and anthropogenic factors are the driving forces, which are responsible for the fragmentation of the wetlands and lead to degradation of wetland ecosystem health in the Mursidabad district [43,44].
The lower Gangetic floodplain is known as the rice-developing belt in West Bengal [45]. Rapid growth in population density and demand of food is one of the key indicators for the loss of wetlands in the Mursidabad district. Mondal [46] and Das et al. [47] established that the conversion of wetland to agricultural field in the Mursidabad district is noticeable. Sun et al. [20] determined that urbanization is a key indicator responsible to the degradation of wetland ecosystem health. The present study reveals that growth in population density- and urbanization-related exercises, like urban infrastructure development, expansion of road networks and unplanned growth of urban areas, are highly responsible for the degradation of wetland ecosystem health in the Mursidabad district. Mondal [46] established that intensive growth of the urban area in the Barhempure municipality has caused negative transformation of the wetlands. According to previous research studies [48,49], transport development has reduced the wetland area and increased the vehicle numbers on National Highway-34 (N.H. 34), leading to a decrease in birds gathering in the wetlands. Some studies have indicated that water birds are under threat due to human activities putting significant pressure on wetlands [50,51]. The combined threats from human pressure have destroyed the ecosystem habitat of inland wetlands that is inextricably linked with their ecological balance [52].
The wetlands in West Bengal receive water from the river or through surface run-off as a result of precipitation. The main source of water is rain in the beels of Mursidabad. The wetland area and volume of water increase during the monsoon months and decrease during the post-monsoon months [53]. The range of water levels in the beels of West Bengal were highest in the open beels (2.05–11.75) compared to the closed beels (0.85–8.13) [53]. The hydrodynamics of a wetland changes the wetland ecology in many ways, like changes in thermal behaviour and water quality, changes in the nutrient balance as well as decreasing biotic communities [53,54,55,56]. Overall, the study highlights that the sustainability of wetlands is maintained by the sustainable use of wetlands and an effective restoration policy from the government.
There are a few specific limitations to the wetland health assessment in the Mursidabad district. The physico-chemical properties of the water, plant and species diversity, soil erosion and slope data were not used in this study. Previous studies have established that the biophysical characteristics as well as socio-economic and demographic indicators are essential dimensions for the measurement of the health status of a wetland ecosystem [52,53]. The proposed evaluation framework is based on the authors’ assessment, which is guided by a group of research experts and previous research papers. Therefore, further research is necessary to verify the validity and progress of the research.

5. Conclusions

Assessment of wetland ecosystem health in the Mursidabad district was explored by using the PSR model and analytic hierarchy process method. A total of nine measurable indicators were selected to represent the block-wise variations in the health status of the wetland ecosystems. The remote sensing-derived data and statistical data were combined to assess the health of the wetland ecosystems. The result determined that the wetland health conditions exhibited a declining trend from 2013 to 2020. The percentage of blocks placed in the sick category increased from 26.92% to 30.77% from 2013 to 2020, while the percentage of blocks in the very healthy category has decreased markedly from 11.54% to 3.85%.
The wetlands of the Mursidabad district play a vital role to build-up a healthy ecological system, and is also a good, natural tourist spot. The majority of the people around the wetland are dependent on the wetland as their livelihoods depend on the water resource. The peoples here are engaged either in agriculture or fishing activities. The health of the wetlands within the block boundaries has been taken up as a subject of research in order to take the necessary steps for conservation and restoration of the wetlands within the administrative boundaries. Therefore, the government organizations and NGOs should take care and must make an effort to develop local-level institutions to govern the use and management of the wetland resources, and protect the key habitats. Equal distribution of wetland ecosystem health in each block is extremely difficult, but it is important to protect it for the life and livelihood of a large community.

Author Contributions

Methodology, formal analysis, investigation, and writing—original draft preparation, S.D. and P.K.S.; writing—review and editing, B.P.; funding—B.P. and A.M.A. All authors have read and agreed to the published version of the manuscript.

Funding

This research was supported by the Centre for Advanced Modelling and Geospatial Information Systems (CAMGIS), Faculty of Engineering and IT in the University of Technology Sydney (UTS). This research was also supported by Researchers Supporting Project number RSP-2020/14, King Saud University, Riyadh, Saudi Arabia.

Conflicts of Interest

The authors declare no conflict of interest.

References

  1. Keddy, P.A. Wetland Ecology Principles and Conservation; Cambridge University Press: Cambridge, UK, 2000; pp. 124–238. [Google Scholar]
  2. Chen, Z.; Shang, H.; Yao, B. Methods of wetlands health assessment in USA. Acta Ecol. Sin. 2009, 29, 5015–5022. [Google Scholar]
  3. Foote, L.A.; Pandey, S.; Krogman, T.N. Processes of wetland in India. Environmental conservation. Environ. Conserv. 1996, 23, 45–54. [Google Scholar] [CrossRef]
  4. Leopold, A. Wilderness as a land laboratory. Living Wilderness 1941, 6, 287–289. [Google Scholar]
  5. Rapport, D.J.; Regier, H.A.; Thorpe, C. Ecosystem behaviour under stress. Am. Nat. 1985, 125, 617–640. [Google Scholar] [CrossRef]
  6. Brown, M.T.; Vivas, M.B. Landscape development intensity index. Environ. Monit. Assess. 2005, 101, 289–309. [Google Scholar] [CrossRef] [PubMed]
  7. Gu, D.; Zhang, Y.; Fu, J.; Zhang, Z. The landscape pattern characteristics of coastal wetlands in Jiaozhou Bay under the impact of human activities. Environ. Monit. Assess. 2007, 124, 361–370. [Google Scholar] [CrossRef]
  8. Veselka, E.W.; Anderson, T.J. Wetland Indices of biological integrity. Wetl. Tech. 2013, 3, 1–27. [Google Scholar] [CrossRef]
  9. Cole, A.C.; Brooks, P.R.; Wardrop, H.D. Wetland hydrology as a function of hydrogeomorphic (HGM) subclass. Wetlands 1997, 17, 456–467. [Google Scholar] [CrossRef]
  10. Mcallister, S.L.; Peniston, E.B.; Leibowitz, G.; Abbruzzese, B.; Hyman, B.J. A synoptic assessment for prioritizing wetlands restoration efforts to optimize flood attenuation. Wetlands 2000, 20, 70–83. [Google Scholar] [CrossRef]
  11. Abbruzzese, B.; Leibowitz, G.S. A synoptic approach for assessing cumulative impacts to wetlands. Environ. Manag. 1997, 21, 457–475. [Google Scholar] [CrossRef]
  12. Wu, C.; Chen, W.; Cao, C.; Tian, R.; Liu, D.; Bao, D. Diagnosis of wetland ecosystem health in the Zoige wetland Sichuan of China. Wetl. J. 2017. [Google Scholar] [CrossRef]
  13. Shil, S.; Singh, K. Health risk assessment and spatial variations of dissolved heavy metal and metalloids in a tropical river basin system. Ecol. Indic. 2019, 106, 1–12. [Google Scholar] [CrossRef]
  14. Albert, D.A.; Minc, L.D. Plants as regional indicators of Great Lakes coastal wetland health. Aquat. Ecosyst. Health Manag. 2004, 7, 233–247. [Google Scholar] [CrossRef]
  15. Dixon, H.; Das, L.; Allan, R.; Kangabam, R. Ecosystem service assessment of selected wetlands of Kolkata and the Indian Gangetic Delta: Multi-beneficial systems under differentiated management stress. Wetl. Ecol. Manag. 2019, 27, 405–426. [Google Scholar]
  16. Bornette, G.; Amoros, C.; Piegay, H.; Tachet, J.; Hein, T. Ecological complexity of wetlands within a river landscape. Biol. Conserv. 1998, 85, 35–45. [Google Scholar] [CrossRef]
  17. Péron, G.; Ferrand, Y.; Leray, G.; Gimenez, O. Waterbird demography as indicator of wetland health: The French-wintering common snipe population. Biol. Conserv. 2013, 164, 123–128. [Google Scholar] [CrossRef]
  18. Ogden, J.C.; Baldwin, J.D.; Bass, O.L.; Browder, J.A.; Cook, M.I.; Frederick, P.C.; Frezza, P.E.; Galvez, R.A.; Hodgson, A.B.; Meyer, K.D. Water-birds as indicators of ecosystem health in the coastal marine habitats of southern Florida:1. Selection and justification for a suite of indicator species. Ecol. Indic. 2014, 44, 148–163. [Google Scholar] [CrossRef]
  19. Kangabam, D.R.; Bhoominathan, D.S.; Kanagaraj, S.; Govindaraju, M. Development of water quality index (WQI) for Loktak Lake in India. Appl. Water Sci. 2017, 7, 2907–2918. [Google Scholar] [CrossRef] [Green Version]
  20. Sun, R.; Yao, P.; Wang, W.; Yue, B.; Liu, G. Assessment of wetland ecosystem health in the Yangtze and Amazon River Basins. Int. J. Geo Inf. 2017, 6, 81. [Google Scholar] [CrossRef] [Green Version]
  21. Jia, H.; Pan, D.; Zhang, W. Health assessment of wetlands ecosystems in the Heilongjiang river basin, China. Wetlands 2015, 35, 1185–1200. [Google Scholar] [CrossRef]
  22. Ministry of Environment and Forests (MoEF). Wetlands of India: A Directory; MoEF, Government of India: New Delhi, India, 1990.
  23. Ministry of Environmental Forests (MoEF). National Wetland Atlas: As a Part of the Project on National Wetland Inventory and Assessment (NWIA); Indian Space Research Organisation (ISRO): Ahmedabad, India, 2011.
  24. Das, T.R.; Pal, S. Investigation of the principal vectors of wetland loss in Barind tract of West Bengal. Geo J. 2017. [Google Scholar] [CrossRef]
  25. Das, S.; Behera, B.; Mishra, A. Determinants of household use of wetlands resources in West Bengal, India. Wetl. Ecol. Manag. 2015. [Google Scholar] [CrossRef]
  26. Iza, A. Developments under the Ramsar Convention: Allocation of Water for River for River and Wetlands Ecosystem. Reciel 2004, 13, 40–46. [Google Scholar] [CrossRef]
  27. Kuriqi, A.; Pinheiro, N.A.; Ward, S.A.; Garrote, L. Flow regime aspects in determining environmental flows and maximising energy production at run-of-river hydropower plants. Appl. Energy 2019, 256, 1–17. [Google Scholar] [CrossRef]
  28. Zhang, P.; He, L.; Fan, X.; Huo, P.; Liu, Y.; Zhang, T.; Pan, Y.; Yu, Z. Ecosystem Service value assessment and contribution factor analysis of land use change in Miyun in County, China. Sustainability 2015, 7, 7333–7356. [Google Scholar] [CrossRef] [Green Version]
  29. Rapport, D.J. What constitutes ecosystem health? Perspect. Biol. Med. 1989, 33, 120–132. [Google Scholar] [CrossRef]
  30. Mai, S.Z.; Xu, S.J.; Pan, Y.J. Application of the PSR model to the evaluation of wetland ecosystem health. Trop. Geogr. 2005, 25, 317–321. [Google Scholar]
  31. Mcfeeters, S.K. The use of the Normalized Difference Water Index (NDWI) in the delineation of open water features. Int. J. Remote Sens. 1996, 17, 1425–1432. [Google Scholar] [CrossRef]
  32. Jiang, W.G.; Li, J.; Li, J.H. Assessment of wetland ecosystem health in the Liaohe River Delta. Acta Ecol. Sin. 2005, 25, 408–414. [Google Scholar]
  33. Wang, Z.H.; Wang, K.L.; Xu, L.F. The assessment indicators of wetland ecosystem health. Territ. Nat. Resour. Study 2003, 4, 63–80. [Google Scholar]
  34. Sun, T.; Lin, W.; Chen, G.; Guo, P.; Zeng, Y. Wetland ecosystem health assessment through integrating remote sensing and inventory data with an assessment model for Hangzhou bay, China. Sci. Total Environ. 2016, 556–567, 627–640. [Google Scholar] [CrossRef] [PubMed]
  35. Sarma, P.; Das, D. Application of Shannon’s Index to study Diversity with Reference to Census Data of Assam. Asian J. Manag. Res. 2015, 5, 635–643. [Google Scholar]
  36. Ewers, M.R.; Didham, K.R.; Watten, D.S.; Tylianakis, M.J. Remotely sensed landscape heterogeneity as a rapid tool for assessing local biodiversity value in a highly modified New Zealand landscape. Biodivers. Conserv. 2005, 14, 1469–1485. [Google Scholar] [CrossRef]
  37. Malinowska, E.; Szumacher, I. Application of landscape metrics in the evaluation of geodiversity. Misc. Geogr. Reg. Stud. Dev. 2013, 17, 28–33. [Google Scholar] [CrossRef] [Green Version]
  38. Xie, G.; Lu, C.; Cheng, S. Progress in evaluating the global ecosystem services. Resour. Sci. 2001, 11, 5–9. [Google Scholar]
  39. Saaty, L.T. Decision making with the analytic hierarchy process. Int. J. Serv. 2008, 1, 83–98. [Google Scholar] [CrossRef] [Green Version]
  40. Saaty, T.L.; Vargas, L.G. The seven pillars of the analytic hierarchy process. Models, methods, concepts & applications of the analytic hierarchy process. Int. Series Oper. Res. Manag. Sci. 2012, 175, 23–40. [Google Scholar]
  41. Dechasa, F.; Senbeta, F.; Dirba, D. Determinants of household wetland resources use and management behaviour in the Central Rift Valley of Ethiopia. Environ. Sustain. 2019. [Google Scholar] [CrossRef]
  42. Liu, J.G.; Diamond, J. China’s environment in a globalizing world. Nature 2005, 435, 1179–1186. [Google Scholar] [CrossRef]
  43. Pal, S.; Akoma, C.O. Water Scarcity in Wetland Area within Kandi Block of West Bengal: A Hydro-Ecological Assessment. Ethiop. J. Environ. Stud. Manag. 2009, 2, 1–12. [Google Scholar] [CrossRef] [Green Version]
  44. Mondal, D.; Pal, S. Evolution of wetlands in lower reaches of Bagmari–Bansloi–Pagla rivers: A study using multi dated images and maps. Curr. Sci. 2017, 112, 2263–2272. [Google Scholar] [CrossRef]
  45. Biswas, B.; Ghosh, D.C.; Dasgupta, M.K.; Trivedi, N.; Timsina, J.; Dobermann, A. Integrated assessment of cropping systems in the Eastern Indo-Gangetic plain. Field Crops Res. 2006, 99, 35–47. [Google Scholar] [CrossRef]
  46. Mondal, D. Urban landuse change assessment using rs and gis: A case study of berhampore town and its surroundings, Murshidabad district, West Bengal. Geo Anal. 2012, 2. Available online: http://gswb.in/wp-content/uploads/2012/08/v2n1jully2012_4.pdf (accessed on 20 October 2019).
  47. Das, T.R.; Pal, S. Exploring geospatial changes of wetland in different hydrological paradigms using water presence frequency approach in Barind Tract of West Bengal. Spat. Inf. Res. 2017. [Google Scholar] [CrossRef]
  48. Sharma, S. Trend of urbanisation in berhampore municipality: A Geographical analysis. Geo Anal. 2012, 2, 49–56. [Google Scholar]
  49. Mistry, J.; Mukharjee, S. Status and threats of water birds in ahiran lake, Mursidabad, West Bengal, India. Int. J. Plant Anim. Environ. Sci. 2015, 5, 59–64. [Google Scholar]
  50. Baral, H.S.; Inskipp, C. Important Bird Areas in Nepal: Key Sites for Conservation. In Bird Conservation Nepal and Bird Life International; Kathmandu and Cambridge: London, UK, 2005. [Google Scholar]
  51. Datta, T. Human interference and avifaunal diversity of two wetlands of Jalpaiguri, West Bengal, India. J. Threat. Taxa 2011, 3, 2253–2262. [Google Scholar] [CrossRef] [Green Version]
  52. Horwitz, P.; Finlayson, C.M.; Weinstein, P. Healthy Wetlands, Healthy People. A Review of Wetlands and Human Health Interactions; Report No. 6; Ramsar Convention on Wetlands/World Health Organisation: Geneva, Switzerland, 2012. [Google Scholar]
  53. Sugunam, V.V.; Vinci, B.K.; Hassan, A.M. Ecology and Fisheries of Beels in West Bengal; Research Project; Central Inland Capture Fisheries Research Institute: Guwahati, India, 2000. [Google Scholar]
  54. O’Malley, L.S.S. Bengal District Gazetteers; Government of West Bengal: Murshidabad, India, 1997; pp. 22–24.
  55. Das, R.S.; Roy, M.; Khan, A.R.; Nandi, C.N. Ecology and Macrobenthic faunal diversity of some floodplain wetlands of River Ganga in West Bengal. Rec. Zool. Surv. India 2009, 109, 65–72. [Google Scholar]
  56. Wang, H.; Ge, Z.M.; Yuan, L.; Zhang, L.Q. Evaluation of the combined threat from sea-level rise and sedimentation reduction to the coastal wetlands in the Yangtze Estuary, China. Ecol. Eng. 2014, 71, 346–354. [Google Scholar] [CrossRef]
Figure 1. Location map and wetlands of the Mursidabad district of India.
Sustainability 12 05932 g001
Figure 2. Flow chart of wetland ecosystem health assessment.
Sustainability 12 05932 g002
Figure 3. Distribution maps of the population density in (a) 2001, (b) 2013 and (c) 2020.
Sustainability 12 05932 g003
Figure 4. Distribution maps of the road network in (a) 2001, (b) 2013 and (c) 2020.
Sustainability 12 05932 g004
Figure 5. Distribution maps of the urbanization increase rate in (a) 2001–2013 and (b) 2013–2020.
Sustainability 12 05932 g005
Figure 6. Distribution maps of patch density in (a) 2001, (b) 2013 and (c) 2020.
Sustainability 12 05932 g006
Figure 7. Distribution maps of largest patch index in (a) 2001, (b) 2013 and (c) 2020.
Sustainability 12 05932 g007
Figure 8. Distribution maps of patch richness in (a) 2001, (b) 2013 and (c) 2020.
Sustainability 12 05932 g008
Figure 9. Distributions of wetlands in (a) 2001, (b) 2013 and (c) 2020.
Sustainability 12 05932 g009
Figure 10. Distribution maps of the ecosystem service value in (a) 2001, (b) 2013 and (c) 2020.
Sustainability 12 05932 g010
Figure 11. Distribution maps of wetland ecosystem health in (a) 2013 and (b) 2020.
Sustainability 12 05932 g011
Table 1. Indicators of wetland ecosystem health in the Mursidabad district.
CriteriaIndicatorHealth-Related
PressurePopulation density
Road density
Urbanization growth rate
StatePatch richness+
Patch density+
Largest patch index+
Landscape diversity index+
ResponseWetland degradation rate+
Ecosystem service value+
Table 2. The correlation matrix and weights of the indicators using the analytic hierarchy process (AHP) method.
Higher-Level IndicatorLower-Level IndicatorCorrelation MatrixPriorityWeight
ABCD
Wetland ecosystem healthA. Pressure11/33 0.2580
B. State3150.6370
C. Response1/31/510.1050
PressureA. Population density135 0.64800.1437
B. Road density1/3120.23000.1016
C. Urbanization growth rate1/51/210.12220.0823
StateA. Largest patch index11/3250.23900.1215
B. Patch density31570.57400.1783
C. Patch richness1/21/5130.13100.0930
D. Shannon diversity index1/51/71/310.05600.0634
ResponseA. Wetland degradation rate15 0.83300.1272
B. Ecosystem service value1/51 0.16700.0889
Table 3. Wetland area and percentage of wetland area for the Mursidabad district.
Year200120132020
Wetland area (ha)28,069.3915,520.246594.15
Percentage of wetland area5.322.941.25
Table 4. Status of wetland ecosystem health in the Mursidabad district.
WEH ScoreHealth StrataStatus of Health
0.501–1.00Very healthyWetland landscape with sustainable and stable system, very healthy ecosystem functions with minimal external pressure
0.401–0.50HealthyWetland landscape with sustainable and stable system, healthy ecosystem functions with less external pressure
0.351–0.40Sub-healthyWetland maintains basis system with some changes of landscape, degraded ecosystem functions and greater external pressure
0.251–0.35UnhealthyWetland landscape is a degraded system with a broken landscape, unhealthy ecosystem functions and relatively greater external pressure
0.00–0.250SickWetland landscape is a seriously degraded system with a completely destroyed landscape, sick ecosystem functions and very high external pressure
Table 5. Level of wetland ecosystem health in the Mursidabad district.
WEH ScoreHealth Category20132020
No. of Block%No. of Block%
0.501–1.00Very healthy311.5413.85
0.401–0.50Healthy27.69311.54
0.351–0.40Sub-healthy519.23311.54
0.251–0.35Unhealthy934.621142.31
0.00–0.250Sick726.92830.77

