Article

Effects of the Performance-Based Research Fund and Other Factors on the Efficiency of New Zealand Universities: A Malmquist Productivity Approach

1
Department of Industrial Engineering and Management, National Kaohsiung University of Science and Technology, Kaohsiung 80778, Taiwan
2
Electrical Engineering Department, Technological University of the Philippines Taguig, Taguig City 1630, Philippines
3
Department of Logistics and Supply Chain Management, Hong Bang International University, Ho Chi Minh City 72320, Vietnam
4
Department of Mechanical Engineering, National Kaohsiung University of Science and Technology, Kaohsiung 80778, Taiwan
*
Authors to whom correspondence should be addressed.
Sustainability 2020, 12(15), 5939; https://doi.org/10.3390/su12155939
Submission received: 27 May 2020 / Revised: 13 July 2020 / Accepted: 16 July 2020 / Published: 23 July 2020
(This article belongs to the Special Issue Promoting Sustainability in Higher Education)

Abstract

:
Universities and academic institutions play a very crucial role in nation development through the production of highly competent manpower. The eight universities in New Zealand have been recognized as some of the top academic institutions in the world. However, the rankings from different international organizations are declining and are hardly likely to rise. Government policies in funding allocation are being blamed for the universities’ regress as they operate with an insufficient amount of funds. This study uses the Malmquist Productivity Index model to examine the technical efficiency, technological change, and productivity performance of the eight universities. This model uses a variety of inputs (number of academic and non-academic staff and total enrolment) and outputs (number of degree and postgraduate graduates, total graduates, and total operating revenue from the Equivalent Full-Time Student (EFTS) funding system and the Performance-Based Research Fund (PBRF), etc.) obtained for the period 2013–2018. The overall results show that the average catch-up and frontier-shift efficiencies of the universities are roughly in a “no-change” scenario, meaning that the universities did not make any progress over these years. The Malmquist Productivity Index (MPI) also shows a stable result, with average final values slightly higher than 1, wherein only five universities reached an actual productivity score of 1. It is recommended that the universities improve their internal factors, including personnel, equipment, facilities, and student services, while taking accounts of external aspects, such as rapid growth in technological environments and innovations, to achieve sustainable organizational progress and improved productivity. The re-assessment of government policies for funding allocation is also suggested. This research paper offers insights into the New Zealand universities’ productivity performances for the past few years. This could be used as a reference for other purposes.

1. Introduction

In this day and age, producing high-quality manpower has become a very important role of universities in every country around the world to prepare them to cope with rapid growth and development. Countries will be likely to need higher quality educational institutions in order to create capable human resources. In order to properly allocate educational funds, the government may use certain efficiency measurements of a university’s performance as a basis for their grants. It is also essential to identify universities’ performance efficiencies, using valid data, in order for the government to create a framework for their long-term strategies. Many governments all over the world have resorted to the use of performance-based funding for the allocation of resources for research in higher education institutions. It has actually become a worldwide trend. In 1991, the New Zealand government introduced the Equivalent Full-Time Student (EFTS) funding system, which is based primarily on the total quantity of students registered in full-time programs. This was soon followed by the establishment of the Performance-Based Research Fund (PBRF) in 2004, which resulted in a significant change to tertiary education funding in the country. Smart, through regression analysis, demonstrated the immediate effect of the implementation of PBRF and revealed that there was an increased research output over time. Research outputs in 2005 were 34% higher after PBRF implementation, suggesting that its impact has been significant [1]. The PBRF was designed to convert the intellectual output into measurable outputs to be used as a means of monitoring and rewarding academic labor. However, some problems did arise during the implementation of the PBRF. One of them was that every individual in the university was required to exert an enormous effort in order to produce research outputs, while the resulting financial recognition went solely to the institution. This meant that the inputs were individual, while the rewards were collective [2]. Furthermore, the funds from the PBRF did not really increase the pool of funding because the universities mainly just received a percentage from the research component of the EFTS, in which the ratio between the two was approximately 20:80, respectively [3]. Presently, university funding usually comes from government tuition funds, student fees and charges, research income, and income from non-Tertiary Education Commission (TEC) funding, interests, dividends, sub-contracting, etc. [4].
New Zealand’s tertiary education is administered by the Ministry of Education (MOE) and supervised by the Tertiary Education Commission (TEC), one being the policymaker and the other being the implementing body. Regulating, funding, and monitoring the performance of tertiary education providers are the major roles of the TEC [5]. There are eight (8) universities in New Zealand that operate with the support of government grants and public funds. These universities have managed to get places in the three most widely recognized and prominent international systems for ranking (Times Higher Education World University Rankings, Academic Ranking of World Universities, and Quacquarelli Symonds (QS) World University Rankings) [6]. Though the universities are able to maintain their positions on these lists, a gradual decline in rankings has been seen in recent years. It is said that this is due to the government’s policy for universities to operate with the lowest income levels per student [7].
This paper will examine the relative efficiency of New Zealand’s eight universities through the transition process of students and the amount of funding they received from the government. This is to identify which universities produce enough graduates that are supported by a sufficient number of academic and non-academic staff while receiving adequate or inadequate government funding and student fees as operational revenue. It will also investigate if there is a basis for the claim that the government funding models have led to the decline in university rankings in the international academic community. The evaluation of the universities’ efficiency is calculated through the number of degree graduates and postgraduate degree graduates, and the income they produced through operational revenue for the period 2013 to 2018.
Seven factors, including three inputs and four outputs, during the six-year period, are considered in order to apply the Data Envelopment Analysis (DEA) Malmquist Productivity Index (MPI). MPI is one of many Data Envelopment Analysis models used for analyzing the relative efficiencies of several Decision-Making Units (DMUs) that have many input and output factors. This paper will utilize these methods for the evaluation of the eight New Zealand universities.
The paper is organized into five sections. The second section reviews previous literature related to this study. The third section describes the proposed approach to evaluating the efficiencies of the eight New Zealand universities. The presentation and interpretation of applying the DEA-based Malmquist model to the data is illustrated in the fourth section. Concluding statements are presented in the final section.

2. Literature Review

In recent years, there have been numerous research studies about the measurement of some universities’ relative efficiencies. The significance of efficiency in institutions of higher learning is to find out which of the institutions distribute their available input resources to produce desired and acceptable outputs efficiently. This efficiency in the higher educational institutions requires the integration of various inputs that generate satisfiable outputs.
Universities hire highly competent academic staff to properly educate the students and to be able to transform them into exceptionally qualified graduates. In this way, efficiency in teaching refers to the effective delivery of knowledge to degree and postgraduate degree students. It is also safe to assume that the universities’ higher qualification requirements as entry conditions for students will result in graduates with remarkable qualities. The excellent teaching qualities will be evident in the produced graduates. The rate of graduation can be related to the academic quality of graduates, while the amount of university operational revenue reflects their productivity based on the total number of enrolled students and research outputs performance.
Several research studies about universities’ efficiency conducted around the world use different models of DEA and diverse combinations of inputs and outputs that will contribute to achieving the purpose of the study. DEA is one of the preferred methods in estimating technical efficiencies that produce optimum scale levels in large ranges as compared to deterministic parametric (DFA) and stochastic frontier (SFA) [8]. Kipesha and Msigwa [9] measured the relative efficiencies of seven public universities in Tanzania using CCR (Charnes, Cooper, Rhodes) and BCC (Banker, Charnes, Cooper) using the total student enrolment, total number of academic and non-academic staff, and total number of staffs as the inputs, the number of graduates in undergraduate and postgraduate levels, and total graduates are the outputs. The same DEA models were used by Daghbashyan [10] to study the technical and scale efficiency of the 47 units of Sweden’s Royal Institute of Technology. In the paper, the inputs are the number of professors, Ph.D. students, research staff, and technical-administrative staff. The total number of authored books, review papers, conference papers, and journal papers were used as outputs. The outcome of the study shows that the combined DEA models applied in the units of the Royal Institute of Technology can be used to measure their performance in relation to each other.
Abbott and Doucouliagos [11] conducted a study for 36 Australian government-funded universities that use the total quantity of academic and non-academic staff, amount of expenditures, and cost of non-current assets as inputs. The full-time students’ headcount, research allocation, and non-medical and medical research income are used as the outputs. The findings of the scale and technical efficiency imply that the operations of Australian universities are at an acceptably high-efficiency level in relation to one another, though there is recommended room for improvement in some universities. Flegg et al. [12] use the same model along with congestion efficiency to analyze 45 British Universities during the period of 1980–1993, wherein the number of undergraduate—as well as postgraduate—students, total staff count, and aggregate departmental expenditure are used as input. The number of graduates from undergraduate and postgraduate level, and income from research and consultancy are the outputs. Results revealed that during the studied period, these universities performed a 51.5% increase in total factor productivity and impressive improvements in technical efficiency from 1987 onwards.
Katharaki and Katharakis [13] used the DEA constant return scale (CRS) model for the study conducted to 20 public universities in Greece to measure their efficiency. To fulfill this research, the inputs used are the number of non-academic and academic staff, the number of enrolled students, and operational expenses. For the outputs, only the total number of graduates and income from researches are used. The results indicate that human resource management in Greek universities is inefficient and identifies some rooms for improvement to increase research activities that may result in higher research income.
Some DEA models, such as Super Efficiency combined with Tobit Regression, was also used in a research paper conducted by Liu et al. [14] to evaluate the 40 teacher’s colleges in Thailand. In this study, four inputs (quantity of teachers, students, part-time staff, and full-time staff) and three outputs (publication outputs, total graduates, and employed students) are used. Results show that only seven colleges perform with high efficiency, while the rest are facing technical inefficiency.
Taylor and Harris [15] evaluated the universities in South Africa by collecting data from a sample of 10 government universities out of 21. The data obtained to cover the year 1994 to 1997. In this study, the authors were able to acquire results with high stability and consistency. The DEA analysis in this study makes use of data of the total annual graduates and research as the output variables and tested against various combinations of inputs between the expenditure, capital, number of students, and number of staff. The paper concludes that there are efficiency differences between the universities and can be improved by the actions of the management and government.
DEA was again used by a study conducted by Warning [16], wherein the number of staff and expenditures were used as inputs while numbers of publications in different scientific journals are the outputs. The goal of this paper is to provide distinctive differences between 73 universities in Germany in terms of outputs related to social or natural sciences. Results show that there is evidence that the efficiency scores of universities differ with each other, and that efficiencies are affected by the university character, environmental aspects, and other strategic variables related to the social and natural sciences.
Leitner et al. [17], in their paper, deployed DEA to evaluate the performance efficiency of the departments of technical science and natural science from twelve universities in Austria. The study uses data from 1996 to 2002 with the number of staff and room space as the input variables, while examinations, theses, journal outputs, patents, and other publications were used as outputs. Empirical results show that almost half of the universities in Austria with departments in technical and natural sciences are performing efficiently. There is also proof that small and large departments are better than the medium-sized in terms of performance.
DEA was applied by Monfared and Safi [18] to the 27 Iranian universities in three different aspects: cost, research, and teaching. Each aspect has their own combinations of input and output factors. The study indicates the important contribution of DEA as an effective tool in performance analysis, especially in the academic sector.
Wolszczak-Derlacz and Parteka [19] used a two-stage DEA multi-country approach in the evaluation of the higher education institutes in Europe. The analysis makes use of data from 259 universities over the period of 2001 to 2005. This study found out that the crucial elements in the evaluation of European universities are the number of academic staff, funding sources, and gender composition of personnel. They have concluded that the key contributors to improving the efficiency of the university depend on increasing the share of funds from external sources and the higher number of women in the academic sector.
Another study that uses DEA was conducted by Pietrzak et al. [20] in the efficiency evaluation of higher education institutions in Poland. Using the CCR model, the authors considered making use of the total count of research staff and financial grants as input factors, while total student count, external research or project funding, and publications are the output factors. The results of their study found that, in 33 social science faculties, 9 of them achieved perfect efficiency. Continually, a benchmarking analysis was done, which suggests that the inefficient faculties may improve the efficiencies of all output factors.
Table 1 summarizes other notable studies regarding universities efficiency with the examples of commonly used inputs and outputs.
It is noticeable that DEA is a common approach to measuring the efficiency of universities. However, DEA can also be applied in different industries, such as ICT [26], banking [27,28], hospitals [29,30,31], supplier selection [32,33,34], and energy [35,36,37], and has many other applications [38,39,40,41,42,43].
It was in 1978 when Charnes et al. [44] introduced DEA with their CCR model that measures the possible maximum relative efficiencies of DMUs. This model is the first traditional model in input/output orientation to evaluate DMUs’ technical efficiency assuming that the addition of input and output has a similar ration and is operating at an optimum scale. Another model was also introduced in 1984 by Banker et al. [45] and named the BCC model. Unlike CCR, BCC assumes that the DMUs are operating in at least not yet or not on an optimal scale. Following these models, there are other non-radial DEA models that involve both input and output orientation, such as the ADD or additive model [46] and SBM or slacks-based measure model [47] were introduced. There are also some super-efficiency models that have shortcomings in appropriately ranking of technically efficient DMUs [48].
Caves et al. [49] in 1982 proposed the Malmquist productivity index (MPI), which is based on DEA. Fare et al. [50] split Malmquist productivity into two segments: first, the in catch-up inefficiency change; second, the frontier efficiency.
Puertas and Marti [51] in their study, combined the UI GreenMetric with data envelopment analysis to evaluate the performance of several universities coming from different countries in terms of the three aspects of sustainability: social, economic, and environmental. The universities were grouped into four through cluster analysis; then, DEA was applied to generate a synthetic indicator. Results revealed that the UK and the USA have the most number of universities that are actively concerned in all dimensions of sustainability. Generally, it turned out that there is a much-needed effort to improve the performance related to environmental factors, rather than developments in transportation, infrastructure, or education.
While most of the previous studies using DEA in the performance evaluation of a certain number of DMUs, the Malmquist Index model was not widely used. DEA models, such as BCC, CCR, SBM, and others, do not have the capability to analyze whether the DMUs are progressive or not, in certain year periods. Normally, the efficiency indexes that were generated by these models were just measured on average and are only limited to determining whether a DMU is efficient or not. For this reason, the authors decided to deploy MPI in this study as it can detect progress or regress in performance by comparing the efficiency level of a year period to another and generate its own index which determines the productivity or performance trend. None of the literature has ever studied this issue before. This paper will solve this issue regarding the effect of the funding model of the New Zealand government to their universities and does not focus solely on determining which university performs the best or the worst. Furthermore, this study focuses on the economic aspect of sustainability, as there will be a financial factor that will be considered.

3. Materials and Methods

Today, most universities in the world are attempting to achieve global excellence and recognition in the international academic community by getting into the list of top universities [52]. Many countries perform continuous accreditation of their educational programs to make sure that they are compliant to the local and international standards for education, especially those in higher learning settings in the US [53] and Europe [54]. These performances by universities are also used as the bases for local government funding. Usually, universities are evaluated on a yearly basis. The measure of productivity or efficiency in a time period to see whether universities attained growth through the years is very uncommon. The result of this study can be used by the government of New Zealand to provide additional grants to the universities that have accomplished higher efficiency within the last six years.

3.1. Malmquist Productivity Index

This paper will use the Malmquist Productivity Index (MPI) for measuring the efficiency of the eight New Zealand universities using data from 2013 to 2018. In this study, C I t t + 1 is described as the catching-up inefficiency from the period of t towards t + 1. Hence, C I t t + 1 is mainly two measurements’ geometric mean.
C I t t + 1 = T S E t + 1 T S E t = O Z t + 1 t + 1 O Z t + 1 O Z t t O Z t
The previous one calculates the projected Z t t for the Z t unit measured during the t period; it is the change in the distance by the projected Z t + 1 t at period t + 1. The next one measures the projected Z t t + 1 for the Z t + 1 unit measured at t period, that is the distance change by the projected Z t + 1 t + 1 at t + 1 period. Below are more precise details:
M I t t + 1 = [ O Z t t O Z t × O Z t t + 1 O Z t + 1 O Z t + 1 t O Z t × O Z t + 1 t + 1 O Z t + 1 ] 1 / 2
Combining Equations (1) and (2), the Malmquist Productivity Index will be:
M a l m t t + 1 = C I t t + 1 × M I t t + 1 M a l m t t + 1 = T S E t + 1 T S E t [ T S E t T S E t + 1 ] 1 / 2 [ I E I t + 1 t I E I t t + 1 ] 1 / 2 M a l m t t + 1 = [ T S E t + 1 T S E t ] 1 / 2 [ I E I t + 1 t I E I t t + 1 ] 1 / 2
A M a l m t t + 1 = 0 depicts no improvement in productivity, M a l m t t + 1 < 1 depicts a decrease in productivity, while M a l m t t + 1 > 1 depicts that productivity increased significantly over the time period. Considering all these, the Malmquist model can be used for efficiency evaluation.

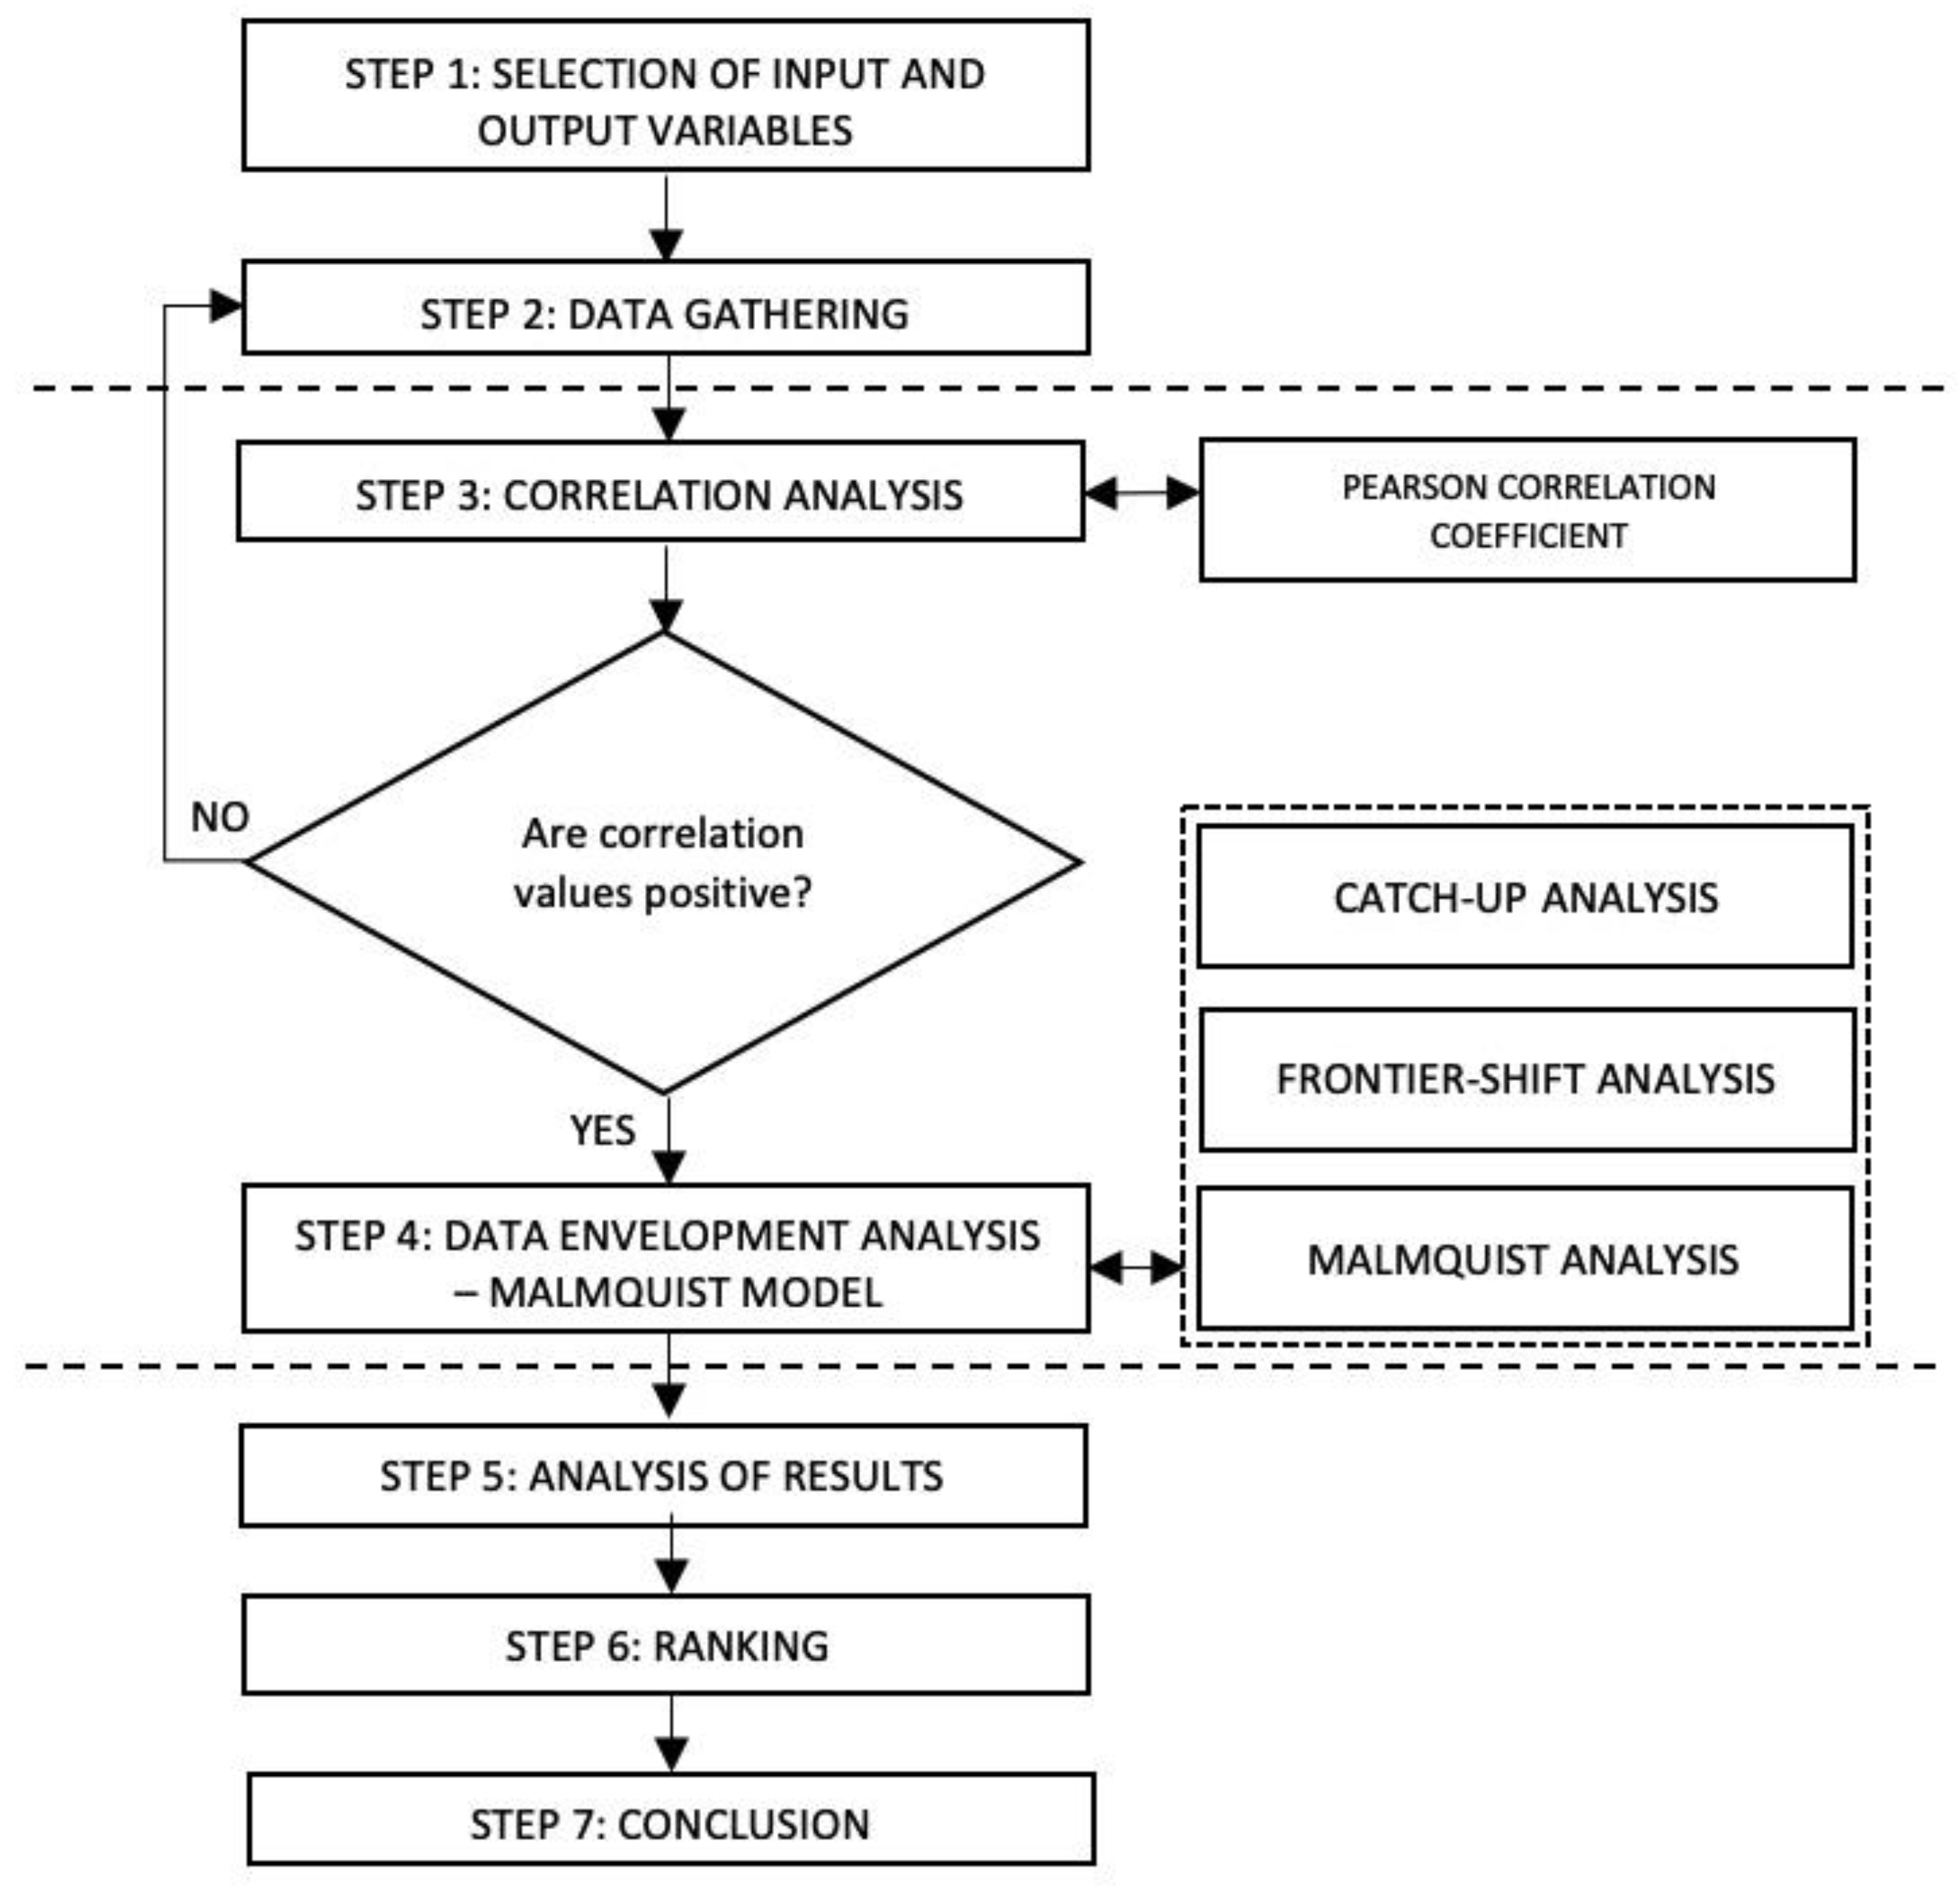
3.2. Research Process

The measurement of the Malmquist Productivity Index of DMUs for eight universities in New Zealand will be done through the application of DEA and also analyze their technical efficiency and productivity for the period of 2013–2018. The results of this analysis can be a basis for the government to provide additional funding and to see who among the universities have shown enormous growth in terms of being productive or efficient. The research process for this paper is shown in Figure 1 below.
Step 1: Choosing appropriate input and output variables
Several works in the literature that also evaluate the performance of universities are used to decide which of the variables provided in their studies are more suitable for this paper. It is notable that there are studies that use common input and output variables that may also be considered for use in this study.
Step 2: Collection of data
Data will be gathered through the websites of the New Zealand government and from the annual reports published by the universities through their individual websites.
Step 3: Analysis of correlation
To check if the variables that are suggested in the review of related literature are in acceptable positive correlation, these variables are examined through the Pearson Correlation Coefficient statistical method. This method is widely used to evaluate the relationship between two factors. The variation is between −1 and +1, wherein the former represents a perfect negative, while the latter is a perfect positive linear relationship. Since DEA applications use non-negative components, any presence of negative correlation coefficient during the testing will result in a return to the first step or re-selection of input or output variables until all results show positive correlations.
Step 4: Application of DEA Malmquist
Once all the Pearson correlation coefficient values appeared to be non-negative for the selected combinations of variables, the data will then be processed using DEA. An input-oriented Malmquist index is used further with efficient frontier data for performance assessment, technical efficiency, and position analysis for each university. Efficiency scores equal to 1 indicate “no-change”, greater than one “>1” signifies progress, and less than one “<1” implies regress.
Step 5: Analyze the results
The results of the DEA process for the DMUs are described in this section and provide observations about the performance in their technical efficiency, technological change, and productivity. Scores are presented according to the year period in order to analyze the individual operations of each DMUs over time.
Step 6: Ranking of the Decision-Making Units
After the evaluation of eight DMUs performance and technical efficiency using the DEA Malmquist index model, these universities will be ranked according to the rate of progress in productivity. The ranking also indicates whether the DMUs are progressive or regressive.
Step 7: Conclusion and recommendations
This section will provide appropriate recommendations and conclusions based on the selected factors that have a significant impact on the DMUs for the basis of future researches, use of the DEA Malmquist model for assessment of technical efficiency and productivity, and ranking of universities’ performances over a certain period. Several suggestions and recommendations will also be provided.

4. Results

4.1. Data Selection for Input and Output Variables

New Zealand has only eight universities [4], offering a variety of study disciplines from arts, science, business, health sciences, medicine, engineering, law, fine arts, architecture, and education. These universities are administered by the country’s Ministry of Education and the primary subject of this study. Table 2 lists the name of the universities and the designated DMU labels.
It is notable that from the review of the literature that many studies related to the measurement of performance of universities using the DEA have used diverse combinations of input and output variables. The selection of these factors is based on the purpose of the study and what the paper is trying to achieve. The selections for the input measurements in this study include the total number of undergraduate students, the total number of postgraduate students, the total number of faculty, the total number of staff, faculty-to-student ration, number of departments, labor, and non-labor expenditures, material expenditures, and research grants. While the selection for the output factors includes the total number of degree graduates, the total number of post-degree graduates, the total number of graduates, income from grants and contracts, number of publications, number of dissertations, number of graduates working, number of graduates opt for further studies and the number of graduates opt for developing skills. Table 3 below shows the descriptive statistics of the selected input and output factors.

4.2. Pearson Correlation

The input and output variables are tested through Pearson’s method to check their correlation. This is used to find out if the input and the output are negatively or positively correlated with one another. DEA has limitations in handling negative correlations; that is, if there is an increase in inputs, the outputs should not decrease. In case a negative correlation appears during the testing, a re-selection of variable/s must be done to avoid any presence of a negative coefficient. The following tables show the statistical analysis and Pearson correlation coefficients of the input and output variables in several time periods.
It can be observed that Table 4 below does not contain any non-positive values for the year 2015. Furthermore, the coefficients for the preceding and succeeding years do not contain any negative coefficients. There is no disruption to the DEA model rule, even though some coefficients appear a little lower, compared to others. These correlations with positive values denote that the selected input and output variables are consistent with the rule. Since these tables present all factors that are positively correlated, the study can proceed to the index analysis and ranking of the DMUs.

4.3. Result of MPI Analysis

This paper uses the Malmquist Productivity Index model to assess the technical efficiencies and productivity performances of the 8 New Zealand Universities. This model generates scores in three levels, the catch-up (technical efficiency), frontier-shift (technological change), and Malmquist (productivity) index. Succeeding tables use a time interval = 1 to calculate index results for the observation of DMUs’ performance during the individual intervals.
As seen in Table 5 below, there are three DMUs (DMU1, DMU4, and DMU6) that show no significant progress in terms of technical efficiency performance over the period of 2013–2018 in every time interval. This result implies that the DMUs are operating in a “no-change” manner throughout these years. They show no progress nor regress within the year periods. These DMUs were not included in the graph anymore. It is also noticeable that DMU2 was more efficient during the 2013–2014 and 2015–2016 periods but declined on the succeeding years and maintained an efficiency score value of 1. Figure 2 displays the downward and upward trend of DMU2 before it comes to a stable state. This can be due to the drop in the number of employees particularly on the academic personnel in 2014 and failed to regain the losses. DMU5, DMU7, and DMU8 also shown no substantial progress nor regress as data shows their individual scores are roughly around the “no-change” value. DMU3 demonstrates a huge decline in efficiency among all the others as it attains the lowest score of 0.8478 in the period of 2016–2017. Even if DMU3 performs a little progress in the following year, the average efficiency score for the whole observation periods was greatly affected by the decline from the previous year. Overall, the DMUs are not able to show improvement for the past six years. It is strongly evident by the attained 0.9969 score average.
Certain conditions such as competitions, technological changes, innovations, regulatory and political environment, etc., in which all the DMUs can be equally affected are represented by the frontier-shift index. Table 6 presents an unstable movement of the DMUs when it comes to the technical change during the observation periods. Frontier scores are noticeably slightly lower or higher to 1 with scores between 0.9902 and 1.0317. This status suggests that all the DMUs were able to maintain their positions against the rapid change in the technological environment and innovations as interpreted by the average of 1.0088. Though it can be noted that during the period 2013–2014, DMU3 performed progressively with a 1.1339 score which is the highest point among all other DMUs. DMU2 is able to attain almost the same score during the 2017–2018 period with 1.1308. Figure 3 above shows all the average frontier values are plotted slightly above and below 1. These outcomes can also be an indication that the variables used for this study (input and output factors) have shown no significant change resulting in a fairly stable condition. There is also a possibility that no substantial technological change happened for the academic sector especially in terms of delivery of instructions, student support services, etc., prompting the way for the DMUs to retain their standings.
The Malmquist Productivity Index (MPI) can be acquired through the product of catch-up and frontier-shift efficiencies which can be seen in Table 7. DMU1, DMU3, and DMU8 show a decline in progress with scores slightly below 1. The effect of a low frontier-shift and no-change catch-up scores resulted in a 0.9902 MPI rating. DMU3 performs otherwise, getting also a low average productivity score which is 0.9833 for the whole observation intervals. DMU8 exhibits low productivity progress as evidently expressed by the MPI scores during the period of 2013–2017. It also gets the lowest score for the rest of DMUs, with 0.92 points in 2016–2017. This performance of DMU8 resulted in 0.9724, the lowest among the total MPI averages. DMU4, DMU5, DMU6, and DMU7 remain slightly progressive though there are inconsistencies in their individual productivity index for each time intervals. All these four DMUs demonstrate regress during the 2013–2014 period but display progress in the course of the 2015–2016 period. DMU2 records the highest score productivity performance during the 2013–2014 period. This is due to getting progressive results in technical and technological change efficiency. However, the inconsistent progress in total productivity factor from 2013–2018, as seen in Figure 4 above, can be attributable to the alternating downward and upward performances in the catch-up scores. But still, DMU2 scores the highest average with an MPI of 1.0532.
Figure 5 above describes the change in MPI averages for the whole period of 2013–2018. The DMUs are progressive during the first period (2013–2014) and had a backslide in the next period (2014–2015). Evidently, catch-up scores demonstrate an alternating trend while frontier scores follow a slightly upward move from below 1 value starting in the 2014–2015 period. It is during the period of 2017–2018 where MPI reached the highest score, which means that this period, the eight universities in New Zealand performed the best productivity despite the inconsistent progress of the catch-up and below the 1 value of the frontier.
Based on the result of the MPI analysis, a ranking list of universities is presented in Table 8. DMU2(LU), first, leads among the others in terms of overall productivity improvement for the period of 2013–2018. DMU4(UA) and DMU6(UO) turned out to be productive, in second and third place, despite achieving a “no-change” in technical efficiency. This is the effect of obtaining a “>1” frontier score which means these universities were able to adapt to the changes in the technological environment. DMU5(UC) and DMU7(UW) listed as fourth and fifth for they are able to acquire slightly above 1 scores for both catch-up and frontier efficiencies. The last three, DMU1, DMU8, and DMU3, demonstrate regress in productivity performance over the year periods. Though the scores are just some little below the “no-change” threshold, they are still considered non-productive at sixth, seventh, and eighth ranks.

5. Discussions

The measurement of efficiency index using MPI implies progress, regress, and no-changes. The results obtained through catch-up efficiency implicate that the relative efficiencies of the New Zealand universities are unstable and only show small progress. Obtaining an average highest score of 1.02 within the whole period means that there is no significant development in the productivity of these universities. This can also imply that the universities were able to maintain what was continuously being accomplished in the period of 2013 to 2018. The same goes for the results of the frontier-shift analysis. Having a maximum average value of 1.03 indicates no substantial developments in responding to technological advancement in the aspects of education. The result of total factor productivity with an average range of 0.97 to 1.05 signifies a small development in total productivity of all the universities in New Zealand. Something must be done to make sure that these universities will be more productive and developed in the future.
The study is limited to looking into the productivity of the eight universities in terms of the chosen input and output factors that have relations to the funding basis of the New Zealand government. Results turned out that in the span of six years, from 2013 to 2018, there was no significant increase in the input and output factors. In so, it can be assumed that these universities do not exhibit a significant improvement in terms of other aspects of development. For example, an increase in the enrolment population may be associated with offering new and innovative course programs. This may lead to an increase in research output since more students will be able to conduct research in a wider range of areas. Furthermore, more students will lead to an increase in funding allocation. Another way to increase research output is by hiring more research staff or enhancing mechanisms on faculty research compensation. However, since, according to the results, it turned out that there are no significant actions that happened to all the factors that may address the issues regarding the lack of funding.
The result of this study is limited to the aspects of efficiency in terms of the chosen input and output factors and can make several assumptions that are measurable. This study does not make any inferences regarding the quality of knowledge or graduates and any impacts on society or the economy. The same approach was used by previous studies cited in this paper while using different combinations of input and output factors, and a distinctive analytical model, although most of the studies from the past also measured the efficiencies in terms of index scores that can be interpreted in some ways.

6. Conclusions

The goal of this study is to analyze the efficiency of the eight New Zealand universities during the period of 2013 to 2018 to promote individual sustainable productivity. In order to achieve this, the DEA based Malmquist Productivity Index model is applied to the data obtained. The technical efficiency (catch-up), technological change (frontier-shift), and MPI were examined according to every year period to see which universities are progressing and regressing at a certain time and level.
It has been claimed that the performance rankings of New Zealand universities in the international academic environment are declining in the past few years. Policies regarding the funding models are to blame for this problem. Not enough funding may hinder progress and development to any institutions and sectors. New Zealand universities rely on their funding from the combination of student fees and government subsidies. The government allocates funds depending on the number of students, performance in terms of research outputs, and other factors. These universities will have to exploit whatever amount of funds they can get to pay for the yearly expenses, such as personnel costs, occupancy and property leases, utility costs, and other miscellaneous expenses necessary for university operation.
After analyzing the catch-up efficiencies of the universities, the findings show that only three universities perform with progress, while three have no substantial change and two have regressed. The results also show that during the period of 2013–2016, there are five out of eight, or 62.5%, of the universities neither progressed no regressed Though during the 2015–2016 period, three universities showed little improvement. The efficiencies of these universities can be improved by employing more competent academic staff and hardworking general staff. Technically increasing the number of valuable personnel is one of the keys to becoming efficient. While the number of personnel is increasing, the number of enrollees must also increase. Escalating their numbers may result in an improved number of research outputs. If there is an increase in personnel and research outputs, the New Zealand government must also increase some funding, since EFTS is based on full-time student headcount and PBRF from research outputs. The downward trend for the catch-up may stop if universities will continue to improve their performance following the upward move during the 2014–2016 period of 2.8% increase from 0.9875 to 1.0152. This improvement is quite low, so a higher efficiency increase is recommended in the next year period.
Contrary to catch-up efficiency, frontier-shift results demonstrate slightly positive performance. This represents that certain external conditions, such as competitions, technological changes, innovations, regulatory and political environment, etc., equally affect all the universities. Though the results are stable with a horizontal trend, it can be noted that there was a decline of −2.51% during 2013–2-15 but an increase of 4.7% in 2016–2018 period. Similarly, the MPI also shows very small progress with a 1.0058 productivity index. This is unquestionable however since MPI is the product of the two previous efficiency measurements. Therefore, to further improve and move towards the positive progressive phase, universities around the world must consider addressing some problems in the organizational factors, such as personnel, facilities, laboratories, equipment, and student services, while taking considerations of the external elements that affect their operations especially the rapid change in technologies. In order to become economically sustainable, universities should focus on being updated with the latest innovations, especially in academic-related systems. Now that the delivery of instructions and services are being brought online, universities may consider overseas-learning mechanisms for foreign students, which may increase their income from external sources and research outputs while spending fewer local expenses. Overall, this study proves that New Zealand universities maintained very small progress in terms of productivity performance. Almost “no-change” in progress for the whole period of 2013 to 2018 was shown. This can be due to insufficient funds they receive that are hampering their growth and development. The assessment of the funding model implementation is suggested. The issues surrounding sustainable progress especially in the economic aspect can be addressed through improvement in efficiency and productivity. Education must be a top priority in terms of fund allocation in every country. However, while there are no actions in the crafting of better funding policies shown, universities may expand their income-generation projects to satisfy the insufficiency of funds. It is best to build strong partnerships with private institutions and industries which may help in sourcing additional funds that can be used for sustainable development of all universities.
This study has some limitations in terms of other aspects of sustainable education. Since the variables used for the evaluation of performance are related to financial factors, this paper focuses mainly on the economic pillar of sustainability. Other pillars, such as environmental and social pillars, are not considered, since the main goal of this study is to determine the effects of the New Zealand Government’s funding policies on the performance of the universities. Another reason is that most of the universities in New Zealand did not make it to the ranking list of other known international systems for rankings including the UI GreenMetric, which considers the environmental and social performances of different universities worldwide.
However, the study can be extended by integrating qualitative analysis models in multicriteria decision-making. Therefore, in future studies, several aspects related to the efficiency of the academy, such as quality of graduates, employability, university perception of employers, and other qualities, should be studied further. This paper can also be a guide for future performance measurements: not just in New Zealand, but for other countries as well.

Author Contributions

Conceptualization, C.-N.W. and H.T.; data curation, H.T. and D.H.D.; formal analysis, H.T.; funding acquisition, C.-N.W.; investigation, H.T.; methodology, C.-N.W., H.T. and V.T.N.; project administration, C.-N.W.; writing—original draft, H.T.; writing—review and editing, C.-N.W., V.T.N., and D.H.D. All authors have read and agreed to the published version of the manuscript.

Funding

This research is supported by the Taiwan National Kaohsiung University of Science and Technology.

Acknowledgments

The authors appreciate the support from Taiwan National Kaohsiung University of Science and Technology, Philippines Technological University of the Philippines Taguig, and Taiwan Ministry of Sciences and Technology.

Conflicts of Interest

The authors declare no conflict of interest.

References

  1. Smart, W. The impact of the performance-based research fund on the research productivity of New Zealand universities. Soc. Policy J. N. Z. 2009, 34, 136–151. [Google Scholar]
  2. Benade, L.; Devine, N.; Stewart, G. The 2019 PBRF Review: What’s to be Done? Springer: Berlin/Heidelberg, Germany, 2019. [Google Scholar]
  3. Curtis, B.; Matthewman, S. The managed university: The PBRF, its impacts and staff attitudes. N. Z. J. Employ. Relat. 2005, 30, 1. [Google Scholar]
  4. We Collate the Annual Audited Data on the Financial Performance of All Public Tertiary Education Institutions (TEIs) for Comparative Purposes. Available online: https://www.tec.govt.nz/funding/funding-and-performance/performance/financial/ (accessed on 10 November 2019).
  5. McLaughlin, M. Tertiary Education Policy in New Zealand; Ian Axford New Zealand Fellowship in Public Policy: Wellington, New Zealand, 2003. [Google Scholar]
  6. Buela-Casal, G.; Gutiérrez-Martínez, O.; Bermúdez-Sánchez, M.P.; Vadillo-Muñoz, O. Comparative study of international academic rankings of universities. Scientometrics 2007, 71, 349–365. [Google Scholar] [CrossRef]
  7. NZ Funding Model Means Ongoing Rankings Fall Likely. Available online: https://www.auckland.ac.nz/en/news/2018/09/27/funding-model-makes-nz-universities-ratings-falls-likely.html/ (accessed on 3 November 2019).
  8. Hjalmarsson, L.; Kumbhakar, S.C.; Heshmati, A. DEA, DFA and SFA: A comparison. J. Product. Anal. 1996, 7, 303–327. [Google Scholar] [CrossRef]
  9. Kipesha, E.F.; Msigwa, R. Efficiency of higher learning institutions: Evidences from public, universities in Tanzania. J. Educ. Pract. 2013, 4, 63–73. [Google Scholar]
  10. Daghbashyan, Z. Do University Units Differ in the Efficiency of Resource Utilization?:—A Case Study of the Royal Institute of Technology (KTH), Sweden; KTH Royal Institute of Technology: Stockholm, Sweden, 2009. [Google Scholar]
  11. Abbott, M.; Doucouliagos, C. The efficiency of Australian universities: A data envelopment analysis. Econ. Educ. Rev. 2003, 22, 89–97. [Google Scholar] [CrossRef]
  12. Flegg, A.-T.; Allen, D.; Field, K.; Thurlow, T. Measuring the efficiency of British universities: A multi-period data envelopment analysis. Educ. Econ. 2004, 12, 231–249. [Google Scholar] [CrossRef]
  13. Katharaki, M.; Katharakis, G. A comparative assessment of Greek universities’ efficiency using quantitative analysis. Int. J. Educ. Res. 2010, 49, 115–128. [Google Scholar] [CrossRef]
  14. Liu, W.-B.; Wongcha, A.; Peng, K.-C. Adopting super-efficiency and tobit model on analyzing the efficiency of teacher’s colleges in Thailand. Int. J. New Trends Educ. Their Implic. 2012, 3, 176–188. [Google Scholar]
  15. Taylor, B.; Harris, G. Relative efficiency among South African universities: A data envelopment analysis. High. Educ. 2004, 47, 73–89. [Google Scholar] [CrossRef]
  16. Warning, S. Performance differences in German higher education: Empirical analysis of strategic groups. Rev. Ind. Organ. 2004, 24, 393–408. [Google Scholar] [CrossRef]
  17. Leitner, K.-H.; Prikoszovits, J.; Schaffhauser-Linzatti, M.; Stowasser, R.; Wagner, K. The impact of size and specialisation on universities’ department performance: A DEA analysis applied to Austrian universities. High. Educ. 2007, 53, 517–538. [Google Scholar] [CrossRef]
  18. Monfared, S.; Safi, M. Efficiency analysis of public universities in Iran using DEA approach: Importance of stakeholder’s perspective. J. Ind. Syst. Eng. 2012, 5, 185–197. [Google Scholar]
  19. Wolszczak-Derlacz, J.; Parteka, A. Efficiency of European public higher education institutions: A two-stage multicountry approach. Scientometrics 2011, 89, 887. [Google Scholar] [CrossRef] [Green Version]
  20. Pietrzak, M.; Pietrzak, P.; Baran, J. Efficiency assessment of public higher education with the application of Data Envelopment Analysis: The evidence from Poland. Online J. Appl. Knowl. Manag. 2016, 4, 59–73. [Google Scholar] [CrossRef] [Green Version]
  21. Jongbloed, B.W.; Vink, M. Assessing efficiency in British, Dutch and German universities. An application of data envelopment analysis. In Comparative Policy Studies in Higher Education; Goedegebuure, L.C.J., van Vught, F.A., Eds.; Lemma: Utrecht, The Netherlands, 1994; pp. 195–218. [Google Scholar]
  22. Johnes, J.; Johnes, G. Research funding and performance in UK university departments of economics: A frontier analysis. Econ. Educ. Rev. 1995, 14, 301–314. [Google Scholar] [CrossRef]
  23. Worthington, A.C.; Lee, B.L. Efficiency, technology and productivity change in Australian universities, 1998–2003. Econ. Educ. Rev. 2008, 27, 285–298. [Google Scholar] [CrossRef] [Green Version]
  24. Ismail, I.; Ramalingam, S.; Azahan, A.H.; Khezrimotlagh, D. Relative efficiency of public universities in Malaysia. Sch. J. Econ. Bus. Manag. 2014, 1, 606–612. [Google Scholar]
  25. Mahmudah, U.; Lola, M.S. The efficiency measurement of indonesian universities based on a fuzzy data envelopment analysis. Open J. Stat. 2016, 6, 1050. [Google Scholar] [CrossRef] [Green Version]
  26. Wang, C.-N.; Nguyen, T.-D.; Le, M.-D. Assessing performance efficiency of information and communication technology industry-forecasting and evaluating: The case in Vietnam. Appl. Sci. 2019, 9, 3996. [Google Scholar] [CrossRef] [Green Version]
  27. Asmild, M.; Paradi, J.C.; Aggarwall, V.; Schaffnit, C. Combining DEA window analysis with the Malmquist index approach in a study of the Canadian banking industry. J. Product. Anal. 2004, 21, 67–89. [Google Scholar] [CrossRef]
  28. Schaffnit, C.; Rosen, D.; Paradi, J.C. Best practice analysis of bank branches: An application of DEA in a large Canadian bank. Eur. J. Oper. Res. 1997, 98, 269–289. [Google Scholar] [CrossRef]
  29. Biørn, E.; Hagen, T.P.; Iversen, T.; Magnussen, J. The effect of activity-based financing on hospital efficiency: A panel data analysis of DEA efficiency scores 1992–2000. Health Care Manag. Sci. 2003, 6, 271–283. [Google Scholar] [CrossRef] [PubMed]
  30. Ouellette, P.; Vierstraete, V. Technological change and efficiency in the presence of quasi-fixed inputs: A DEA application to the hospital sector. Eur. J. Oper. Res. 2004, 154, 755–763. [Google Scholar] [CrossRef]
  31. Ferrier, G.D.; Rosko, M.D.; Valdmanis, V.G. Analysis of uncompensated hospital care using a DEA model of output congestion. Health Care Manag. Sci. 2006, 9, 181–188. [Google Scholar] [CrossRef] [PubMed]
  32. Wang, C.-N.; Huang, Y.-F.; Cheng, I.; Nguyen, V. A multi-criteria decision-making (mcdm) approach using hybrid scor metrics, ahp, and topsis for supplier evaluation and selection in the gas and oil industry. Processes 2018, 6, 252. [Google Scholar] [CrossRef] [Green Version]
  33. Kuo, R.; Lee, L.; Hu, T.-L. Developing a supplier selection system through integrating fuzzy AHP and fuzzy DEA: A case study on an auto lighting system company in Taiwan. Prod. Plan. Control 2010, 21, 468–484. [Google Scholar] [CrossRef]
  34. Kumar, A.; Jain, V.; Kumar, S. A comprehensive environment friendly approach for supplier selection. Omega 2014, 42, 109–123. [Google Scholar] [CrossRef]
  35. Shi, G.-M.; Bi, J.; Wang, J.-N. Chinese regional industrial energy efficiency evaluation based on a DEA model of fixing non-energy inputs. Energy Policy 2010, 38, 6172–6179. [Google Scholar] [CrossRef]
  36. Wang, C.-N.; Nguyen, V.; Thai, H.; Duong, D. Multi-criteria decision making (MCDM) approaches for solar power plant location selection in viet nam. Energies 2018, 11, 1504. [Google Scholar] [CrossRef] [Green Version]
  37. Wang, C.-N.; Le, T.-M.; Nguyen, H.-K.; Ngoc-Nguyen, H. Using the optimization algorithm to evaluate the energetic industry: A case study in Thailand. Processes 2019, 7, 87. [Google Scholar] [CrossRef] [Green Version]
  38. Ramanathan, R. Evaluating the comparative performance of countries of the Middle East and North Africa: A DEA application. Socio-Econ. Plan. Sci. 2006, 40, 156–167. [Google Scholar] [CrossRef]
  39. Sexton, T.R.; Lewis, H.F. Two-stage DEA: An application to major league baseball. J. Product. Anal. 2003, 19, 227–249. [Google Scholar] [CrossRef]
  40. Cullinane, K.; Song, D.-W.; Ji, P.; Wang, T.-F. An application of DEA windows analysis to container port production efficiency. Rev. Netw. Econ. 2004, 3. [Google Scholar] [CrossRef] [Green Version]
  41. Tarim, Ş.; Dener, H.I.; Tarim, Ş.A. Efficiency measurement in the hotel industry: Output factor constrained DEA application. Anatolia 2000, 11, 111–123. [Google Scholar] [CrossRef]
  42. Martín, J.C.; Roman, C. An application of DEA to measure the efficiency of Spanish airports prior to privatization. J. Air Transp. Manag. 2001, 7, 149–157. [Google Scholar] [CrossRef]
  43. Wang, C.-N.; Le, A. Measuring the macroeconomic performance among developed countries and asian developing countries: Past, present, and future. Sustainability 2018, 10, 3664. [Google Scholar] [CrossRef] [Green Version]
  44. Charnes, A.; Cooper, W.W.; Rhodes, E. Measuring the efficiency of decision making units. Eur. J. Oper. Res. 1978, 2, 429–444. [Google Scholar] [CrossRef]
  45. Banker, R.D.; Charnes, A.; Cooper, W.W. Some models for estimating technical and scale inefficiencies in data envelopment analysis. Manag. Sci. 1984, 30, 1078–1092. [Google Scholar] [CrossRef] [Green Version]
  46. Ahn, T.; Charnes, A.; Cooper, W.W. Some statistical and DEA evaluations of relative efficiencies of public and private institutions of higher learning. Socio-Econ. Plan. Sci. 1988, 22, 259–269. [Google Scholar] [CrossRef]
  47. Tone, K. A slacks-based measure of efficiency in data envelopment analysis. Eur. J. Oper. Res. 2001, 130, 498–509. [Google Scholar] [CrossRef] [Green Version]
  48. Khezrimotlagh, D.; Salleh, S.; Mohsenpour, Z. A new method in data envelopment analysis to find efficient decision making units and rank both technical efficient and inefficient DMUs together. Appl. Math. Sci. 2012, 6, 4609–4615. [Google Scholar]
  49. Caves, D.W.; Christensen, L.R.; Diewert, W.E. The economic theory of index numbers and the measurement of input, output, and productivity. Econom. J. Econom. Soc. 1982, 1393–1414. [Google Scholar] [CrossRef]
  50. Färe, R.; Grosskopf, S.; Lindgren, B.; Roos, P. Productivity changes in Swedish pharamacies 1980–1989: A non-parametric Malmquist approach. J. Product. Anal. 1992, 3, 85–101. [Google Scholar] [CrossRef]
  51. Puertas, R.; Marti, L. Sustainability in universities: DEA-Greenmetric. Sustainability 2019, 11, 3766. [Google Scholar] [CrossRef] [Green Version]
  52. Liu, N.C.; Cheng, Y. The academic ranking of world universities. High. Educ. Eur. 2005, 30, 127–136. [Google Scholar] [CrossRef]
  53. Driscoll, A.; De Noriega, D.C. Taking Ownership of Accreditation: Assessment Processes that Promote Institutional Improvement and Faculty Engagement; Stylus Publishing, LLC.: Sterling, VA, USA, 2006. [Google Scholar]
  54. Schwarz, S.; Westerheijden, D.F. Accreditation and Evaluation in the European Higher Education Area; Springer Science & Business Media: Berlin/Heidelberg, Germany, 2007; Volume 5. [Google Scholar]
Figure 1. Research development process.
Sustainability 12 05939 g001
Figure 2. Catch-up efficiency chart for every DMU per year periods.
Sustainability 12 05939 g002
Figure 3. Frontier-shift chart for every Decision-Making Units DMU per year.
Sustainability 12 05939 g003
Figure 4. Malmquist Productivity Index (MPI) chart for every DMU per year.
Sustainability 12 05939 g004
Figure 5. Malmquist productivity indexes mean averages for every year intervals.
Sustainability 12 05939 g005
Table 1. List of commonly used inputs and outputs.
Authors, Year of StudyInputs UsedOutputs UsedMethod/Efficiency ModelDecision Making Units
Jongbloed et al. 1994 [21]Labour expenditures
Material expenditures
Labour expenditures
Material expenditures
Labour expenditures
Material expenditures
FTE undergraduates
FTE postgraduates
Income from grants and contracts
Fulltime students
Part time students Auditing students Dissertations
Other publications
Number of students Non-core research funding (government, research enterprise, private foundations)
Cost efficiency model
60 Universities in UK from 1989–1991
28 Dutch universities from 1989–1991
48 Universities in Germany from 1989–1991
Johnes and Johnes, 1995 [22]Teaching/research and research only staff
Per capital research grants
Undergraduate student load
Papers and letters in academic journals
Journal articles Authored and edited books Published works Edited works
DEA36 UK Universities economics department
Worthington and Lee, 2008 [23]Academic staff
Non-academic staff
Non-labour expenditure
Undergraduate load
Postgraduate load
Undergraduate graduates
Postgraduate graduates
PhD graduates
National competitive grants Industry grants
Publication
Malmquist Index35 Australian Universities from 1998–2003 period
Ismail et al., 2014 [24]Postgraduate students Undergraduate students Academic staffPostgraduate graduates Undergraduate graduates
Graduates working Graduates opt for further studies Graduates opt for developing skills
DEA20 Public universities in Malaysia
Mahmudah and Lola, 2016 [25]Lecturer
Student
Department
Ratio
World rank
Presence rank
Impact rank
Openness rank
Excellence rank
Fuzzy DEA25 Indonesian universities
Table 2. List of the 8 universities in New Zealand.
DMU NoName of UniversitiesAbbreviation
DMU1Auckland University of TechnologyAUT
DMU2Lincoln UniversityLU
DMU3Massey UniversityMU
DMU4University of AucklandUA
DMU5University of CanterburyUC
DMU6University of OtagoUO
DMU7University of WaikatoUW
DMU8Victoria University of WellingtonVUW
Table 3. Summary of statistics for each year periods.
YearStatisticsASNASTENDGNPGTGTOR
2013Max2131277841,3655490495510,445973,471
Min2744565850430230660114,194
Average11401342.5021,881.883101.251908.755010.00419,108.63
SD598.88669.7310,581.941400.261308.302613.56253,096.63
2014Max2154278941,9555605474010,3451,012,839
Min2364224485460220680114,483
Average1142.381329.2521,633.133051.251888.134939.38433,258.75
SD615.56679.8410,930.701456.501243.882603.43262,112.95
2015Max2183289242,1005285491010,1951,074,624
Min3513314605440210650110,786
Average1177.251356.0021,731.252936.251944.384880.63455,076.63
SD599.33720.7110,948.151404.721311.972605.82277,202.28
2016Max2209312641,8655300535010,6501,092,586
Min3193314975400205605123,196
Average1158.131429.7521,950.632883.132113.754996.88472,512.63
SD584.88793.7210,796.351426.691389.112721.36280,268.84
2017Max2232312642,3005390562511,0151,068,364
Min3323593795410265675116,274
Average1098.381659.0021,935.632868.132111.884980.00489,487.25
SD544.64845.8410,995.241415.671461.922788.31274,563.43
2018Max2347320942,7605155575510,9101,143,864
Min3243402950475290765118,610
Average1117.381681.0022,118.753000.632243.755244.38506,085.75
SD573.40892.6811,141.501313.061486.352697.05294,702.14
Remarks: AS (Academic Staff), NAS (Nonacademic Staff), TE (Total Enrolment), NDG (Number of Degree Graduates), NPG (Number of Postgraduate Graduates), TG (Total Graduates), TOR (Total Operating Revenue).
Table 4. Results summary for 2015 time period.
ASNASTENDGNPGTGTOR
AS10.9203780.8836790.8420260.8820530.8980050.926228
NAS0.92037810.8357550.8395710.9128960.912210.990539
TE0.8836790.83575510.9319330.9458370.9785850.856424
NDG0.8420260.8395710.93193310.8398990.9619410.839957
NPG0.8820530.9128960.9458370.83989910.9562420.936537
TG0.8980050.912210.9785850.9619410.95624210.924321
TOR0.9262280.9905390.8564240.8399570.9365370.9243211
Remarks: AS (Academic Staff), NAS (Nonacademic Staff), TE (Total Enrolment), NDG (Number of Degree Graduates), NPG (Number of Postgraduate Graduates), TG (Total Graduates), TOR (Total Operating Revenue).
Table 5. Catch–up efficiency scores for the 2013–2018 period.
DMUsYear Periods
2013=>20142014=>20152015=>20162016=>20172017=>2018Average
DMU1111111
DMU21.096091590.916288711.091359076111.020747875
DMU31110.8478073151.0191160740.973384678
DMU4111111
DMU510.9902545691.0093697620.9721882071.0290879821.000180104
DMU6111111
DMU70.9836315790.993241351.0208183581.00268443611.000075145
DMU81110.9783232090.9243700930.98053866
Average1.0099653960.9874730791.01519340.9751253960.9965717690.996865808
Max1.0960915911.0913590761.0026844361.0290879821.020747875
Min0.9836315790.9162887110.8478073150.9243700930.973384678
SD0.0352684520.0290143880.031670090.0527300830.0312533330.014337993
Table 6. Frontier-shift efficiency scores for the 2013–2018 period.
DMUsYear Periods
2013=>20142014=>20152015=>20162016=>20172017=>2018Average
DMU11.0106930090.9364306380.9870858070.9978838311.018785620.990175781
DMU21.0645012161.0194021640.9917934140.9520023841.1308510441.031710045
DMU31.1339186171.006205160.940664540.9417444291.0179122331.008088996
DMU40.9886499651.0148441491.0208765561.0112787141.0053199661.00819387
DMU50.9729159750.9841781981.0324569011.0129798631.0018847191.000883131
DMU60.9842524771.0071333171.0177833971.1005429110.9940190751.020746235
DMU70.9844723080.9707245591.0090670171.0301824081.0924577721.017380813
DMU80.9699906310.967698920.9853207660.9404349091.1022869370.993146433
Average1.0136742750.9883271380.998131050.9983811811.0454396711.008790663
Max1.1339186171.0194021641.0324569011.1005429111.1308510441.031710045
Min0.9699906310.9364306380.940664540.9404349090.9940190750.990175781
SD0.057277620.0287549740.0288595080.054175030.0539262950.014125245
Table 7. Malmquist productivity efficiency scores for the 2013–2018 period.
DMUsYear Periods
2013=>20142014=>20152015=>20162016=>20172017=>2018Average
DMU11.0106930090.9364306380.9870858070.9978838311.018785620.990175781
DMU21.1667908300.9340666941.0824027440.9520023841.1308510441.053222739
DMU31.1339186171.0062051600.9406645400.7984178151.0373707190.983315370
DMU40.9886499651.0148441491.0208765561.0112787141.0053199661.008193870
DMU50.9729159750.9745869571.0421307760.9848070771.0310275241.001093662
DMU60.9842524771.0071333171.0177833971.1005429110.9940190751.020746235
DMU70.9683580510.9641637711.0300741361.0329478661.0924577721.017600319
DMU80.9699906310.9676989200.9853207660.9200492981.0189210790.972396139
Average1.0244461940.9756412011.0132923400.9747412371.0410941001.005843014
Max1.1667908301.0148441491.0824027441.1005429111.1308510441.053222739
Min0.9683580510.9340666940.9406645400.7984178150.9940190750.972396139
SD0.0793715620.0314520280.0426132280.0892701950.0467438200.025368462
Table 8. Summary of results based in MPI and the ranking.
MPI IndicatorDMUsUniversityRank
>1DMU2Lincoln University1
DMU6University of Otago2
DMU7University of Waikato3
DMU4University of Auckland4
DMU5University of Canterbury5
<1DMU1Auckland University of Technology6
DMU8Victoria University of Wellington7
DMU3Massey University8

