Article

Use of Calcite Mud from Paper Factories in Phosphorus Treatment

1
Faculty of Biotechnology, Chemistry and Environmental Engineering, Phenikaa University, Hanoi 12116, Vietnam
2
Phenikaa University Nano Institute (PHENA), Phenikaa University, Hanoi 12116, Vietnam
3
Resources Recycling Department, University of Science and Technology, 217, Gajeong-ro, Yuseong-gu, Daejeon 34113, Korea
4
Center for Carbon Mineralization, Mineral Resources Research Division, Korea Institute of Geoscience and Mineral Resources (KIGAM), 124 Gwahak-ro, Gajeong-dong, Yuseong-gu, Daejeon 34132, Korea
5
Department of Earth and Environmental Science, Korea University, Seoul 02841, Korea
*
Author to whom correspondence should be addressed.
Sustainability 2020, 12(15), 5982; https://doi.org/10.3390/su12155982
Submission received: 12 June 2020 / Revised: 14 July 2020 / Accepted: 16 July 2020 / Published: 24 July 2020
(This article belongs to the Special Issue EARTH 2019-Green Technologies for Resources and Materials Recycling)

Abstract

:
To use calcite mud waste generated from the paper production process, calcite mud was treated by calcination and then applied as a sorbent agent to remove phosphorus from an aqueous solution. The pre-treatment muds were characterized by scanning electron microscopy, Fourier transform infrared spectroscopy, and X-ray diffraction. The effects of calcite mud with different calcination temperatures on phosphorus removal were investigated. Different sorbent dosages, contact times, and initial phosphorus concentration conditions were also studied to understand the phosphorus removal mechanism. The results show that phosphorus removal efficiency was increased by increasing the calcination temperature of the mud. The phosphorus removal efficiency over 10 min increased by 35%, 82%, 98%, and 100% with 4.5, 6.75, 9.0, and 11.25 mg, respectively, of calcite mud calcined at 1000 °C. However, the efficiency decreased as initial phosphorus concentration increased. To study the phosphorus removal trend, the pseudo-first-order, pseudo-second-order, and intraparticle diffusion kinetic models were used. The Langmuir and Freundlich isotherm models were also used to further investigate the phosphorus adsorption mechanism characteristics of the calcite mud.

Graphical Abstract

1. Introduction

Phosphorous is an essential component in the global chemical industry, including in the production of batteries [1], detergent [2], and pharmaceuticals [3]. However, it is a non-renewable natural mineral resource. The excessive discharge of phosphorous from industrial factories to bodies of water could lead to eutrophication, water pollution, and severe environmental issues [4,5,6,7,8,9,10]. Removal of phosphorous pollution from the wastewater of industrial factories is an important issue due to the increasing amount of phosphorous discharged. Several studies were conducted in an effort to develop efficient and economical methods for the removal of phosphorous from wastewater [11,12,13,14]. Several approaches were developed, such as biological-based, crystallized, and chemical-based approaches [15,16,17]. The biological-based approach is known as the traditional approach, but it is not suitable for some kinds of wastewater due to the toxicity to the microorganisms within [18]. Hydroxyapatite (Ca10(PO4)6(OH)2) [19,20] and magnesium ammonium phosphate (MgNH4PO4) [21,22] are two chemicals used in the crystallized approach that can efficiently remove phosphorus in low and medium concentrations. This method can achieve a removal efficiency of up to 95.82% [19]. The chemical precipitation technique has attracted attention due to its high removal efficiency and simple process [23,24,25]. Other research using mussel shells to remove phosphorus achieved a high efficiency rate of 99% [25].
Using waste resources, such as calcite mud, in the removal of phosphorus in aqueous solutions has recently attracted considerable attention. This approach provides high rates of phosphorus removal and enables the possible use of the waste resources from other industries [25,26]. Calcite mud is a significant waste resource in the pulp and paper industries. It is discharged in paper production when converting wood chips into pulp. Approximately 0.47 m3 of calcite mud is produced from every ton of pulp [27]. The use of calcite mud is currently limited in the industries, with approximately 30% of the total calcite mud produced being retained, and almost 70% of the remaining calcite mud being discharged into the environment. Thus, critical environmental issues can arise without the careful management of calcite mud.
In this paper, we propose an efficient method for the removal of phosphorus in aqueous solutions using the discharged calcite mud. Calcite mud mostly contains calcium in the form of calcium oxide (CaO), calcium carbonate (CaCO3), and calcium hydroxide (Ca(OH)2) [28,29]. Calcium compounds can efficiently remove phosphorus with up to 100% efficiency through the fabrication of calcium hydroxide nanoparticles with a mass ratio between calcium and phosphorus of over 5.3 [30]. The calcium-based precipitation approach potentially provides high efficiency removal with few adverse effects. For instance, metal ions (e.g., Al3+, Fe3+) and anions (e.g., SO42−, Cl) are not produced in this precipitation approach as they are in methods using other metal salts. In an effort to develop a simple and efficient procedure for using calcite mud, we propose a heat-treatment method to synthesize CaO from the calcite mud and use it to efficiently precipitate phosphorus in aqueous solutions.

2. Materials and Methods

2.1. Pre-Treatment Calcite Mud

The calcite mud used in this study was gathered from the Moorim paper factory in city, South Korea. The mud was washed several times with distilled water, followed by drying for 24 h in an oven at 80 °C. The collected dried mud was calcined in a furnace at 800 or 1000 °C for 1 h each. The calcined mud samples were kept in sealed bottles to keep them from reacting with the oxygen in the air.

2.2. Batch Experiments

The phosphorus removal experiments were conducted using a batch method at room temperature. A stock solution of phosphorus of 60 mg TP/L (total phosphorus/liter) concentration was prepared by dissolving potassium dihydrogen orthophosphate salt (KH2PO4) (Daejung Chemicals & Metal Co., Korea) in distilled water. The solution was then stored in a glass bottle. A lower concentration phosphorus solution was produced by diluting the stock solution with denionized (DI) water based on experimental designs.
Different experimental designs are presented in Table 1, outlining the impact of different calcination temperatures, sorbent dosages, and phosphorus concentrations on efficiency of phosphorus removal. All experimental phosphorus solution volumes were set at 150 mL in 250 mL glass beakers at room temperature under a constant 200 rpm magnetic stirring rate. The phosphorus removal efficiency was recorded at different contact times of 1, 3, 7, 10, 20, and 60 min. After treatment, the solutions were filtered through a syringe filter (0.45 µm) to separate precipitates. Phosphorus concentration was analyzed by HS 3300 spectrophotometer (HUMAS, Korea) at a 880 nm wavelength. The phosphorus removal efficiency (E) and adsorption capacity (qe) were calculated using Equations (1) and (2), respectively [30]:
E % = C 0 C e C 0 × 100
q e mg / g = V ( C 0 C e ) W
where Ce (mg TP/L) denotes the equilibrium concentration of the remaining phosphorus after treatment, C0 (mg TP/L) denotes the initial concentration of total phosphorus, V (L) is the volume of phosphorus solution, and W (g) is the weight of the calcite mud.

2.3. Adsorption Kinetics

Adsorption kinetic models can be estimated by the adsorption rate to express the reaction mechanisms. Pseudo-first-order (PFO), pseudo-second-order (PSO), and intraparticle diffusion (IPD) kinetic models are three kinetic models commonly employed. The linearized form of the PFO, PSO, and IPD kinetic models are derived in Equations (3)–(5), respectively [31,32,33]:
log q e q t = k P F O 2.303 t + log q e
t q t = 1 q e t + 1 k P S O q e 2
q t = k I P D t 1 / 2 + c
where kPFO (min−1), kPSO (g∙ mg−1∙ min−1), and kIDP (mg∙ g−1∙ min−2) are the rate constants of the PFO, PSO, and IPD models, respectively; and qe (mg/g) and qt (mg/g) are the adsorption capacity at the equilibrium and at time (t) respectively.
To further investigate the characteristics of phosphorus adsorption of the calcite mud, Langmuir’s and Freundlich’s isotherm models were used. Langmuir’s and Freundlich’s isotherm models are expressed in Equations (6) and (7), respectively [31,33]. The experimental data, with a fixed dosage of calcite mud, W = 11.25 mg, and the initial phosphorus concentration, varied from 5 to 60 mg/g, were used in the fitting isotherm models:
q e = q m a x × k L a n g × C e 1 + k L a n g × C e
q e = k F r e u × C e n ,   n   <   1
where kLang is Langmuir’s constant; qmax (mg/g) and qe (mg/g) are the adsorption capacity at the maximum and equilibrium, respectively; and kFreu and n are Freundlich’s constants.

2.4. Characterizations

The crystals of the calcite mud waste and calcite mud samples at different calcination temperatures were observed using X-ray diffraction (XRD, BD2745N, Japan) with a 0.15406 nm Cu Kα source by ranging 2θ from 20° to 80°. The crystallite size (D) of the calcined muds was estimated by Scherrer’s equation, D = Kλ/βcosθ, where K denotes Scherrer’s constant, λ denotes the wavelength of the X-ray radiation, β represents the haft-width of the diffraction peak, and θ stands for the Bragg diffraction angle. The morphology of the calcite muds was measured by scanning electron microscopy (SEM; JSM-6380F, Japan) equipment. The characteristic functional group of the muds was recorded by Fourier transform infrared spectroscopy (FTIR; 6700 FTIR, Thermo Scientific Nicolet, USA) in attenuated total reflection (ATR) mode with a range of 400–4000 cm−1.

3. Results and Discussion

3.1. Characteristics of Muds

To analyze the crystal structure properties of the calcite mud and the prepared muds, XRD was investigated. For raw calcite mud, all the diffraction peaks were assigned to calcite (CaCO3), along with the pattern corresponding to PDF#72-1937, as depicted in Figure 1. The XRD peaks marked by C at 23.03°, 29.37°, 35.93°, 39.36°, 43.11°, 47.44°, 48.45°, 56.5°, 57.34°, 60.6°, and 64.59° 2θ responded to the (012), (104), (110), (113), (202), (018), (116), (211), (122), (214), and (300) planes of the calcite phase (PDF#72-1937), respectively [30]. The XRD patterns of the mud calcined at 800 °C (blue line) and 1000 °C (red line) are also presented in Figure 1. The results showed that the major peaks of the calcined muds matched very well with the cubic lime crystal phase (calcium oxide) (PDF#82-1690). The peaks marked by an asterisk at 32.24°, 37.4°, 53.92°, 64.24°, and 67.46° 2θ correspond to the (111), (200), (220), (311), and (222) planes of the calcium oxide phase (PDF#82-1690), respectively. The XRD peaks of the calcite mud calcined at 1000 °C (intensity = 2530 a.u.) were sharper and stronger in intensity than the peaks of the mud calcined at 800 °C (intensity = 2236 a.u.). The estimated average crystal size of calcined muds for all planes was about 39.75 nm for mud calcined at 800 °C and 41.11 nm for mud calcined at 1000 °C. The results showed that the crystallinity of the calcined mud improved, and the crystallite size increased with increasing calcination temperature.
Regarding the representative functional groups, FTIR analysis was applied. Figure 2 shows the FTIR patterns of calcite mud before and after heat treatment. The FTIR analysis of calcite mud showed sharp and intense vibration peaks at 712, 871, and 1426 cm−1, which are attributed to v4 (in-plane bending mode), v2 (out-of-plane bending mode), and v3 (antisymmetric stretching mode) of the CO32− group of the calcite, respectively (Figure 2a) [34]. However, after calcination treatment, the FTIR patterns of the mud were not observed in any carbonated group, as shown in Figure 2b. The wide band around 500 cm−1 corresponds to the Ca–O bonds in the calcined muds [35,36]. These FTIR results showed the effect of the adsorption process in the conversion of calcite, CaCO3, to calcium oxide, CaO, through high-temperature treatment.
The SEM images of calcite mud before and after heat treatment are presented in Figure 3. The raw calcite mud in the micrograph shows agglomerate units, irregular shape, and amorphous-like particles with a size range of 300 nm1 µm (Figure 3a). The morphology of calcite mud with the additive sintered at 1000 °C is illustrated in Figure 3b. It was converted to calcium oxide (CaO) when calcinated at 1000 °C because the CO2 gas was removed. The micrograph clearly shows new crystals of calcium oxide and separated particles. The shape of the CaO particles is irregularly hexagonal, with a size range of 2–4 µm. The CaO particle size became much larger due to the aggregation of CaO particles, perhaps due to the influence of the high temperature during the calcination process.

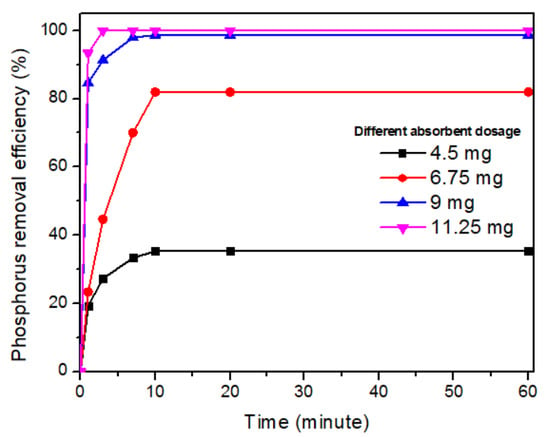
3.2. Phosphorus Removal

The effect of heat treatment on the efficiency of phosphorus removal was investigated. Raw calcite mud, calcite mud calcined at 800 °C, and calcite mud calcined at 1000 °C showed phosphorus removal efficiencies of 0%, 87.2%, and 100% within 60 min, respectively. The results showed that the efficiency of phosphorus removal increased significantly with increasing calcination temperature due to increasing calcium oxide quality in the samples. Therefore, the sample of calcite mud calcined at 1000 °C was used for further experiments to check the effect of dosage, contact time, and phosphorus concentration on the efficiency of phosphorus removal.
To research the effect of adsorbent dosage on the efficiency of phosphorus removal, different amounts of calcite mud, calcined at 1000 °C (4.5, 6.75, 9, and 11.25 mg), were added into a phosphorus solution of 150 mL with a constant phosphorus concentration of 15 mg TP/L. The phosphorus removal efficiency depended on the adsorbent dosage, as shown in Figure 4. The efficiency increased from 35.3% to 100% within 60 min when the calcite mud dosage was raised from 4.5 to 11.25 mg. The efficiency of phosphorus removal increased with increasing adsorbent dosage. This trend was also observed in various other studies on phosphorus removal. Torit et al. showed that the efficiency of phosphorus removal increased from 9% to 25% with increasing eggshell ash from 1 to 5 g [37]. The phosphorus removal efficiency was increased from 3% to 100% as the weight of lime sludge increased from 0.6 to 4.0 g/L at 75 mg TP/L phosphorus concentration within 30 min [38].
Figure 5a shows the effect of contact time on the efficiency of phosphorus removal. These experiments were performed with different calcite mud (calcined at 1000 °C) dosages in a phosphorus concentration of 15 mg TP/L, and the efficiencies were recorded at different time intervals. The results showed that the phosphorus removal rate rose very quickly within the initial 7 min of contact time due to the fresh active sorption sites on the surface of the sorbent, and then slowly increased until reaching equilibrium in 10 min, suggesting that the phosphorus ions, being full, filled out into the active sites on the surface of sorbent [30,37]. The phosphorus adsorption rate is presented in Figure 5b. The data showed that the adsorption capacity increased until chemical equilibrium, and the best adsorption capacity, 197.4 mg/g, was reached within 3 min at 11.25 mg of calcite mud calcined at 1000 °C.
The effect of phosphorus concentration on the efficiency of phosphorus removal is presented in Figure 6. Four initial phosphorus concentration experiments were performed in 150 mL of solution with a constant dosage 11.25 mg of calcite mud calcined at 1000 °C. The efficiency of phosphorus removal was 100% within 10 min in the initial phosphorus concentrations of 5 mg TP/L and 15 mg TP/L. However, the efficiency decreased with higher phosphorus concentrations due to there being more phosphorus ions than sorption sites on the surface of the sorbent.
The phosphorus removal efficiency decreases when the solid retention time increases due to the biomass yield rate, according to the United States Environmental Protection Agency report. In this study, the highest phosphorus removal efficiency (100%) with 11.25 mg of adsorbent was obtained from 3 to 60 min of contact time. After this time, the efficiency of phosphorus decreases due to phosphorus desorption. The retention time of phosphorus in this study was 60 min.

3.3. Adsorption Kinetics

The linearized forms of the PFO, PSO, and IPD models of the phosphorus adsorption concentration (Figure 7a), with the initial phosphorus concentrations (Co) of 30 mg/g and calcite mud (W) of 11.25 mg, are depicted in Figure 7b–d, respectively. Together, these show that the PSO model provides the best fitting. Thus, the adsorption mechanism was dominated by chemisorption. The fitting parameters of the models are shown in Table 2, in which the fitting correlation coefficient, R2, was the highest for the PSO model, at 0.9995. The R2 for the PFO and IPD models were 0.614 and 0.7837, respectively.
Because the PSO kinetic model provided the best fitting model, we used it to analyze the effect of initial phosphorus concentrations and the amount of calcite mud on the adsorption capacity. We changed the initial phosphorus concentration to a range of 5–60 mg TP/L, and the weight of calcite mud to a range of 4.5–11.25 mg. The fitting of the PSO model is shown in Figure 8. The fitting parameters of the models are shown in Table 3. The R2 values of all the fitting lines were very close to 1.0000, which means the PSO model represents the adsorption capacity of phosphorus very well. In addition, the estimated adsorption at the equilibriums agreed with the experimental data, with a normalized root mean square deviation (NRMSD) of 1.25% (7.16 mg).
The results in Table 3 show that the fitting parameters of the PSO kinetic model are different at the different experimental conditions. Usually, we expect to predict the adsorption capacity (Ce) at the equilibrium state when designing the experiment conditions;, for instance, the amount of Ce with a certain Co and W. Further analysis based on the predicted qe of the PSO models was conducted as shown in Figure 9. Figure 9a shows that the predicted qe had a linear relationship with the Co. The relationship is described in Equation (8), with the fitting correlation coefficient R2 of 0.9899. The increase in qe was about nine times the increase in Co, which meant that the proposed adsorption method was efficient. We think that the increase in qe would reach an equilibrium saturation state when all the calcite mud was fully reacted. However, qe reaches a peak when increasing the amount of calcite mud, W, as depicted in Figure 9b. The peak is at about 7 mg of the calcite mud with an initial phosphorus concentration of 15 mg TP/L. This phenomenon could be explained by the adsorption capacity achieving the maximum value when all the phosphorus was adsorbed or the adsorption efficiency of the calcite mud reached the maximum value; qe is inversely proportional to the amount of supplied calcite mud. Figure 9 also shows that the predicted qe of the PSO model agreed with the experimental data, as shown in Table 4.
q e = 9.26 × C o + 45.18
The fitting graphs in Figure 10 show good fitting by the Langmuir model. The R2 of Langmuir’s and Freundlich’s models were 0.9545 and 0.9474, respectively. The maximum adsorption capacity (qmax) could be predicted by Langmuir’s model as 851.42 mg/g. The high adsorption capability of the mud on the phosphorus was a monolayer, and the major adsorption mechanism was chemisorption.
In this study, the method efficiently removed 100% of the phosphorus at a concentration of 15 mg TP/L within 60 min. This is comparable to the crystallized method, with 95.82% efficiency using hydroxyapatite (Ca10(PO4)6(OH)2) [19], and the chemical precipitation method, with 99% efficiency, using mussel shells [25]. This method also produced no side effects, whereas the other metal salts method produce metal ions (e.g., Al3+, Fe3+) and anions (e.g., SO42−, Cl) [39,40,41,42,43]. The results of this study showed that the employment of pre-treated mud could be effective in removing phosphorus from wastewater. Another benefit of this method is that it provides a use for the discharged calcite mud from industrial factories.

4. Conclusions

In this work, a method for phosphorus removal by calcined calcite mud was proposed. We used a simple heat treatment method to synthesize CaO from the calcite mud, later used for removing the phosphorous in the wastewater. The calcite mud calcined at 1000 °C as a sorbent showed the most efficient phosphorus removal. The phosphorus removal efficiency increased with increasing sorbent dosage up to 11.25 mg and decreased with increasing initial phosphorus concentration (higher than 15 mg TP/L). The phosphorus adsorption capacity was studied with the pseudo-first-order, pseudo-second-order, and intraparticle diffusion kinetic models. Among the three kinetic models, the pseudo-second-order model provided the best fitting with the experiment data by a fitting correlation coefficient (R2) of 0.9995. In addition, Langmuir’s model fitted well with the experimental results. Therefore, the high adsorption capability of the calcite mud on the phosphorus was a monolayer, and the major adsorption mechanism was chemisorption.

Author Contributions

H.H.T.V. and M.D.K. planned and designed the experiment; H.H.T.V. and V.T.T. carried out the experiments; H.H.T.V., S.L., and D.V.Q. analyzed the data and wrote the paper; J.W.A., S.-h.J., and V.-D.D. reviewed and revised the manuscript. All authors have read and agreed to the published version of the manuscript.

Funding

This research was supported by the National Strategic Project-Carbon upcycling of the National Research Foundation of Korea (NRF) funded by the Ministry of Science and ICT (MSIT), the Ministry of Environment (ME), and the Ministry of Trade, Industry, and Energy (MOTIE) (2019M3D8A2112963). This research also supported by The Phenikaa University Foundation for Science and Technology Development.

Conflicts of Interest

The authors declare no conflict of interest.

References

  1. Ott, C.; Degg, A.; Walke, P.; Reiter, F.; Nilges, T. Influence of copper on the capacity of phosphorus-anode in sodium-ion-batteries. J. Solid State Chem. 2019, 270, 636–641. [Google Scholar] [CrossRef]
  2. Puijenbroek, P.J.T.M.V.; Beusen, A.H.W.; Bouwman, A.F. Datasets of the phosphorus content in laundry and dishwasher detergents. Data Brief 2018, 21, 2284–2289. [Google Scholar] [CrossRef] [PubMed]
  3. Eussen, S.R.B.; Verhagen, H.; Klungel, O.H.; Garssen, J.; Loveren, H.V.; Henk, J.V.K.; Rompelberg, C.J.M. Functional foods and dietary supplements: Products at the interface between pharma and nutrition. Eur. J. Pharmacol. 2011, 668, 2–9. [Google Scholar] [CrossRef] [PubMed]
  4. Harrison, R.M. Pollution: Causes, Effects, and Control, 3rd ed.; The Royal Society of Chemistry: London, UK, 1996. [Google Scholar]
  5. Kiely, G. Environmental Engineering; McGraw Hill: New York, NY, USA, 1997. [Google Scholar]
  6. Chen, M.; Chen, J.; Sun, F. Agricultural phosphorus flow and its environmental impacts in China. Sci. Total Environ. 2008, 405, 140–152. [Google Scholar] [CrossRef]
  7. Withers, P.J.A.; Elser, J.J.; Hilton, J.; Ohtake, H.; Schipper, W.J.; Dijk, K.C. Greening the global phosphorus cycle: How green chemistry can help achieve planetary P sustainability. Green Chem. 2015, 17, 2087–2099. [Google Scholar] [CrossRef] [Green Version]
  8. Zhao, S.; Xiao, J.; Zheng, T.; Liu, M.; Wu, H.; Liu, Z. Highly selective and sensitive detection of PO43—Ions in aqueous solution by a luminescent terbium metal-organic framework. ACS Omega 2019, 4, 16378–16384. [Google Scholar] [CrossRef] [Green Version]
  9. Blaas, H.; Kroeze, C. Excessive nitrogen and phosphorus in European rivers: 2000–2050. Ecol. Indic. 2016, 67, 328–337. [Google Scholar] [CrossRef]
  10. Ding, S.; Chen, M.; Gong, M.; Fan, X.; Qin, B.; Xu, H.; Gao, S.S.; Jin, Z.; Tsang, D.C.W.; Zhang, C. Internal phosphorus loading from sediments causes seasonal nitrogen limitation for harmful algal blooms. Sci. Total Environ. 2018, 625, 872–884. [Google Scholar] [CrossRef]
  11. Nandakumar, S.; Pipil, H.; Ray, S.; Haritash, A.K. Removal of phosphorus and nitrogen from wastewater in brachiaria-based constructed wetland. Chemosphere 2019, 233, 216–222. [Google Scholar] [CrossRef]
  12. Troesch, S.; Esser, D.; Molle, P. Nature rock phosphate: A sustainable solution for phosphorus removal from wastewater. Procedia Eng. 2019, 138, 119–126. [Google Scholar] [CrossRef]
  13. Monetti, J.; Ledezma, P.; Virdis, B.; Freguia, S. Nutrient recovery by bio-electro concentration is limited by wastewater conductivity. ACS Omega 2019, 4, 2152–2159. [Google Scholar] [CrossRef]
  14. Dai, H.; Lu, X.; Peng, Y.; Yang, Z.; Zhu, H. Effects of supersaturation control strategies on hydroxyapatite (HAP) crystallization for phosphorus recovery from wastewater. Environ. Sci. Pollut. Res. 2017, 24, 5791–5799. [Google Scholar] [CrossRef] [PubMed]
  15. Liu, B.; Nan, J.; Zu, X.; Zhang, X.; Huang, W.; Wang, W. La-based-adsorbents for efficient biological phosphorus treatment of wastewater: Synergistically strengthen of chemical and biological removal. Chemosphere 2020, 255, 127010. [Google Scholar] [CrossRef] [PubMed]
  16. Zou, H.; Wang, Y. Phosphorus removal and recovery from domestic wastewater in a novel process of enhanced biological phosphorus removal coupled with crystallization. Bioresour. Technol. 2016, 211, 87–92. [Google Scholar] [CrossRef] [PubMed]
  17. Mbamba, C.K.; Lindblom, E.; Alsina, X.F.; Tait, S.; Anderson, S.; Saagi, R.; Batstone, D.J.; Gernaey, K.V.; Jeppsson, U. Plant-wide model-based analysis of iron dosage strategies for chemical phosphorus removal in wastewater treatment systems. Water Res. 2019, 155, 12–25. [Google Scholar] [CrossRef] [PubMed]
  18. Zheng, X.L.; Sun, P.D.; Han, J.Y.; Song, Y.Q.; Hu, Z.R.; Fan, H.Q.; Lv, S.Y. Inhibitory factors affecting the process of enhanced biological phosphorus removal (EBPR)—A mini-review. Proc. Biochem. 2014, 49, 2207–2213. [Google Scholar] [CrossRef]
  19. Dai, H.L.; Lu, X.W.; Peng, Y.H.; Zou, H.M.; Shi, J. An efficient approach for phosphorus recovery from wastewater using series-coupled air-agitated crystallization reactors. Chemosphere 2016, 165, 211–220. [Google Scholar] [CrossRef]
  20. Qiu, L.P.; Wang, G.W.; Zhang, S.B.; Yang, Z.X.; Li, Y.B. An approach for phosphate removal with quartz sand, ceramsite, blast furnace slag and steel slag as seed crystal. Water Sci. Technol. 2012, 65, 1048–1053. [Google Scholar] [CrossRef]
  21. Bi, W.; Li, Y.Y.; Hu, Y.Y. Recovery of phosphorus and nitrogen from alkaline hydrolysis supernatant of excess sludge by magnesium ammonium phosphate. Bioresour. Technol. 2014, 166, 1–8. [Google Scholar] [CrossRef]
  22. Ye, Z.L.; Shen, Y.; Ye, X.; Zhang, Z.J.; Chen, S.H.; Shi, J.W. Phosphorus recovery from wastewater by struvite crystallization: Property of aggregates. J. Environ. Sci. 2014, 26, 991–1000. [Google Scholar] [CrossRef]
  23. Yang, M.; Shi, J.; Xu, Z.; Zhu, S.; Cui, Y. Phosphorus removal and recovery from Fosfomycin pharmaceutical wastewater by the induced crystallization process. J. Environ. Manag. 2019, 231, 207–212. [Google Scholar] [CrossRef] [PubMed]
  24. Zhang, J.; Bligh, M.W.; Liang, P.; Waite, T.D.; Huang, X. Phosphorus removal by in situ generated Fe (II): Efficacy, kinetics, and mechanism. Water Res. 2018, 136, 120–130. [Google Scholar] [CrossRef] [PubMed]
  25. Xiong, J.; Quin, Y.; Islam, E.; Yue, M.; Wang, W. Phosphate removal from solution using powdered freshwater mussel shells. Desalination 2011, 276, 317–321. [Google Scholar] [CrossRef]
  26. Namasivayam, C.; Sakoda, A.; Suzuki, M. Technical Note: Removal of phosphate by adsorption onto oyster shell powder-kinetic studies. J. Chem. Technol. Biotechnol. 2011, 80, 356–358. [Google Scholar] [CrossRef]
  27. Wirojanagud, W.; Tantemsapya, N.; Tantriratna, P. Precipitation of heavy metals by lime mud waste of pulp and paper mill. Songklanakarin J. Sci. Technol. 2004, 26, 45–53. [Google Scholar]
  28. Zhang, J.; Zheng, P.; Wang, Q. Lime mud from papermaking process as a potential ameliorant for pollutants at ambient conditions: A review. J. Clean. Prod. 2015, 103, 828–836. [Google Scholar] [CrossRef]
  29. Qin, J.; Cui, C.; Cui, X.Y.; Hussain, A.; Yang, C.M. Preparation and characterization of ceramsite from lime mud and coal fly ash. Constr. Build. Mater. 2015, 95, 10–17. [Google Scholar] [CrossRef]
  30. Vu, H.H.T.; Khan, M.D.; Chilakala, R.; Lai, T.Q.; Thenepalli, T.; Ahn, J.W.; Park, D.U.; Kim, J. Utilization of lime mud waste from paper mills for efficient phosphorus removal. Sustainability 2019, 11, 1524. [Google Scholar] [CrossRef] [Green Version]
  31. Habte, L.; Shiferaw, N.; Khan, M.D.; Thriveni, T.; Ahn, J.W. Sorption of Cd2+ and Pb2+ on aragonite synthesized from eggshell. Sustainability 2020, 12, 1174. [Google Scholar] [CrossRef] [Green Version]
  32. Robati, D. Pseudo-second-order kinetic equations for modeling adsorption systems for removal of lead ions using multiwalled carbon nanotube. J. Nanostruct. Chem. 2013, 3, 1–6. [Google Scholar] [CrossRef] [Green Version]
  33. Tran, C.V.; Quang, D.V.; Nguyen Thi, H.P.; Truong, T.N.; La, D.D. Effective removal of Pb (II) from aqueous media by a new design of Cu-Mg binary ferrite. ACS Omega 2020, 5, 7298–7306. [Google Scholar] [CrossRef] [PubMed]
  34. Makreski, P.; Jovanovski, G. Minerals from Macedonia IX. Distinction between some rhombohedral carbonates by FT IR spectroscopy. Bull. Chem. Technol. Macedonia 2003, 22, 25–32. [Google Scholar]
  35. Miguel, G.-R.; Juan, H.; Leticia, B.; Joaquin, N.-M.; Mario, E.R.-G. Characterization of calcium carbonate, calcium oxide, and calcium hydroxide as starting point to the improvement of lime for their use in construction. J. Mater. Civ. Eng. 2009, 22, 625–708. [Google Scholar]
  36. Mohadi, R.; Sueb, A.; Anggraini, K.; Lesbani, A. Calcium oxide catalyst base on quail eggshell for biodiesel systhesis from waste palm oil. J. Pure Appl. Chem. Res. 2018, 7, 130–139. [Google Scholar] [CrossRef]
  37. Torit, J.; Phihusut, D. Phosphorus removal from wastewater using eggshell ash. Environ. Sci. Pollut. Res. 2019, 26, 34101–34109. [Google Scholar] [CrossRef]
  38. Krishna, K.C.B.; Niaz, M.E.; Sarker, D.C.; Jansen, T. Phosphorus removal from aqueous solution can be enhance through the calcination of lime sludge. J. Environ. Manag. 2017, 2000, 359–365. [Google Scholar] [CrossRef]
  39. Ronkanen, A.K.; Marttila, H.; Celebi, A.; Klove, B. The role of aluminum and iron in phosphorus removal by treatment peatlands. Ecol. Eng. 2016, 86, 190–201. [Google Scholar] [CrossRef]
  40. Sima, T.V.; Letshwenyo, M.W.; Lebogang, L. Efficiency of waste clinker ash and iron oxide tailings for phosphorus removal from tertiary wastewater: Batch studies. Environ. Technol. Innov. 2018, 11, 49–63. [Google Scholar] [CrossRef]
  41. Jiang, C.; Jia, L.; He, Y.; Zhang, B.; Kirumba, G.; Xie, J. Adsorptive removal of phosphorus from aqueous solution using sponge iron and zeolite. J. Colloid Interface Sci. 2013, 402, 246–252. [Google Scholar] [CrossRef]
  42. Guo, G.; Ekama, G.A.; Wang, Y.; Dai, J.; Biswal, B.K.; Chen, G.; Wu, D. Advances in sulfur conversion associated enhanced biological phosphorus removal in sulfate-rich wastewater treatment: A review. Bioresour. Techol. 2019, 285, 121303. [Google Scholar] [CrossRef]
  43. Loganathan, P.; Vigneswaran, S.; Kandasamy, J.; Bolan, N.S. Removal and recovery of phosphate from water using sorption. Crit. Rev. Environ. Sci. Technol. 2014, 44, 8. [Google Scholar] [CrossRef]
Figure 1. XRD results of the raw calcite mud (black line), calcite mud at 800 °C (blue line), and calcite mud at 1000 °C (red line).
Sustainability 12 05982 g001
Figure 2. FTIR results for (a) the raw calcite mud and (b) the calcite mud calcined at 800 °C (blue line), and at 1000 °C (red line).
Sustainability 12 05982 g002
Figure 3. SEM images of (a) raw calcite mud and (b) calcite mud calcined at 1000 °C.
Sustainability 12 05982 g003
Figure 4. Effect of calcite mud (calcined at 1000 °C) dosage on phosphorus removal within 60 min.
Sustainability 12 05982 g004
Figure 5. (a) Effects of contact time on the efficiency of phosphorus removal, (b) kinetic studies of phosphorus adsorption by 11.25 mg of calcite mud calcined at 1000 °C.
Sustainability 12 05982 g005
Figure 6. Effect of phosphorus concentration on the efficiency of phosphorus removal.
Sustainability 12 05982 g006
Figure 7. Adsorption capacity (qt) versus time (t) of the phosphorus (a) and linearized kinetic models of the pseudo-first-order (PFO) (b), pseudo-second-order (PSO) (c), and intraparticle diffusion (IPD) (d).
Sustainability 12 05982 g007
Figure 8. Linearized form of the PSO kinetic model with variations of the initial phosphorus concentration, Co, (a) and amount of the calcite mud used, W (b).
Sustainability 12 05982 g008
Figure 9. The relationship between adsorption capacity at the equilibrium with the initial phosphorus concentration, Co (a), and amount of calcite mud used, W (b).
Sustainability 12 05982 g009
Figure 10. Fitting of Langmuir’s and Freundlich’s isotherm models of the phosphorus on the calcium mud.
Sustainability 12 05982 g010
Table 1. Details of the different experimental conditions.
ParameterValueExperiment Conditions
Calcination temperature
(°C)
0Phosphorus concentration = 15 mg TP/L, Sorbent dosage = 10 mg200 rpm of mixing speed, room temperature (25 °C),
150 mL volume of phosphorus solution
800
1000
Sorbent dosage
(mg)
4.5Phosphorus concentration = 15 mg TP/L, Calcite mud calcined at 1000 °C
6.75
9
11.25
Phosphorus concentration
(mg TP/L)
5Sorbent dosage = 11.25 mg,
Calcite mud calcined at 1000 °C
15
30
60
Table 2. Fitting parameters of linearized kinetic models.
Kinetic ModelsFitting ParametersUnitValues
Pseudo-first-order model
(PFO)
qemg/g98.79
kPFOmin−14.234
R20.614
Pseudo-second-order model
(PSO)
qemg/g342.47
kPSOg∙mg−1∙ min−10.0055
R20.9995
Intraparticle diffusion model
(IPD)
c275.15
kIPDmg∙ g−1∙min−29.751
R20.7837
Table 3. Fitting parameters of the PSO model on different initial phosphorus concentrations (Co) and amount of calcite mud used (W).
Experimental
Conditions
qe (Experiment)
(mg/g)
qe
(Model)
(mg/g)
kPSO
(g∙mg−1∙min−1)
R2
Co = 5 (mg TP/L)W = 11.25 (mg)66.6766.670.56251.0000
Co = 15 (mg TP/L)200.00200.000.31251.0000
Co = 30 (mg TP/L)341.33344.830.00570.9995
Co = 60 (mg TP/L)570.67588.240.00060.9998
W = 4.50 (mg)Co = 15 (mg TP/L)176.67178.570.01280.9997
W = 6.75 (mg)273.33277.77780.00290.9974
W = 9.00 (mg)246.67250.000.00411.0000
W = 11.25 (mg)200.00200.000.31251.0000
Table 4. Fitting parameters of Langmuir’s and Freundlich’s isotherm models.
Kinetic ModelsFitting ParametersValues
Langmuir’s isotherm modelqmax851.42 mg/g
kLang0.9820
R20.9545
Freundlich’s isotherm modeln0.57967
kFreu387.11
R20.9474

