Article

Assessing the Environmental Impact of Thermal Transmittance Tests Performed in Façades of Existing Buildings: The Case of Spain

by
David Bienvenido-Huertas
Department of Building Construction II, University of Seville, 41012 Seville, Spain
Sustainability 2020, 12(15), 6247; https://doi.org/10.3390/su12156247
Submission received: 1 July 2020 / Revised: 31 July 2020 / Accepted: 1 August 2020 / Published: 3 August 2020

Abstract

:
Thermal transmittance tests constitute an appropriate tool to assess the energy performance of existing buildings. The heat flow meter method and the thermometric method are the most used experimental methods. One of the main criteria to guarantee appropriate test conditions and the representation of results is to ensure a high thermal gradient. For this purpose, heating or air conditioning systems should be used from three to seven days. Most studies related to experimental methods have addressed the appropriate test conditions; however, the environmental impact related to these conditions have not been analyzed. This study analyzes the energy consumption and the CO2 emissions related to the conditions of the thermal gradient required for tests. An energy analysis of 129,600 cases located in Spain was conducted. The results showed that heating systems are the best option to perform thermal transmittance tests, whereas air conditioning systems do not guarantee appropriate test conditions. As for the energy consumption and the percentage of hours with an appropriate thermal gradient, the adequacy of the heating setpoint temperature according to the predicted estimations of the external temperature during tests would mitigate their environmental impact. The reason is that, in certain cases, the increase of the setpoint temperature does not improve test conditions. Also, the use of heating systems would imply short test durations. Finally, the selection of small rooms with a small façade length would reduce the percentage of CO2 emissions between 31.37% and 36.1%. The results of this study could guarantee a more sustainable performance of thermal transmittance tests. In addition, the results could be used to perform life cycle analysis on buildings where thermal transmittance tests are performed.

1. Introduction

Today’s society mainly aims to mitigate climate change and environmental degradation [1]. The reason is the possible degradation of the habitability conditions in the planet for future generations (temperature rise, melting of glaciers, sea level rise, extinction of species, and the emergence of new diseases) due to the high level of greenhouse gas emissions generated by the anthropogenic activities. These activities mainly include the use of dwellings because of their high energy consumption; dwellings are responsible for 40% of the energy consumption in the European Union, constituting around 25% of greenhouse gas emissions [2,3]. For this reason, various sustainable goals have been established and should be met by mid of the 21st century. The European Union aims to achieve a low-carbon economy for 2050 by removing the greenhouse gas emissions generated by anthropogenic activities [4]. Particularly, buildings should reduce their emissions by 90% with respect to the levels in 1990 [4].
To achieve this goal, building energy consumption should significantly be reduced and in turn a social current problem related to buildings, the energy poverty [5]. The energy consumption could be reduced by improving the energy performance of existing buildings. In this regard, the consumption generated by heating, ventilation and air conditioning (HVAC) systems are the main source of energy consumption [6,7]. This energy consumption would be reduced if there is previously an exhaustive energy analysis process of the building to define the most appropriate energy conservation measures [8].
One of the crucial aspects in the analysis process is to characterize the thermal behavior of the building envelope correctly [9,10] because of the effect of the heat transfer produced through the envelope on the building energy performance [11]. The thermal transmittance is among the thermal variables most analyzed and widely regulated by the legislation on energy efficiency in many countries [12]. The control of this variable allows the energy demand of the building to be controlled [13,14], and therefore the most appropriate energy conservation measures to be defined.
Regarding an existing building, the thermal transmittance could be determined by experimental methods as their reliability is greater than that of the theoretical method from International Organization for Standardization (ISO) 6946 [15]. The reason is that, in most cases, the accurate typology of layers, their thicknesses and thermal conductivity values are unknown [16], albeit recent studies by using artificial intelligence could be an opportunity to use the theoretical method more [17,18]. Nonetheless, experimental methods are today the best opportunity to characterize the thermal transmittance of existing buildings. A total of three methods with different characteristics can be distinguished: the method from ISO 9869-1 [19] (also known as heat flow meter method), infrared thermography methods [20,21,22,23,24] and the thermometric method [25,26,27]. The heat flow meter method is the only method developed by a standard, so professionals use it the most and many research studies have studied it [28,29]. The measurement of the heat flux of the wall and of the internal and external air temperatures is required to determine the thermal transmittance. This is a method used in many studies: (i) Lucchi [30,31] assessed historical brick and stone walls with the heat flow meter method. The results showed that the heat flow meter method allowed to characterize correctly the thermal transmittance of the walls, while the theoretical method overestimated the results; (ii) Rotilio et al. [32] also showed that the most suitable method to assess the thermal transmittance is the heat flow meter method. In their study, the authors obtained overestimates of up to 15% when the theoretical method was used; (iii) Asdrubali et al. [33] analyzed six walls designed following bio architecture principles. The results reflected deviations with the reference values that may be due to factors such as overestimation of the thermal conductivity values or environmental factors during the performance of the test; and (iv) Ficco et al. [16] evaluated seven typical walls with the heat flow meter method and with different probes. The results allowed obtaining an adequate degree of adjustment in all cases.
On the other hand, the thermometric method (also known as temperature based method [29]) is the most used by engineers, architects and energy auditors as it is used by several commercial measurement brands [28]. For example, the method is used in energy audit processes and for validation of energy simulation models [34,35]. This method consists in measuring the internal surface temperature and internal and external ambient temperatures. Since it is not necessary to measure the heat flux, the errors of up to 26% associated with the placement of the plate reported by Meng et al. [36] do not occur in the thermometric method. In the same study [36], the authors reflected that the error in evaluating the thermal transmittance with surface temperature measurements is reduced to 6%. The method has been validated through the tests carried out by Andújar-Márquez et al. [37], Bienvenido-Huertas et al. [25] and Kim et al. [26,27]. One of the main limitations of the thermometric method is the value associated with the total heat transfer coefficient. To reduce the errors associated with the use of a theoretical value for this coefficient, recent studies have made it possible to reduce these errors by using artificial neural networks in data analysis [38,39].
The heat flow meter method and the thermometric method have several operational requirements that limit obtaining representative results of the thermal transmittance [28]. The duration of the test [40], the analysis of north-facing walls [41], the moisture content [42], the direction of the heat flow [43], the post-processing of the data [44] and the location of the probes [36] are some of these requirements. However, one of its main aspects included in many studies is the need for having a high thermal gradient (i.e., a high temperature difference between the internal and external temperatures). Albatici and Tonelli [45], Desogus et al. [46], Gori and Elwell [47], Kim et al. [26,27] and Ficco et al. [16] established the need for reaching a thermal gradient of 10 °C to ensure a decrease in the error of thermal transmittance results. Furthermore, some specific types of walls may require higher thermal gradients, as is the case with the nearly zero energy building walls [48]. Nonetheless, reaching this thermal gradient could be something of a challenge if HVAC systems are not used. Bienvenido-Huertas et al. [25] detected that when HVAC systems are not used, then obtaining hours during tests with a thermal gradient greater than 5 °C is something of a challenge. Other studies have developed specific methods to ensure a high thermal gradient throughout the test. This is the case of the simple hot box-heat flow meter method developed by Meng et al. [49,50] that guarantees a thermal gradient of more than 20 °C during the test. However, the limitations of the placement of the simple hot box hinder a greater use of the method [28]. To guarantee appropriate test conditions, HVAC systems should be used throughout the test [20,46]. However, a prolonged use of HVAC systems could result in a significant energy impact if tests are performed for a long time and in many buildings. In this regard, all the existing research studies are focused on the analysis of optimal operational conditions to perform thermal transmittance tests, but not on the assessment of the possible environmental impact of performing tests with optimal operational conditions. This study therefore analyzes the environmental impact of guaranteeing a high thermal gradient during thermal transmittance tests. The analysis is focused on the heat flow meter method and the thermometric method for two reasons: (i) both methods are widely used by engineers, architects, energy auditors and researchers; and (ii) the conditions of thermal gradient and duration required for tests are similar. A total of 15 types of rooms with six types of façades located in Spain were used. In addition, 24 operational patterns of HVAC systems were used, as well as actual climate data between 2000 and 2019 in three Spanish cities (Cadiz, Jaen, and Seville), so the process included 129,600 cases. The results of this study are useful to know the environmental impact generated by thermal transmittance tests and the establishment of appropriate criteria to perform tests with a lower environmental impact. Likewise, the results of this study establish criteria and recommendations that could be followed to reduce the environmental impact of thermal transmittance tests. Finally, the results could be used as reference values to carry out life cycle analysis (LCA) of buildings in which thermal transmittance tests are carried out.

2. Methodology

2.1. Case Study

Various designs of rooms in buildings located in Spain were assessed to analyze the environmental impact of thermal transmittance tests. Spain was selected because of its old building stock, as more than 90% was built either without energy efficiency requirements or with not very demanding energy efficiency requirement [51,52]. A total of 15 types of rooms were designed (see Figure 1). These rooms were divided into groups of 5 rooms with the same surface area. The surface areas considered were 6, 9, and 12 m2. For each, 5 façade lengths were designed: 2, 3, 4, 5, and 6 m. These dimensions represent most room configurations of actual cases. Furthermore, rooms were designed facing north [41] and located in intermediate floors, so heat transmissions through horizontal elements (i.e., through ceiling or floor) were not produced. Rooms were 2.2 m height, all of them with a window of 1.5 × 1.0 m. Table 1 and Table 2 indicate the thermal properties of the elements in contact with the exterior (façade and window). A total of 3 types of façades (F) and 2 types of windows (W) were considered. Façades were selected according to the three building periods (BP) in Spain characterizing its building stock: (i) BP-1 corresponds to buildings built before 1979, when the first standard on energy efficiency was published in Spain (the Basic Document Norm on Thermal Conditions [53]); (ii) BP-2 corresponds to buildings built between 1979 and 2006, when the second standard on energy efficiency was established (the Spanish Building Technical Code [54]); and (iii) BP-3 corresponds to buildings built from 2006 to nowadays. This group of the Spanish building stock means that the buildings built in BP-1 are characterized by having a high thermal transmittance as insulating material in façades was not mandatory [52], whereas more recent buildings have lower thermal transmittance values [55]. As for windows, 2 possible types of windows of the room analyzed were considered as users could have replaced windows in old buildings or windows with low thermal properties could have been installed in buildings built after the Spanish Building Technical Code.
A total of 90 room designs were obtained by combining 15 types of rooms and 6 types of envelopes (combinations of 3 façades with 2 windows). These designs were modelled and simulated with EnergyPlus. As the assumption of using HVAC systems (heating or cooling) to acclimatize the indoor space during thermal transmittance tests was analyzed, the room was considered to have HVAC systems to be used throughout the test duration. The HVAC system was a heat pump with a coefficient of performance (COP) of 2.1 and an energy efficiency ratio (EER) of 2.0. A total of 24 operational patterns for HVAC systems (13 for heating and 11 for cooling) were analyzed by varying the setpoint temperature (see Table 3). The system operated throughout the test duration to guarantee a high thermal gradient. Regarding the test duration, the results were focused on the two thermal transmittance tests requiring more time to be performed [28]: the heat flow meter method [19] and the thermometric method [25]. Two duration hypotheses were considered according to the scientific literature: 3 days [16,19] or 7 days [33,41,45]. Occupancy or lighting system loads were not considered in simulations as the room was not entered during the test.

2.2. Environmental Data

Rooms were in 3 cities selected according to their climate classification: hot, cold, and coastal climate. For this purpose, the climate classification established in the Spanish Building Technical Code was used [54]. This climate classification establishes two groups according to the winter and summer climate severity of each city in Spain. The classification therefore allows estimation of the building performance in winter or summer. Based on this classification, the cities of Cadiz, Jaen, and Seville were selected. EnergyPlus Weather (EPW) files of each city were generated for the energy analysis. However, instead of generating an EPW file of the reference year of each city, EPW files were generated with actual climate data of each city in recent years. Hourly data of temperature and moisture in the 3 cities between 2000 and 2019 were obtained through the Spanish Meteorological Agency (see Figure 2). An EPW file was generated for each year, so 20 EPW files were used for each city. Thus, 15 room designs were analyzed with 6 envelope configurations (according to the existing building periods in Spain). These 90 combinations were analyzed with 24 operational patterns of HVAC systems (13 of heating and 11 of cooling). Finally, these 2160 combinations were analyzed with actual climate data from the last 20 years of the 3 Spanish cities located in different climate zones. As a result, 129,600 combinations were obtained. Considering that tests were performed for 3 or 7 days, a total of 25,228,800 and 10,812,342 tests, respectively, were generated. Regarding tests and in relation to the appropriate test conditions obtained with HVAC systems, the existing research studies indicate that a high thermal gradient is required. The greater the thermal gradient, the better the test conditions [25,45,46]. To propose actual conditions of the possible thermal gradient criteria followed by tests, the percentage of hours in which there was a thermal gradient greater than 5 °C (see Equation (1)) and a thermal gradient greater than 10 °C (see Equation (2)) was obtained.
Percentage   of   hours = i = 1 T d i T · 100   d i = 1                 i f   T i n T e x t 5 d i = 0                 i f   T i n T e x t < 5
Percentage   of   hours = i = 1 T d i T · 100   d i = 1                 i f   T i n T e x t 10 d i = 0                 i f   T i n T e x t < 10
where d i is a value assigned per each hour of test duration in which a high thermal gradient is obtained, T is the total test duration in hours (72 h for tests lasting 3 days, and 168 h for tests lasting 7 days), T i n is the internal temperature and T e x t is the external temperature.

3. Results and Discussion

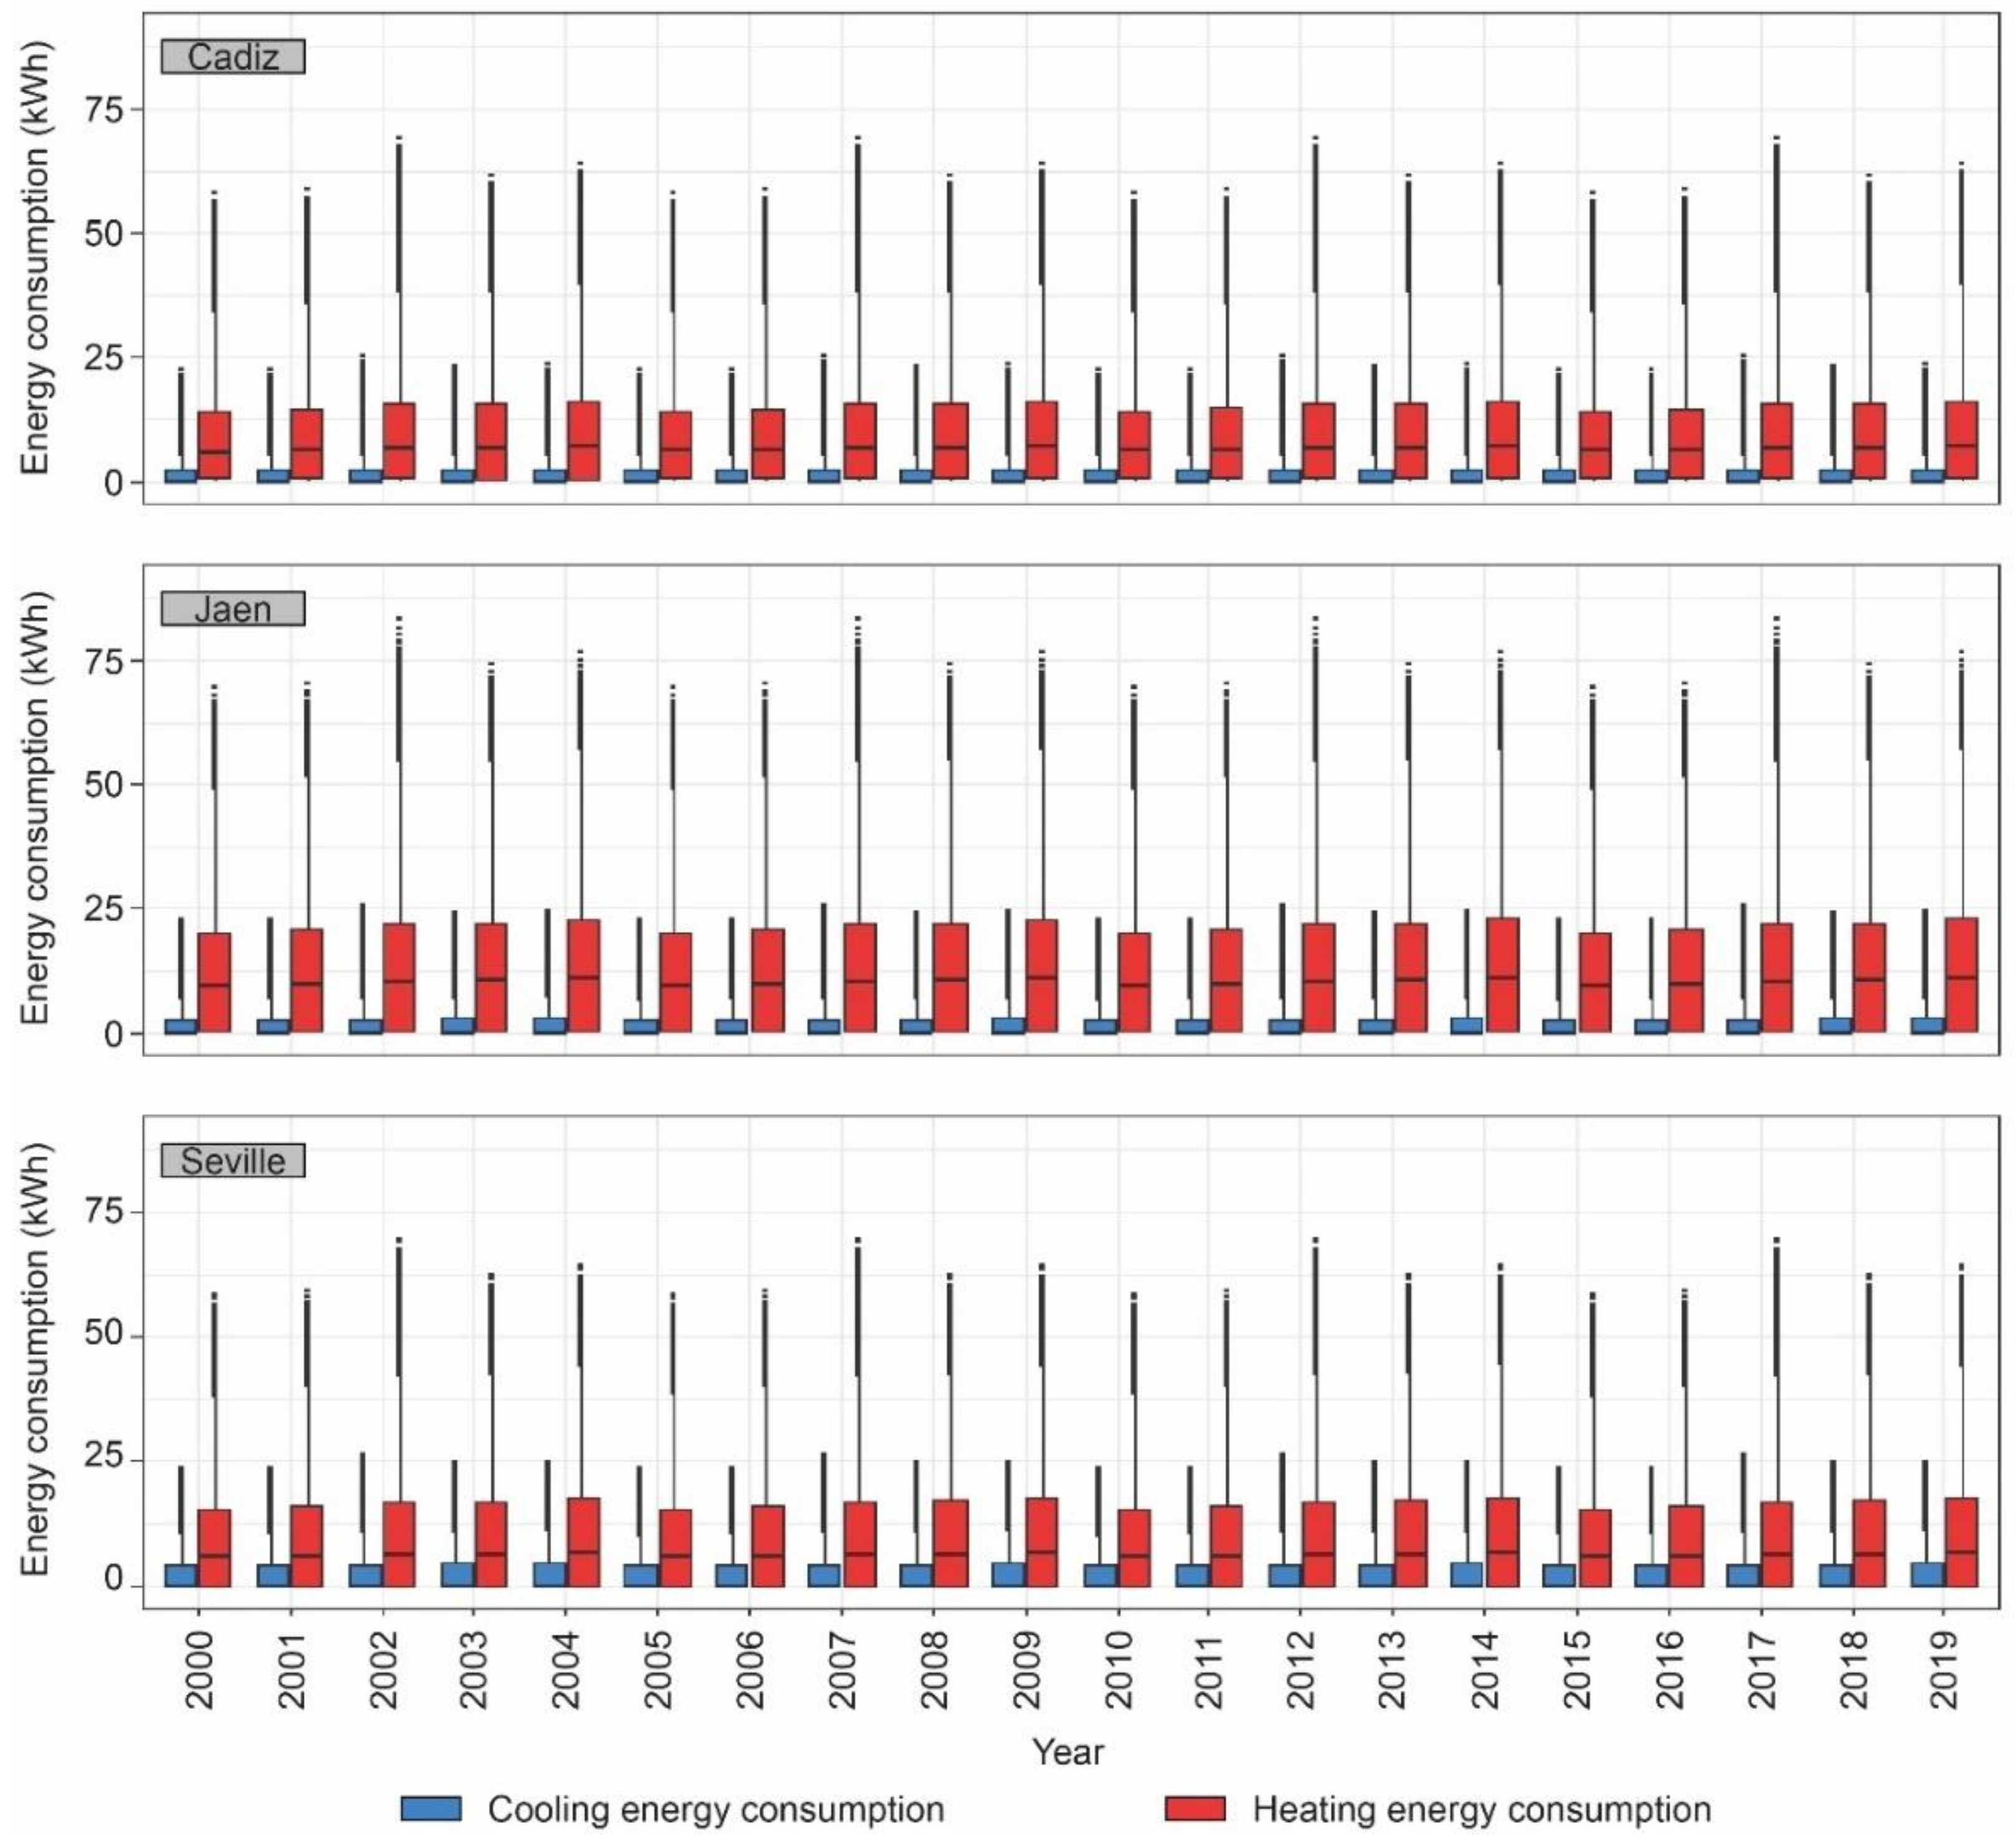
After the exhaustive energy simulation process, the results were analyzed. First, the tendencies found in the energy consumption were assessed with the climate data of the last years to know if there was a variation tendency. As previously indicated, the analysis was conducted by assessing whether tests were performed for 3 or 7 days. Figure 3 shows the yearly energy consumption data obtained with tests for 3 days, and Figure 4 the data obtained with tests for 7 days. The tendencies of data distributions were the same for the tests lasting 3 and 7 days, although the latter were obviously characterized by having a greater energy consumption. Tests lasting 7 days could result in an increase between 0.88 kWh and 66.5 kWh in the heating energy consumption, and between 2.60 kWh and 25.22 kWh in the cooling energy consumption. Regarding the energy consumption differences found between 2000 and 2019, no tendency was found (e.g., a decrease of the heating consumption by increasing the external temperature). The year 2017 obtained the greatest values of heating energy consumption. By comparing the results of energy consumption among the cities, the city with a lower winter climate severity (Cadiz) obtained lower values of heating energy consumption than the other two. In Jaen, quartile values increased between 3.49 kWh and 6.38 kWh, and in Seville the energy consumption increased between 0.43 kWh and 1.43 kWh. There was therefore a clear relationship between the heating energy consumption and the climate severity of the zone where the buildings assessed by thermal transmittance tests were located. The cooling energy consumption was lower than the heating energy consumption. In this regard, the cooling energy consumption presented an average decrease in all zones of 0.45 kWh in the first quartile, 6.47 kWh in the second quartile and 12.95 kWh in the third quartile, whereas values of 38.61 kWh were achieved in the maximum distribution values.
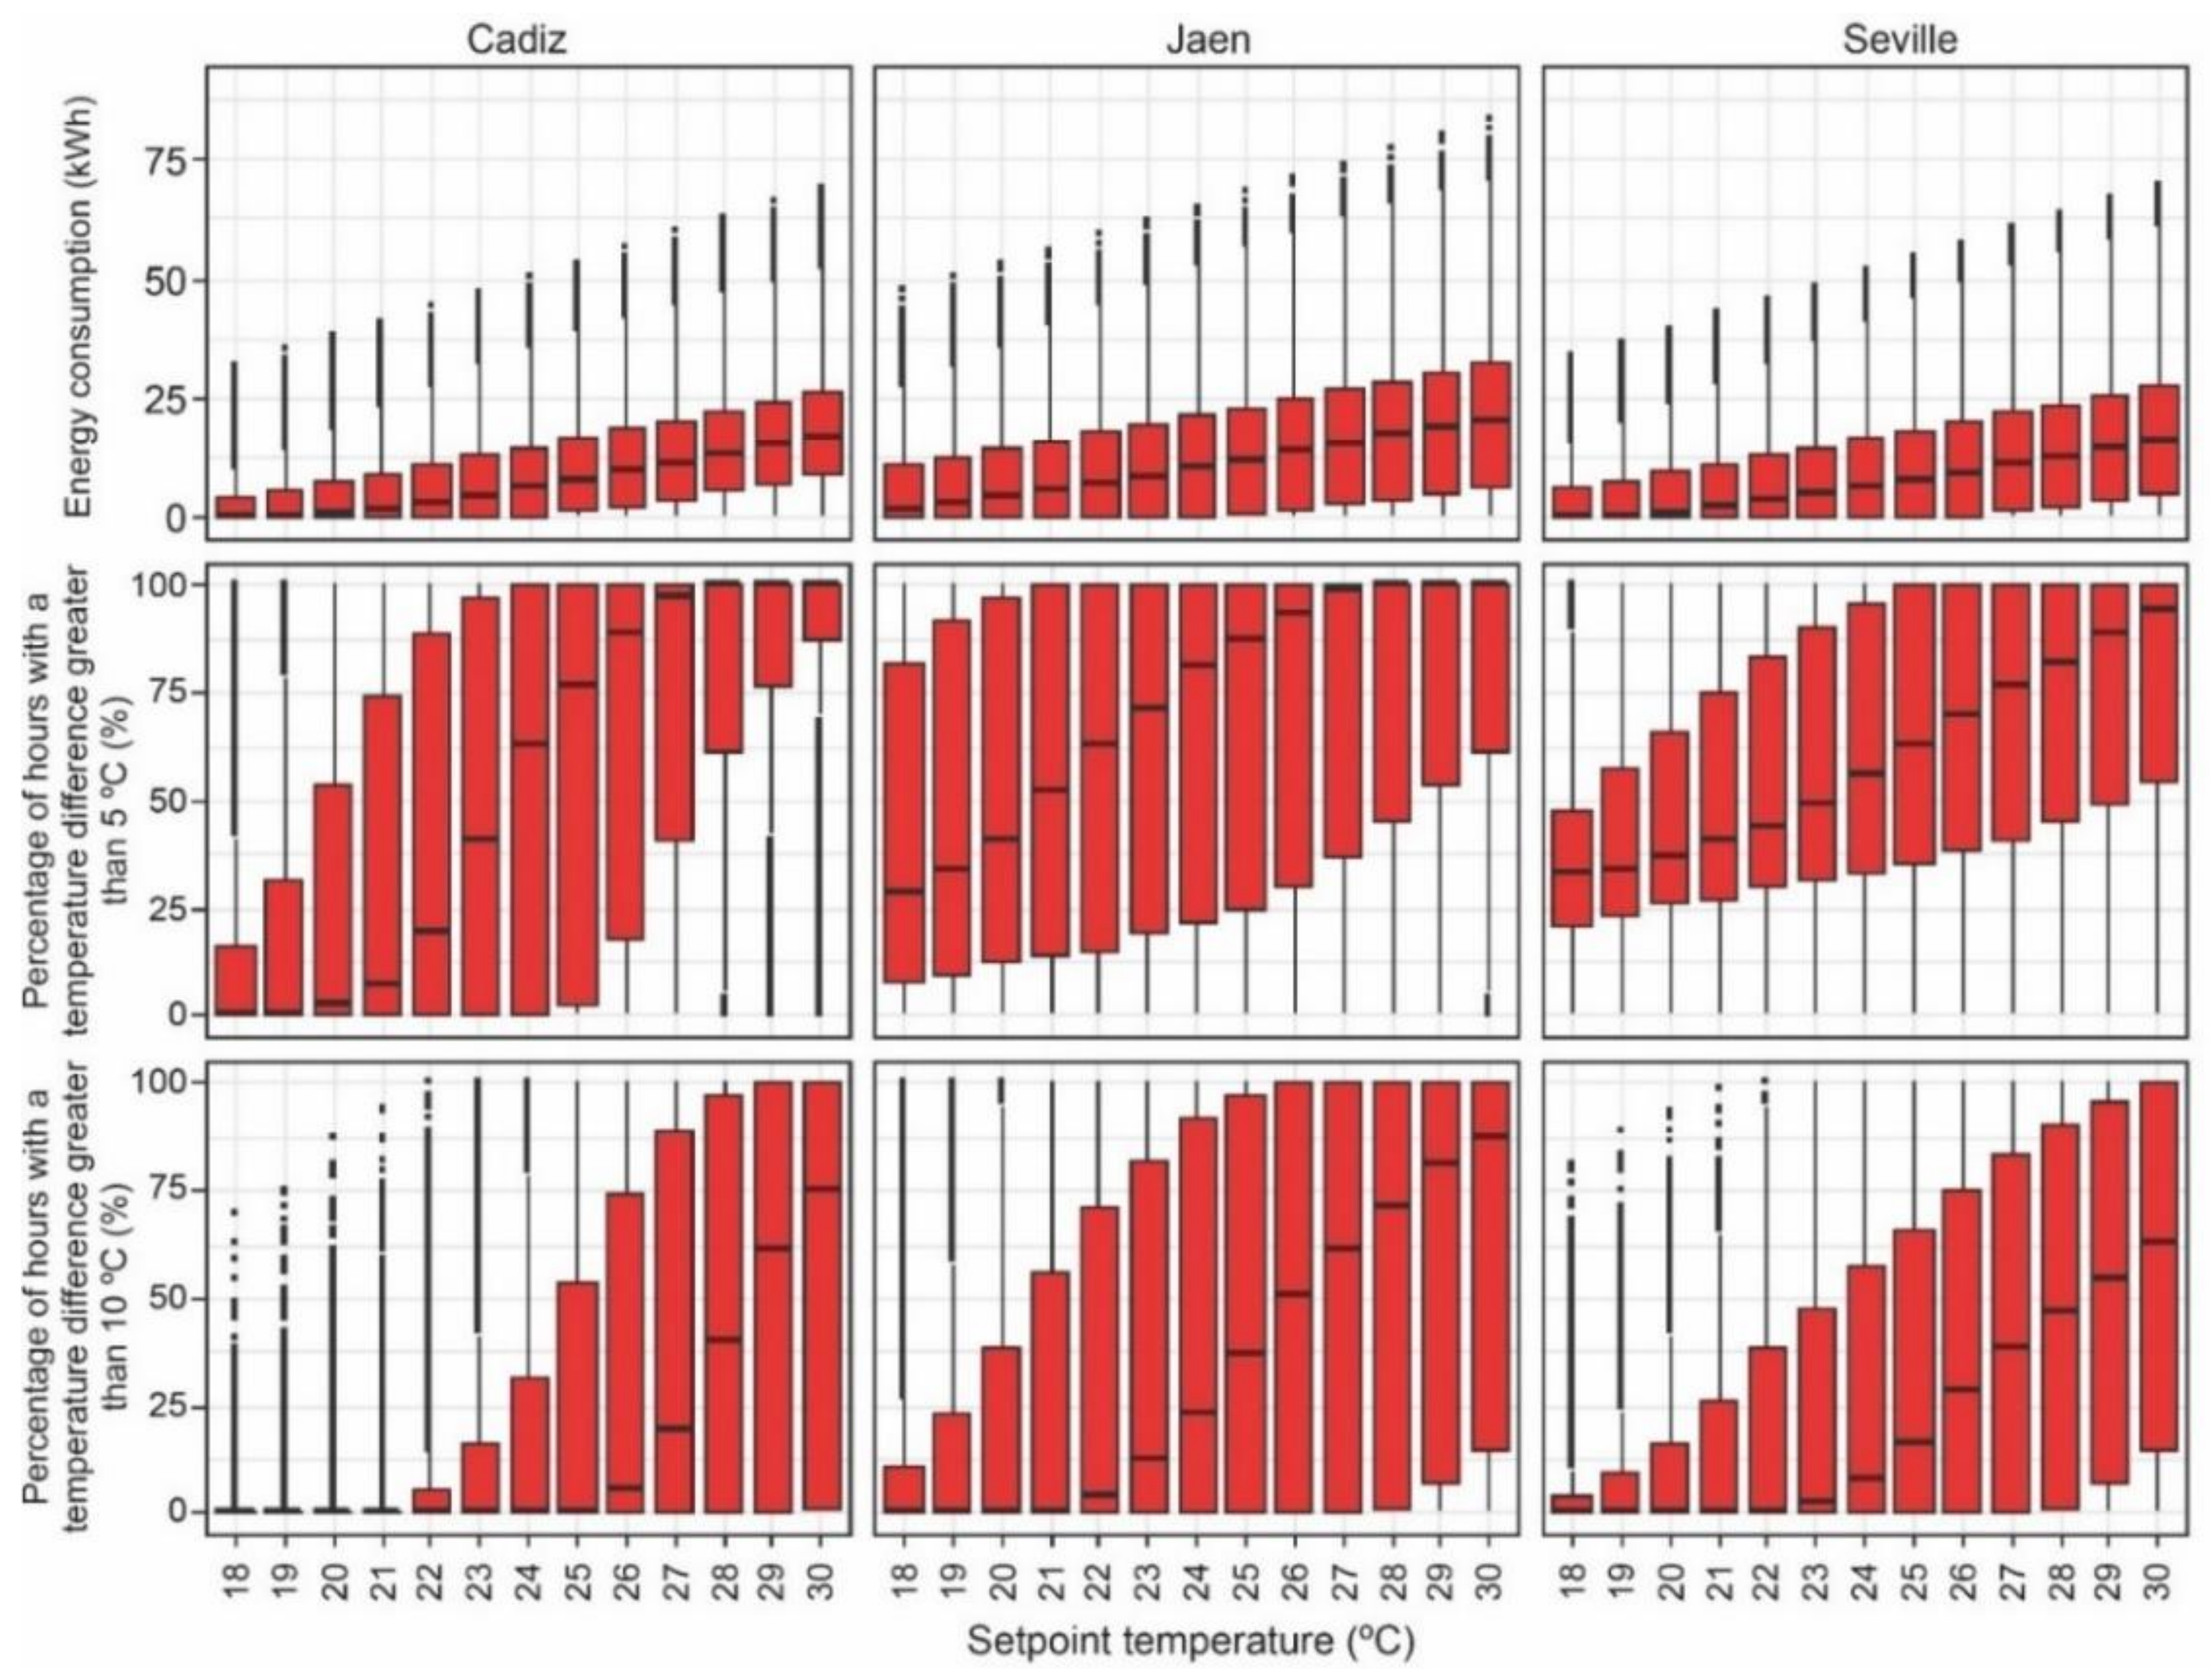
Thus, the use of air conditioning systems in thermal transmittance tests obtained a lower energy consumption than heating systems. However, heating or air conditioning systems were used to guarantee a high thermal gradient between the interior and the exterior so that the results obtained with the test could be representative. For this aspect, the setpoint temperature used and the number of hours with a high thermal gradient should be related, as well as the energy consumption and the setpoint temperature. Figure 5, Figure 6, Figure 7 and Figure 8 represent the data distributions obtained for heating and air conditioning systems according to the setpoint temperature and distinguishing the results for tests lasting 3 and 7 days. There was a clear relationship between the setpoint temperature used and performing the test correctly, as well as the possible environmental impact. Using a heating setpoint temperature of 18 °C was related not just to a low energy consumption, but also to a lower percentage of hours during the test in which a high thermal gradient was obtained. The use of a heating setpoint temperature of 18 °C implied that the quartile values of the distributions of a thermal gradient of 10 °C ranged between 0% and 10.96%. Although this setpoint temperature would ensure a greater percentage of hours with a criterion of a lower thermal gradient (i.e., 5 °C), the low values of the quartiles of the distributions did not ensure their suitability. Only in some cases with a very low external temperature could percentages close to 100% of the hours with this setpoint temperature could achieved; however, as distributions showed, these values corresponded to the outliers of the distributions as they corresponded to atypical days in the period of the 20 years analyzed. To therefore guarantee appropriate conditions to perform thermal transmittance tests, the heating setpoint temperature should be increased. This increase of the external temperature depends on the external climate conditions. As for Jaen, the use of a setpoint temperature of 24 °C obtained values of the third quartile greater than 91.78% in the percentage of hours with a thermal gradient of 10 °C, whereas for Cadiz or Seville, the setpoint temperature was increased at least by 28 °C. Nonetheless, this representation of the test conditions depends on the criteria used by the technician performing the tests and on the environmental conditions. First, if the criterion of thermal gradient is 5 °C, lower setpoint temperatures could be used to decrease the energy consumption. Second, it is crucial that the technician performs the test in the most appropriate periods, so that the cases in which the use of heating systems did not obtain a high number of hours with the thermal gradient considered by the technician are avoided. These periods did not just correspond to spring, summer or autumn, as in winter there were also cases in which the use of heating systems was not effective to achieve appropriate test conditions. For this reason, the use of air conditioning systems would achieve better results in less cold days. However, the results showed that the use of these systems, independently of the setpoint temperature, did not obtain valid results. The use of low setpoint temperatures in air conditioning systems did not improve the obtaining of a greater percentage of hours with a high thermal gradient. In some cases, the free running achieved in the room with a lower use of the cooling system (e.g., because of using a temperature of 28 °C) could achieve a certain percentage of hours with a thermal gradient of 5 °C corresponding to night hours. Nonetheless, the number of hours with a thermal gradient of 10 °C was almost null (between 0% and 0.62%), so it would not be advisable performing tests in summer by using air conditioning systems due to the daily oscillations of the external temperature which implied that a high thermal gradient was achieved only in specific moments of the day (e.g., at 16:00). Regarding the test duration, there was not a clear improvement in performing thermal transmittance tests in long periods if environmental conditions were controlled. The results showed that performing the test for 3 days achieved an average increase of 5.60% in the percentage of hours with a thermal gradient of 10 °C in comparison with those lasting 7 days. Likewise, tests lasting 3 days would reduce the energy consumption related to tests. The most appropriate procedure to perform tests would be 3 days using the lowest setpoint temperature, which guarantees the thermal gradient required by the technician based on the climate predictions of the external temperature.
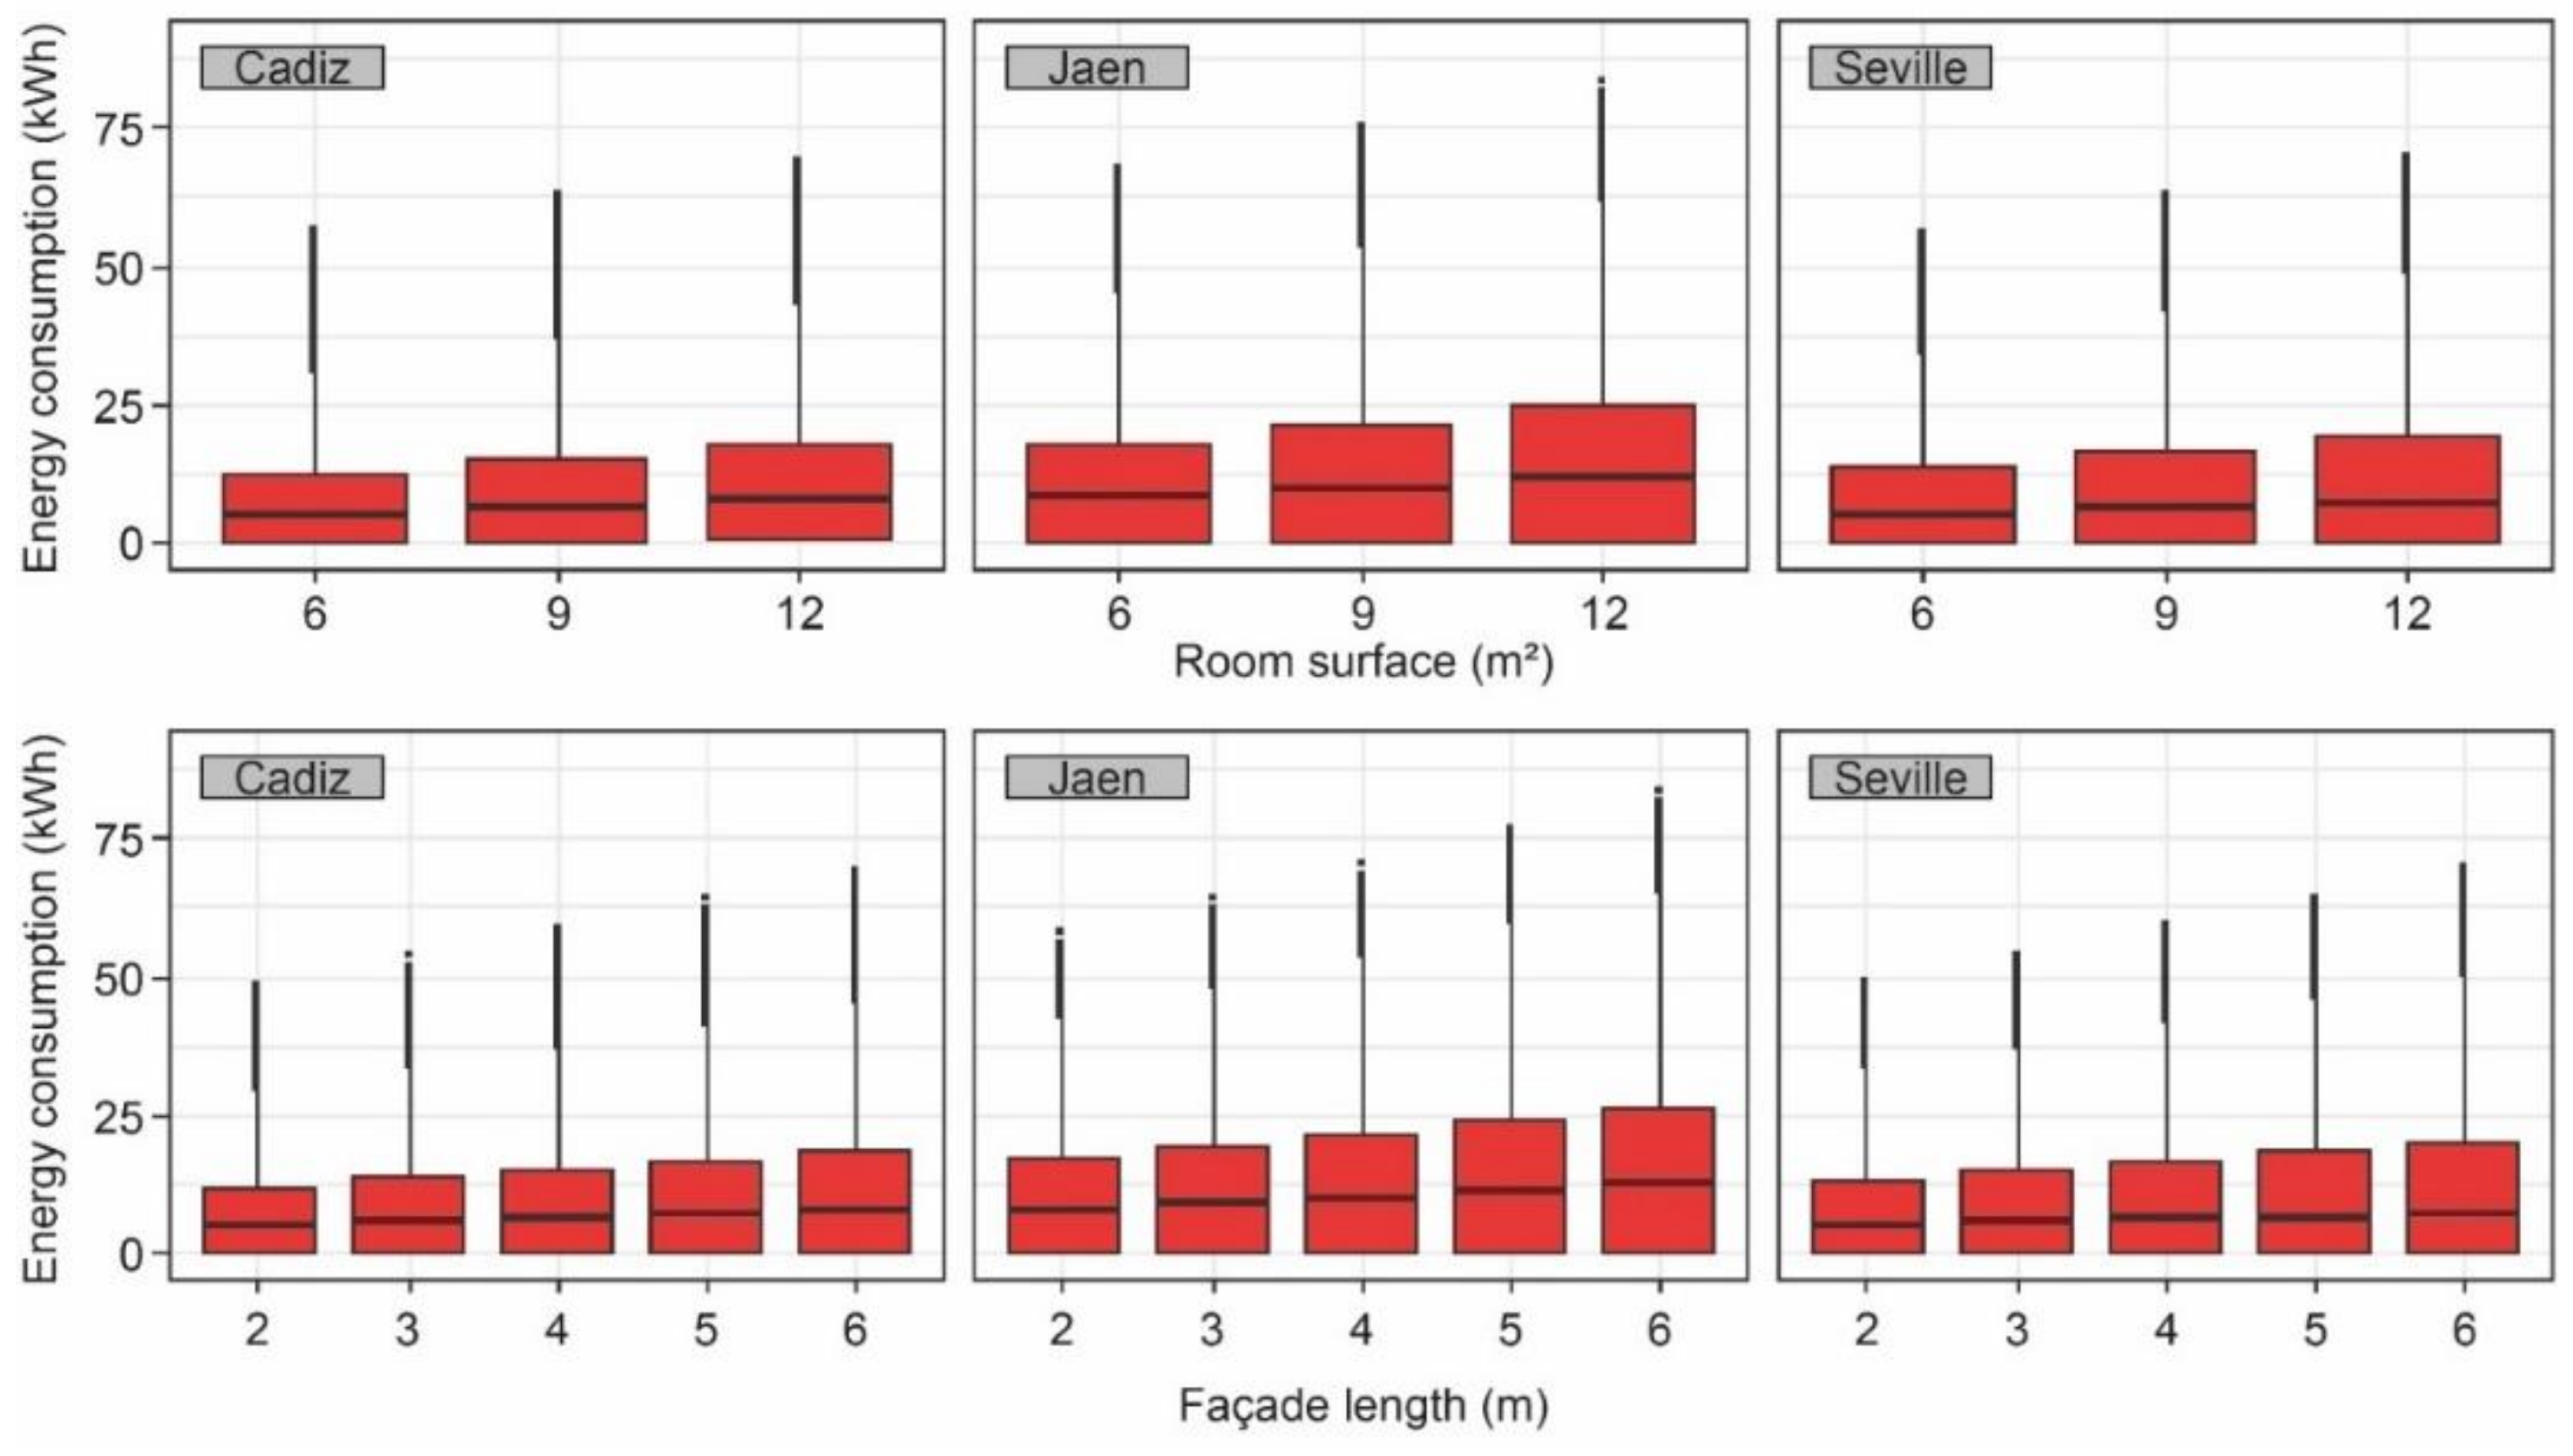
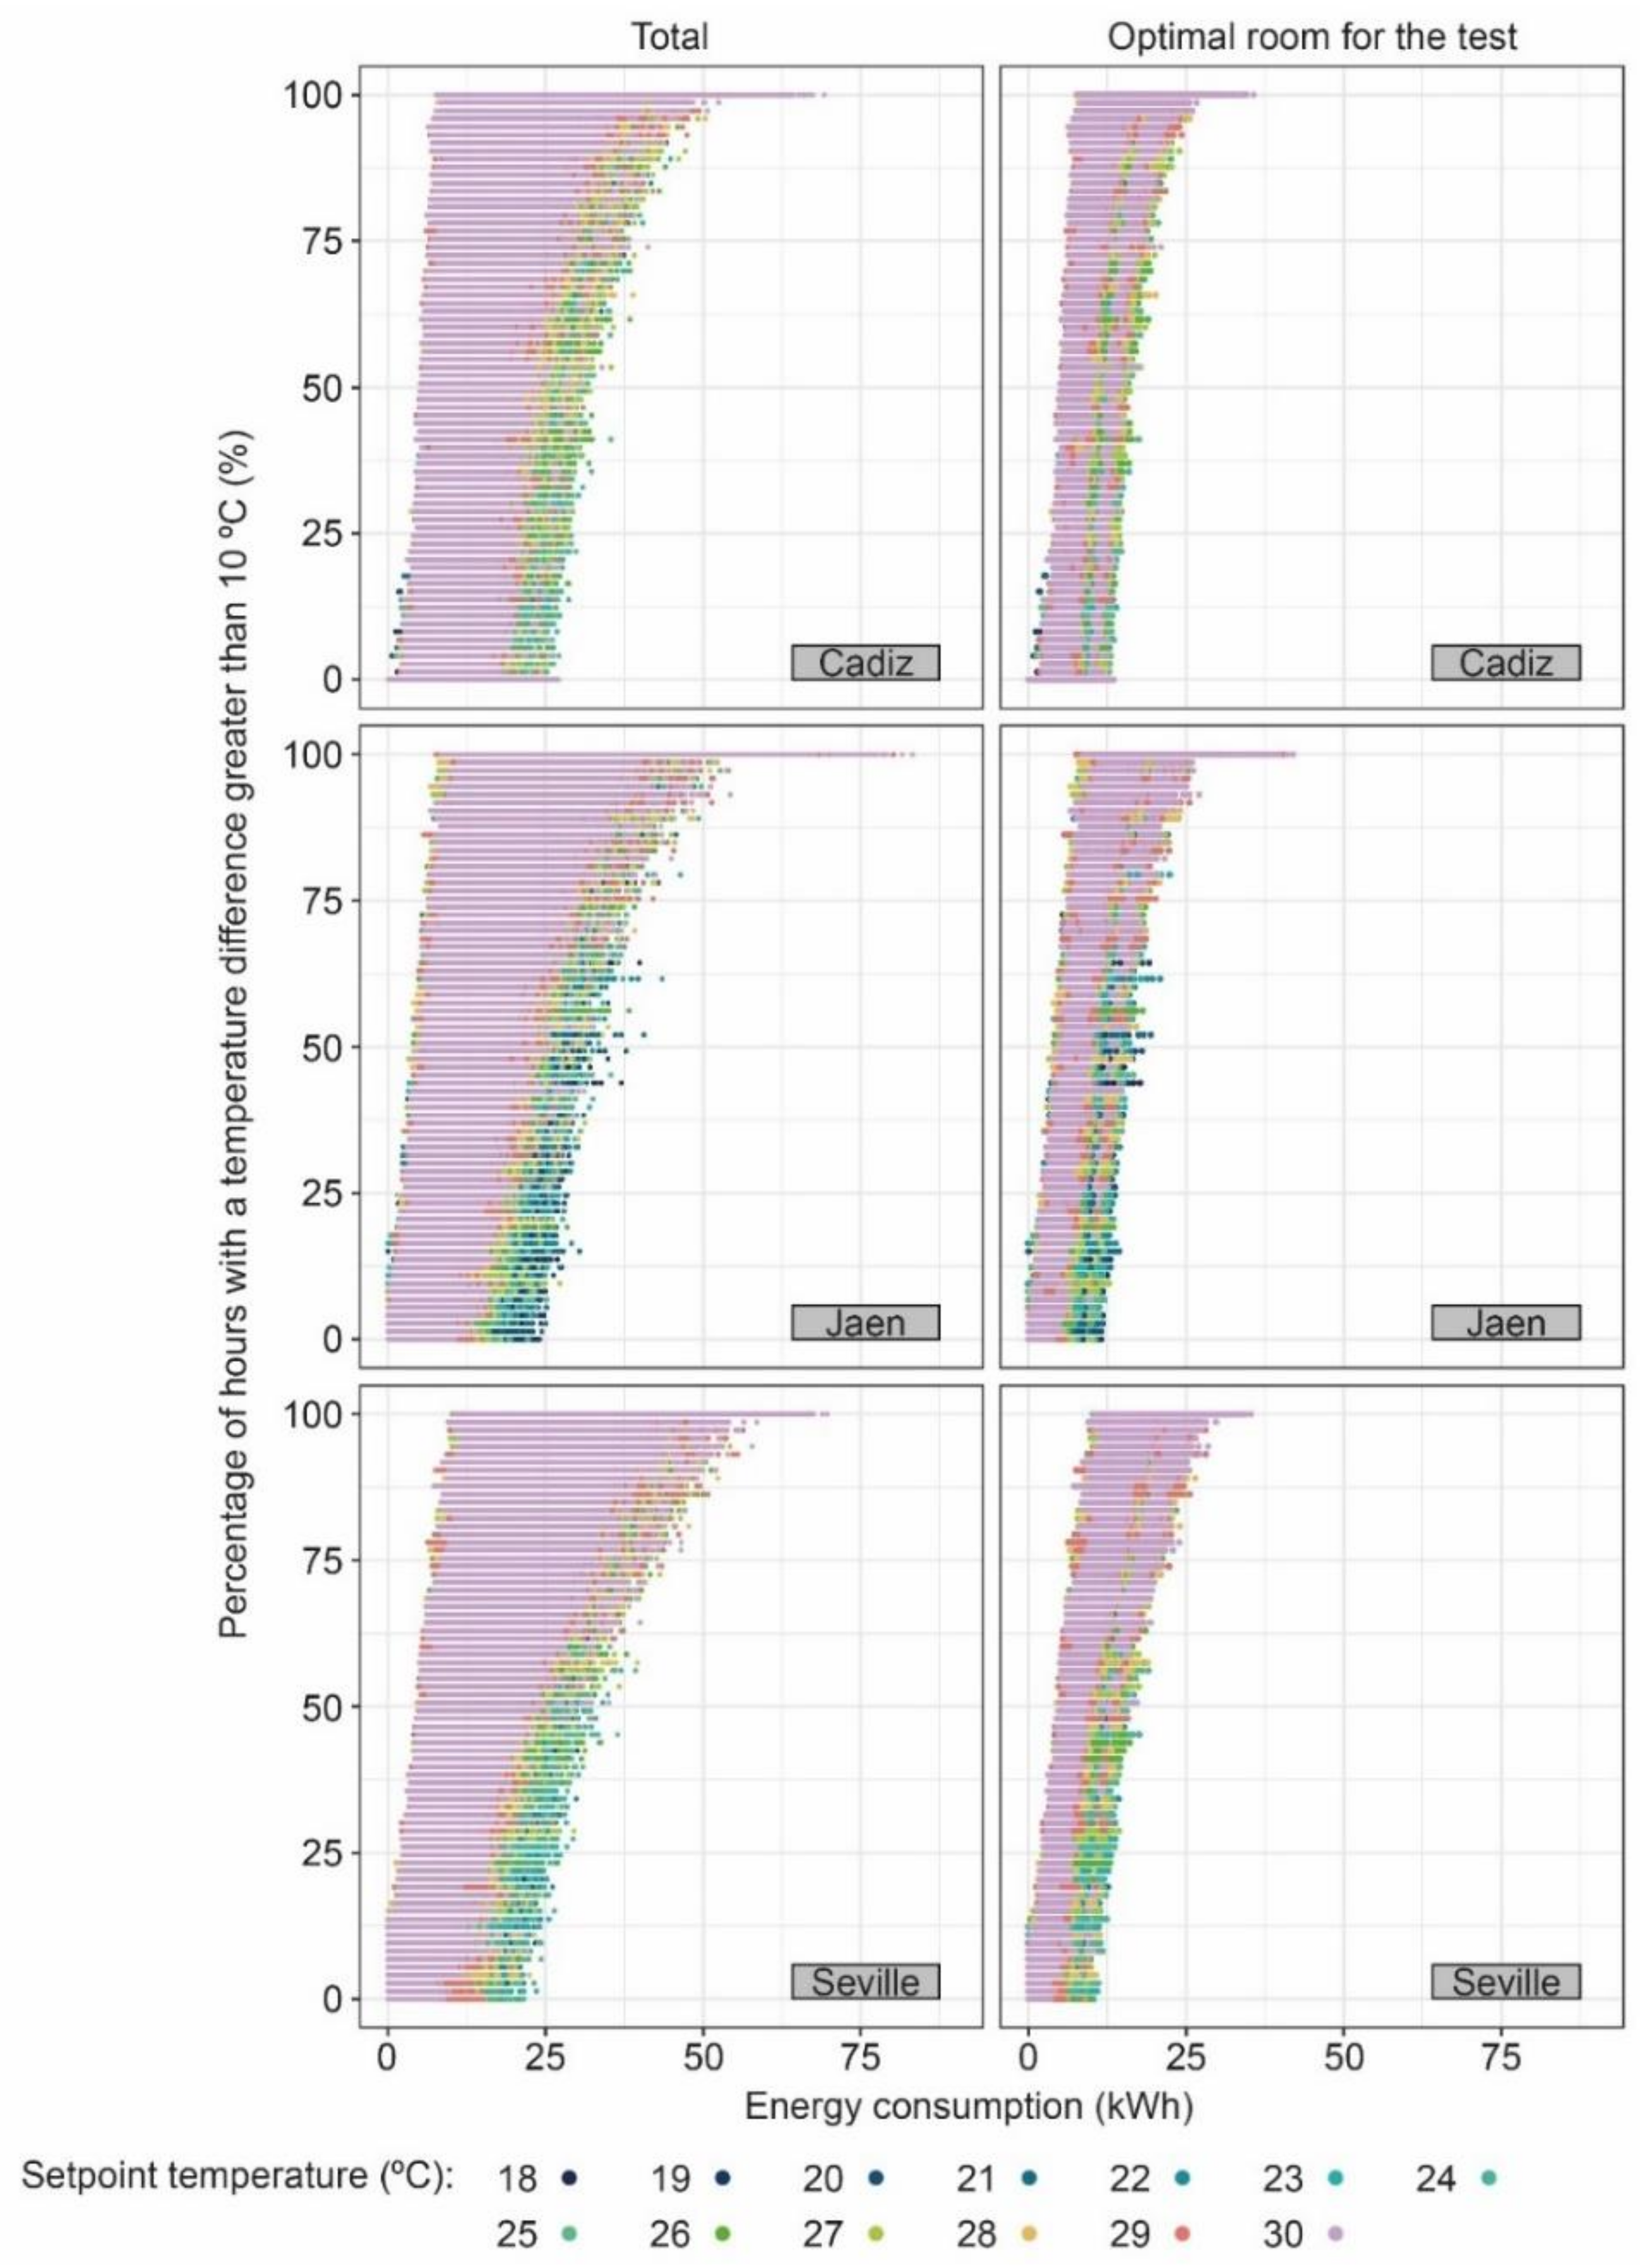
Other aspects to be considered when performing thermal transmittance tests and their possible energy impact are the dimensions of the façade and the room surface (see Figure 9). The increase of the room surface in the three values (6, 9, and 12 m2) resulted in an average increase of the energy consumption by 16.57%, whereas the increase of the façade length of the room resulted in an average increase of the energy consumption by 10.55% because of a greater heat transfer with the exterior. An appropriate selection of the room to be analyzed according to their dimensions would reduce the energy consumption related to the thermal transmittance test. The scientific literature has analyzed that aspects such as the orientation of the room façade [41], the presence of moistures [42] or damages due to freezing [56] should be assessed before selecting the room or zone of the building to be analyzed; however, the need for selecting criteria to select the rooms which reduce the energy consumption of the test has not been analyzed. Figure 10 shows the effect of the criteria application of the room dimension (surface and length of the façade) on the tests simulated. Selecting rooms with a low surface (6 m2) and with a small façade length (between 2 m and 3 m) avoided the highest values of energy consumption detected in tests. Although selecting a room with appropriate dimensions does not improve the performance of the test as the percentage of optimal hours are the same as in bigger rooms, the test sustainability improves, thus achieving reductions of up to 39.4 kWh.
Likewise, the energy impact of tests did not only depend on the room dimensions or the setpoint temperature used as there was also a clear relationship between the thermophysical properties of the envelope and the energy consumption. The three façades were selected according to the three main building periods of the Spanish building stock. For each period, the dwelling was considered to have either a window with low thermal properties or a window with better properties. The energy consumption per building period was analyzed (see Figure 11), and the result was that the façades of the BP-1 (characterized by a high thermal transmittance) presented a greater energy consumption between 8.32% and 12.06% in comparison with the other building periods. If the dwelling has a better or worse window, the energy consumption could vary between 18.9% and 21.6%. The performance of thermal transmittance tests will therefore have an energy impact on old buildings and on those with windows with worse thermal properties.
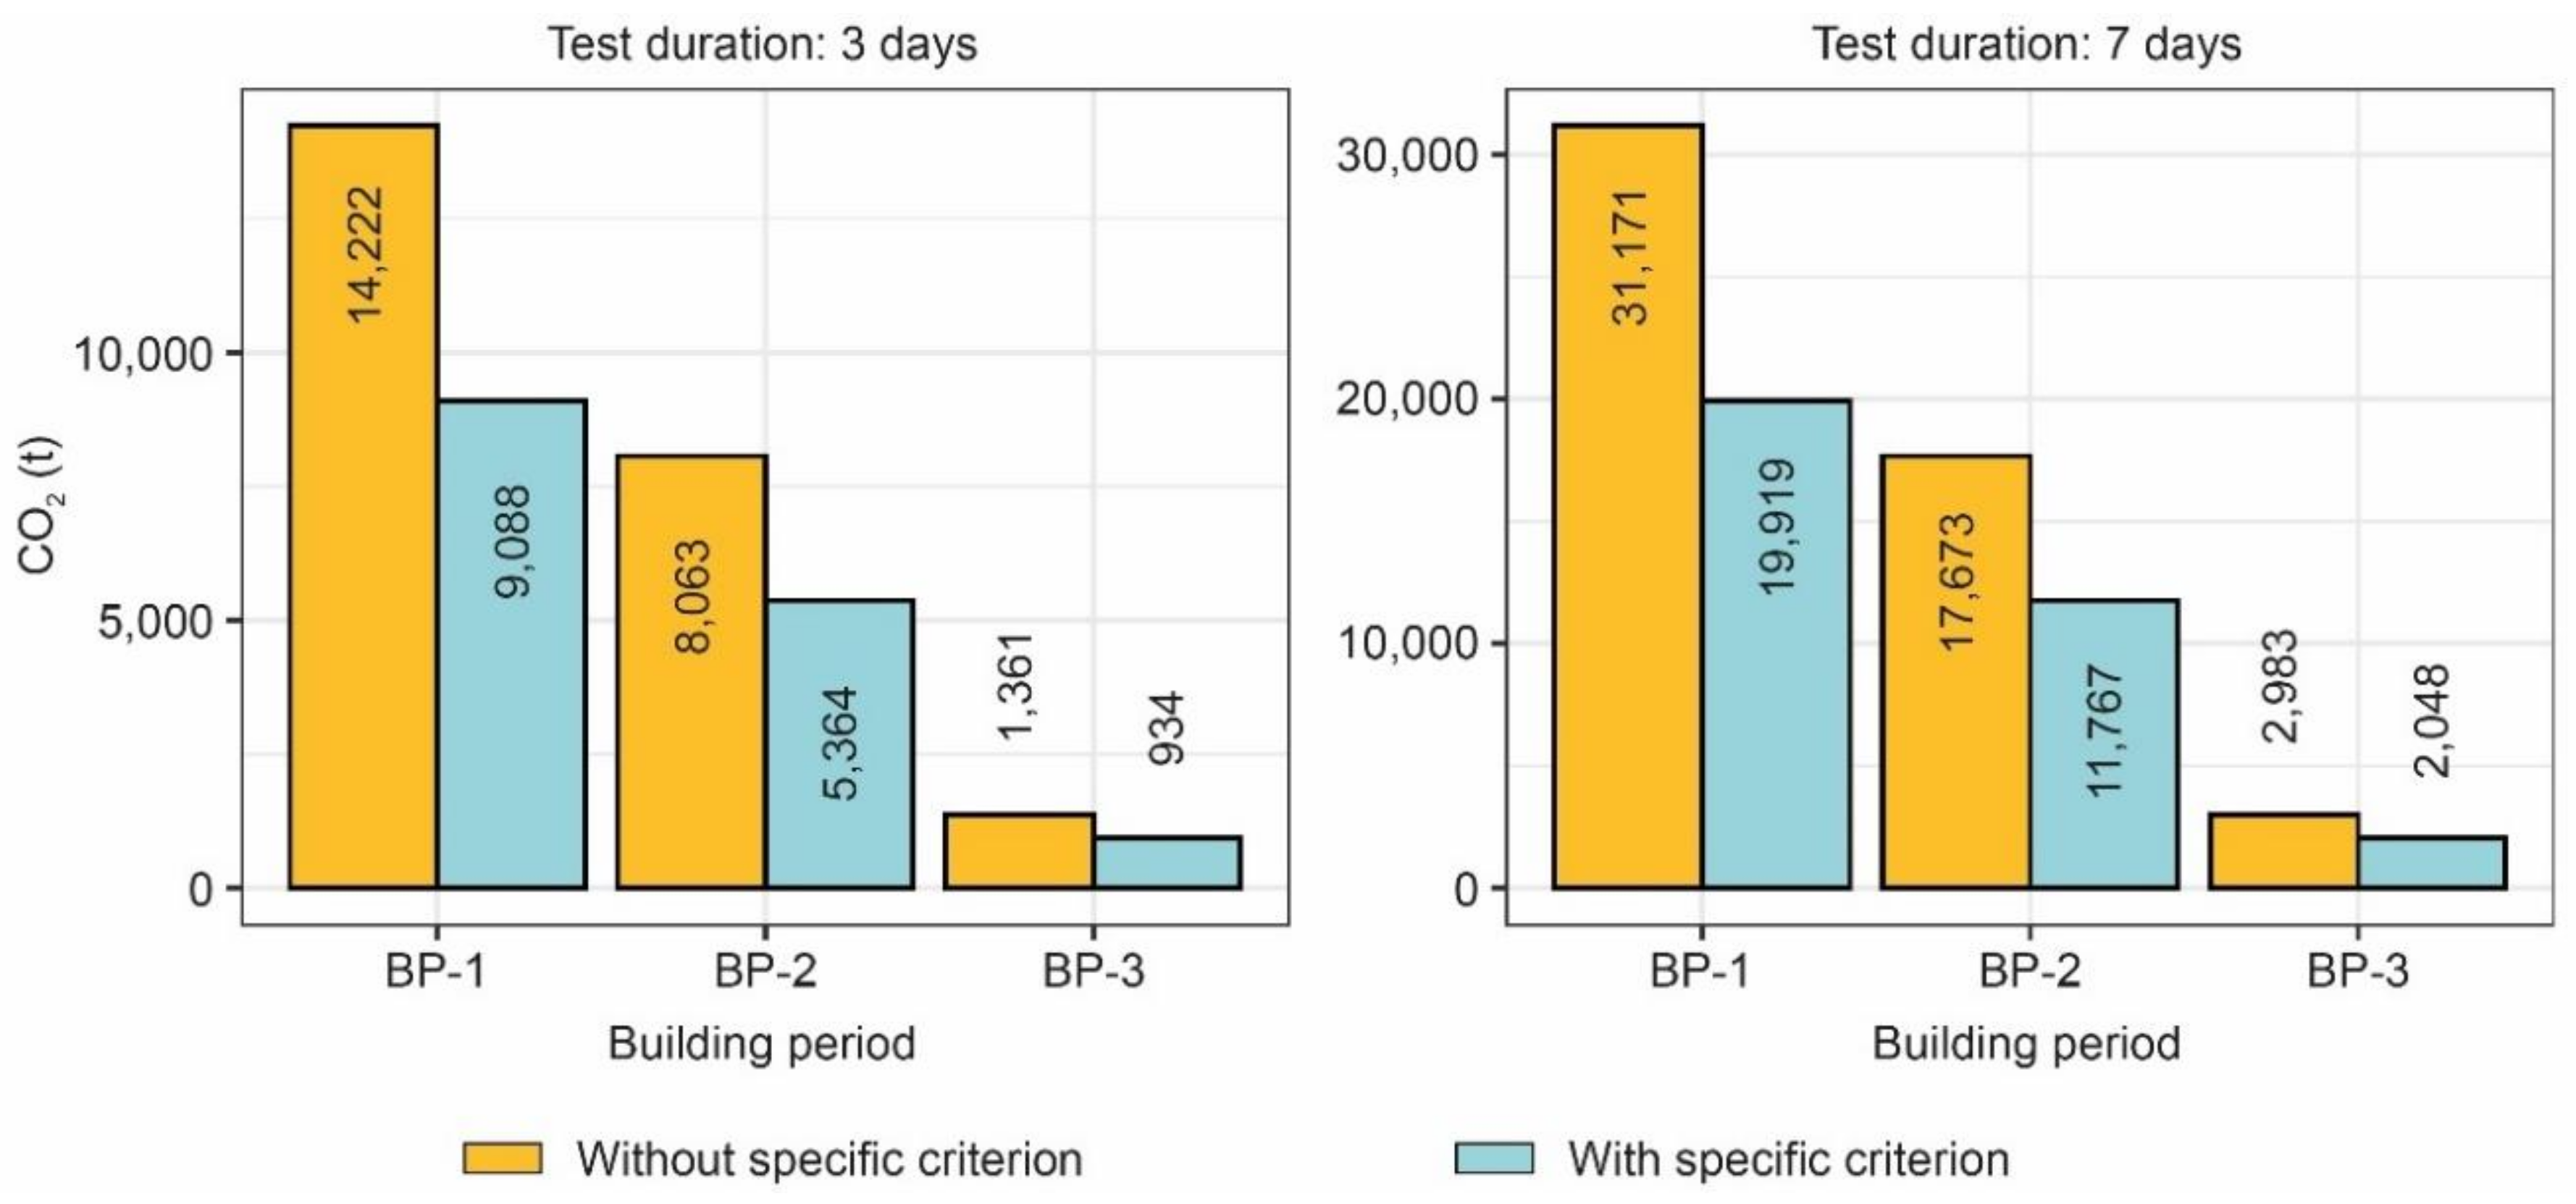
Based on these results, a relationship between the energy impact of the test and the building period of the building was detected. As for the Spanish building stock, building census data from the National Institute of Statistics in Spain [51] indicate that the number of buildings constituting the first building stock is 5,483,073, the second period is constituted by 3,431,273 buildings, and the third period by 623,144 buildings. If the conversion factor established by the Spanish legislation to determine CO2 emissions related to the energy consumption in dwellings is considered (with a value of 0.357 kgCO2/kWh [57]), the level of CO2 emissions related to the performance of thermal transmittance tests in all buildings requiring an energy improvement could be determined. For this purpose, the average energy consumption of the distributions obtained in Figure 11 were determined, and the determination coefficient of CO2 emissions from the Spanish legislation was applied. Based on the results, the predicted emissions to perform thermal transmittance tests correctly could achieve values of 14,222 tCO2 in the case of the buildings from the first period, 8063 tCO2 in the case of the buildings from the second period, and 1361 tCO2 in the buildings from the third period.
In addition, these values considered the case of performing a unique test per building. However, performing tests in various dwellings of the building could be possible, so emissions would be greater than those shown in Figure 12. As mentioned above, a measure to mitigate the energy consumption of tests is performing them in small rooms and adapting the setpoint temperatures to achieve the minimum thermal gradient required. For this reason, the effect of performing thermal transmittance tests in optimal conditions was also compared. The adequate selection of the room and test conditions would reduce the CO2 emissions by 36.1% in the buildings from the first building period, 33.47% in the buildings from the second building period, and 31.37% in the buildings from the third building period. Likewise, it is crucial to not increase test periods to 7 days as CO2 emissions would be increased, thus leading to increases between 119.17% and 119.27%. Based on these considerations, a lower environmental impact of thermal transmittance tests could be ensured. These tests are fundamental to establish the most appropriate energy conservation measures to achieve a low-carbon building stock by 2050.

4. Conclusions

Thermal transmittance tests are an essential part in building energy audit processes. These tests are useful to perform building energy analysis and to establish the most appropriate energy conservation measures, thus facilitating the achievement of a low-carbon building stock by 2050. Many studies have assessed the most appropriate operational conditions for performing thermal transmittance tests. In addition, guaranteeing a high thermal gradient and test durations longer than those established by ISO 9869-1 would characterize the wall thermal transmittance correctly. However, the environmental impact related to the performance of thermal transmittance tests has not been assessed as heating or air conditioning systems are used to guarantee a high thermal gradient in most cases. This study analyzes the environmental impact related to thermal transmittance tests. For this purpose, 15 room designs were analyzed with six envelope configurations (according to the existing building periods in Spain). These 90 combinations were analyzed with 24 operational patterns of HVAC systems. Finally, these 2160 combinations were analyzed with actual climate data from the last 20 years of the three Spanish cities located in different climate zones. As a result, 129,600 cases of the environmental impact related to thermal transmittance tests were obtained. Considering that tests were performed for 3 or 7 days, a total of 25,228,800 and 10,812,342 tests, respectively, were generated.
Based on these results, the use of HVAC systems presented different performances according to the use of heating or cooling systems. With heating systems, appropriate test conditions were obtained with a percentage of hours during the test with a high thermal gradient, unlike with cooling systems. However, the greatest effectiveness of heating systems to achieve appropriate test conditions implies a high energy consumption. Nonetheless, the use of heating systems with an appropriate setpoint temperature (which guarantees a high thermal gradient) would guarantee a low energy consumption. In addition, performing tests with heating systems results in that extended time tests (e.g., 7 days) does not improve the possibility of representing results in comparison with the duration recommended in ISO 9869-1 (i.e., 3 days).
Regardless of the operational conditions of the HVAC systems used in thermal transmittance tests, the characteristics of the room play an important role to mitigate the environmental impact of tests. Selecting rooms with a lower surface area and façade dimension would guarantee a lower energy impact of thermal transmittance tests. Furthermore, this aspect should be complemented by other requirements included in the scientific literature, such as orientation or moisture damages. This aspect could significantly influence the mitigation of the CO2 emissions generated by thermal transmittance tests. In this regard, the emissions generated by characterizing the thermal transmittance of the whole Spanish building stock could achieve 23,646 tCO2. However, the use of sustainable criteria when selecting the room in which tests are performed could reduce greenhouse gas emissions between 31.37% and 36.1%. In addition, this influence on the sustainability of thermal transmittance tests with the dimensions of the air volume in which specific temperature controls are established could be an opportunity to use the simple hot box-heat flow meter method more [49], developed to guarantee a high thermal gradient (achieving temperatures of up to 60 °C in a volume of 0.19 m3). A greater development and application of these systems would therefore guarantee a lower environmental impact of thermal transmittance tests. In relation to this, another aspect is to which type of thermal transmittance test are the results of this research related. The performance of tests lasting less than 3 days is related to the method included in ISO 9869-1. This method is the most developed and used method by engineers, architects, energy auditors and researchers. However, other approaches recently studied (e.g., the quantitative infrared thermography method) could result in a lower energy impact by reducing the duration of tests.
Finally, the results of this research could be of great interest for architects, engineers and energy auditors to perform thermal transmittance tests generating the least possible energy impact. These results could be used to assess the most sustainable thermal transmittance in the existing building stock. Albeit the savings achieved in a case study could be insignificant in comparison with the emissions generated by other anthropogenic processes, the effect of a slight modification on the greenhouse gas emissions could considerably reduce the emissions generated by the prolonged use of HVAC systems due to the effect of the domestic scale on a more overall scale [58]. Likewise, the results of this study could be used as guidelines in the life cycle analysis processes of buildings that are going to be improved energetically and in which thermal transmittance tests are carried out. However, some limitations are associated with the results of this research and should be addressed in future work. First, the climatic zones analyzed in the study are from Spain. Although these climatic zones coincide with other regions of the planet, it is possible that in other climatic zones different results of energy consumption and CO2 emissions could be obtained. In this sense, in latitudes close to the equator, it is assumed that the impact of the use of HVAC systems in thermal transmittance tests will be different from that obtained in this study. Also, in cold latitudes it is expected that the impact of heating systems may be greater. In relation to environmental impact, another limitation of the study may be due to the conversion factor established by the Spanish legislation to determine CO2 emissions related to the energy consumption in dwellings. In this sense, conversion factors of other countries may be different, and this aspect should be analyzed in future studies. Also, an energy transition in Spain could mean a change in the conversion factor used. Therefore, possible modifications in the conversion factors of Spain in the impact of thermal transmittance tests in future studies should be addressed. Finally, an aspect not considered in the study is the possible effect that the activity of the users has in the analyzed room. For the purposes of this study, the rooms were empty during the tests to ensure ideal conditions. However, it is possible that the activity of the users in the analyzed room (e.g., entering the room to pick up an object) may affect the energy consumption of the heating or cooling systems. Therefore, future studies should also analyze the possible effect generated by both user activity and other loads on the energy consumption of thermal transmittance tests.

Funding

This research received no external funding.

Conflicts of Interest

The author declares no conflict of interest.

References

  1. World Wildlife Fund. Living Planet Report 2014: Species and Spaces, People and Places; WWF International: Gland, Switzerland, 2014; Volume 1, ISBN 9780874216561. [Google Scholar]
  2. European Environment Agency. Final Energy Consumption by Sector and Fuel (2016); European Environment Agency: Copenhagen, Denmark, 2018. [Google Scholar]
  3. European Commission. Action Plan for Energy Efficiency: Realising the Potential; European Commission: Brussels, Belgium, 2006; pp. 1–37. [Google Scholar]
  4. European Commission. A Roadmap for Moving to a Competitive Low Carbon Economy in 2050; European Commission: Brussels, Belgium, 2011; pp. 1–15. [Google Scholar]
  5. Thomson, H.; Bouzarovski, S.; Snell, C. Rethinking the measurement of energy poverty in Europe: A critical analysis of indicators and data. Indoor Built Environ. 2017, 26, 879–901. [Google Scholar] [CrossRef] [PubMed]
  6. Kurekci, N.A. Determination of optimum insulation thickness for building walls by using heating and cooling degree-day values of all Turkey’s provincial centers. Energy Build. 2016, 118, 197–213. [Google Scholar] [CrossRef]
  7. Vine, E.L.; Kazakevicius, E. Residential energy use in Lithuania: The prospects for energy efficiency. Energy 1999, 24, 591–603. [Google Scholar] [CrossRef] [Green Version]
  8. López-Mesa, B.; Monzón-Chavarrías, M.; Espinosa-Fernández, A. Energy Retrofit of Social Housing with Cultural Value in Spain: Analysis of Strategies Conserving the Original Image vs. Coordinating Its Modification. Sustainability 2020, 12, 5579. [Google Scholar] [CrossRef]
  9. Invidiata, A.; Lavagna, M.; Ghisi, E. Selecting design strategies using multi-criteria decision making to improve the sustainability of buildings. Build. Environ. 2018, 139, 58–68. [Google Scholar] [CrossRef]
  10. Rubio-Bellido, C.; Perez-Fargallo, A.; Pulido-Arcas, J.A. Optimization of annual energy demand in office buildings under the influence of climate change in Chile. Energy 2016, 114, 569–585. [Google Scholar] [CrossRef]
  11. De Lieto Vollaro, R.; Guattari, C.; Evangelisti, L.; Battista, G.; Carnielo, E.; Gori, P. Building energy performance analysis: A case study. Energy Build. 2015, 87, 87–94. [Google Scholar] [CrossRef]
  12. Bienvenido-Huertas, D.; Oliveira, M.; Rubio-Bellido, C.; Marín, D. A Comparative Analysis of the International Regulation of Thermal Properties in Building Envelope. Sustainability 2019, 11, 5574. [Google Scholar] [CrossRef] [Green Version]
  13. Bustamante, W.; Bobadilla, A.; Navarrete, B.; Saelzer, G.; Vidal, S. Uso eficiente de la energía en edificios habitacionales. Mejoramiento térmico de muros de albañilería de ladrillos cerámicos. El caso de Chile. Rev. Construcción 2005, 4, 5–12. [Google Scholar]
  14. Bienvenido-Huertas, D.; Rubio-Bellido, C.; Pulido-Arcas, J.A.; Pérez-Fargallo, A. Towards the implementation of periodic thermal transmittance in Spanish building energy regulation. J. Build. Eng. 2020, 31. [Google Scholar] [CrossRef]
  15. Soares, N.; Martins, C.; Gonçalves, M.; Santos, P.; da Silva, L.S.; Costa, J.J. Laboratory and in-situ non-destructive methods to evaluate the thermal transmittance and behavior of walls, windows, and construction elements with innovative materials: A review. Energy Build. 2019, 182, 88–110. [Google Scholar] [CrossRef]
  16. Ficco, G.; Iannetta, F.; Ianniello, E.; D’Ambrosio Alfano, F.R.; Dell’Isola, M. U-value in situ measurement for energy diagnosis of existing buildings. Energy Build. 2015, 104, 108–121. [Google Scholar] [CrossRef]
  17. Bienvenido-Huertas, D.; Rubio-Bellido, C.; Pérez-Ordóñez, J.L.; Oliveira, M.J. Automation and optimization of in-situ assessment of wall thermal transmittance using a Random Forest algorithm. Build. Environ. 2020, 168. [Google Scholar] [CrossRef]
  18. Bienvenido-Huertas, D.; Rubio-Bellido, C.; Solís-Guzmán, J.; Oliveira, M.J. Experimental characterisation of the periodic thermal properties of walls using artificial intelligence. Energy 2020, 203. [Google Scholar] [CrossRef]
  19. International Organization for Standardization. ISO 9869-1:2014—Thermal Insulation-Building Elements—In Situ Measurement of Thermal Resistance and Thermal Transmittance. Part 1: Heat Flow Meter Method; ISO: Geneva, Switzerland, 2014. [Google Scholar]
  20. Albatici, R.; Tonelli, A.M.; Chiogna, M. A comprehensive experimental approach for the validation of quantitative infrared thermography in the evaluation of building thermal transmittance. Appl. Energy 2015, 141, 218–228. [Google Scholar] [CrossRef]
  21. Fokaides, P.A.; Kalogirou, S.A. Application of infrared thermography for the determination of the overall heat transfer coefficient (U-Value) in building envelopes. Appl. Energy 2011, 88, 4358–4365. [Google Scholar] [CrossRef]
  22. Tejedor, B.; Casals, M.; Gangolells, M.; Roca, X. Quantitative internal infrared thermography for determining in-situ thermal behaviour of façades. Energy Build. 2017, 151, 187–197. [Google Scholar] [CrossRef]
  23. Dall’O’, G.; Sarto, L.; Panza, A. Infrared screening of residential buildings for energy audit purposes: Results of a field test. Energies 2013, 6, 3859–3878. [Google Scholar] [CrossRef] [Green Version]
  24. Madding, R. Finding R-Values of Stud Frame Constructed Houses with IR Thermography. Proc. InfraMation 2008, 2008, 261–277. [Google Scholar]
  25. Bienvenido-Huertas, D.; Rodríguez-Álvaro, R.; Moyano, J.J.; Rico, F.; Marín, D. Determining the U-Value of Façades Using the Thermometric Method: Potentials and Limitations. Energies 2018, 11, 360. [Google Scholar] [CrossRef] [Green Version]
  26. Kim, S.-H.; Kim, J.-H.; Jeong, H.-G.; Song, K.-D. Reliability Field Test of the Air–Surface Temperature Ratio Method for In Situ Measurement of U-Values. Energies 2018, 11, 803. [Google Scholar] [CrossRef] [Green Version]
  27. Kim, S.-H.; Lee, J.-H.; Kim, J.-H.; Yoo, S.-H.; Jeong, H.-G. The Feasibility of Improving the Accuracy of In Situ Measurements in the Air-Surface Temperature Ratio Method. Energies 2018, 11, 1885. [Google Scholar] [CrossRef] [Green Version]
  28. Bienvenido-Huertas, D.; Moyano, J.; Marín, D.; Fresco-Contreras, R. Review of in situ methods for assessing the thermal transmittance of walls. Renew. Sustain. Energy Rev. 2019, 102, 356–371. [Google Scholar] [CrossRef]
  29. Teni, M.; Krstić, H.; Kosiński, P. Review and comparison of current experimental approaches for in-situ measurements of building walls thermal transmittance. Energy Build. 2019, 203, 109417. [Google Scholar] [CrossRef]
  30. Lucchi, E. Thermal transmittance of historical brick masonries: A comparison among standard data, analytical calculation procedures, and in situ heat flow meter measurements. Energy Build. 2017, 134, 171–184. [Google Scholar] [CrossRef]
  31. Lucchi, E. Thermal transmittance of historical stone masonries: A comparison among standard, calculated and measured data. Energy Build. 2017, 151, 393–405. [Google Scholar] [CrossRef]
  32. Rotilio, M.; Cucchiella, F.; De Berardinis, P.; Stornelli, V. Thermal Transmittance Measurements of the Historical Masonries: Some Case Studies. Energies 2018, 11, 2987. [Google Scholar] [CrossRef] [Green Version]
  33. Asdrubali, F.; D’Alessandro, F.; Baldinelli, G.; Bianchi, F. Evaluating in situ thermal transmittance of green buildings masonries: A case study. Case Stud. Constr. Mater. 2014, 1, 53–59. [Google Scholar] [CrossRef]
  34. Echarri, V. Thermal ceramic panels and passive systems in mediterranean housing: Energy savings and environmental impacts. Sustainability 2017, 9, 1613. [Google Scholar] [CrossRef] [Green Version]
  35. Echarri-Iribarren, V.; Sotos-Solano, C.; Espinosa-Fernández, A.; Prado-Govea, R. The Passivhaus standard in the Spanish Mediterranean: Evaluation of a house’s thermal behaviour of enclosures and airtightness. Sustainability 2019, 11, 3732. [Google Scholar] [CrossRef] [Green Version]
  36. Meng, X.; Yan, B.; Gao, Y.; Wang, J.; Zhang, W.; Long, E. Factors affecting the in situ measurement accuracy of the wall heat transfer coefficient using the heat flow meter method. Energy Build. 2015, 86, 754–765. [Google Scholar] [CrossRef]
  37. Andújar Márquez, J.M.; Martínez Bohórquez, M.Á.; Gómez Melgar, S. A new metre for cheap, quick, reliable and simple thermal transmittance (U-Value) measurements in buildings. Sensors 2017, 17, 2017. [Google Scholar] [CrossRef] [PubMed] [Green Version]
  38. Bienvenido-Huertas, D.; Rubio-Bellido, C.; Pérez-Ordóñez, J.L.; Moyano, J. Optimizing the evaluation of thermal transmittance with the thermometric method using multilayer perceptrons. Energy Build. 2019, 198, 395–411. [Google Scholar] [CrossRef]
  39. Bienvenido-Huertas, D.; Moyano, J.; Rodríguez-Jiménez, C.E.; Marín, D. Applying an artificial neural network to assess thermal transmittance in walls by means of the thermometric method. Appl. Energy 2019, 233–234, 1–14. [Google Scholar] [CrossRef]
  40. Gaspar, K.; Casals, M.; Gangolells, M. Review of criteria for determining HFM minimum test duration. Energy Build. 2018, 176, 360–370. [Google Scholar] [CrossRef]
  41. Ahmad, A.; Maslehuddin, M.; Al-Hadhrami, L.M. In situ measurement of thermal transmittance and thermal resistance of hollow reinforced precast concrete walls. Energy Build. 2014, 84, 132–141. [Google Scholar] [CrossRef]
  42. Litti, G.; Khoshdel, S.; Audenaert, A.; Braet, J. Hygrothermal performance evaluation of traditional brick masonry in historic buildings. Energy Build. 2015, 105, 393–411. [Google Scholar] [CrossRef]
  43. Atsonios, I.A.; Mandilaras, I.D.; Kontogeorgos, D.A.; Founti, M.A. A comparative assessment of the standardized methods for the in–situ measurement of the thermal resistance of building walls. Energy Build. 2017, 154, 198–206. [Google Scholar] [CrossRef]
  44. Cesaratto, P.G.; De Carli, M.; Marinetti, S. Effect of different parameters on the in situ thermal conductance evaluation. Energy Build. 2011, 43, 1792–1801. [Google Scholar] [CrossRef]
  45. Albatici, R.; Tonelli, A.M. Infrared thermovision technique for the assessment of thermal transmittance value of opaque building elements on site. Energy Build. 2010, 42, 2177–2183. [Google Scholar] [CrossRef]
  46. Desogus, G.; Mura, S.; Ricciu, R. Comparing different approaches to in situ measurement of building components thermal resistance. Energy Build. 2011, 43, 2613–2620. [Google Scholar] [CrossRef]
  47. Gori, V.; Elwell, C.A. Estimation of thermophysical properties from in-situ measurements in all seasons: Quantifying and reducing errors using dynamic grey-box methods. Energy Build. 2018, 167, 290–300. [Google Scholar] [CrossRef]
  48. Gaspar, K.; Casals, M.; Gangolells, M. Energy & Buildings In situ measurement of façades with a low U-value: Avoiding deviations. Energy Build. 2018, 170, 61–73. [Google Scholar] [CrossRef]
  49. Meng, X.; Gao, Y.; Wang, Y.; Yan, B.; Zhang, W.; Long, E. Feasibility experiment on the simple hot box-heat flow meter method and the optimization based on simulation reproduction. Appl. Therm. Eng. 2015, 83, 48–56. [Google Scholar] [CrossRef]
  50. Meng, X.; Luo, T.; Gao, Y.; Zhang, L.; Shen, Q.; Long, E. A new simple method to measure wall thermal transmittance in situ and its adaptability analysis. Appl. Therm. Eng. 2017, 122, 747–757. [Google Scholar] [CrossRef]
  51. Spanish Institute of Statistics Building Census. Available online: https://www.ine.es/censos2011_datos/cen11_datos_resultados.htm (accessed on 7 June 2020).
  52. Kurtz, F.; Monzón, M.; López-Mesa, B. Energy and acoustics related obsolescence of social housing of Spain’s post-war in less favoured urban areas. The case of Zaragoza. Inf. Construcción 2015, 67, m021. [Google Scholar] [CrossRef]
  53. The Government of Spain. Royal Decree 2429/79. Approving the Basic Building Norm NBE-CT-79, about the Thermal Conditions in Buildings; The Government of Spain: Madrid, Spain, 1979.
  54. The Government of Spain. Royal Decree 314/2006. Approving the Spanish Technical Building Code CTE-DB-HE-1; The Government of Spain: Madrid, Spain, 2013.
  55. López-Ochoa, L.M.; Las-Heras-Casas, J.; López-González, L.M.; Olasolo-Alonso, P. Towards nearly zero-energy buildings in Mediterranean countries: Energy Performance of Buildings Directive evolution and the energy rehabilitation challenge in the Spanish residential sector. Energy 2019, 176, 335–352. [Google Scholar] [CrossRef]
  56. Grubeša, I.N.; Teni, M.; Krstić, H.; Vračević, M. Influence of freeze/thaw cycles on mechanical and thermal properties of masonry wall and masonry wall materials. Energies 2019, 12, 1464. [Google Scholar] [CrossRef] [Green Version]
  57. The Government of Spain. CO2 Emission Factors and Transition Coefficients to Primary Energy from Different Final Energy Sources Consumed in the Building Sector in Spain; The Government of Spain: Madrid, Spain, 2016.
  58. Besagni, G.; Borgarello, M. The determinants of residential energy expenditure in Italy. Energy 2018, 165, 369–386. [Google Scholar] [CrossRef]
Figure 1. Rooms analyzed: (a) a 3D design of a room, and (b) plan and dimensions of the 15 rooms. Measure units are in meters.
Sustainability 12 06247 g001
Figure 2. Example of the external temperature data compiled for 2000, 2009, and 2019 in Cadiz, Jaen, and Seville.
Sustainability 12 06247 g002
Figure 3. Distributions of the energy consumption obtained in the thermal transmittance tests lasting 3 days. The red color corresponds to heating energy consumption, and the blue color corresponds to cooling energy consumption.
Sustainability 12 06247 g003
Figure 4. Distributions of the energy consumption obtained in the thermal transmittance tests lasting 7 days. The red color corresponds to heating energy consumption, and the blue color corresponds to cooling energy consumption.
Sustainability 12 06247 g004
Figure 5. Relationship between the setpoint temperatures of the heating system and the energy consumption and the percentage of hours with a high thermal gradient in the thermal transmittance tests lasting 3 days.
Sustainability 12 06247 g005
Figure 6. Relationship between the setpoint temperatures of the heating systems and the energy consumption and the percentage of hours with a high thermal gradient in the thermal transmittance tests lasting 7 days.
Sustainability 12 06247 g006
Figure 7. Relationship between the setpoint temperatures of the air conditioning system and the energy consumption and the percentage of hours with a high thermal gradient in the thermal transmittance tests lasting 3 days.
Sustainability 12 06247 g007
Figure 8. Relationship between the setpoint temperatures of the air conditioning system and the energy consumption and the percentage of hours with a high thermal gradient in the thermal transmittance tests lasting 7 days.
Sustainability 12 06247 g008
Figure 9. Influence of the room dimensions in the energy consumption obtained from performing thermal transmittance tests lasting 3 days.
Sustainability 12 06247 g009
Figure 10. Relationship between the energy consumption and the percentage of optimal hours in the thermal transmittance tests lasting 3 days.
Sustainability 12 06247 g010
Figure 11. CO2 emissions generated by the thermal transmittance tests lasting 3 days.
Sustainability 12 06247 g011
Figure 12. Estimations of the CO2 emissions generated by performing thermal transmittance tests in the Spanish building stock. The yellow color represents the emission results obtained by performing thermal transmittance tests lasting 3 days and without any specific criterion when configuring the test, and the blue color represents the results of the thermal transmittance tests lasting 3 days and with an appropriate selection of the room and the setpoint temperature used.
Sustainability 12 06247 g012
Table 1. Thermal properties of the façades considered.
ElementBuilding PeriodThermal Transmittance
(W/(m2K))
LayerThickness (mm)Thermal
Conductivity (W/(mK))
Thermal
Resistance (m2K/W)
F1BP-11.10Perforated brick1150.35-
Cement mortar101.30-
Air gap100-0.18
Hollow brick700.32-
Gypsum plaster150.57-
F2BP-20.79Cement mortar151.30-
Perforated brick1150.35-
Cement mortar101.30-
Insulation150.035-
Air gap50-0.18
Hollow brick500.32-
Gypsum plaster150.57-
F3BP-30.58Cement mortar151.30-
Perforated brick1170.35-
Cement mortar101.30-
Insulation250.028-
Air gap28-0.18
Hollow brick500.32-
Gypsum plaster150.57-
Table 2. Thermal properties of the windows considered.
ElementWindow Thermal Transmittance
(W/(m2K))
Frame Thermal Transmittance
(W/(m2K))
W15.75.7
W21.83.2
Table 3. Setpoint temperatures considered both for heating and cooling systems.
SystemSetpoint Temperature (°C)
Heating18, 19, 20, 21, 22, 23, 24, 25, 26, 27, 28, 29, 30
Cooling18, 19, 20, 21, 22, 23, 24, 25, 26, 27, 28