Abstract
Physician preference items or PPIs are medical items recommended by physicians for use in medical procedures and other treatments. The recommendation of PPIs by individual physicians can cause the variety of item types that need to be managed within a health care supply chain to increase over time. To better manage the PPI selection process, healthcare organizations often select items through value analysis and discussion teams, which are highly subjective. To better control PPIs, this work uses multiple-objective decision analysis (MODA) to develop a structured quantitative framework for the PPI selection process. The established decision-making framework is based on the theory of multi-objective value analysis. It offers a structured and educated guide to decision-makers for improving value analysis outcomes, advocating sustainable healthcare management strategies. The model was tested and validated through two case studies on two different items in two hospitals in Jordan.
1. Introduction
An effective and efficient selection of medical items and supplies can lead to the better management of inventory within a healthcare organization’s supply chain and, consequently, a more sustainable system, as well as a reduced total cost. The healthcare sector has advanced enormously regarding treatment processes, technology, devices, and medical item/supply innovations. However, this puts the supply chain of healthcare providers under pressure due to the overwhelming number of items. The focus of this research is on functionally equivalent items that are introduced by competitors. In the retail sector, this is called the stock-keeping unit (SKU) proliferation, and is caused by holding different brands of the same item. SKU proliferation can be defined as increasing the variety and number of functionally equivalent items that are stocked by inventory management systems in response to marketing, acquisitions, sales incentives, and the lack of life cycle controls.
According to [1], physicians’ preference items (PPIs) are responsible for 61% of the total supply expenditure. In a survey carried out by [2], 39.1% of the total items in healthcare organizations are PPIs. The major problem of PPIs is that they cause Stock Keeping Unit (SKU) proliferation. In the healthcare sector, SKU proliferation is a problem for the supply chain and might be attributed to many reasons, of which physician preference items (PPIs) is a significant contributor. PPIs are costly medical/surgical items, such as hip and knee implants, cardiac stents, mechanical devices, etc., that are selected/preferred by the physician to use for a specific patient and procedure/treatment. PPIs exist in most treatment areas, such as orthopedics, cardiovascular, plastic surgery, etc., and within each type they are classified according to the purpose of use into further categories. In each group, there are many items (brands) for the same item type; they are functionally equivalent but may come with different features, since different manufacturers produce them. Some examples of PPIs are heart valves and orthopedic and cardiovascular implants. For instance, orthopedic implants can be classified into many categories according to use, such as the Austin Moore prosthesis (for the fracture of the neck of the femur), Baksi’s prosthesis (for elbow replacement), etc. Within each category, there are many items available in the market from different manufacturers.
Regularly stocked items are those adopted by the organization, stored in the warehouse, and ordered from suppliers, usually without the need for special approval from the organization administration. These items can be managed with conventional inventory theory using forecast models, traditional inventory policies, and optimization techniques. On the other hand, PPIs are often considered specialized items from a supply chain perspective. PPIs are more challenging to manage and involve aspects beyond engineering, which can be attributed to factors affecting the selection process, such as the physicians’ preferences. Humans’ opinions in selection have been of interest to researchers in the healthcare context; for example, ref. [3] applied neural network-based methods for patient opinion mining from web forums to analyze drug satisfaction. A linguistic hesitant fuzzy set (LHFS) was adopted by [4] in the elicitation of preference information and was applied to the evaluation of a hospital.
From the perspective of this research, the problem mainly involves two kinds of decisions to be made based on some criteria. The first decision is, does the organization need to adopt the new item or not? The second decision is, for an on-hand item, is it better for the organization to not stock the item and replace it with another more efficient one based on its effect on the supply chain? In other words, should a regular item be used instead of a set of equivalent PPIs? For both decisions, the essential question is: which item should be considered the standard one in a small collection of items?
Currently, healthcare organizations collect information about items. Cross-functional teams consisting of clinicians, supply chain professionals (SCP), value analysis professionals, and healthcare administrators discuss and decide which item to purchase. This process is called value analysis by some organizations. Due to the lack of quantitative evaluation of the item’s value versus its cost, decision-makers will not see the consequences of their decision on the supply chain performance and the organization’s financial situation. This process is sub-optimal for two primary reasons: first, the criteria considered in the decision process are not weighted, and second, no value–cost tradeoff is shown.
Consequently, decisions can be very subjective. For these reasons, a framework that considers putting this value analysis context within a more sound mathematical structure that captures criteria weights and the sensitivity of these weights is the contribution of this paper. Figure 1 below is a schematic view of how the MODA framework aligns with the value analysis.
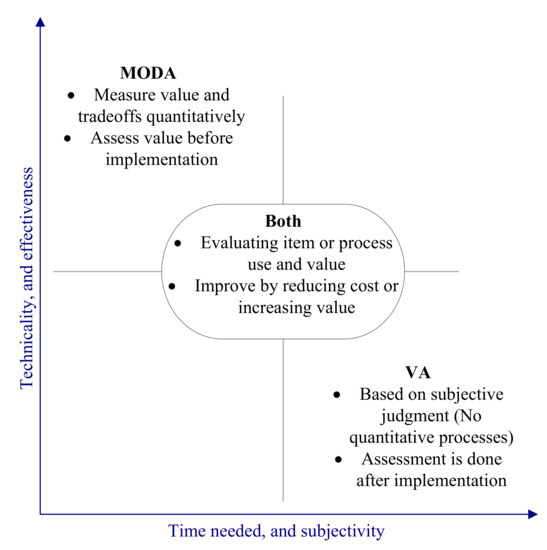
Figure 1.
Value analysis and multiple-objective decision analysis (MODA) relationship.
Because the selection of an item include the values of the decision-makers based on criteria that are often conflicting, the item selection process is a complex decision problem. To develop a decision-making framework for PPI selection, a multi-criteria decision-making (MCDM) methodology was adopted, namely, multiple-objective decision analysis (MODA). This current work is an extension based on the small size framework published by [5]. The structure has been developed on a broader scale and implemented on two real case studies. The MODA method is based on measurable value theory, which is discussed in [6]. The details of the procedure, such as the swing weights and value function assessments, are based on the Simple Multi-attribute Rating Technique using Swings (SMARTS).
Further details of the SMARTS procedure can be found in [7,8]. The reader may refer to [9,10] for more information about the methodology. The goal is to implement the framework on a selection process through a case study in a healthcare organization and evaluate the framework’s effectiveness.
The nature of the factors and stakeholders contributing to the selection process imposes difficulty on the problem and makes it more challenging. It is challenging to measure physicians’ preferences. Not adequately representing physician preferences may increase the risk of physicians leaving the organization or of them being less motivated. In this research, physicians’ preferences were expressed in terms of the objectives considered by physicians when building their preferences.
The remaining sections of this article are the related literature; then the methodology and model; two case studies on the proposed model; and, finally, an evaluation of the framework’s effectiveness and conclusions.
2. Literature Review
The value analysis (V.A.) practice was examined via a survey to investigate if organizations are adopting it and if they think it is useful. At the very heart of the V.A. process, a review is a task to determine and eliminate item product features that add no actual value to the patient but incur a cost to the healthcare provider and patient [11]. According to the survey, three characteristics of the supply chain should exist to benefit from using V.A. The first is to have a skilled data analyst to support the process. The second is to implement the process on every PPI. Lastly, value training should be provided on value analysis to members of and contributors to the process.
It is challenging to reduce labor costs, which is the most considerable expense in a typical hospital according to [12], so the focus has turned to the reduction in supplies, which represent the second most significant expense [13]. Ref. [14] said that health spending in the U.S. was $3.5 trillion in 2017 and is expected to rise by 5.3% in 2018. They also said that health spending would reach 19.7% of the U.S. economy in 2026. Typically, one-third of the total budget in a hospital goes to the supply costs [15]. It is stated by [16] that more than 40% of the expenses in hospitals are attributed to supply chain activities. A significant portion of the medical items and supplies in hospitals are actually in the form of PPIs [17]. Ref. [1] stated that PPIs make up to 61% of the total supply expenditure. According to [18], one of the reasons for losses in hospitals is the PPIs, and this is an indication that PPIs are a problem for healthcare providers. Minimal work has been carried out on the PPI topic, and the majority of it is in the form of non-technical reports, which present the opinions and experiences of people in the field. The lack of modeling on this problem suggests the need for further investigation.
A bibliometric analysis of multi-criteria decision analysis (MCDA) studies in healthcare conducted by [19] showed a steady increase in the number of publications on MCDA in healthcare over the years 1965–2011. However, no literature was found that has adopted the MCDM methodology or implemented any decision analysis technique into the PPI selection problem. Research published by [20] discussed the factors that cause PPIs, as well as the factors that make physicians use a specific item (brand). In our work, the factors/criteria affecting the selection of PPIs will be developed to comprise all elements of the problem in a mathematical decision-making framework.
MCDM techniques have different capabilities with different features and characteristics. The use of one method over another depends on the elements of the problem, and the result may not be an optimal choice, but somewhat improves the quality of the selected decision. A review of MCDM techniques and classification can be found in [21]. A literature review performed by [22] discussed conventional MCDM techniques, their applications, and their strengths and weaknesses.
A prevalent problem in the supply chain space is the evaluation and selection of suppliers. Selecting a supplier is a similar problem to the item selection problem, in that it has the objective of choosing a supplier based on some criteria. Additionally, the decision is made by a group of decision-makers who have input into the process from different perspectives. Many research efforts have been made on this problem; [23] reviewed the most common techniques used in the literature for this purpose.
Decisions can be made either individually or by a group. In both contexts, the purpose is to make a decision that minimizes the possibility of after-decision regret by considering all the factors properly [24]. Group decision-making is challenging due to the different perspectives and judgments of stakeholders. Decision-making is based on tradeoffs between different outcomes, where tradeoffs are based on values (valuable things for the decision-maker). The presence of different attributes that are not measurable/incommensurable is what makes MCDM necessarily not easy to solve [21]. In our current work, physicians are the primary entities in this group decision-making, which could be a concern because physicians tend to make individual decisions. However, a review study conducted by [25] showed that physicians express positive attitudes toward shared decision-making. Two separate studies conducted by [26,27] addressed the topic of shared decision-making in emergency care and the best surgical treatment for patients, respectively. They emphasized the importance and benefits of such an approach to the final decision quality, and also the need for quantitative frameworks in the context of healthcare; our current framework considers input from many stakeholders.
MODA [9,10,28] has been applied to applications in areas such as military (see [29,30]), and resulted in good quality decisions. MODA is designed to be consistent with the five rules formulated by [31]; hence, it was adopted in our research. The framework consists of applying MODA to the PPI selection problem to build a sustainable framework for the decision process, performing a case study with users in a healthcare organization, and finally evaluating the framework effectiveness with the users. Recent work presented provided a bibliometric analysis exploring the integration of strategic management, decision-making, and corporate sustainability [32].
We believe that this work has the following contributions:
- The characterization of the PPI selection problem by defining the criteria used in evaluating alternatives.
- A framework for implementing MCDM techniques in the PPI selection decision problem, which, from a managerial perspective, helps in making decisions that enhance the inventory management outputs. Additionally, from a clinical perspective, it guides the decision process to higher satisfaction for both the physicians and patients.
- Evaluating the decision framework effectiveness and applicability through a case study.
- Putting the existing value analysis process in a structured mathematically sound process, which has two advantages: measuring the value and tradeoffs quantitatively, and assessing the value before implementation.
3. Model Framework Development
The goal of this work is to provide a proposed framework to guide the PPI selection process and help decision-makers and value analysis teams to make more informed decisions. Understanding this is important to PPI assessments for two reasons. First, the selected attributes must emerge from the value analysis context. Second, the methodology should support the decision-makers’ ability to increase the value of the selected items’ portfolio and interpret the results at any time. Thus, our approach assessed the value of the items versus the cost independently of their current state (in stock, approved, new, etc.), which allows each item to be analyzed separately in terms of staying in use, being phased out, or being adopted. The underlying theory used in this framework is MODA. Two case studies were performed on two different PPIs in two various hospitals located in Jordan to illustrate the use of the proposed framework. The process of developing the structure followed in this research is depicted in Figure 2.
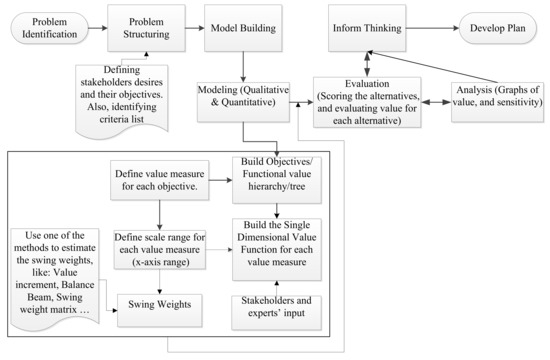
Figure 2.
Process of MODA implementation.
SCPs and physicians from healthcare organizations in the USA and Jordan participated in using and giving feedback on the model. Physicians’ input was crucial for the process, especially that of surgeons who were working on the item selection and value-driven decision-making analysis. The meetings were carried out in multiple rounds after educational presentations were made for them about the topic. They also provided valuable feedback on the model elements and the framework evaluation. The authors played a significant role in the modeling and analysis of the value model.
3.1. The Qualitative Model
Developing the PPI value model was accomplished in several steps: an analysis of the literature, and conducting interviews with stakeholders (physicians, SCPs, nurses, patients, and administration) from four major different healthcare organizations and remote interviews for another organization [2]. The stakeholders’ desires were analyzed and translated into objectives and sub-objectives in the final hierarchy value tree. The PPIs objectives hierarchy is shown in Figure 3.
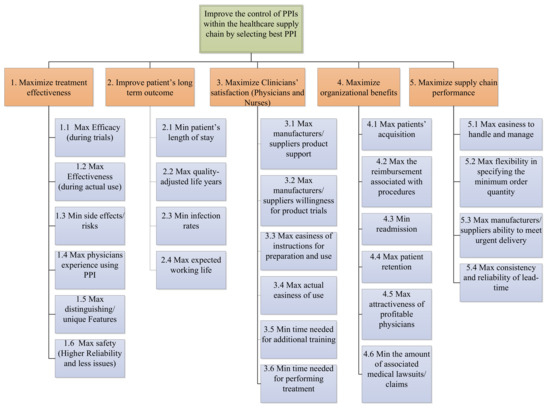
Figure 3.
Physicians’ preference items (PPI) objective hierarchy [2].
The final hierarchy model included 26 sub-objectives (criteria) by which the PPI alternatives will be evaluated. Each set of criteria is gathered in one of the five top-level objectives (treatment effectiveness, patient’s long-term outcome, etc.) that they support. The cost objective was not included in the value hierarchy for two main reasons. First, the context of this problem is healthcare, which makes it different in terms of objective attainment and the priority of value over cost. Including the cost directly in the model may be risky if deciding on a critical item. Second, treating cost separately and showing the amount of value added per each unit of cost is useful for the decision-makers evaluating the best choice, as well as for using such an analysis in portfolio analysis. Thus, the model encapsulates physician values, not item cost.
One final note about the model is that it does not depend on the underlying medical item—i.e., on the item being evaluated. The reason behind this is that the alternatives will be assessed on the same model, and if one criterion is not essential for this item type, we simply give it low scores on this quality. This model is robust in terms of the evaluation of different types of items.
3.2. The Quantitative Model
The complexity and difficulty of the PPI selection model made the additive value model a good fit due to its tractability and objectivity [9]. The required assumptions for the additive value model were satisfied. For each of the 26 sub-objectives, also called criteria, a value measure was defined to assess the potential of the criterion achievement. Single-dimensional value functions were also specified to quantify the value of returns to the scale. One of the value measures needed a two-dimensional value function to accommodate the value dependence, and this is the physician’s experience using the item. Weights were also assessed, as described later. Table 1 below shows all the criteria with the corresponding value measure, type of scale, range, value function curve shape, and rationale of the shape. The following sections will explain the individual elements of the model. The model was verified and approved by the participating stakeholders.

Table 1.
PPI selection value qualitative model (all details).
3.2.1. Value Measures and Value Functions
A value measure/metric (V.M.) is “a quantitative scale that measures the value to the decision-makers and stakeholders of the degree to which objectives are achieved” [10]. The levels (scale) for each V.M. were defined as the score rubric on the x-axis of the value function. According to [9], V.M.s can be classified according to two dimensions: alignment with the objective, either direct or proxy; and types of measure, either natural or constructed, with direct and natural V.M. being preferred. Of the 26 criteria in the PPI model, 10 were direct natural measures and 16 were directly constructed, with 15 being single-dimensional measures and 1 being a two-dimensional measure. The two-dimensional constructed scale was introduced to account for the interaction between the physician’s skill and their years of experience in one value measure. All the V.M.s and their types and scales are shown in Table 1.
The value measures constructed scales must pass the clairvoyance test [9]. The ranges must be well defined and include all outcomes possible to satisfy this test’s requirements. We identified the scales for the PPI model considering all potential issues—the subject matter the experts reviewed and the approved/improved the scales, as well as the definitions of the V.M.s. The type and scale range for all the V.M.s are shown in Table 1. A useful reference on how to define V.M.s and their levels is [10]. An example of a natural measure is the item efficacy value measure “proportion of treatments that achieved the intended effect during ideal trials”, which has levels of measure ranging from 20% to 100%. An example of a constructed one-dimensional value measure rubric is the item’s “easiness of instructions for preparation and use” value measure “Instructions difficulty”, for which we defined the levels as shown in Table 2.
Table 2.
Item distinguishing features value measure.
Value functions provide normalized unified numbers (0 to 100) on the y-axis (potential value of preference) mapped to the corresponding scores on the x-axis (levels on the V.M. scale) of the specific value measure. For example, the scale of the “ease of instructions” V.M. includes four scores/levels, which are 1, 2, 3, and 4, with corresponding values on the y-axis of 0, 25, 55, and 100.
Two methods were presented to assess the value functions by [28], namely, the Mid-Value Splitting Technique and the Lock-Step Procedure, with the first being the most common in practice. Another two methods were presented by [9], and they are the piecewise linear function and the exponential function. The basic concept behind the piecewise linear single dimensional value function is the relative value increment. When the value measure can take on an infinite number of different measure levels, the exponential function approach is followed. It was proposed by [33] as an extension to the Mid-Value Splitting Technique when the V.M. meets certain conditions. When the preferences are monotonically increasing (that is, higher score levels of xi are preferred to lower score levels), then the exponential single dimensional value function is:
where and are the lowest and highest score levels of the specific value measure xi, respectively, and is the exponential value function constant. The shape of the function is determined by where negative values result in convex functions and positive values result in concave functions. A similar exponential value function can be specified for the monotonically decreasing preference case.
Researchers proposed the first round of value functions based on their perspective and knowledge. We worked with stakeholders to perform another round to refine those value functions. The third round was carried out when the experts and the main two stakeholders met for the second time to capture their opinions on final amendments to or agreement on the value functions. The approach in [10] (pp. 197–198) was followed for the whole process. The curve shape and rationale behind the shape for all value functions are shown in Table 1. As an example, the value function for the ease of instruction is shown in Figure 4.
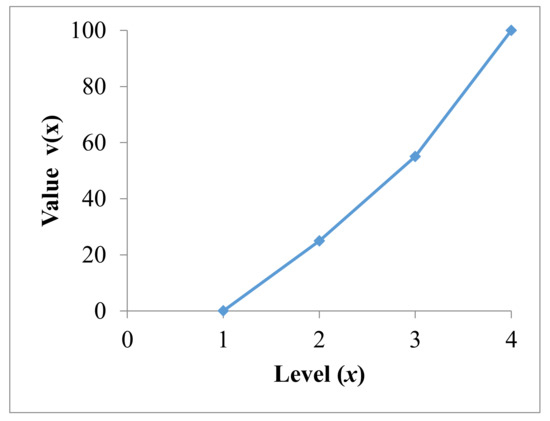
Figure 4.
Ease of instruction value function.
The model is now ready to assess the value added by each alternative (PPI) on each V.M. This is done by scoring the PPI on each value function and reading the value. One of several mathematical functions in MODA that can be used to evaluate the total potential value of the PPI is the additive value model. It is considered the most commonly used and simplest model [9]. It assumes mutual preferential independence, which means that the preference order of a criterion does not change with changes in the rank ordering of the preferences of other criteria. In other words, the assessment of value for an alternative on a specific value measure does not depend on any other value measure assessment. If the criteria are mutually preferentially independent, the value function is additive (for n > 3), as proved by [28]. We worked in this research to ensure that the value difference of a criterion is independent of the remaining criteria. Each objective is preferentially independent of other objectives, an assumption that was validated by the physicians who participated in this research. For each criterion, the physicians were asked two separate questions with two different extremes on each criterion individually to check if all the other criteria values will be mixed when varying this specific one. The physicians agreed that they are all can be assumed to be mutually preferentially independent. Hence, the additive value model can be applied to measure the total value for a PPI selection as:
where:
- is the overall value of the PPI;
- i is an index of the V.M. and n is the total number of V.M.s;
- is the PPI score on the x-axis of the ith V.M.;
- is the corresponding value on the y-axis of the ith V.M.;
- is the swing weight of the ith V.M., where
3.2.2. Weights Assessment
The last element of the model is the criteria swing weights, which can be defined as the degree of desire assessed (value increment) by swinging the score on each value measure from its least preferred level to its most preferred level. Swing weight represents the increment in value that is added from the alternative by enhancing the score on that evaluation measure from its least preferred level to its best level while fixing all the remaining criteria. It is more than importance weights; see [34].
There are techniques for assessing the swing weights for individuals; see [9] and [35] for details. Since we are dealing with groups, an appropriate approach to assess weights was used in this research; it is the voting (ordinal then cardinal) method [10]. The swing weights are determined for the sub-objectives (criterial) level.
The participating stakeholders were asked to assign points to the 26 criteria based on the principle of the value increment. The normalized global swing weights were calculated using the formula:
where:
i = the ith value measure;
n = the total number of value measures (26 value measure);
fi = the swing weight assigned to a measure (in points).
The model was implemented using a spreadsheet, and the calculations of alternative value were performed using a macro, which passes the required scoring, and the value function list of values for both x and v(x) as inputs. The macro used was adopted from [9]. The following are two case studies that were carried out on two PPIs in two hospitals using the proposed model.
4. Case Studies
4.1. Case Study I: (Pulse Oximeter)
The first case study was performed on an item called a Pulse Oximeter. A Pulse Oximeter is used to measure the oxygen saturation (SO2) of a person. Two brands of this device were scored on the 26 criteria by 6 physicians and 11 nurses. The weights were also assessed for the criteria beforehand. The scores were reasonably within range of each other, meaning that the variability was very low.
Consequently, the average of the scores was considered for all measures. All the input data and value calculations are shown in Table 3. The last column shows the ideal alternative, which scores the ideal score on every criterion; it is used for the verification of the model, since its value should be exactly 100.
Table 3.
Total value calculations for the Pulse Oximeter.
Analyzing the Results
The cost is not a part of the model; the final results of the framework after scoring alternatives are the values of all the qualities/criteria. The results are presented in the form of a value/cost analysis, where the total value versus cost is plotted for both alternatives, along with the ideal choice; see Figure 5. There is a tradeoff between Oximeter B, with a potential value of 73 at the cost of $40, and Oximeter A, with a potential value of 64 at the cost of $30. The decision is now left to the value analysis team at the organization who should decide if the added value for Oximeter B, if used instead of A, deserves the additional price. In other words, does an additional value equal to 72.9 − 64.4 = 8.5 measure as desirable versus the extra $10? The value versus cost plot helps the decision-makers to identify the dominant and dominated alternatives. For example, if there was a third alternative with a value of less than 73 and a cost of more than $40, it would be dominated by B, and an immediate decision could be made to discard it from the discussions.
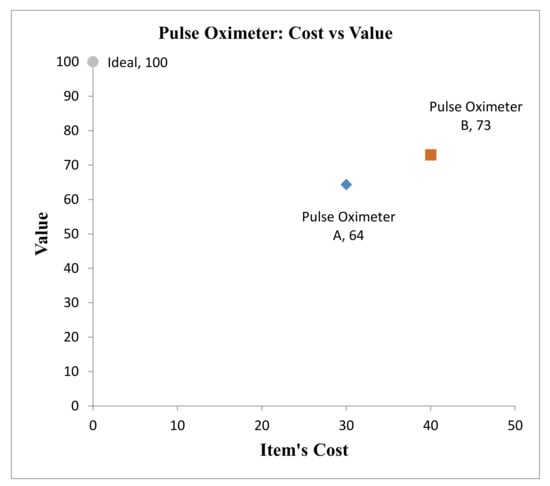
Figure 5.
Total value versus cost for the “Pulse Oximeter”.
Further analysis may be needed to look further into the value contribution from each V.M. category for each alternative for two reasons—first, to decide whether the additional value comes from a criteria category that matters more for the organization. The second is to investigate the possibilities of enhancing the cheaper alternative for a higher potential value. See Figure 6 for the five criteria categories values of both options, along with the ideal for comparison. The significant difference in value contribution comes from the “clinician satisfaction.” In other words, to boost the value of Oximeter A, the organization needs to focus on this category criteria and score higher for this alternative. Further analysis may be performed for any specific group for more in-depth details.
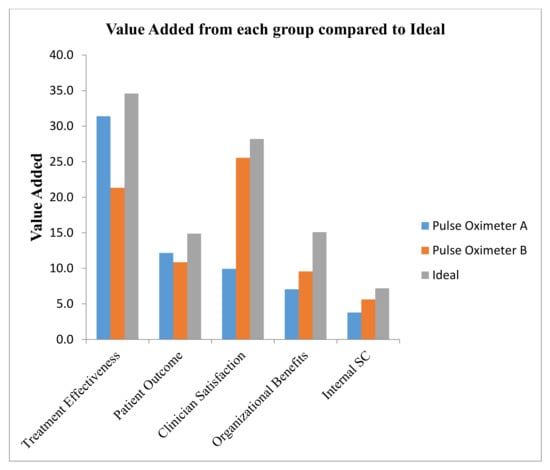
Figure 6.
Value contribution of the five categories of “Pulse Oximeter”.
4.2. Case Study II: (Central Venous Catheter)
The second case study was conducted on an item in another hospital that specializes in the treating of cancer diseases in Jordan. The PPI used was the Central Venous Catheter (CVC); it is a catheter that is placed into a large vein to facilitate taking medications and fluids that cannot be taken by the mouth or a small vein due to the potential damage it would cause. Staff consisting of three physicians, five nurses, and two supply chain management engineers participated in soliciting the swing weights, as well as in scoring the two PPI alternatives. The average was considered as the final value for each score. Total values were calculated for each of the two alternatives.
The results of this example will be limited to avoid the repetition of details. The full table will not be shown; instead, we will show the value versus cost chart and the sensitivity of the model to the swing weights. As shown in Figure 7, it is evident that PPI “B” is dominating the other CVC, since it has a higher total potential value, 54, with a cost of $125, which is lower than the CVC “A” cost of $150. The contribution to the total value shows that both alternatives need improvement on the criteria of “patient’s outcome” as well as “organizational benefits”; see Figure 8. A sensitivity analysis of the swing weights shows that the value is sensitive to none of the swing weights.
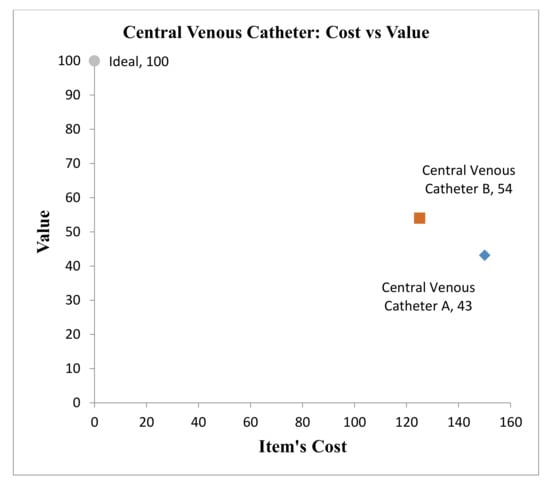
Figure 7.
Total value versus cost for the “CVC”.
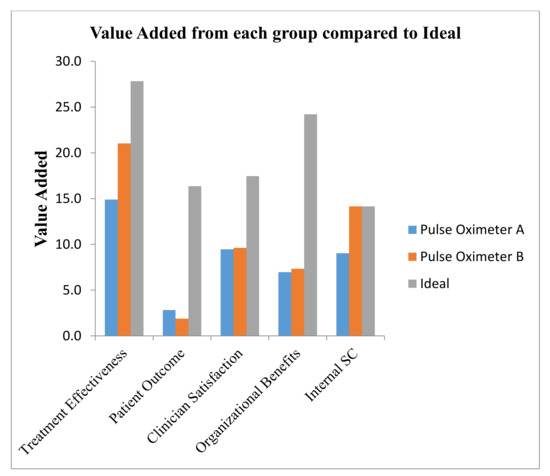
Figure 8.
Value contribution of the five categories of “CVC”.
4.3. Framework Evaluation
The proposed framework was evaluated at selected U.S. hospitals. Feedback was collected by meetings, either actual or virtual, with experts from three different healthcare organizations. The participants from the U.S. included four SCPs, two physicians, and three nurses. The two physicians were plastic surgeons and neurosurgeons, with each having more than 15 years of experience. Both are also leading value analysis programs in their organization, experienced in clinical and financial outcomes, standardizing the quality of care, and facilitating physician engagement and the integration of value-driven decision-making within healthcare delivery systems. Thus, they have valuable experience as clinicians, and they bring expertise in value-driven decision-making.
Based on the discussions, we can conclude that all the participants were receptive to the process and thought that it was valuable. The process started with contacting the experts to have an agreement on participating; then, a first meeting was held to explain the theory based on which the framework will be established, which was MODA. A second meeting was held to show the participants the proposed model and have their feedback to improve it, and the model was modified accordingly. A final meeting was held, either to illustrate the final model through example or to perform a case study such in the previous section. A notional example of four heart stents was created to demonstrate the framework for the participants in the U.S. The participants’ initial reactions were captured during the meetings. After showing the results, framework evaluation feedback was obtained through a form sent to the participants.
All the questions were asked on a 1 to 5 Likert scale, where one means “I do not agree”, and five means “I strongly agree”. The 15 questions were classified into four groups, namely: the degree the framework captures the PPI problem, the time and ease of implementation, the value added from this framework, and if it is implementable in their companies. The framework evaluation is shown graphically in Figure 9.
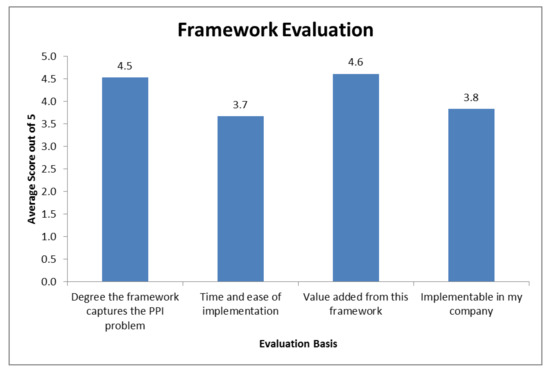
Figure 9.
Framework evaluation feedback.
The items “degree the framework captures the PPI problem” and “value-added from this framework” are necessary to conclude that this framework satisfied this problem as well as that it has a high potential in adding value to the selection process. For the other two items, the results were expected based on our understanding of MODA and the model. For the “Time and ease of implementation”, it is expected to have a lower score; the model needs explanation, and input is required from stakeholders before any item value evaluation can take place. Item evaluation (scoring) itself requires input assessment on all of the 26 sub-objectives. With that being said, this will not always be the case, since organizations will learn with time, can customize the framework, and automate portions of the evaluation process. In the long run, it may be expected to be even more comfortable than the pure discussions, since the framework readily fosters the tracking and evaluation of decisions over time. Regarding the last item, “If they think it is implementable in their companies”, it is not easy to change and adopt new processes. In general, people do not like to spend time learning new methods, as well as the fear from the added layer of complexity. The last question in the evaluation feedback was an open question, and the following summarizes the comments with minor changes to correct spelling and formatting.
An SCP said, “Even though this is a university setting and our Physicians are scientists, there has not been a culture in the past of adding scientific theory to the Value Analysis process. In the past, decisions have been made “assumedly” under the patient’s need and (typically) with minimal scrutiny. Implementation (though not impossible) would be complicated due to what would be seen as additional layers of complexity and more “bureaucratic hoops” to jump through. In many cases, if systems are deemed too cumbersome, Physicians complain, and find ways around the system.”
A physician said, “I think any tool that lends objectivity to the value analysis process is a welcome addition. Value analysis in practical terms often gets slowed down by indecision and lack of momentum”. Additionally, “This tool can potentially improve that and simplify the decision-making analysis”. Finally, “I appreciate the fact that the developers sought clinicians’ input to ascertain, which was the most important aspect to consider in the various categories. I felt the criteria they selected were extremely thorough and represented a comprehensive thought process in evaluating products”.
One final note to mention is a comment that was made through one of the meetings that the power of physicians’ contribution to the decision will outweigh other people’s opinions. This concern is one of the primary reasons for using such a methodology, because it systematically includes the perspective of all stakeholders. This type of analysis will enable value analysts to show the consequences of any decision in terms of the added value versus cost. The visibility of decisions and traceability are two significant characteristics for the big picture shown in the output.
5. Sensitivity Analysis
The robustness of the results can be tested by conducting a sensitivity analysis on the model, which can be performed on any parameter such as swing weights, value curve shapes, and scores. The most common is the swing weight sensitivity. This kind of analysis lets the value analysis team be aware of the specific value measures that have more attention when soliciting the swing weights. The sensitivity was analyzed on the first objective level—i.e., for each group as a whole. When each swing weight of the five groups was varied, the remaining four swing weights were varied in the same proportion to ensure the swing weights added up to 1. As an example, see Figure 10, which shows that the total potential value is not sensitive to the “organizational benefits” value measures weights. The “internal S.C.” value measures resulted in similar behavior from the model. The other three categories showed a different reaction—for example, the “clinician satisfaction” group of value measures resulted in a switch in the total value of the alternatives at an approximate total weight value of 0.14, below which alternative A will have preference over B, see Figure 11.
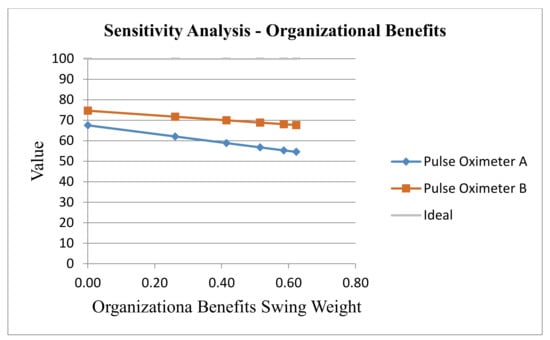
Figure 10.
Sensitivity analysis of the “organizational benefits” value measures as a group.
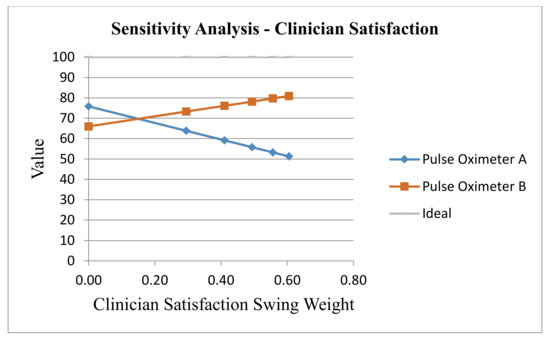
Figure 11.
Sensitivity analysis of the “clinician satisfaction” value measures as a group.
Because of the lack of other frameworks applied to this problem, a sensitivity analysis was conducted to demonstrate the robustness of our proposed model.
6. Conclusions and Future Work
SKU proliferation can decrease the supply chain performance of healthcare organizations for many reasons. First, proliferation causes additional administrative costs to handle multiple item types, vendors, and purchase orders. Second, SKU proliferation decreases the ability of the organization to pursue order size discounts and to negotiate prices.
A PPI selection model was proposed, and an MCDM decision framework was developed based on MODA. The model was reviewed and evaluated in terms of the effectiveness and the value added to the current value analysis process. The evaluation feedback received from the experts, as summarized in the previous section, shows a very positive perspective of the framework and a high perceived potential regarding its effectiveness. It should be emphasized here that this framework separates the cost from all the other non-cost related qualities, which were found to be interesting and useful by the healthcare organizations. The sensitivity analysis demonstrated the robustness of the model and the enhanced decision-making benefits from the framework.
A recommendation for healthcare organizations is to conduct value-focused thinking (VFT) after analyzing the results and performing the sensitivity analysis to improve the alternatives. This interactive process involves decision-makers, stakeholders, experts, and decision analysts to look for other options that can create higher value. This framework should be reviewed frequently to make sure weights, as well as value functions, represent the stakeholders’ preferences.
For future work, this model may be revised with experts and stakeholders for a clear hierarchy and modified accordingly. Case studies should be conducted to illustrate any modified model. In future work, the authors are planning on applying portfolio optimization modeling after the value versus cost analysis. The best value of the selected items subjected to constraints, such as the available budget and the available space, should be the focus of the optimization. Another future work is to develop a total cost of ownership (TCO) model for the PPI and use it instead of the item’s purchase price. Additionally, models other than the additive may be applied and the framework performance investigated.
Author Contributions
This research is based on M.A.S.’s PhD dissertation. He performed the work under the guidance of M.D.R.; M.A.S. wrote the majority of the article. M.A.S. performed the data collection, constructed the MODA model, and developed the analysis presented in the article. M.D.R. reviewed the article and assisted in its conceptualization and organization. M.D.R. conceived of the application of MODA to the PPI problem and assisted in its application to the problem. M.A.S. implemented the framework through two case studies he conducted in Jordan. All authors have read and agreed to the published version of the manuscript.
Funding
This research received no external funding.
Conflicts of Interest
The authors declare no conflict of interest.
References
- Schneller, E.S.; Smeltzer, L.R. Strategic Management of the Health Care Supply Chain; Jossey-Bass: San Francisco, CA, USA, 2006. [Google Scholar]
- Shbool, M.A. Essays in Physicians Preference Items and Inventory Management within the Healthcare Supply Chain. Ph.D. Thesis, University of Arkansas, Fayetteville, NC, USA, 2016. [Google Scholar]
- Gopalakrishnan, V.; Ramaswamy, C. Patient opinion mining to analyze drugs satisfaction using supervised learning. J. Appl. Res. Technol. 2017, 15, 311–319. [Google Scholar] [CrossRef]
- Krishankumar, R.; Ravichandran, K.S.; Premaladha, J.; Kar, S.; Zavadskas, E.; Antucheviciene, J. A Decision Framework under a Linguistic Hesitant Fuzzy Set for Solving Multi-Criteria Group Decision Making Problems. Sustainability 2018, 10, 2608. [Google Scholar] [CrossRef]
- Shbool, M.A.; Rossetti, M.D. Physician Preference Items–A Decision Making Framework. In Proceedings of the IIE Annual Conference, Pittsburgh, PA, USA, 20–23 May 2017; pp. 91–96. [Google Scholar]
- Dyer, J.S.; Sarin, R.K. Measurable Multiattribute Value Functions. Oper. Res. 1979, 27, 810–822. [Google Scholar] [CrossRef]
- Edwards, W.; Barron, F.H. SMARTS and SMARTER: Improved Simple Methods for Multiattribute Utility Measurement. In Organizational Behavior and Human Decision Processes; 1994; Volume 60, pp. 306–325. [Google Scholar]
- Von Winterfeldt, D.; Edwards, W. Decision Analysis and Behavioral Research; Cambridge University Press: Cambridge, UK, 1986. [Google Scholar]
- Kirkwood, C.W. Strategic Decision Making: Multiobjective Decision Analysis with Spreadsheets; Duxbury Press: Belmont, CA, USA, 1997. [Google Scholar]
- Parnell, G.; Bresnick, T.A.; Tani, S.N.; Johnson, E.R. Handbook of Decision Analysis; John Wiley & Sons: Hoboken, NJ, USA, 2013. [Google Scholar]
- Rich, N.; Holweg, M. Value Analysis, Value Engineering; Lean Enterprise Research: Cardiff, UK, 2000. [Google Scholar]
- Schoen, C.; Osborn, R.; Squires, D.; Doty, M.M.; Pierson, R.; Applebaum, S. How Health Insurance Design Affects Access To Care And Costs, By Income, In Eleven Countries. Health Aff. 2010, 29, 2323–2334. [Google Scholar] [CrossRef] [PubMed]
- Moon, S. Taking cost off supply shelf. Healthcare turning to supply chain management techniques honed by retail, manufacturing to limit inventory, slash expenses. Modern Healthcare 2004, 34, 26–28. [Google Scholar] [PubMed]
- Abutaleb, Y. U.S. Healthcare Spending to Climb 5.3 Percent in 2018: Agency. 2018. Available online: https://www.reuters.com/article/us-usa-healthcare-spending/u-s-healthcare-spending-to-climb-5-3-percent-in-2018-agency-idUSKCN1FY2ZD (accessed on 28 March 2019).
- Eskew, M. Forcing Costs Down. Mater. Manag. Health Care 2002, 11, 24–28. [Google Scholar]
- Chow, G.; Heaver, T.D. Logistics in the Canadian Health Care Industry. Can. Logist. J. 1994, 1, 29–73. [Google Scholar]
- DeJohn, P. The Last Frontier: Saving on M.D. Preference Items. Hosp. Mater. Manag. 2005, 30, 9–11. [Google Scholar]
- Siddel, K. Hospitals Losing on Physician Preference Items. OR Manager 2012, 28, 1–2. [Google Scholar]
- Diaby, V.; Campbell, K.; Goeree, R. Multi-Criteria Decision Analysis. In Operations Research for Health Care; Elsevier: Amsterdam, The Netherlands, 2013; Volume 2, pp. 20–24. [Google Scholar]
- Montgomery, K.; Schneller, E.S. Hospitals’ strategies for orchestrating selection of physician preference items. Milbank Q. 2007, 85, 307–335. [Google Scholar] [CrossRef] [PubMed]
- Triantaphyllou, E.; Shu, B.; Sánchez, S.N.; Ray, T.G. Multi-Criteria Decision Making: An Operations Research Approach. In Encyclopedia of Electrical and Electronics Engineering; Webster, J.G., Ed.; John Wiley & Sons: New York, NY, USA, 1998; Volume 15, pp. 175–186. [Google Scholar]
- Velasquez, M.; Hester, P.T. An Analysis of Multi-Criteria Decision Making Methods. Int. J. Oper. Res. 2013, 10, 56–66. [Google Scholar]
- Agarwal, P.; Sahai, M.; Mishra, V.; Bag, M.; Singh, V. A Review of Multi-Criteria Decision Making Techniques for Supplier Evaluation and Selection. Int. J. Ind. Eng. Comput. 2011, 2, 801–810. [Google Scholar] [CrossRef]
- Belton, V.; Stewart, T.J. Multiple Criteria Decision Analysis: An Intigrated Approach; Kluwer Academic Publishers: Norwell, MA, USA, 2003. [Google Scholar]
- Pollard, S.; Bansback, N.; Bryan, S. Physician Attitudes toward Shared Decision Making: A Systematic Review. Patient Educ. Couns. 2015, 98, 1046–1057. [Google Scholar]
- Kanzaria, H.K.; Booker-Vaughns, J.; Itakura, K.Y.; Kane, B.G.; Gayer, C.; LeBlanc, A.; Gibson, R.; Chen, E.H.; Williams, P. Dissemination and implementation of shared decision making into clinical practice: A research agenda. Acad. Emer. Med. 2016, 23, 1368–1379. [Google Scholar] [CrossRef] [PubMed]
- de Mik, S.M.L.; Stubenrouch, F.E.; Balm, R.; Ubbink, D.T. Systematic review of shared decision-making in surgery. Br. J. Surg. 2018, 105, 1721–1730. [Google Scholar] [CrossRef] [PubMed]
- Keeney, R.L.; Raiffa, H. Decisions with Multiple Objectives: Preferences and Value Tradeoffs; John Wiley & Sons: Hoboken, NJ, USA, 1976. [Google Scholar]
- Trainor, T.E.; Parnell, G.S.; Kwinn, B.; Brence, J.; Tollefson, E.; Downes, P. The US Army Uses Decision Analysis in Designing Its US Installation Regions. Interfaces 2007, 37, 253–264. [Google Scholar] [CrossRef]
- Ewing, P.L., Jr.; Tarantino, W.; Parnell, G.S. Use of decision analysis in the army base realignment and closure (BRAC) 2005 military value analysis. Decis. Anal. 2006, 3, 33–49. [Google Scholar] [CrossRef]
- Howard, R.A. The Foundations of Decisions Analysis Revisited. In Advances in Decision Analysis: From Foundations to Applications; Edwards, W., Miles, R.F., Jr., Winterfeldt, D., Eds.; Cambridge University Press: Cambridge, UK, 2007; pp. 32–56. [Google Scholar]
- Kitsios, F.; Kamariotou, M.; Talias, M.A. Corporate Sustainability Strategies and Decision Support Methods: A Bibliometric Analysis. Sustainability 2020, 12, 521. [Google Scholar] [CrossRef]
- Kirkwood, C.; Sarin, R. Preference Conditions for Multiattribute Value Functions. Oper. Res. 1980, 28, 225–232. [Google Scholar] [CrossRef]
- Parnell, G.S.; Trainor, T.E. Using the Swing Weight Matrix to Weight Multiple Objectives; INCOSE International Symposium; INCOSE: Singapore, 2009; Volume 19, pp. 283–298. [Google Scholar]
- Clemen, R.T.; Reilly, T. Making Hard Decisions with DecisionTools, 1st ed.; Duxbury Press: Pacific Grove, CA, USA, 2000; ISBN 978-0534365974. [Google Scholar]


© 2020 by the authors. Licensee MDPI, Basel, Switzerland. This article is an open access article distributed under the terms and conditions of the Creative Commons Attribution (CC BY) license (http://creativecommons.org/licenses/by/4.0/).