Study on the Deformation Mechanism of Reservoir Landslides Considering Rheological Properties of the Slip Zone Soil: A Case Study in the Three Gorges Reservoir Region

Abstract
:1. Introduction
2. Materials and Methods
2.1. Landslide Deformation
2.2. Ground Surface Monitoring
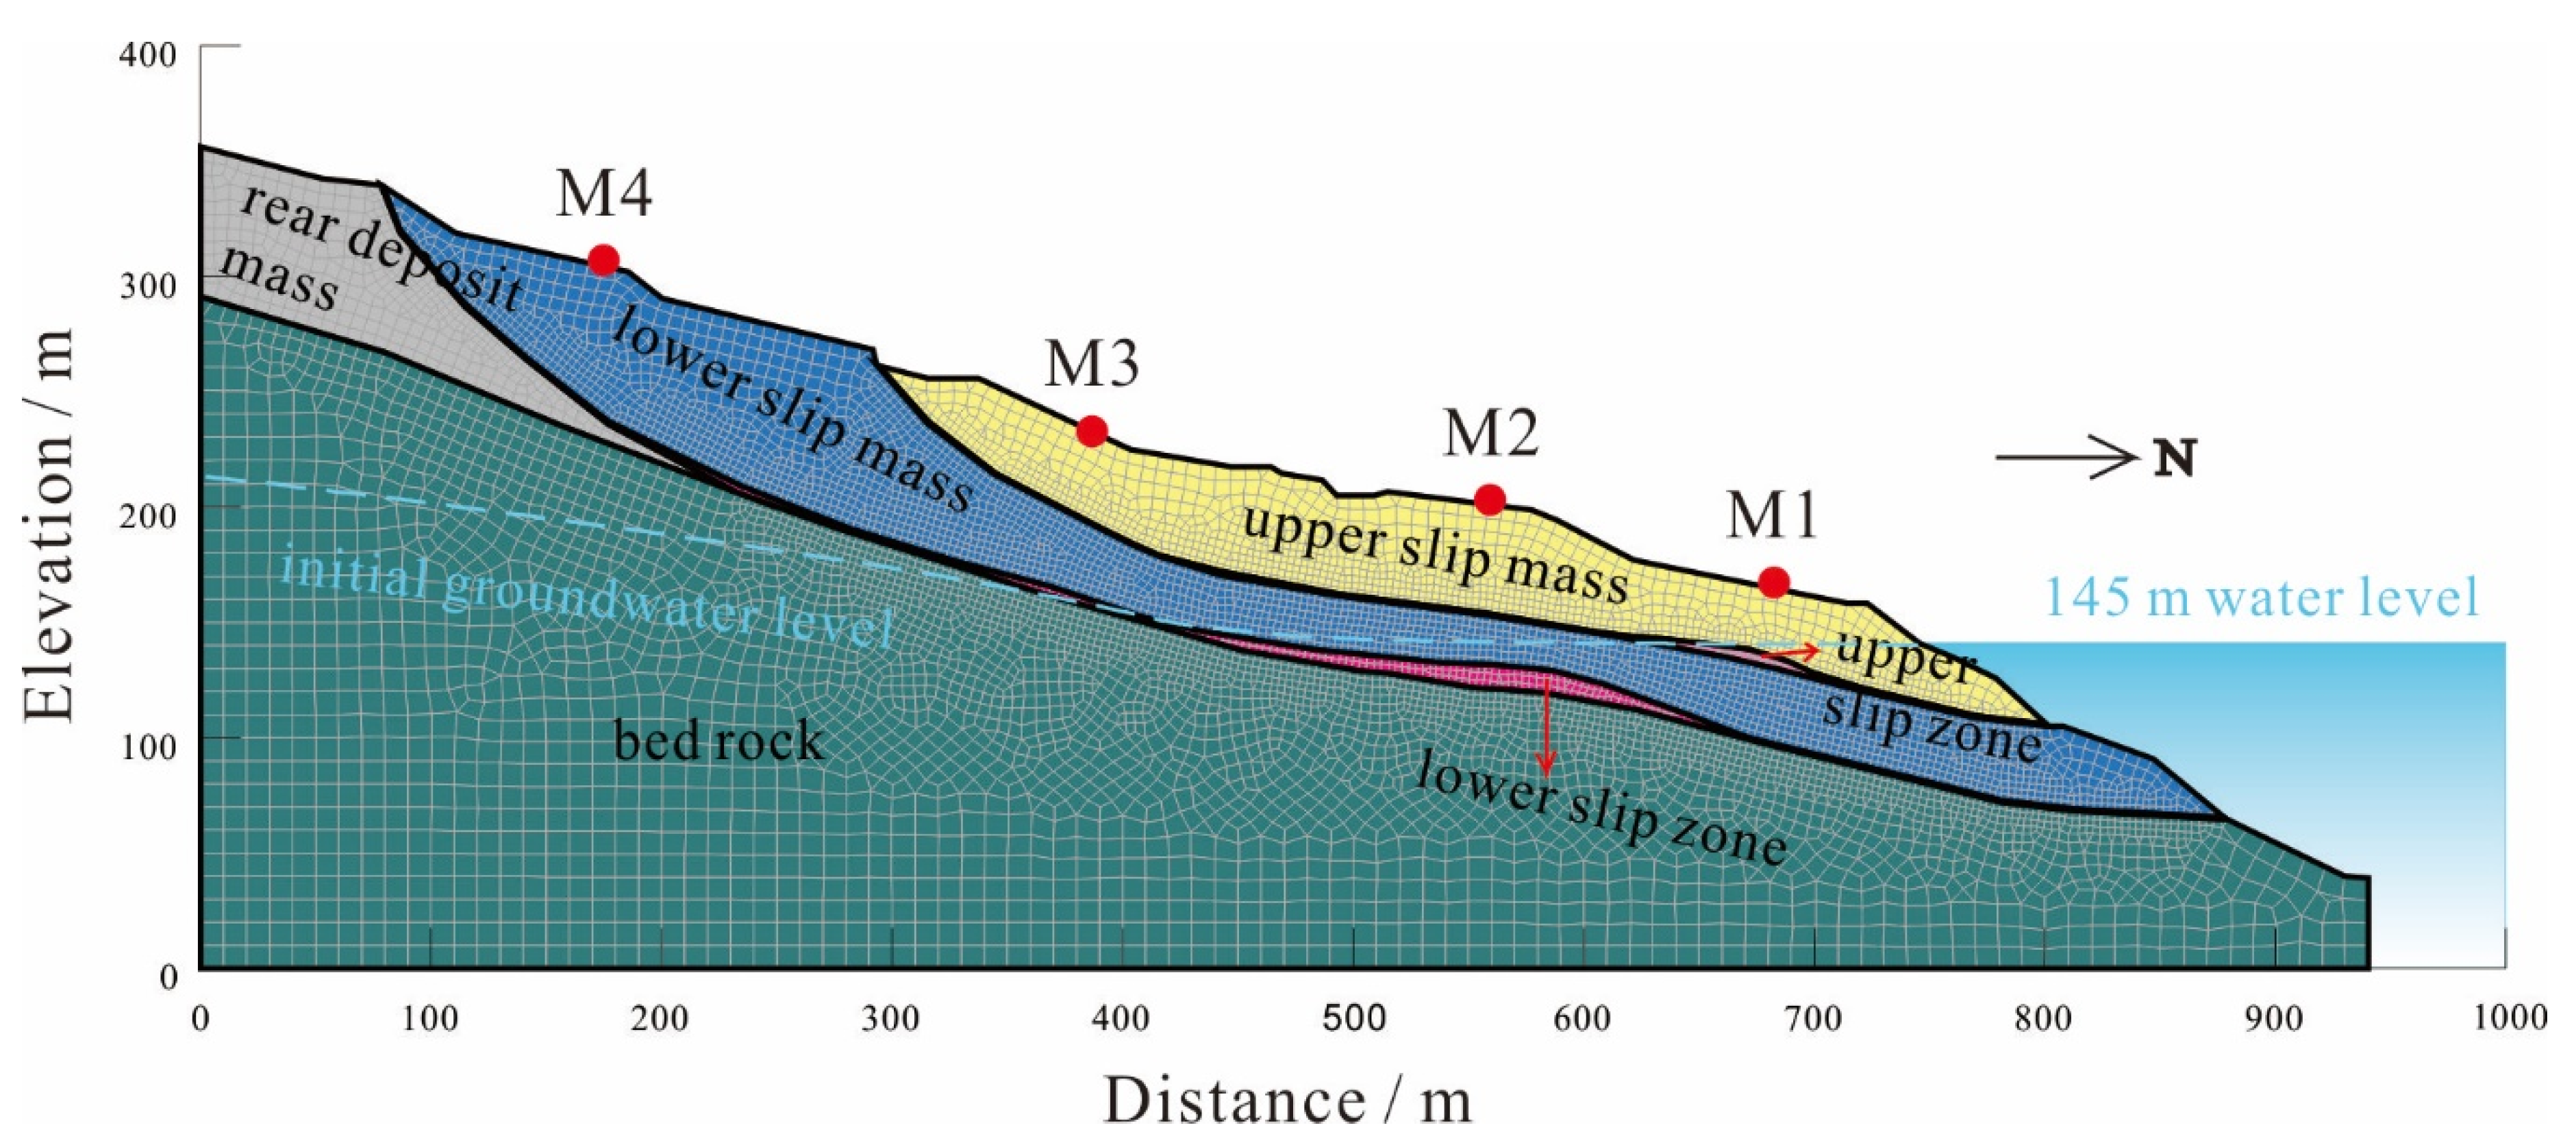
2.3. Numerical Simulation Model
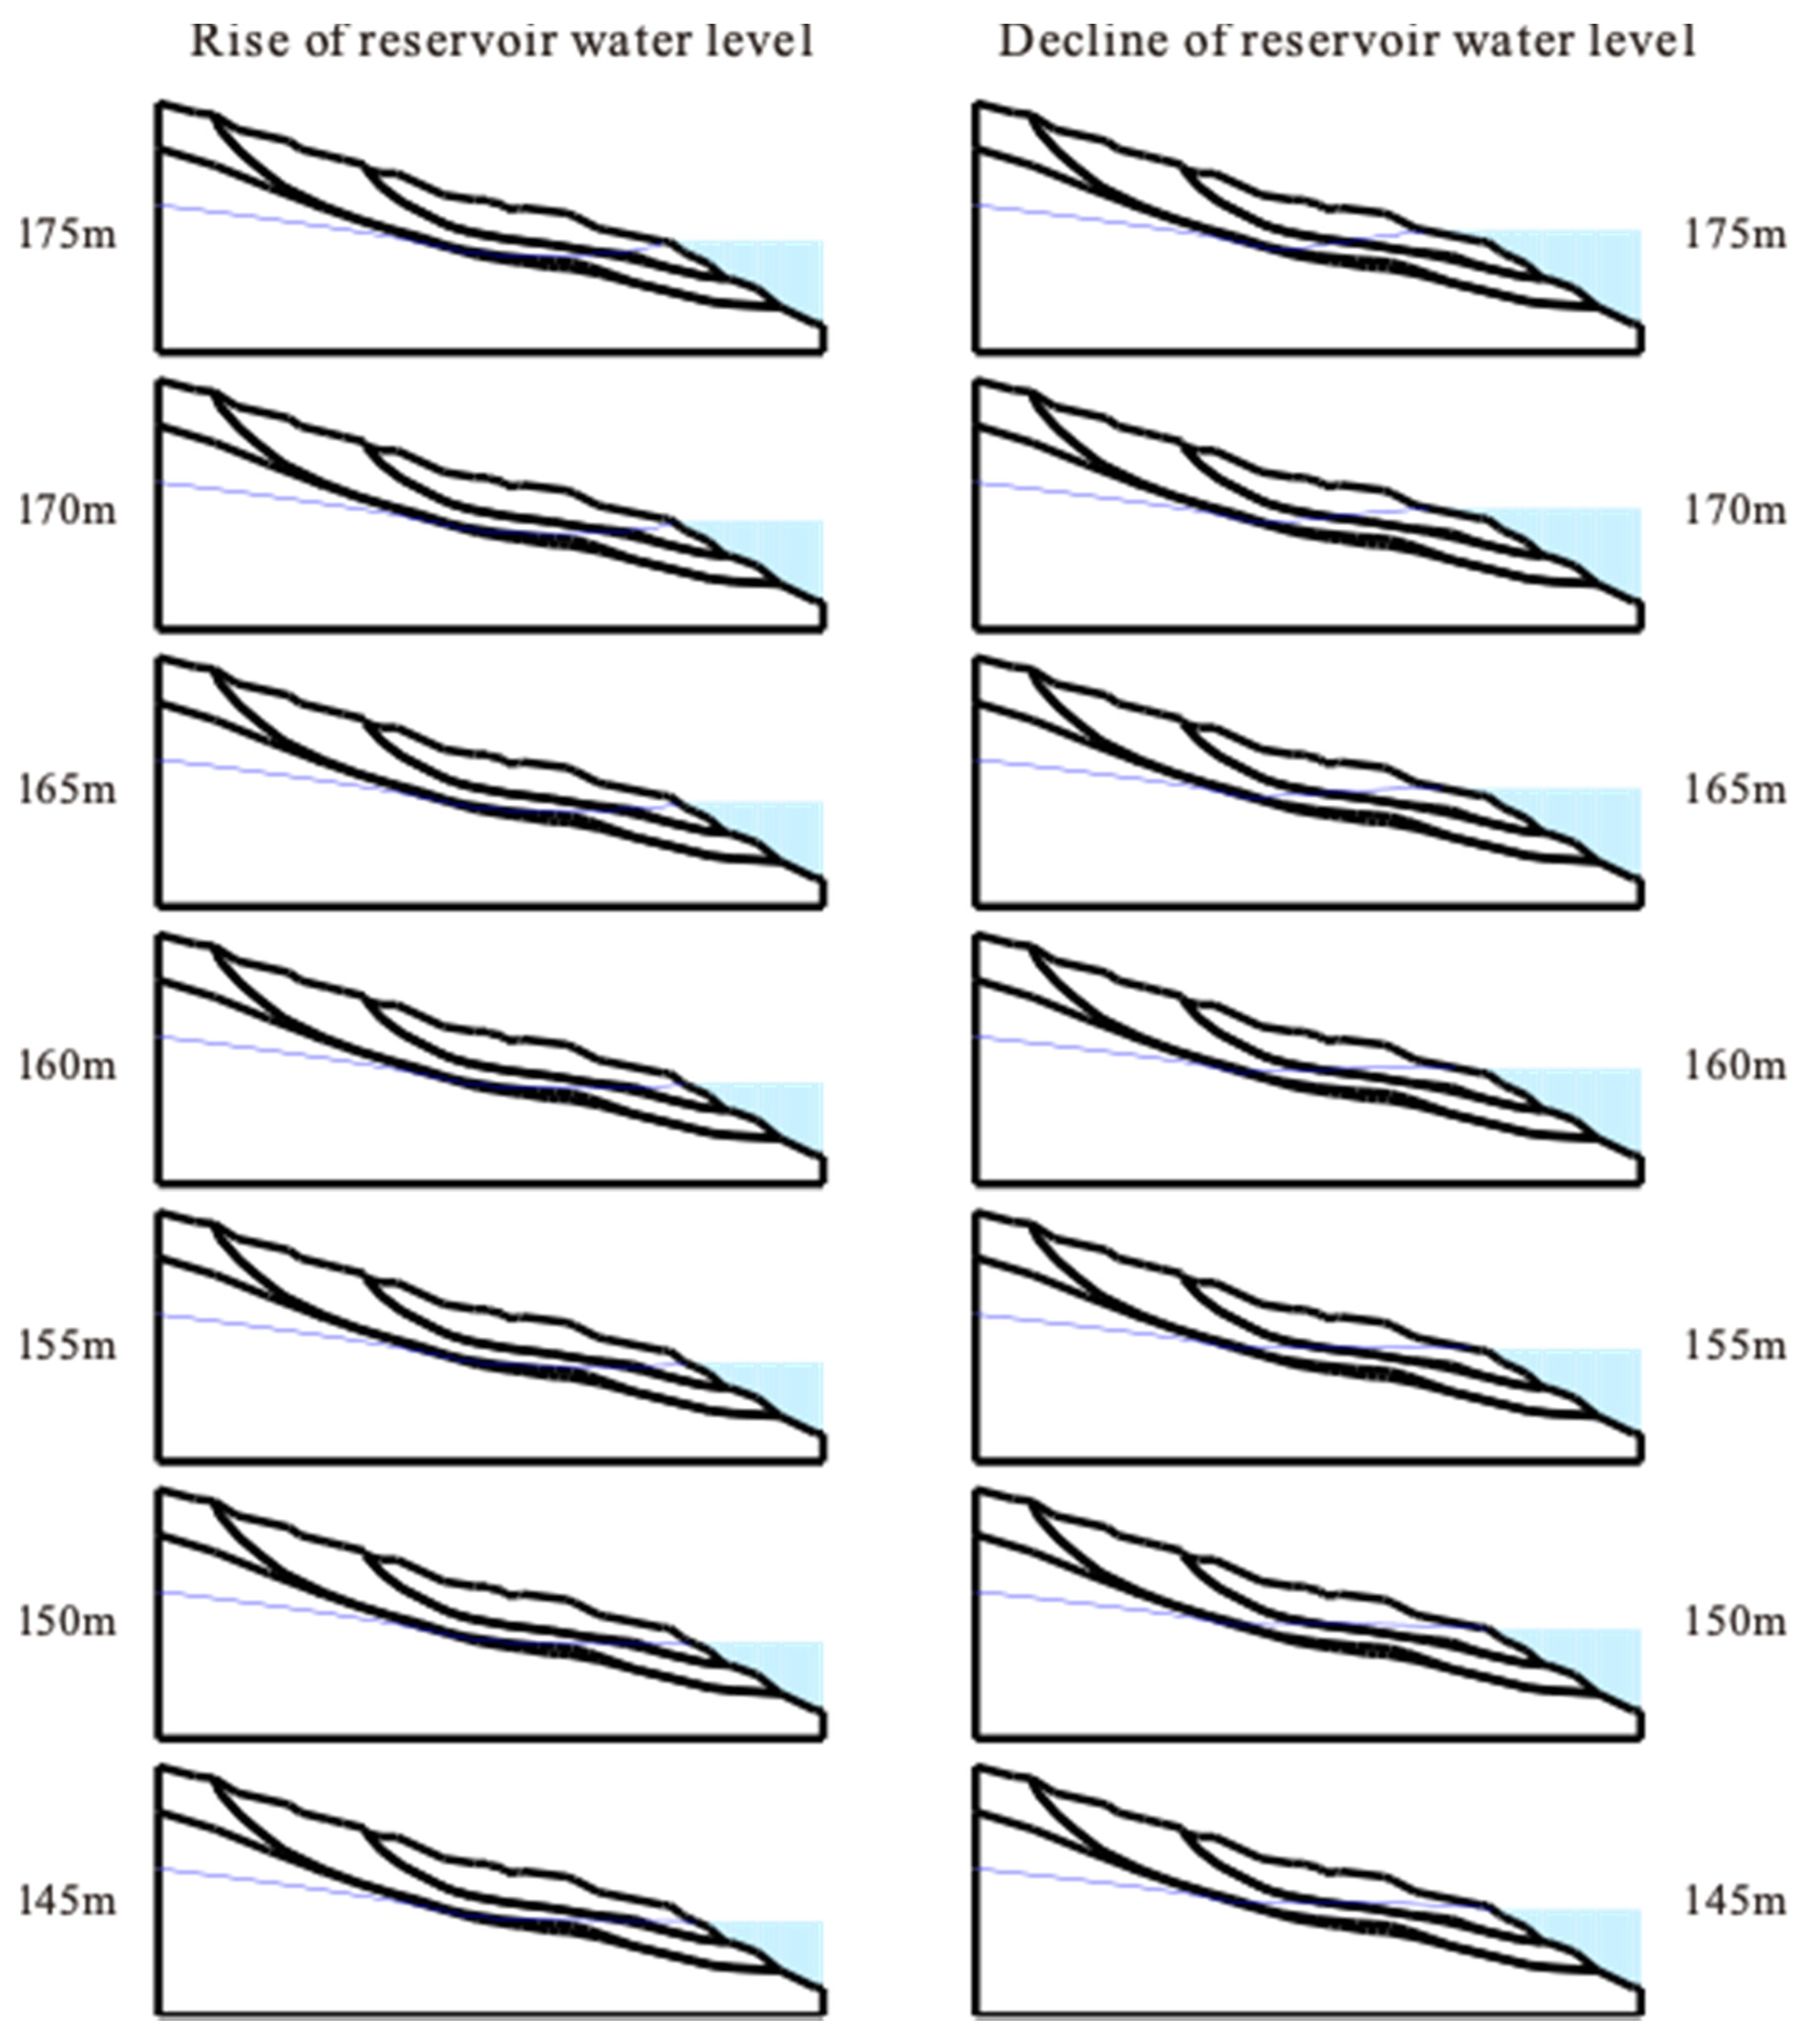
- Stage 1 water level rises from 145 m to 175 m in 30 days with a rate of 1.0 m/d.
- Stage 2 water level is sustained at 175 m for 60 days.
- Stage 3 water level declines slowly from 175 m to 145 m in 150 days at 0.2 m/d.
- Stage 4 water level is sustained at 145 m in the following 120 days.
3. Results
3.1. Seepage Line Analysis
3.2. Deformation Characteristics
3.2.1. Impoundment
3.2.2. Drawdown
- (1)
- When the reservoir water level starts to fall, an instantaneous elasto-plasticity deformation is generated at the upper shear outlet of the landslide due to the unloading effect caused by the fall in the reservoir water level. Deformation in this stage is observed only at the shear outlet of the landslide and is as small as 0.01 mm, as shown in Figure A11a.
- (2)
- Afterwards, deformation slightly increases under the effect of stress adjustment in the landslide. In the next 0.5 days, the combined effect of hydrodynamic pressure and reservoir water unloading leads to additional stress in the landslide, and this additional stress accelerates the landslide deformation. The predominant deformation still occurs in the slip mass, while the deformed zone extends downward to the nearby phreatic line. Compared to the displacement in the first stage, in this stage, it is small at approximately 0.7 mm, as shown in Figure A11b.
- (3)
- As the water level continuously falls, the additional stress slowly transmits to the slip zone, and creep deformation is observed in the slip zone. From 0.5 to 1.5 days, the overall deformation of the landslide in this stage is mainly controlled by the slip zone, and creep deformation gradually develops to the ground surface. There is a significant increase in deformation at this stage, and the maximum displacement is approximately 4.46 m, as indicated in Figure A11c.
- (4)
- In the following deformation stage, stress adjustment in the landslide is almost completed after 1.5 days. The overall deformation of the landslide develops at a constant speed under the rheological effect of the slip zone soil, as shown in Figure A11d.
- (1)
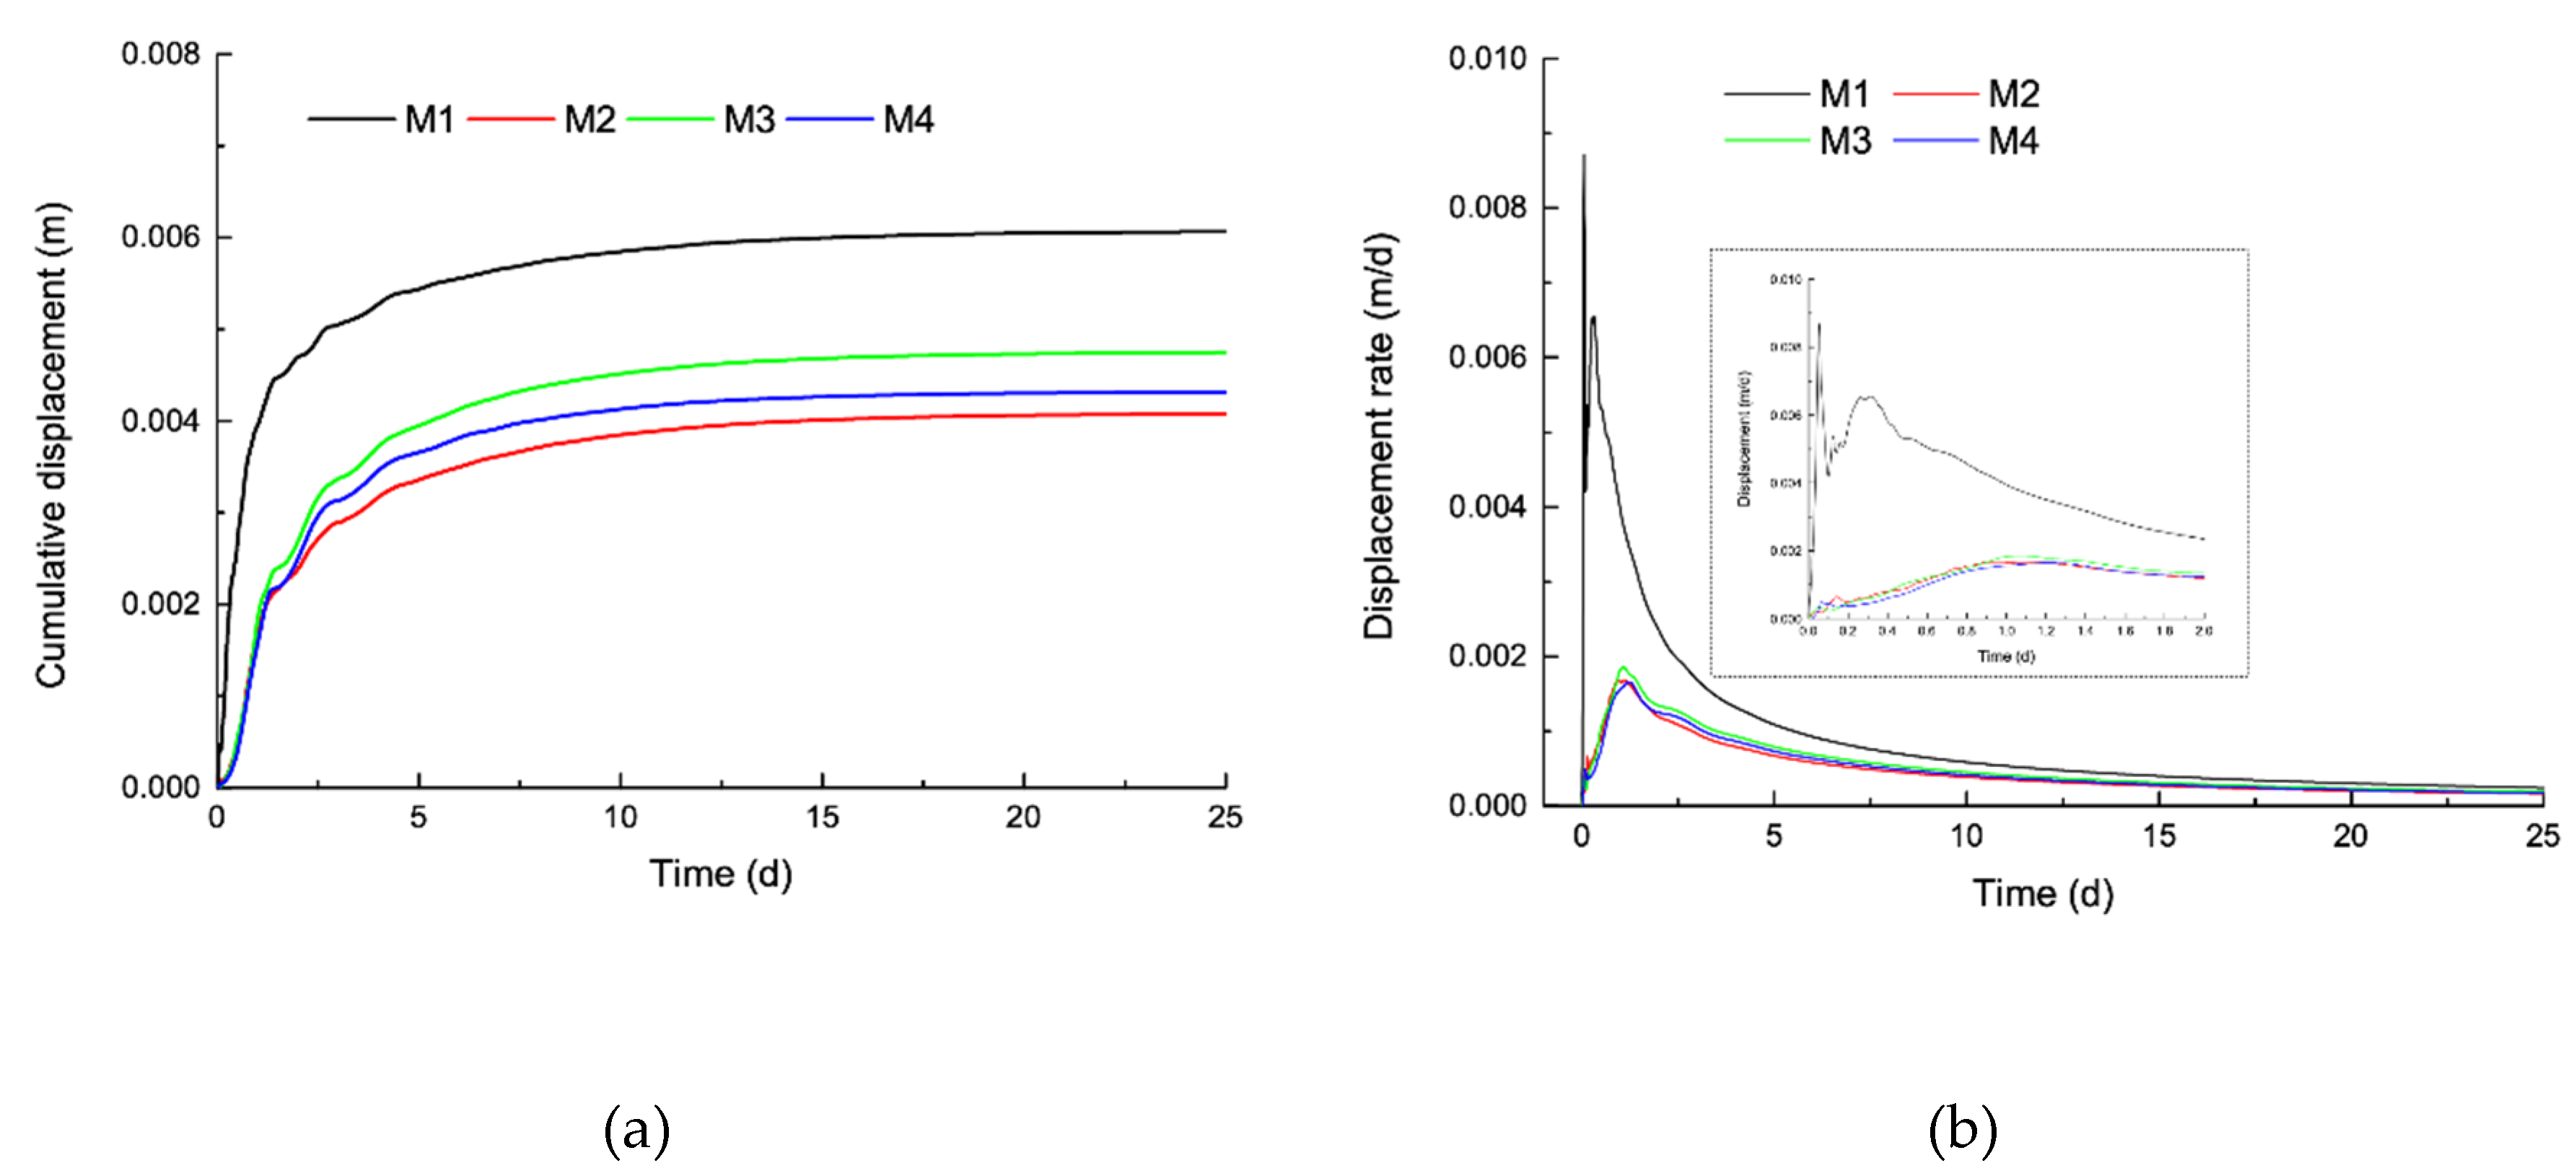
- The total displacement of each point is 6.06, 4.08, 4.75, and 4.31 mm, corresponding to M1, M2, M3, and M4, respectively. Greater deformation can be observed closer to the shear outlet of the landslide.
- (2)
- The startup time of creep deformation and creep rate varies in space. For monitoring points M1~M4, the startup time of creep deformation is 0.4, 0.2, 0.1, and 0.08 d, respectively, as shown in Figure A12a. Since shear stress is mainly concentrated at the shear outlet of the landslide where soil suffers high deviatoric stress, the creep rate is relatively higher as it approaches the shear outlet. The steady creep speed of each monitoring point is 0.24, 0.16, 0.18, and 0.17 mm/d, corresponding to M1, M2, M3, and M4, respectively.
- (3)
- The displacement at the slip zone is smaller than that at the ground surface, and there is a remarkable jump at the depth of the upper slip zone, as shown in Figure A12b in the deformation curve. In the creep deformation stage, the overall deformation of the landslide is mainly controlled by the slip zone, so there is only a small variation in the overlying slide mass.
- (1)
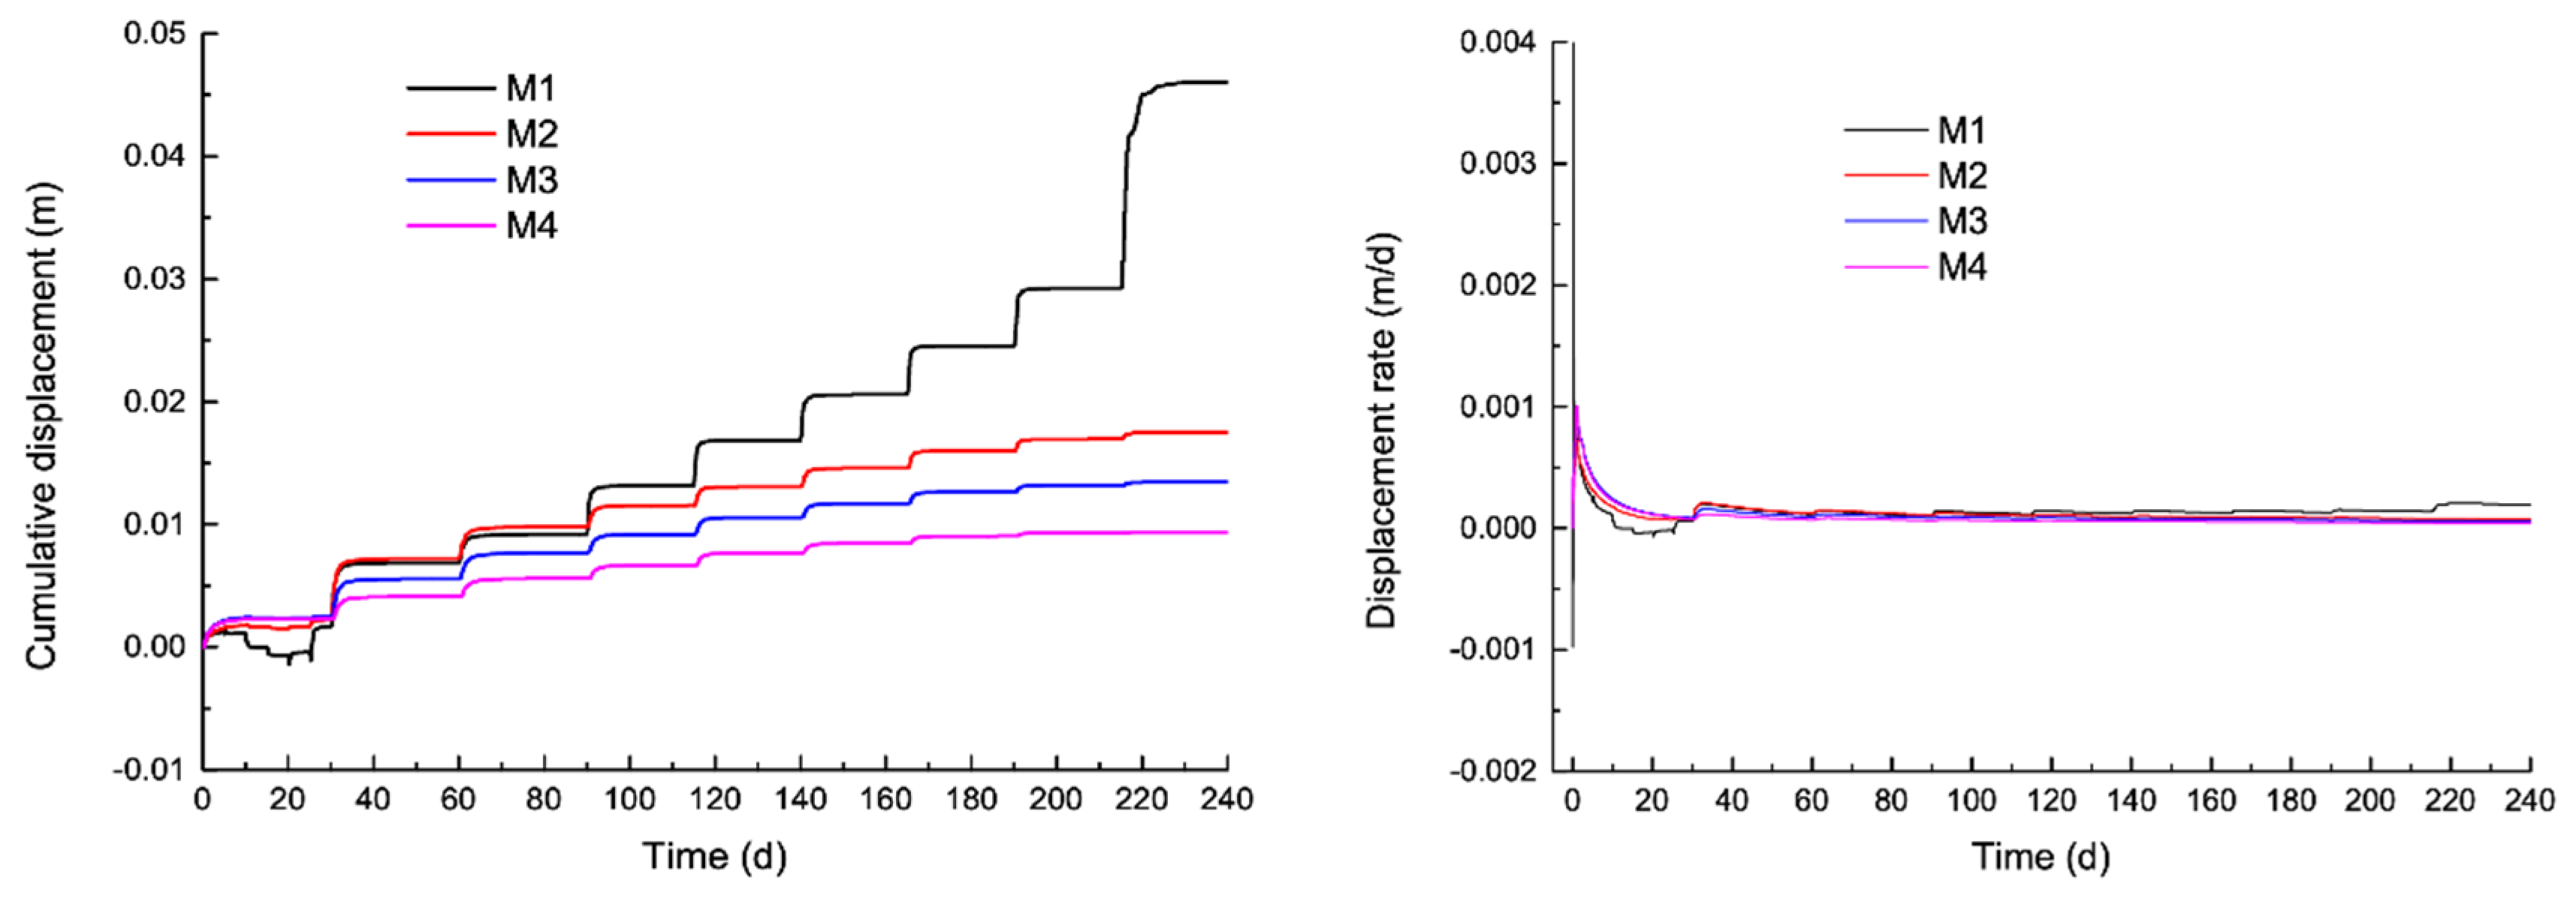
- As the reservoir water level decreases, the hydrodynamic pressure continues to increase. However, the increment of hydrodynamic pressure reduces in the meantime, leading to deformation developing at a deceasing creep speed. Therefore, the deformation curve of each monitoring point shows attenuation characteristics.
- (2)
- In the steady creep stage, the creep rate also has obvious spatial variability, similar to that of the short-term deformation characteristics, namely, higher creep speeds are found closer to the shear outlet of the landslide. The creep speeds are 0.29, 0.087, 0.071 and 0.054 mm/d in descending order corresponding to M1~M4. The total displacement of M1~M4 during the decline in the reservoir water level is 43.56, 13.05, 10.69 and 8.12 mm, respectively.
- (3)
- By comparing the results of numerical modeling with in situ monitoring data, the displacement is found to be consistent at the same order of magnitude. The displacement rates of M1, M2, and M4 are compared with those of G2, G7, and G18 in practice (from January to June 2007), and the mean bias between them is approximately 3.4%, 5.1%, and 0.6%, respectively. Although the deformation rate calculated from numerical modeling is consistent with that obtained from in situ monitoring, the bias between the displacement values is distinctively large. This finding occurs because some preventive treatments were carried out at the toe of the landslide, thus slowing deformation and improving landslide stability. However, the deformation characteristics are reliable, and the results can be used for further analysis.
- (4)
- Since it takes a long time for the adjustment of seepage field and stress during the drawdown of reservoir water level, landslide deformation usually lags behind the change in reservoir water level, and the hysteresis time is approximately 30 days according to in situ monitoring data. As the underground water table in numerical modeling is imported from the computation result of the previous simulation, the stress adjustment time is thus shortened to 0.5 days.
3.3. Deformation Mechanism
- (1)
- After the initial stress equilibrium is completed, the reservoir water level quickly rises at a speed of 1 m/d and causes uplift pressure at the toe of the landslide until the water level reaches 150 m. In addition, the mechanical strength of the geomaterial in this area is softened by water saturation. The combined effect of uplift pressure and water softening reduces the weight of the slip mass at the toe of the landslide, thus lowering its sliding resistance force. Thus, deformation in this stage is mainly observed at the upper part and central part of the landslide and develops in the sliding direction.
- (2)
- With the sustaining rise in the reservoir water level, the slide body suffers the hydrostatic pressure generated by the pressure difference between the reservoir water level and the underground water table of the slide body, which improves the sliding resistance force and leads to an obvious deformation rebound at the frontal part and central part of the slip mass. Landslide deformation in this stage develops slowly at the upper part of the slip mass, but the overall stability is improved.
- (3)
- When the reservoir water level rises to 170 m, the pore water pressure adjustment is almost complete, and deformation is observed near the upper shear outlet of the landslide. Afterwards, deformation develops from the upper part to the frontal part and as the reservoir water level increases to 175 m.
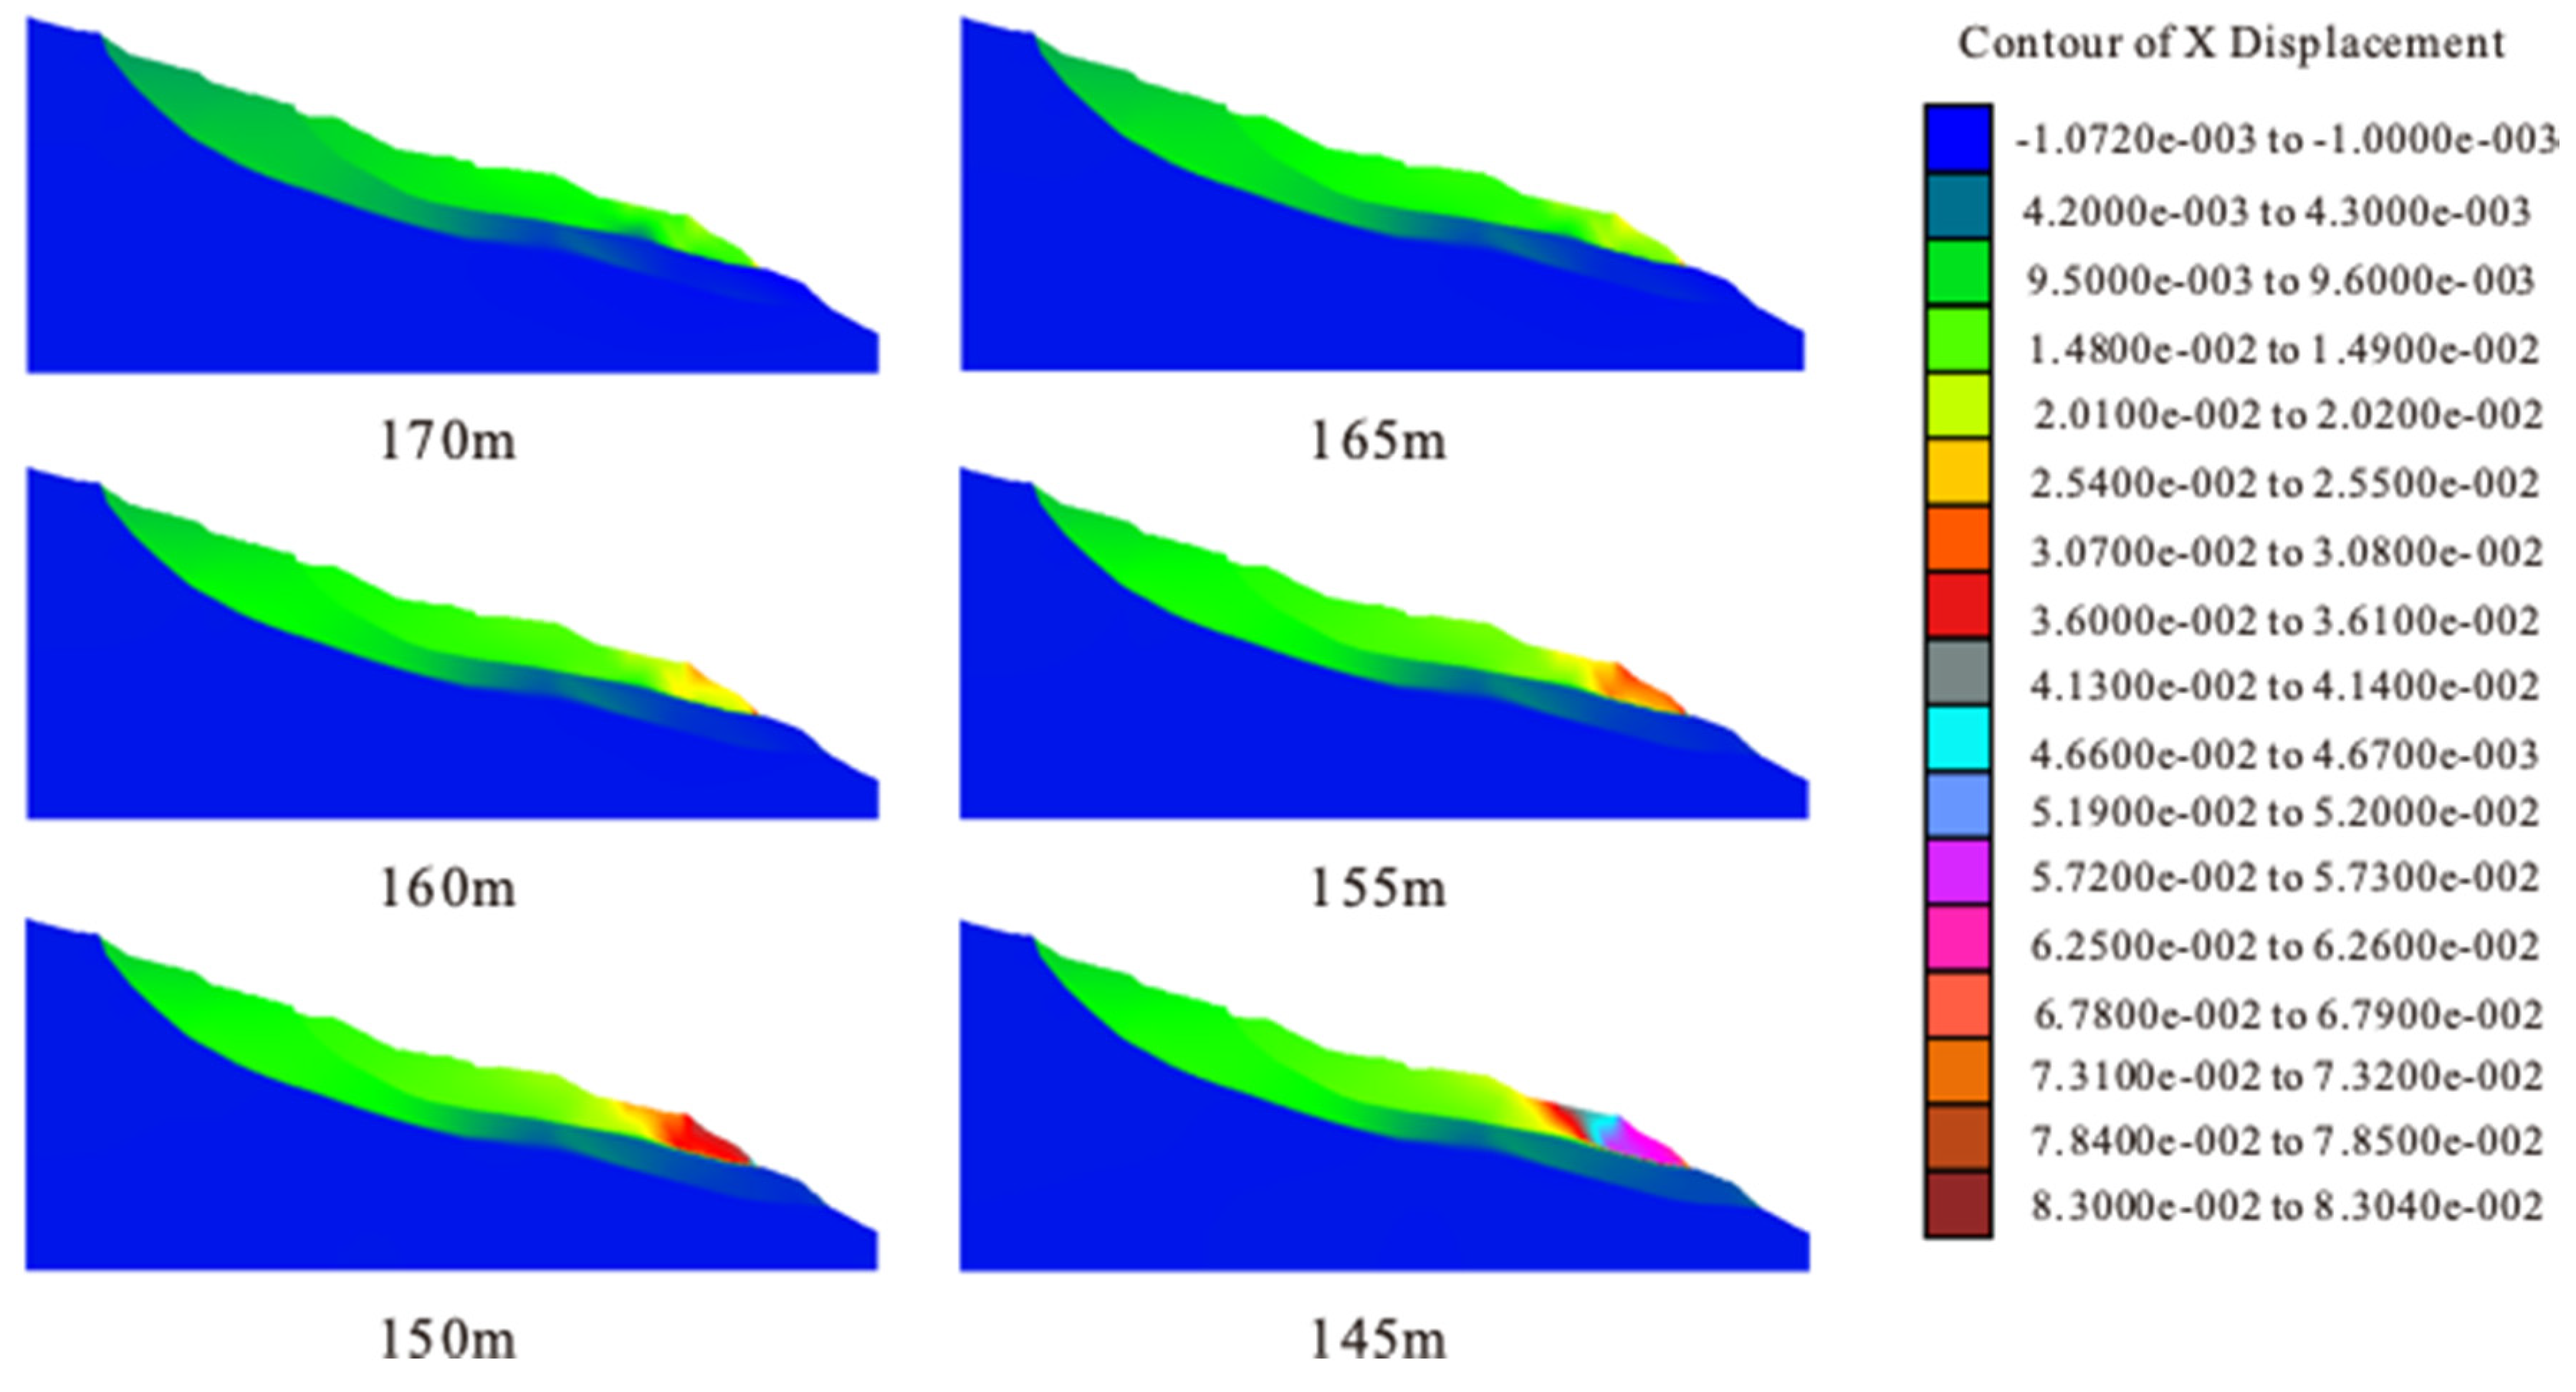
- (4)
- During the declining stage of the reservoir water level, the largest deformation is still concentrated near the upper shear outlet and increases to 57.3 mm when the water level decreases to 145 m. The investigated landslide is characterized by a retrogressive landslide, and the deformation mechanism is closely related to the fluctuation in the reservoir water level.
4. Discussion
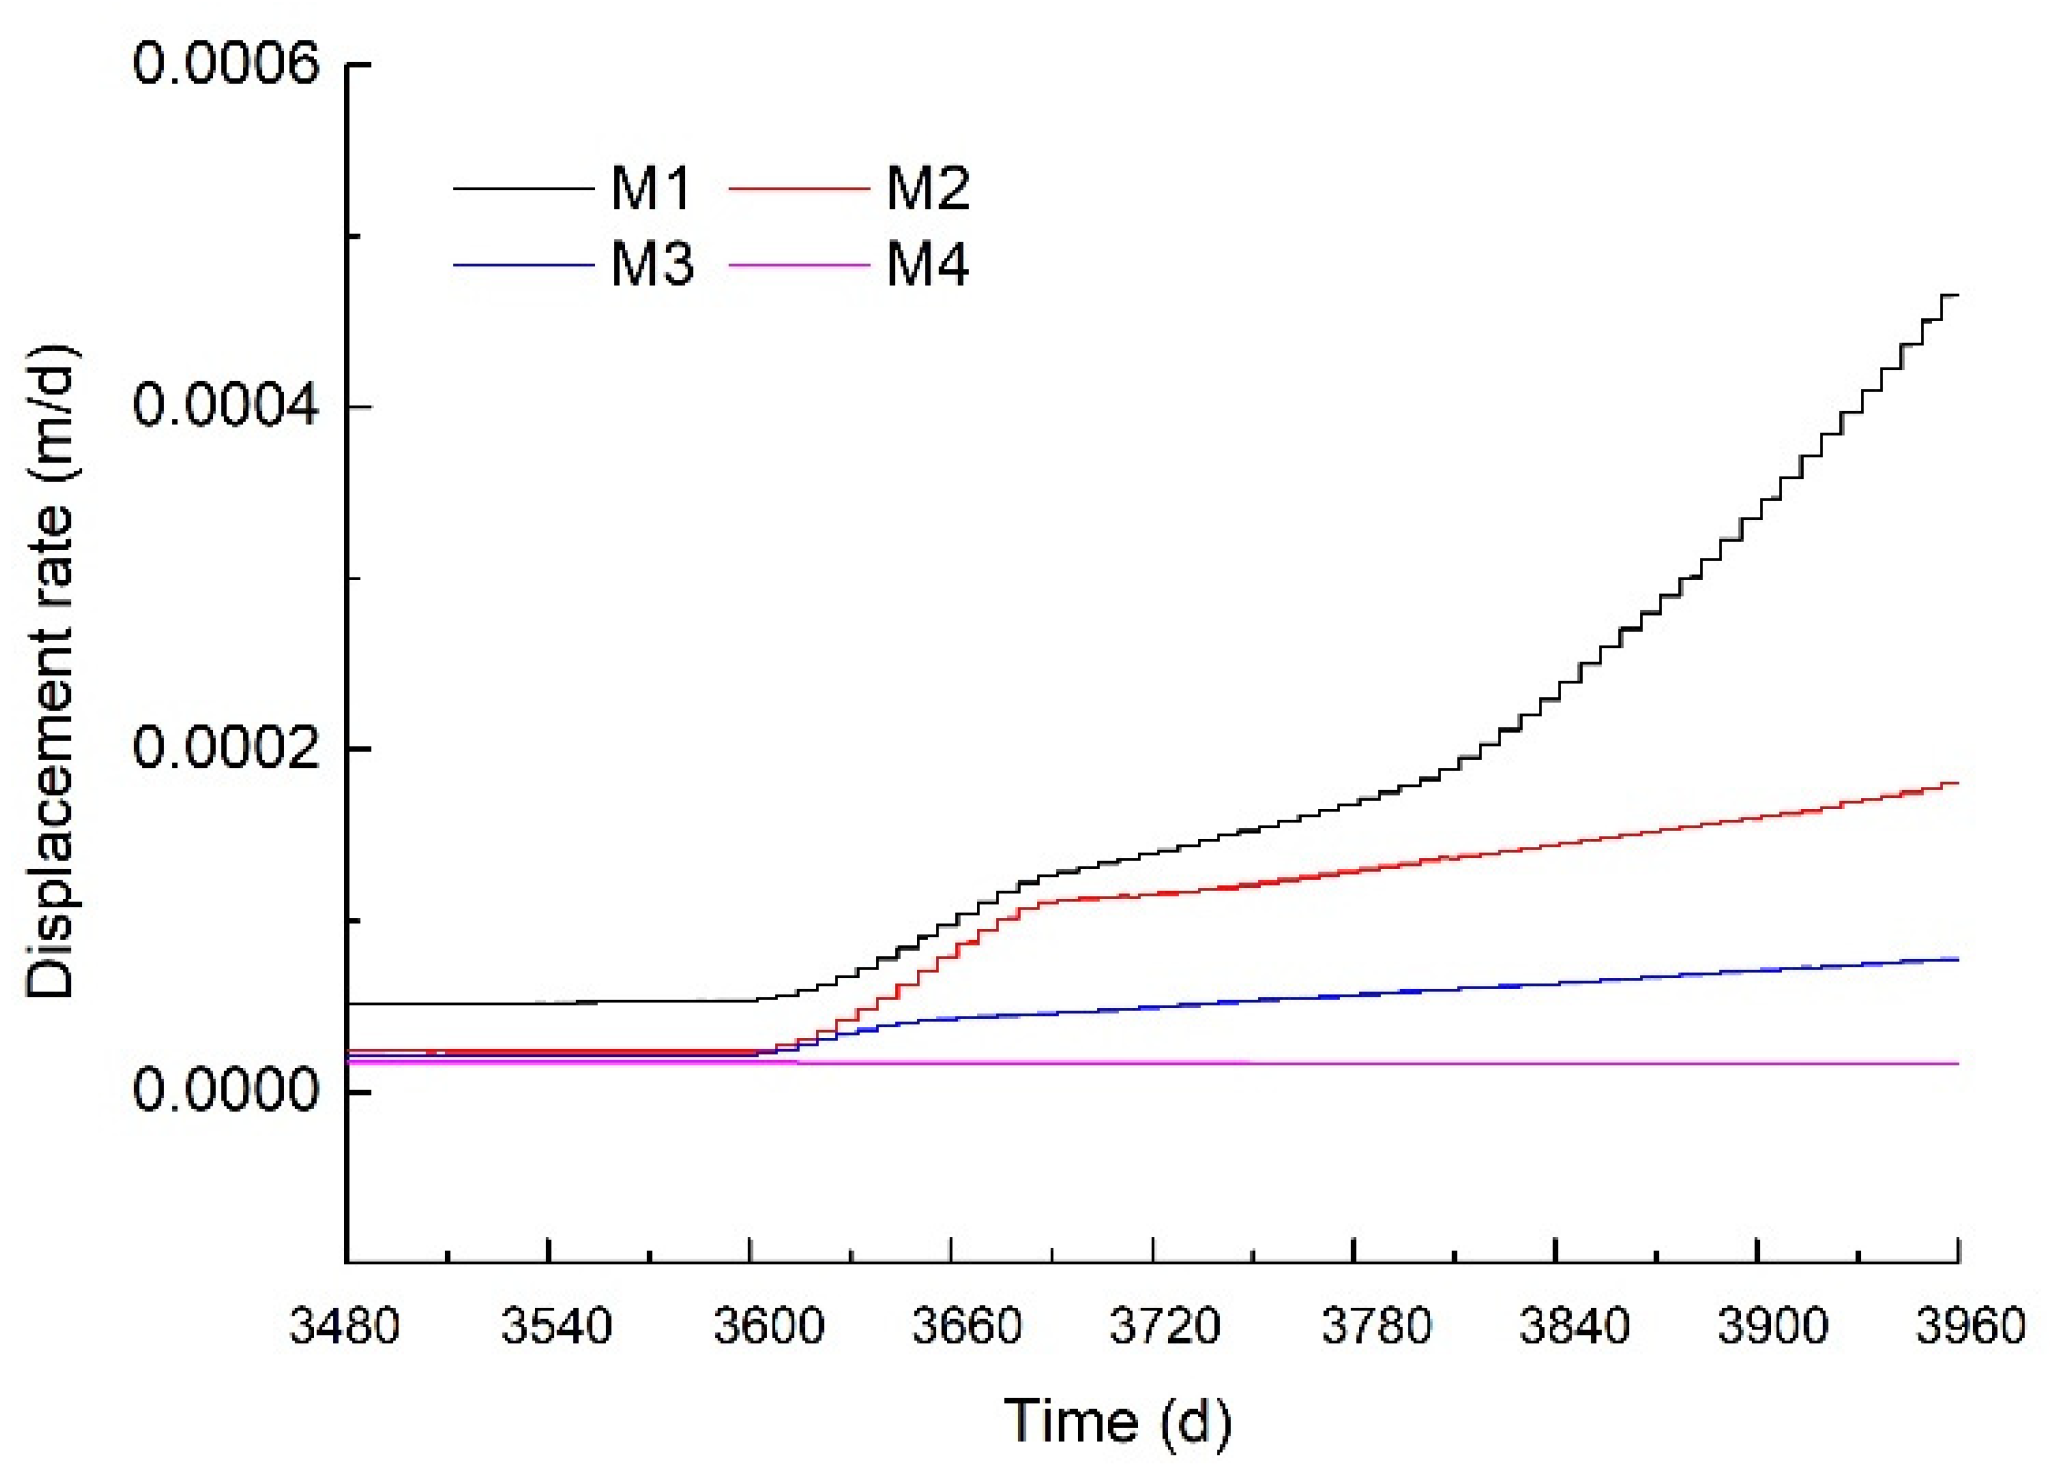
- (1)
- Slow acceleration creep stage. During the decline in the reservoir water level, the creep deformation increases slowly at a constant creep acceleration, reflected by the linear creep rate in Figure A17. For every 5 m decline in the reservoir water level, the increase in the creep rates of M1~M4 are 0.051, 0.024, 0.021, and 0.017 mm/d, respectively.
- (2)
- Fast acceleration creep stage. With the continuous drawdown of the reservoir water level, the creep acceleration increases in a nonlinear relationship with time, as well as the creep rate. The ultimate increase in creep rate in this stage for M1~M4 is approximately 0.161, 0.125, 0.055, and 0.017 mm/d, respectively.
- (3)
- Rapid acceleration creep stage. As indicated by Figure A17, a noteworthy inflection point is observed at the displacement–time curve, which means that the investigated landslide begins to fail at this moment. The frontal part starts to fail first, followed by the central part and upper part almost simultaneously. The creep rates of M1~M4 at this stage are approximately 0.478, 0.185, 0.078, and 0.016 mm/d, respectively.
5. Conclusions
- (1)
- Generally, the change in seepage lines always lags behind the fluctuation of the reservoir water level due to the low permeability of the geotechnical material. When the reservoir water level rises, the underground water seepage is replenished in the landslide, and the seepage line is mainly in a concave shape and inclines to a slope. While the underground water creates an outward discharge to the reservoir water when the reservoir water level declines, the seepage line is characterized by a convex shape and inclines to the Yangtze River.
- (2)
- The evolution process of the investigated landslide is characterized by four stages, an instantaneous elasto-plasticity deformation generated at the shear outlet of the landslide due to the unloading effect caused by the decline in the reservoir water level. Then, stress adjustment occurs in the landslide, resulting in predominant deformation in the slip mass. As the reservoir water level continuously declines, the overall deformation of the landslide is mainly controlled by the slip zone, and creep deformation gradually develops from the slip zone to the ground surface. Finally, deformation develops at a constant speed under the rheological effect of slip zone soil after the completion of stress adjustment.
- (3)
- In practical terms, it takes a long time for the seepage field and stress to adjust during the decline in the reservoir water level. Landslide deformation usually lags behind the change in reservoir water level, and the hysteresis time is approximately 30 days according to in situ monitoring data. This result occurs because the underground water table in numerical modeling is imported from the computation result of the previous simulation, and the stress adjustment time is thus shortened to 0.5 days.
- (4)
- The investigated landslide is characterized by a retrogressive landslide, of which the deformation mechanism is closely related to the fluctuation of the reservoir water level. There is an obvious deformation rebound at the frontal part and middle of the slip mass during the rising stage of the reservoir water level. The sudden change in the displacement-time curve is selected as the failure criterion for the investigated landslide. The evolution process of the acceleration creep stage is divided into slow acceleration, fast acceleration, and rapid acceleration creep stages.
Author Contributions
Funding
Conflicts of Interest
Appendix A


| Sets | Particle Size Fractions (%) | Liquid Limit (LL) | Plasticity Index (Ip) | Particle Density (ρs) | Water Content (w) | Dry Density (ρd) | |||
|---|---|---|---|---|---|---|---|---|---|
| Gravel (>2 mm) | Sand (0.075~2 mm) | Silt (0.005~0.075 mm) | Clay (<0.005 mm) | % | / | g/cm3 | % | g/cm3 | |
| HD-1 | 29.7 | 21.7 | 28.3 | 20.3 | 28.9 | 12.0 | 2.73 | 10.1 | 2.07 |
| HD-2 | 35.9 | 19.2 | 26.5 | 18.4 | 28.2 | 11.5 | 2.73 | 9.7 | 2.07 |
| HD-3 | 38.7 | 18.9 | 24.7 | 17.7 | 26.9 | 11.2 | 2.73 | 9.6 | 2.06 |
| HD-4 | 39.1 | 13.1 | 28.5 | 19.3 | 28.4 | 11.9 | 2.73 | 9.9 | 2.07 |
| Mean value | 35.9 | 18.2 | 27.0 | 18.9 | 28.1 | 11.7 | 2.73 | 9.8 | 2.07 |
| Zone | Elasticity Modulus (MPa) | Poisson’s Ratio | Unit Weight (kN/m3) | Cohesion (kPa) | Friction Angle (°) | Saturated Infiltration Coefficient (m/d) | Porosity |
|---|---|---|---|---|---|---|---|
| Upper slip mass | 727.0 | 0.31 | 21.0 | 80.0 | 25.0 | 2.35 | 0.392 |
| Upper slip zone | 28.6 | 0.34 | 19.9 | 33.0 | 16.0 | 0.76 | 0.318 |
| Lower slip mass | 2100.0 | 0.29 | 23.0 | 90.0 | 24.0 | 1.88 | 0.325 |
| Lower slip zone | 36.8 | 0.35 | 21.3 | 12.0 | 26.4 | 0.24 | 0.2925 |
| Rear deposit mass | 727.0 | 0.31 | 21.0 | 80.0 | 25.0 | 2.35 | 0.392 |
| Bed rock | 36,740.0 | 0.26 | 26.0 | 380.0 | 44.0 | 0.01 | 0.01 |
References
- Muceku, Y.; Korini, O.; Kuriqi, A. Geotechnical analysis of hill’s slopes areas in heritage town of Berati, Albania. Period. Polytech. Civ. 2016, 60, 61–73. [Google Scholar] [CrossRef] [Green Version]
- Tiwari, B.; Ajmera, B.; Dhital, S. Characteristics of moderate to large scale landslides triggered by the Mw 7.8 2015 Gorkha earthquake and its aftershocks. Landslides 2017, 14, 1297–1318. [Google Scholar] [CrossRef]
- Tang, M.; Xu, Q.; Huang, R. Site monitoring of suction and temporary pore water pressure in an ancient landslide in the Three Gorges reservoir area, China. Environ. Earth Sci. 2015, 73, 5601–5609. [Google Scholar] [CrossRef]
- Yin, Y.; Huang, B.; Wang, W.; Wei, Y.; Ma, X.; Ma, F.; Zhao, C. Reservoir-induced landslides and risk control in Three Gorges Project on Yangtze River, China. J. Rock Mech. Geotech. Eng. 2016, 8, 577–595. [Google Scholar] [CrossRef] [Green Version]
- Li, S.; Xu, Q.; Tang, M.; Iqbal, J.; Liu, J.; Zhu, X.; Liu, F.; Zhu, D. Characterizing the spatial distribution and fundamental controls of landslides in the three gorges reservoir area, China. Bull. Eng. Geol. Environ. 2019, 78, 4275–4290. [Google Scholar] [CrossRef]
- Yin, Y.; Wang, H.; Gao, Y.; Li, X. Real-time monitoring and early warning of landslides at relocated Wushan Town, the Three Gorges Reservoir, China. Landslides 2010, 7, 339–349. [Google Scholar] [CrossRef]
- Du, J.; Yin, K.; Lacasse, S. Displacement prediction in colluvial landslides, Three Gorges Reservoir, China. Landslides 2013, 10, 203–218. [Google Scholar] [CrossRef]
- Huang, D.; Gu, D.; Song, Y.; Cen, D.; Zeng, B. Towards a complete understanding of the triggering mechanism of a large reactivated landslide in the Three Gorges. Reservoir. Eng. Geol. 2018, 238, 36–51. [Google Scholar] [CrossRef]
- Deng, Q.L.; Fu, M.; Ren, X.W. Precedent long-term gravitational deformation of large scale landslides in the Three Gorges reservoir area, China. Eng. Geol. 2017, 221, 170–183. [Google Scholar] [CrossRef]
- Li, S.L.; Xu, Q.; Tang, M.G.; Li, H.J.; Yang, H.; Wei, Y. Centrifuge modeling and the analysis of ancient landslides subjected to reservoir water level fluctuation. Sustanability 2020, 12, 2092. [Google Scholar] [CrossRef] [Green Version]
- Li, Y.R.; Mo, P. A unified landslide classification system for loess slopes: A critical review. Geomorphology 2019, 340, 67–83. [Google Scholar] [CrossRef]
- Marin, R.J.; Velásquez, M.F. Influence of hydraulic properties on physically modelling slope stability and the definition of rainfall thresholds for shallow landslides. Geomorphology 2020, 351, 106976. [Google Scholar] [CrossRef]
- Bhardwaj, A.; Wasson, R.J.; Ziegler, A.D.; Chow, W.T.L.; Sundriyal, Y.P. Characteristics of rain-induced landslides in the Indian Himalaya: A case study of the Mandakini Catchment during the 2013 flood. Geomorphology 2019, 330, 110–115. [Google Scholar] [CrossRef]
- Vassallo, R.; Grimaldi, G.M.; Di, M.C. Pore water pressures induced by historical rain series in a clayey landslide: 3D modelling. Landslides 2015, 12, 731–744. [Google Scholar] [CrossRef]
- Tang, H.M.; Li, C.D.; Hu, X.L. Deformation response of the Huangtupo landslide to rainfall and the changing levels of the Three Gorges Reservoir. Bull. Eng. Geol. Environ. 2014, 74, 933–942. [Google Scholar] [CrossRef]
- Tang, H.M.; Li, C.D.; Hu, X.L. Evolution characteristics of the Huangtupo landslide based on in situ tunneling and monitoring. Landslides 2015, 12, 511–521. [Google Scholar] [CrossRef]
- Huang, F.M.; Huang, J.S.; Jiang, S.H.; Zhou, C.B. Landslide displacement prediction based on multivariate chaotic model and extreme learning machine. Eng. Geol. 2017, 218, 173–186. [Google Scholar] [CrossRef]
- Xu, S.L.; Niu, R.Q. Displacement prediction of Baijiabao landslide based on empirical mode decomposition and long short-term memory neural network in the Three Gorges area, China. Comput. Geosci. 2018, 111, 87–96. [Google Scholar] [CrossRef]
- Salciarini, D.; Fanelli, G.; Tamagnini, C. A probabilistic model for rainfall-induced shallow landslide prediction at the regional scale. Landslides 2017, 14, 1731–1746. [Google Scholar] [CrossRef]
- Hou, F.; Lai, Y.M.; Liu, E.L.; Luo, H.W.; Liu, X.Y. A creep constitutive model for frozen soils with different contents of coarse grains. Cold Reg. Sci. Technol. 2018, 145, 119–126. [Google Scholar] [CrossRef]
- Tong, L.; Wang, Y.H. DEM simulations of shear modulus and damping ratio of sand with emphasis on the effects of particle number, particle shape, and aging. Acta Geotech. 2015, 10, 117–130. [Google Scholar] [CrossRef]
- Tsiggions, C.; Zeghal, M. A micromechanical analysis of the effects of particle shape and contact law on the low-strain stiffness of granular soils. Soil Dyn. Earthq. Eng. 2019, 125, 105693. [Google Scholar] [CrossRef]
- Enomoto, T. Effects of grading and particle characteristics on small strain properties of granular material. Soil Found. 2016, 56, 745–750. [Google Scholar] [CrossRef]
- Liu, X.Y.; Zou, D.G.; Liu, J.M. Experimental study to evaluate the effect of particle size on the small strain shear modulus of coarse-grained soils. Measurement 2020, 163, 107954. [Google Scholar] [CrossRef]
- Chang, D.; Lai, Y.M.; Gao, J.Q. An investigation on the constitutive response of frozen saline coarse sandy soil based on particle breakage and plastic shear mechanisms. Cold Reg. Sci. Technol. 2019, 159, 94–105. [Google Scholar] [CrossRef]
- Won, J.M.; Park, J.H.; Choo, H.W.; Burns, S. Estimation of saturated hydraulic conductivity of coarse-grained soils using particle shape and electrical resistivity. J. Appl. Geophys. 2019, 167, 19–25. [Google Scholar] [CrossRef]
- Wang, J.; Liu, F.Y.; Wang, P.; Cai, Y.Q. Particle size effects on coarse soil-geogrid interface response in cyclic and post-cyclic direct shear tests. Geotext. Geomembr. 2016, 44, 854–861. [Google Scholar] [CrossRef]
- Wang, S.; Wang, J.E.; Wu, W.; Cui, D.S. Creep properties of clastic soil in a reactivated slow-moving landslide in the Three Gorges Reservoir Region, China. Eng. Geol. 2020, 267, 105493. [Google Scholar] [CrossRef]
- Deng, Q.L.; Wang, X.P. Growth history of Huangtupo landslide: Down-slope overlapping-landsliding-modification. Earth Sci. J China Univ. Geosci. 2000, 25, 44–50. (In Chinese) [Google Scholar]
- Baiocchi, C.; Comincioli, V.; Magenes, E.; Pozzi, G.A. Free boundary problems in fluid flow through porous media: Existence and uniqueness theorems. Ann. Mat. Pur. Appl. 1973, 97, 1–82. [Google Scholar] [CrossRef]
- Li, C.; Tang, H.M.; Han, D.W. Exploration of the creep properties of undisturbed shear zone soil of the Huangtupo landslide. Bull. Eng. Geol. Environ. 2019, 78, 1237–1248. [Google Scholar] [CrossRef] [Green Version]
- Yuan, W.; Li, J.X.; Li, Z.H. A strength reduction method based on the Generalized Hoek–Brown (GHB) criterion for rock slope stability analysis. Comput. Geotech. 2020, 117, 103240. [Google Scholar]
© 2020 by the authors. Licensee MDPI, Basel, Switzerland. This article is an open access article distributed under the terms and conditions of the Creative Commons Attribution (CC BY) license (http://creativecommons.org/licenses/by/4.0/).
Share and Cite
Li, C.; Tang, H.; Wang, Y. Study on the Deformation Mechanism of Reservoir Landslides Considering Rheological Properties of the Slip Zone Soil: A Case Study in the Three Gorges Reservoir Region. Sustainability 2020, 12, 6427. https://doi.org/10.3390/su12166427
Li C, Tang H, Wang Y. Study on the Deformation Mechanism of Reservoir Landslides Considering Rheological Properties of the Slip Zone Soil: A Case Study in the Three Gorges Reservoir Region. Sustainability. 2020; 12(16):6427. https://doi.org/10.3390/su12166427
Chicago/Turabian StyleLi, Chun, Huiming Tang, and Yankun Wang. 2020. "Study on the Deformation Mechanism of Reservoir Landslides Considering Rheological Properties of the Slip Zone Soil: A Case Study in the Three Gorges Reservoir Region" Sustainability 12, no. 16: 6427. https://doi.org/10.3390/su12166427