Feasibility Analysis of Green Travel in Public Transportation: A Case Study of Wuhan

Abstract
:1. Introduction
1.1. Context
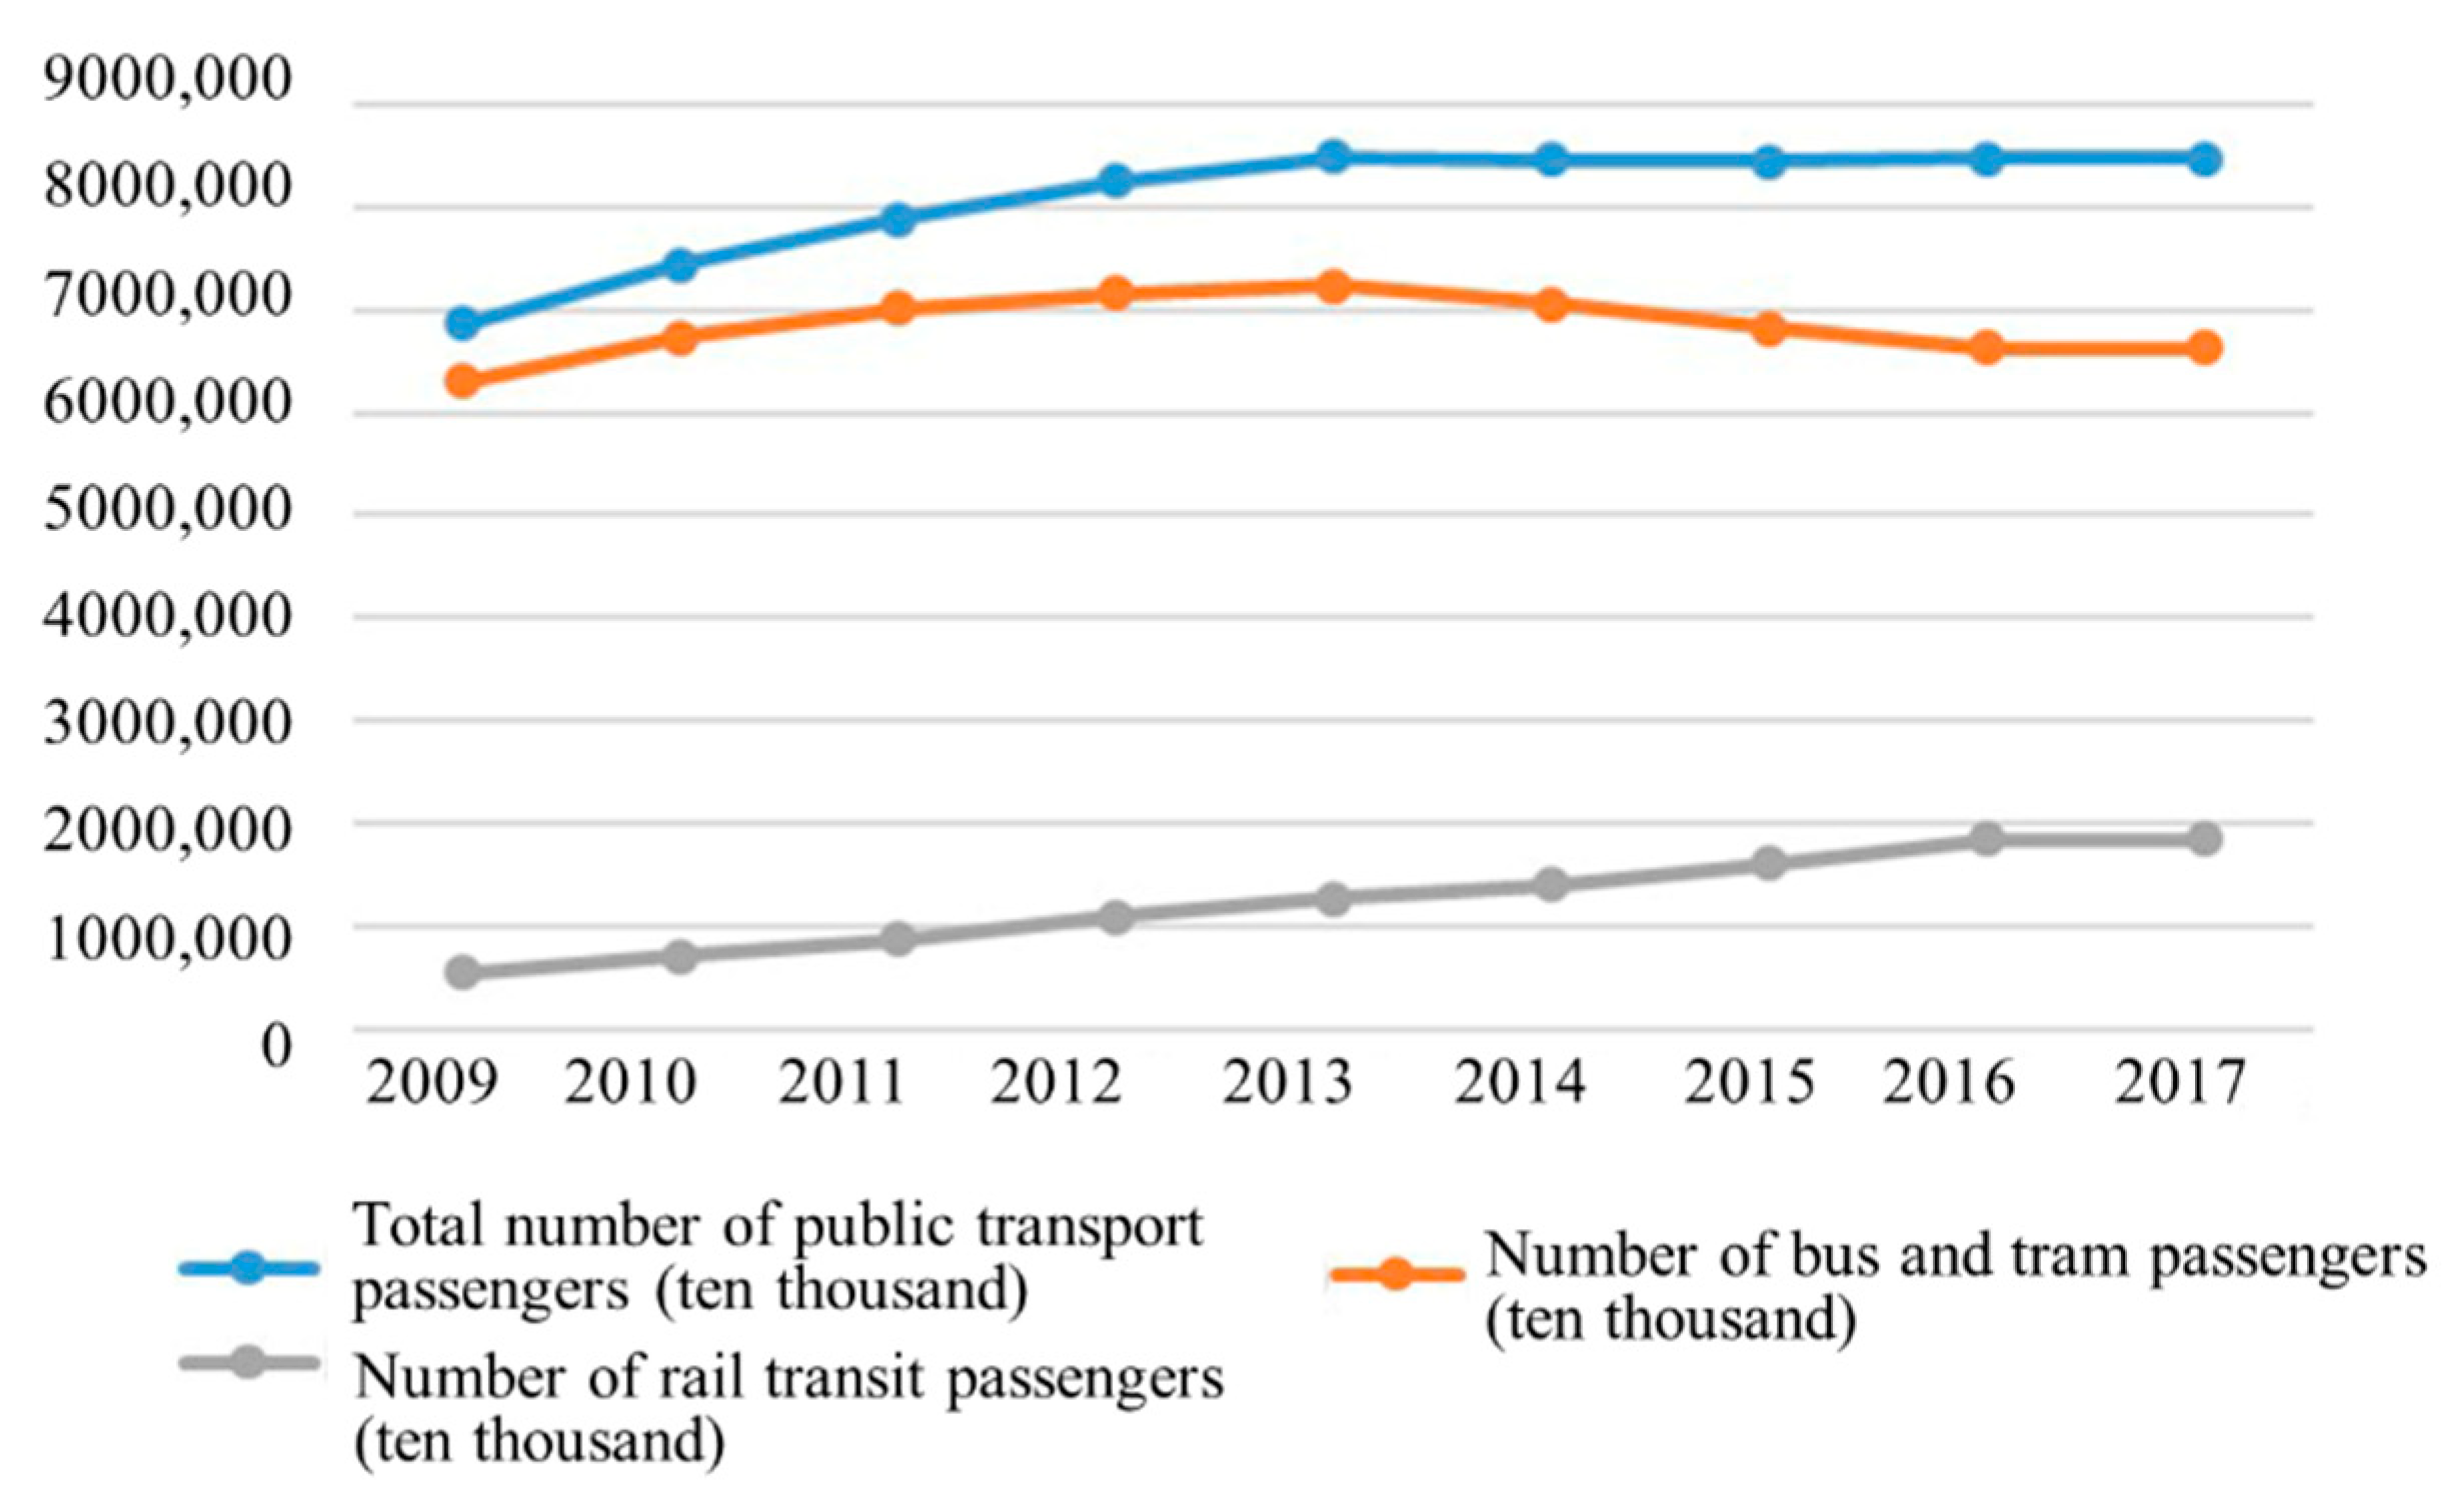
1.2. Overview of Wuhan City
2. Conceptual Model
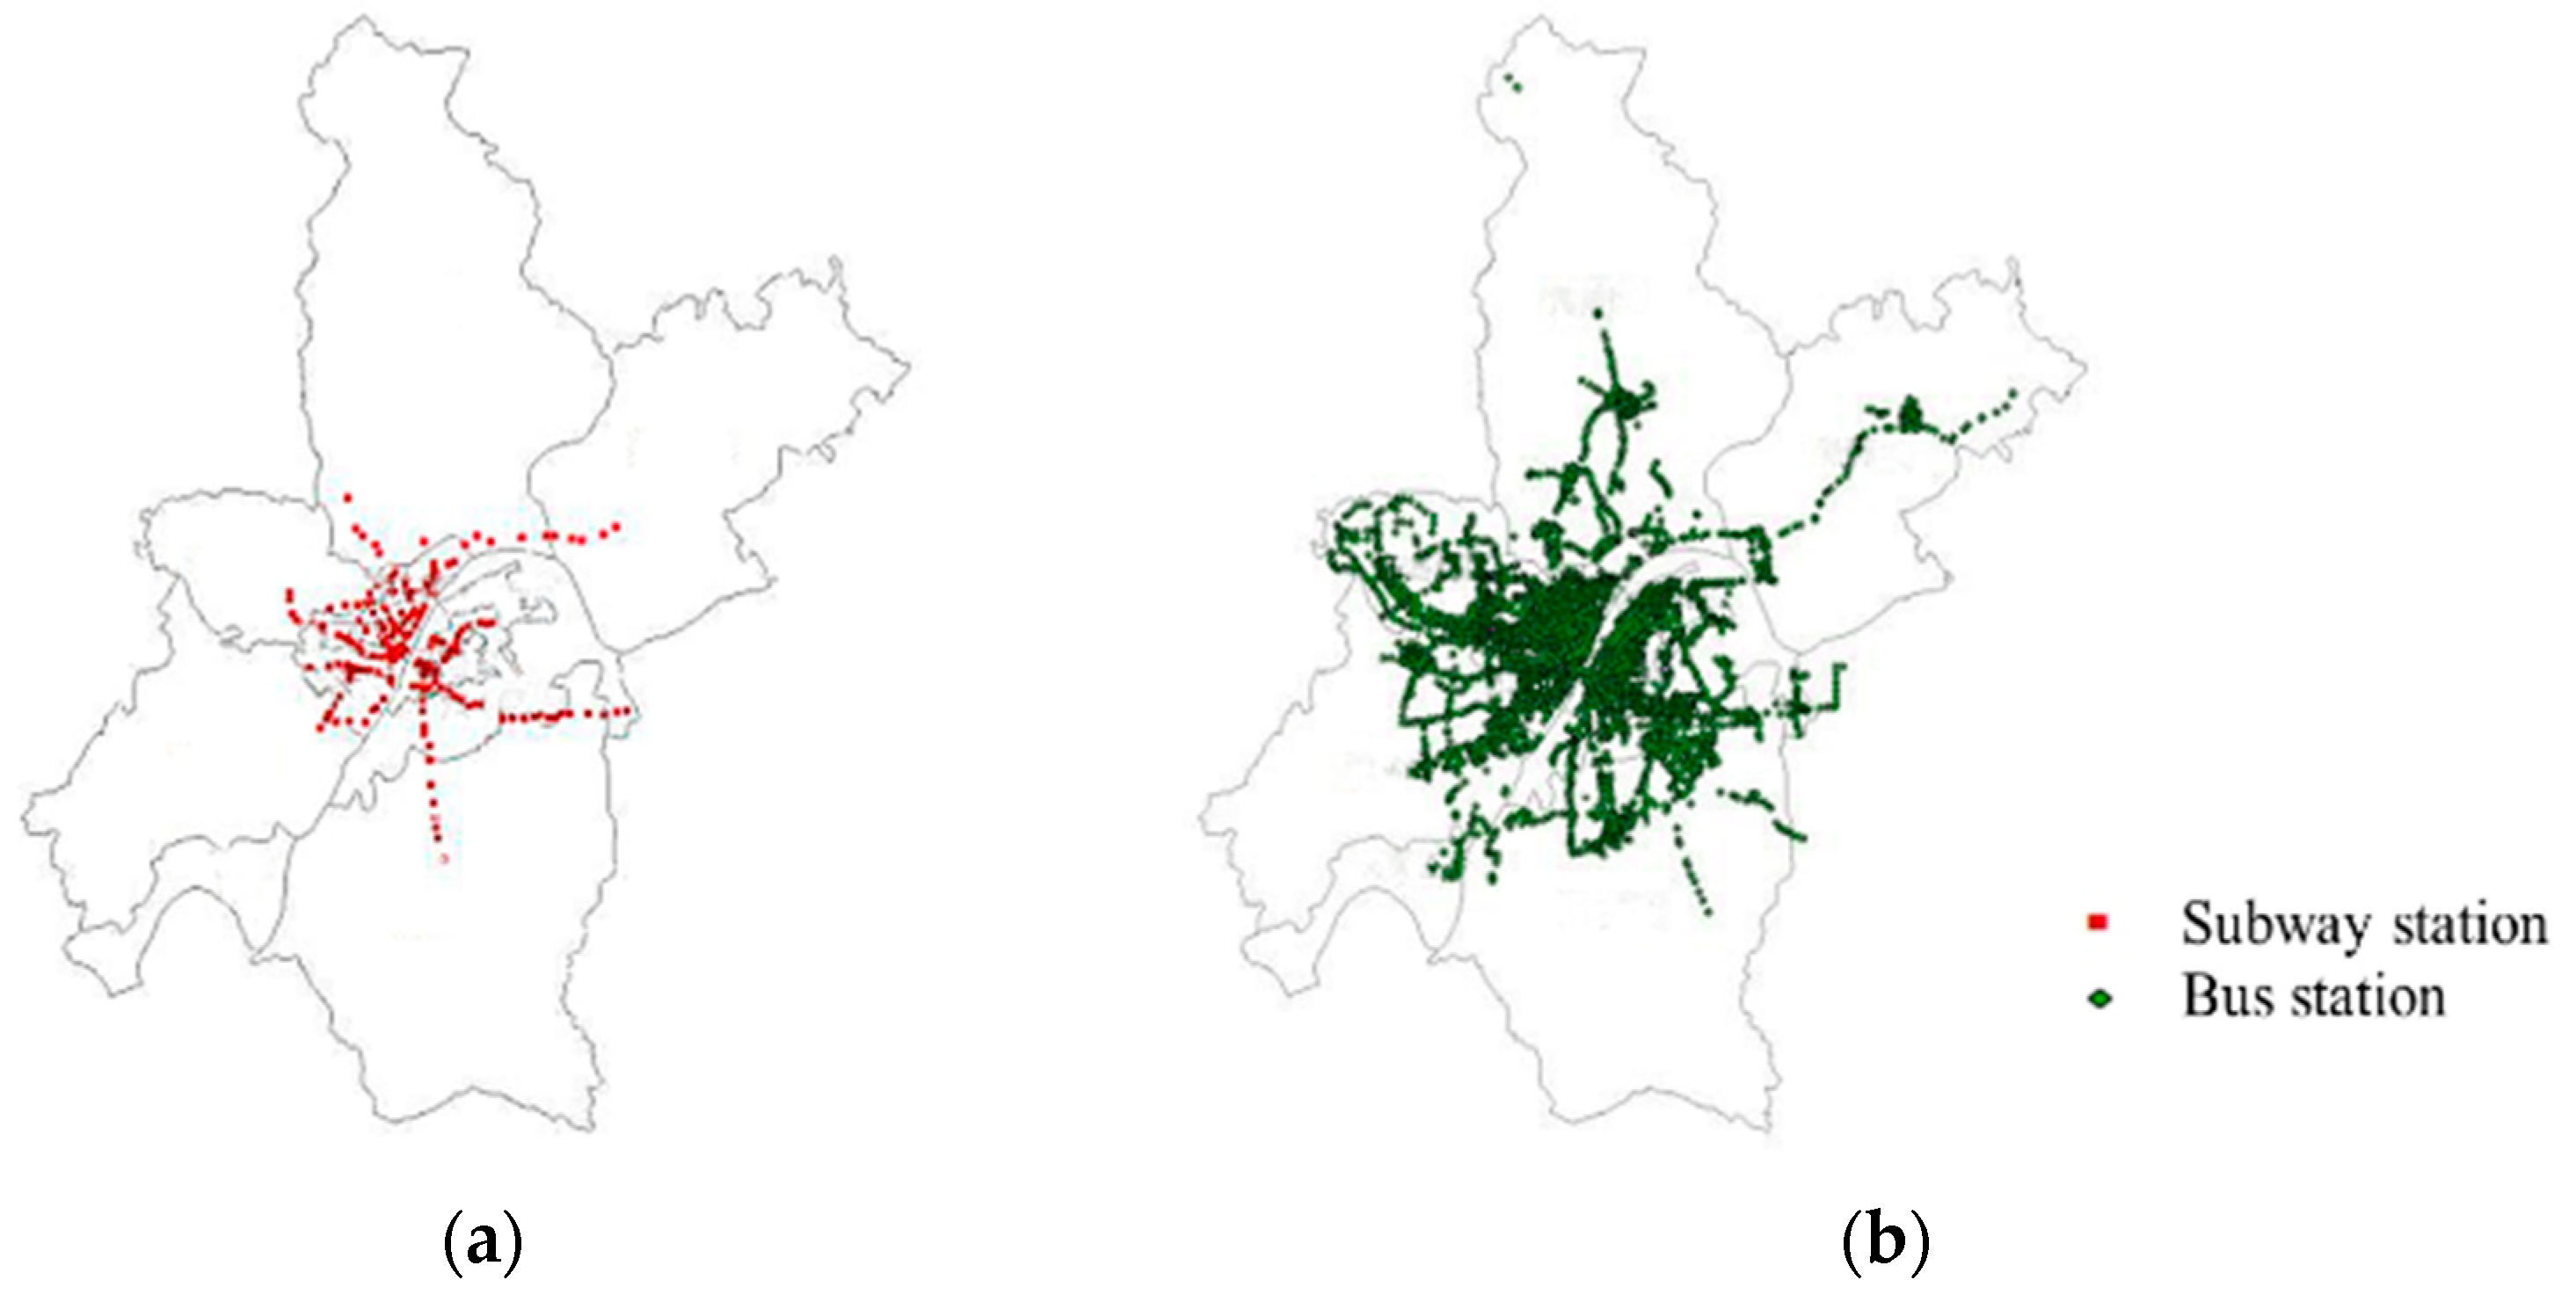
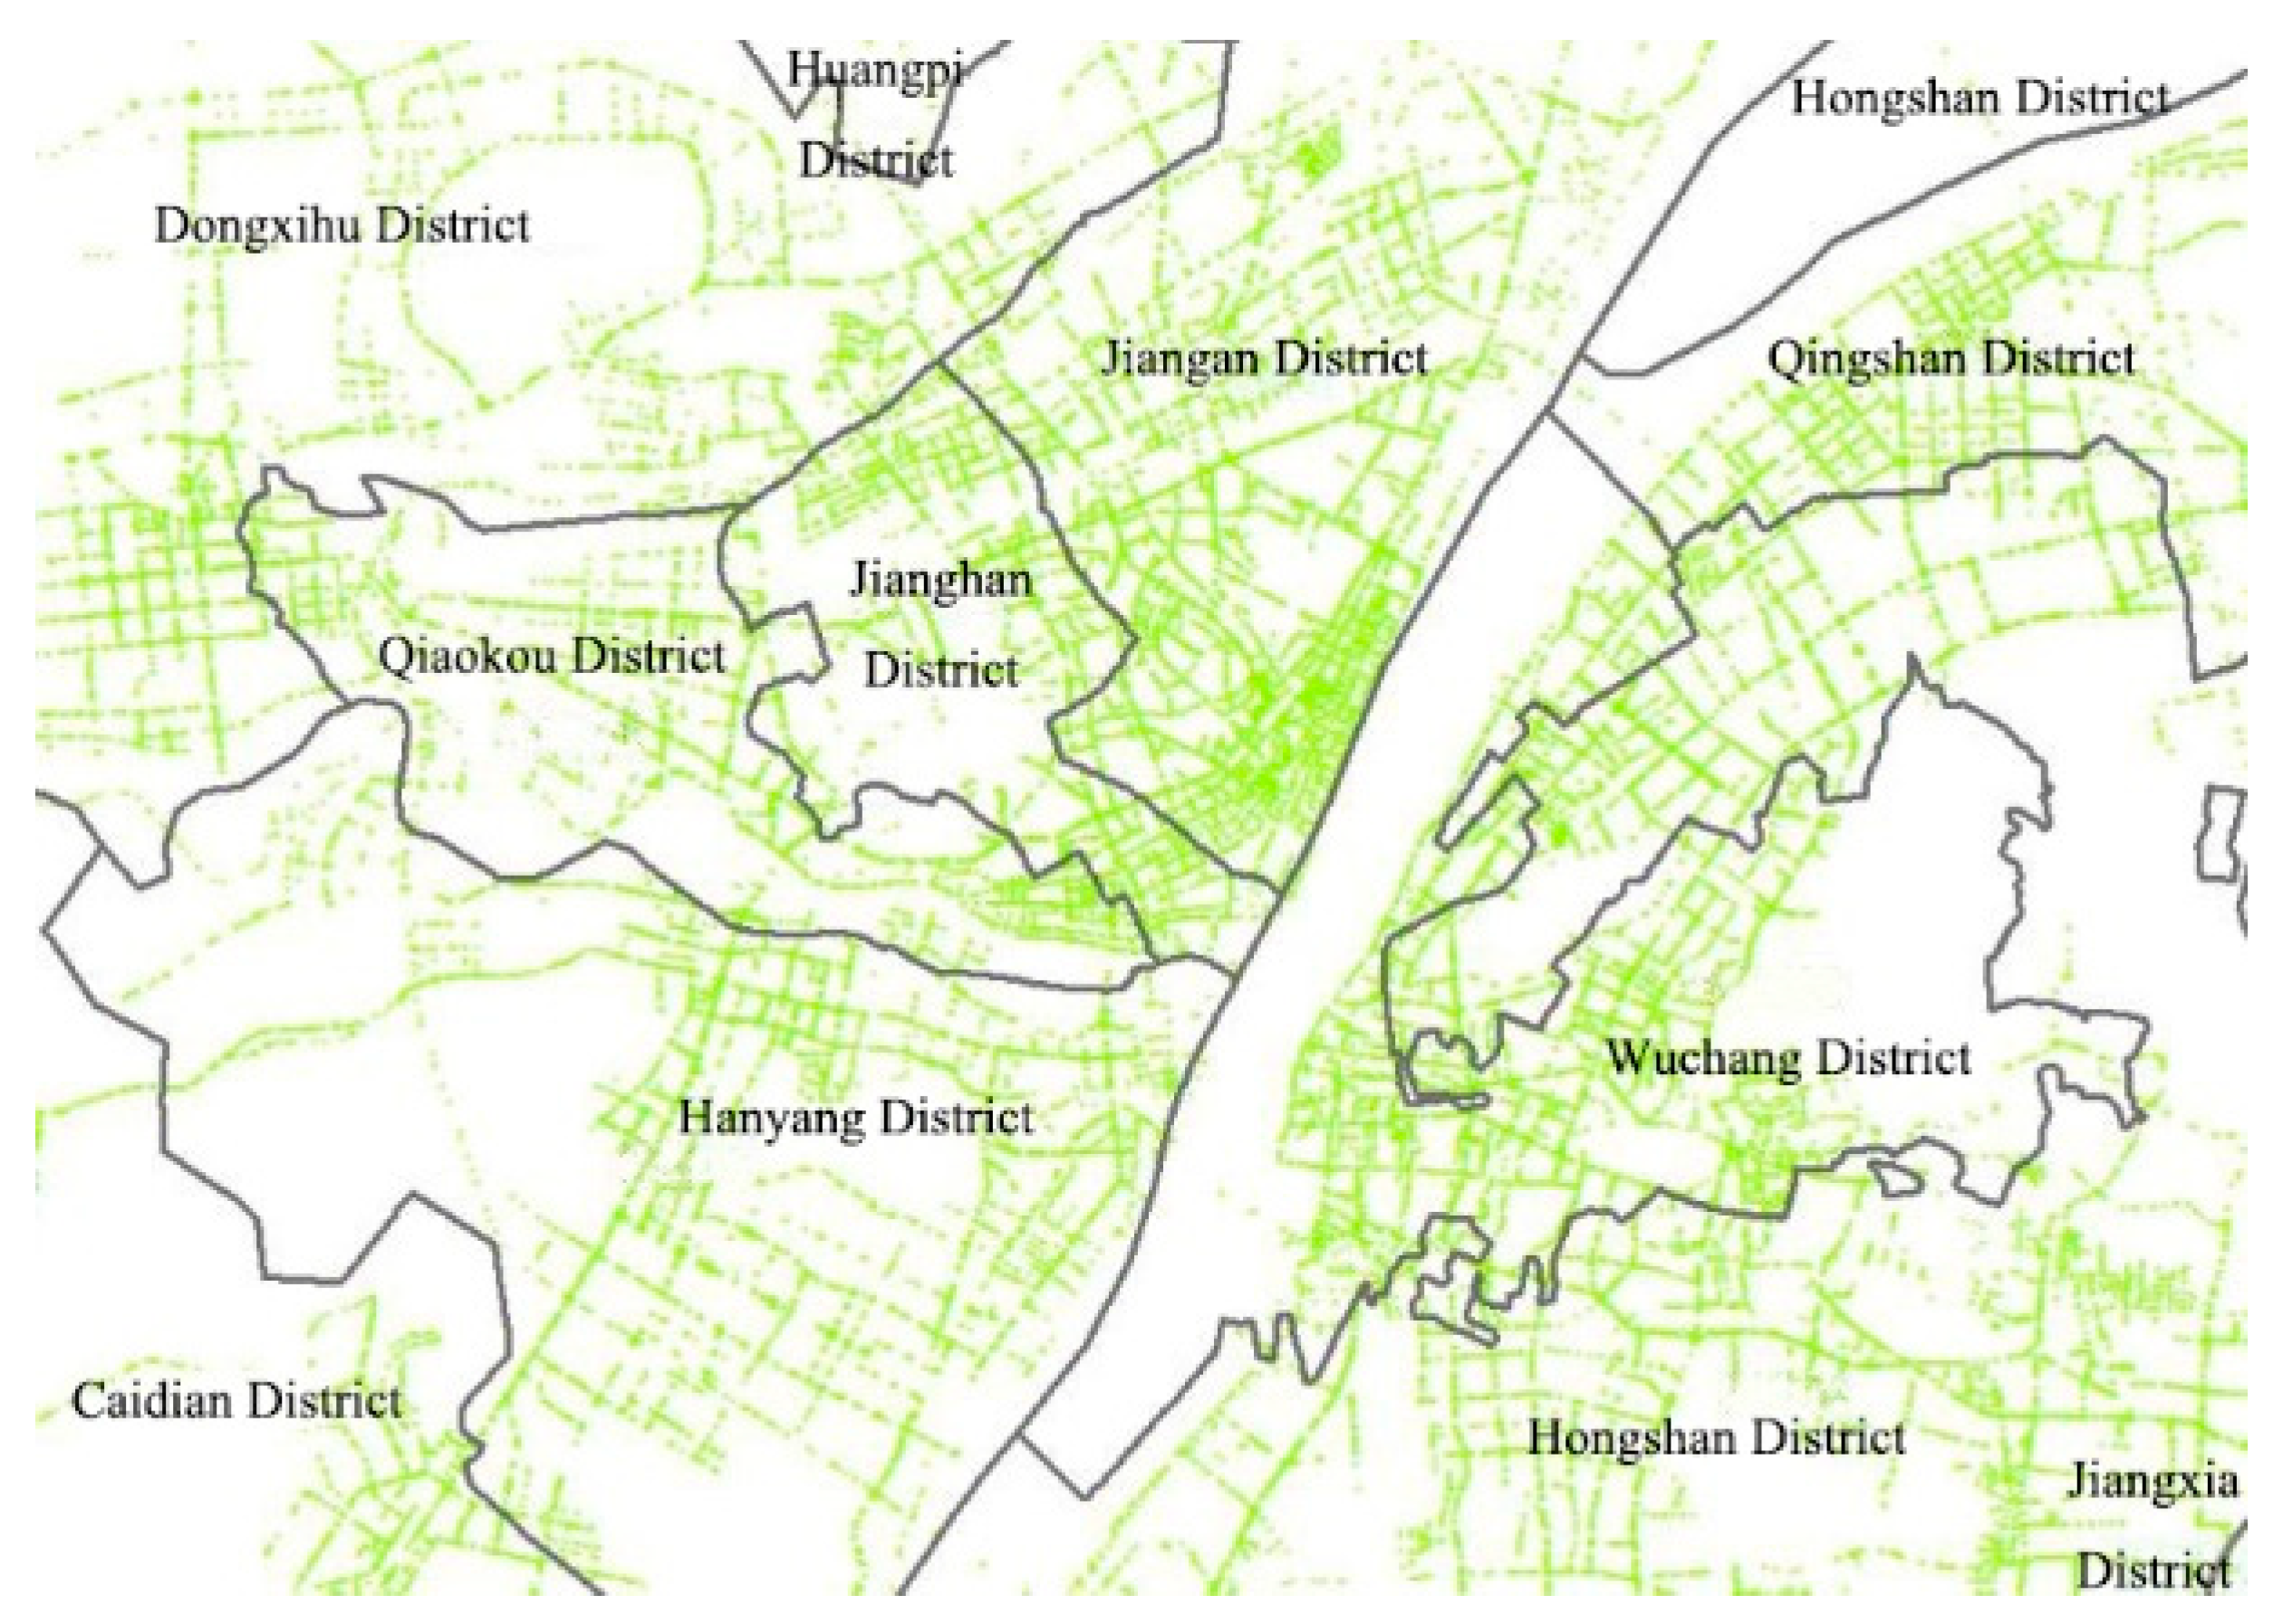
2.1. Network of Public Transportation by ArcGIS
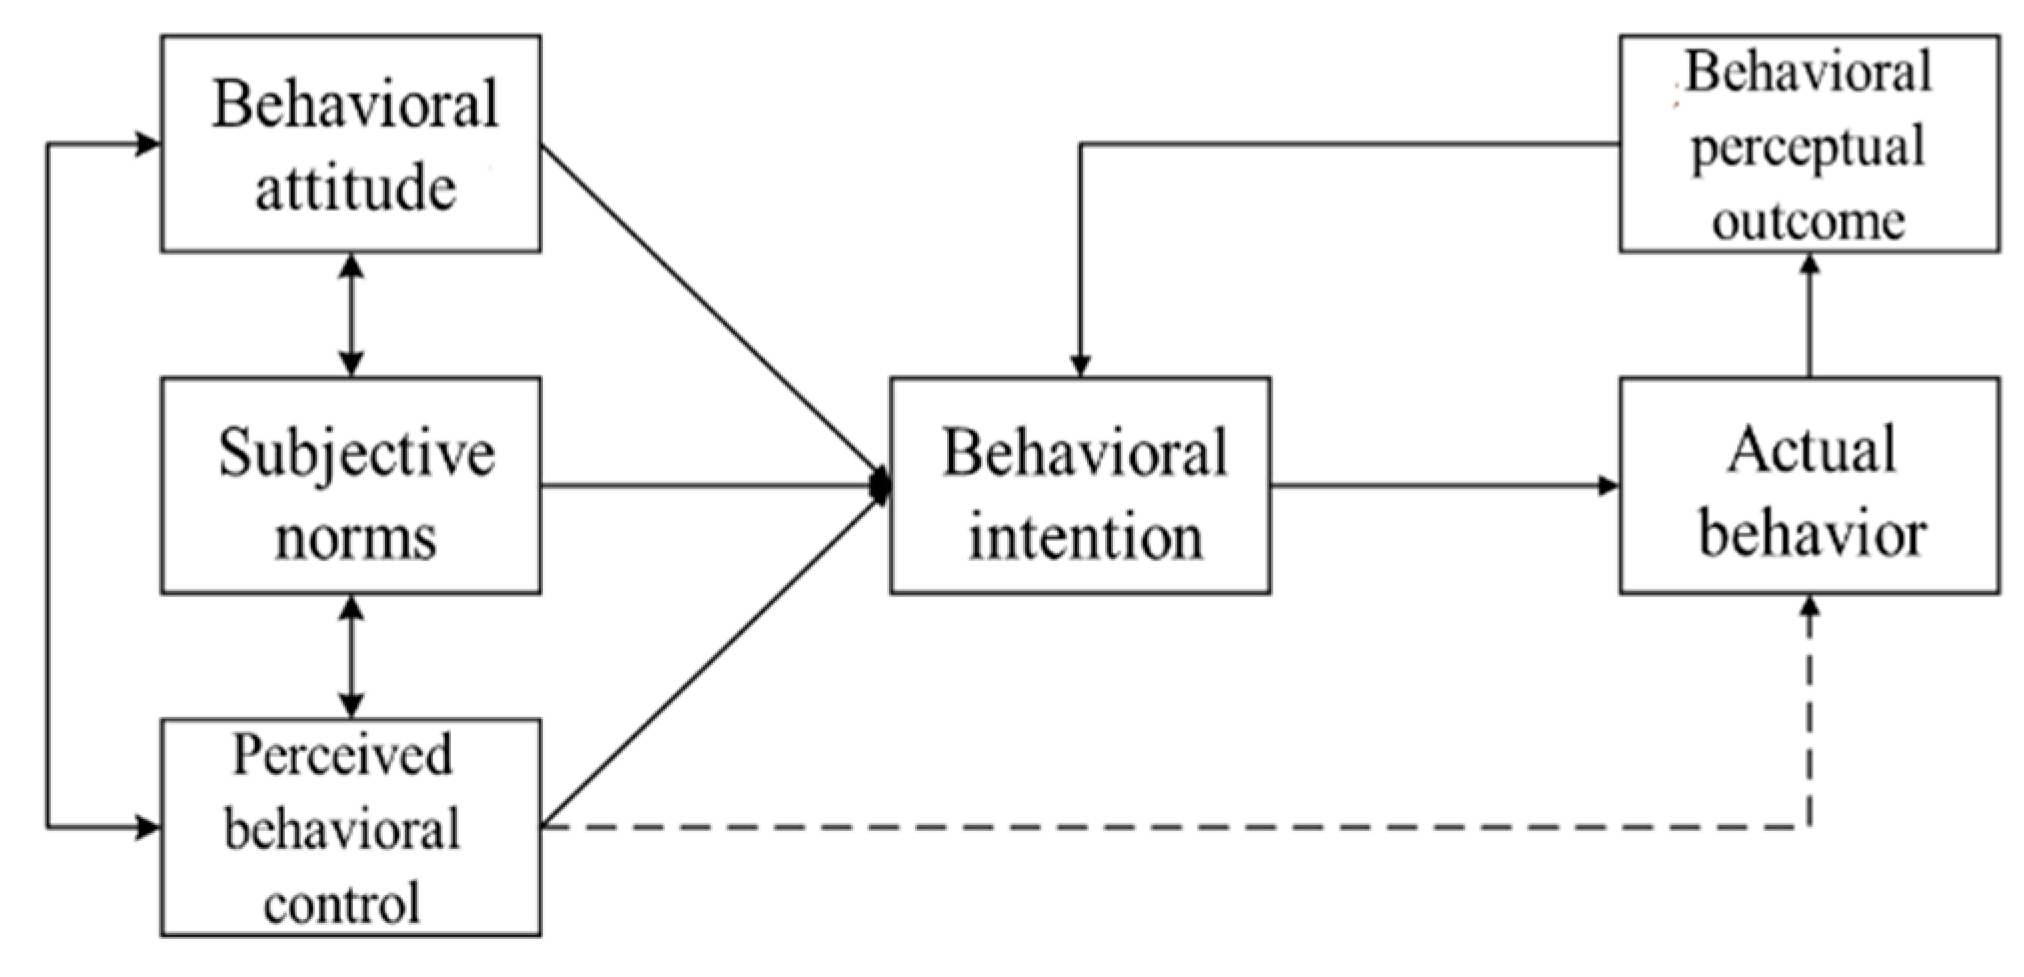
2.2. Extension of TPB
3. Data and Method
3.1. Data Sources
3.2. Method
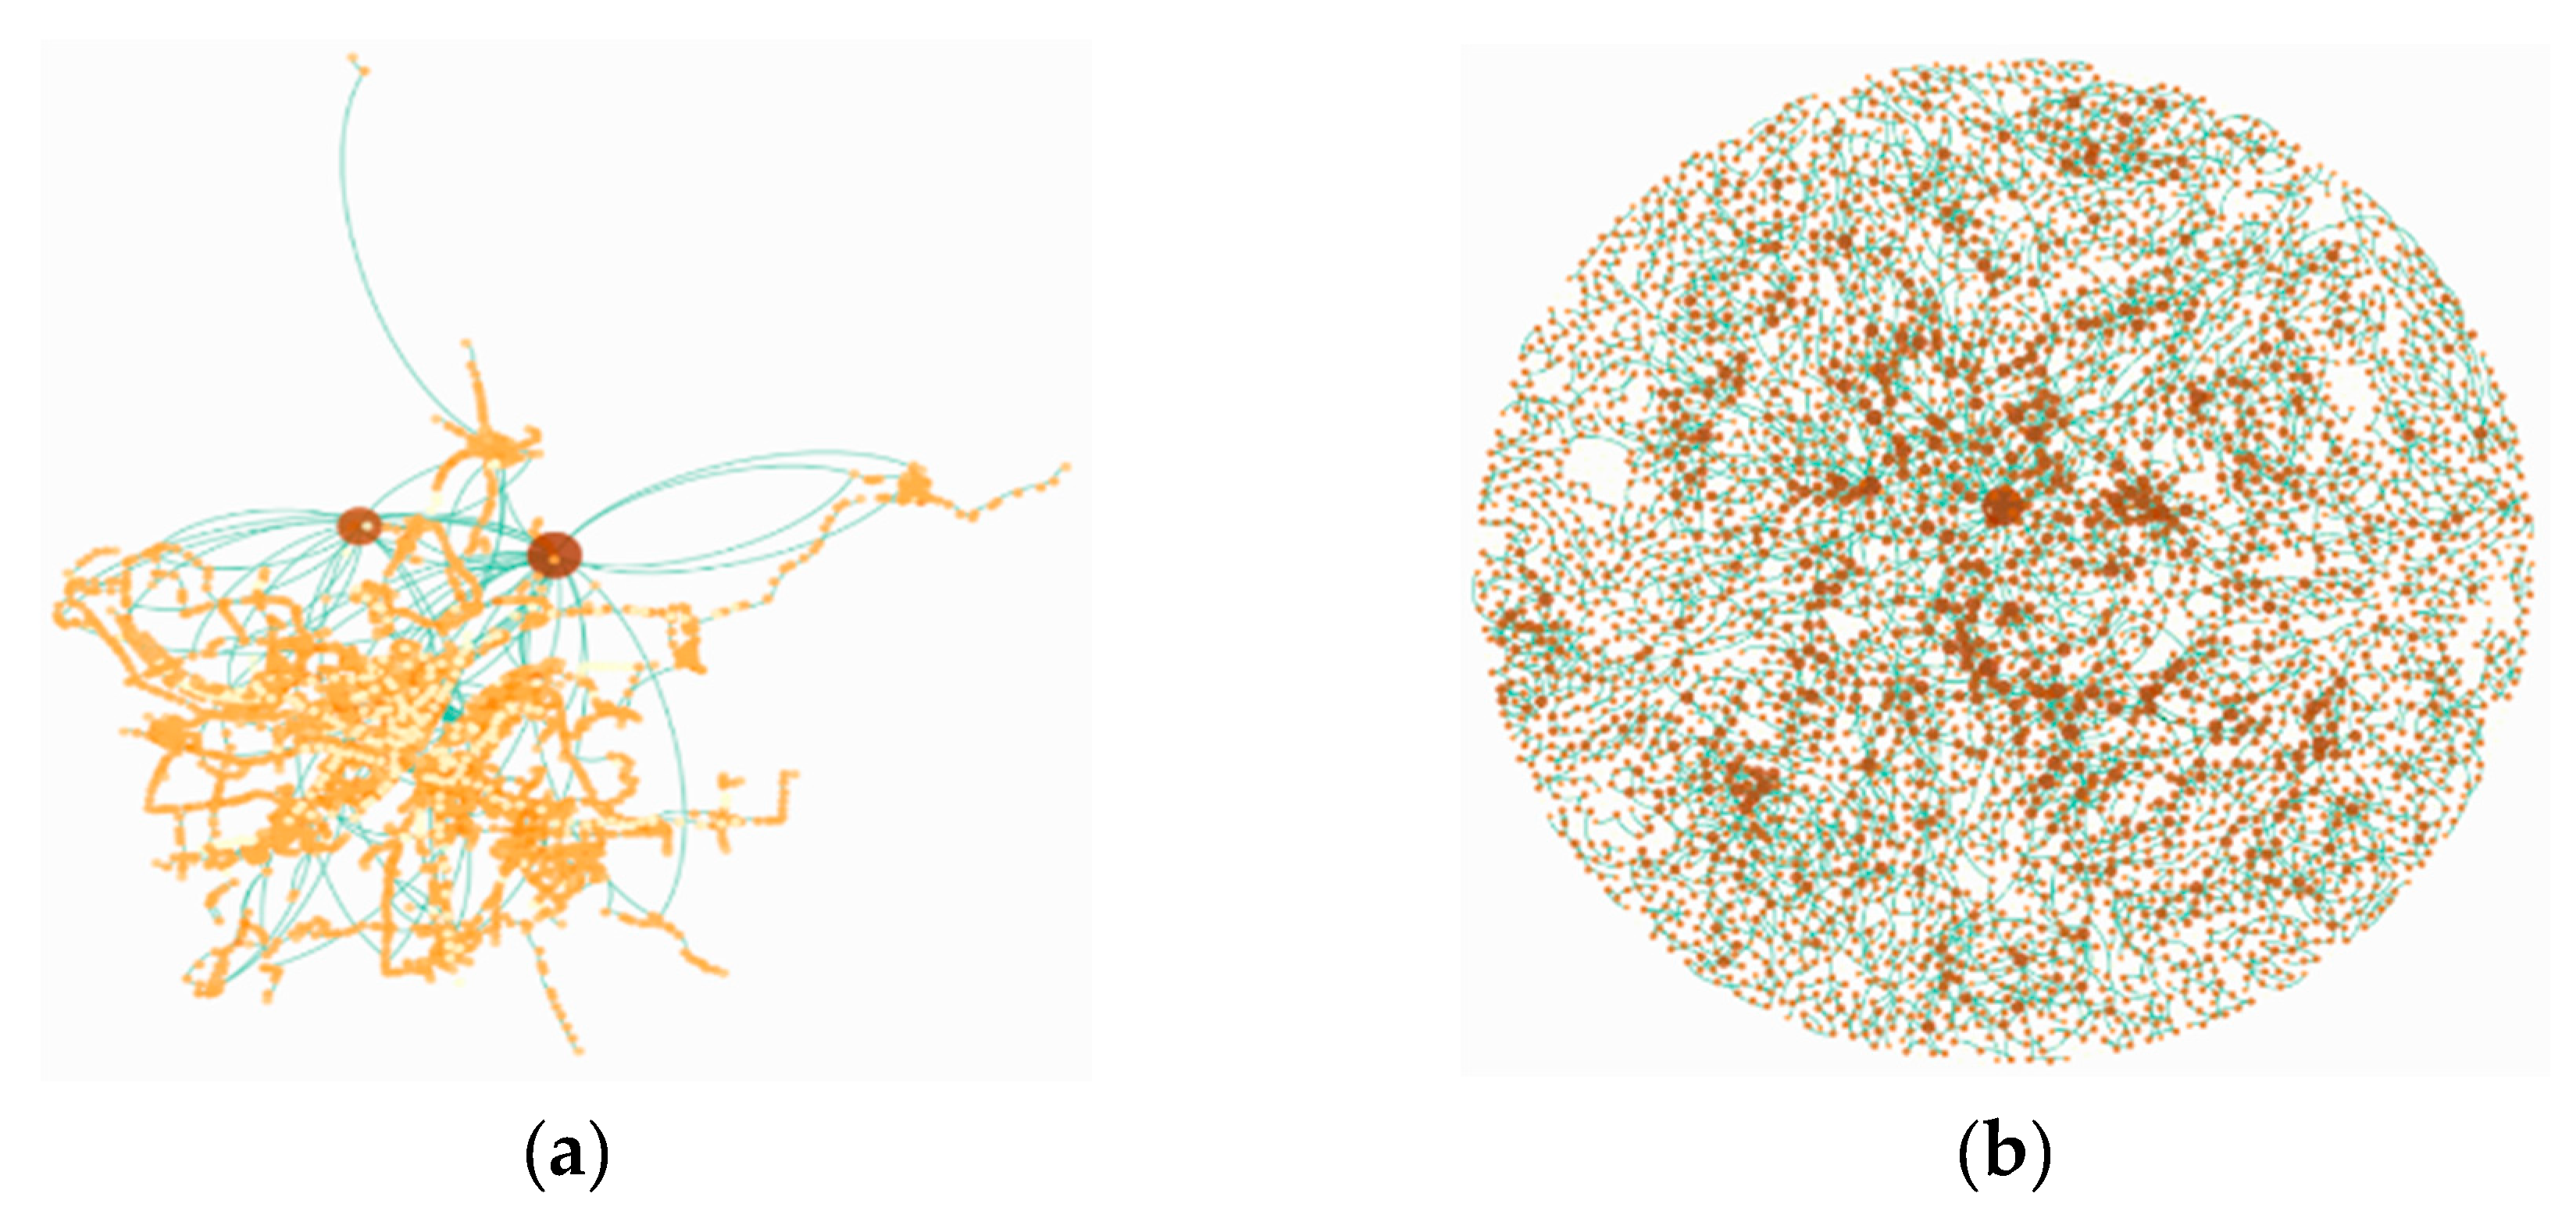
3.2.1. Complex Network Analysis of Public Transportation
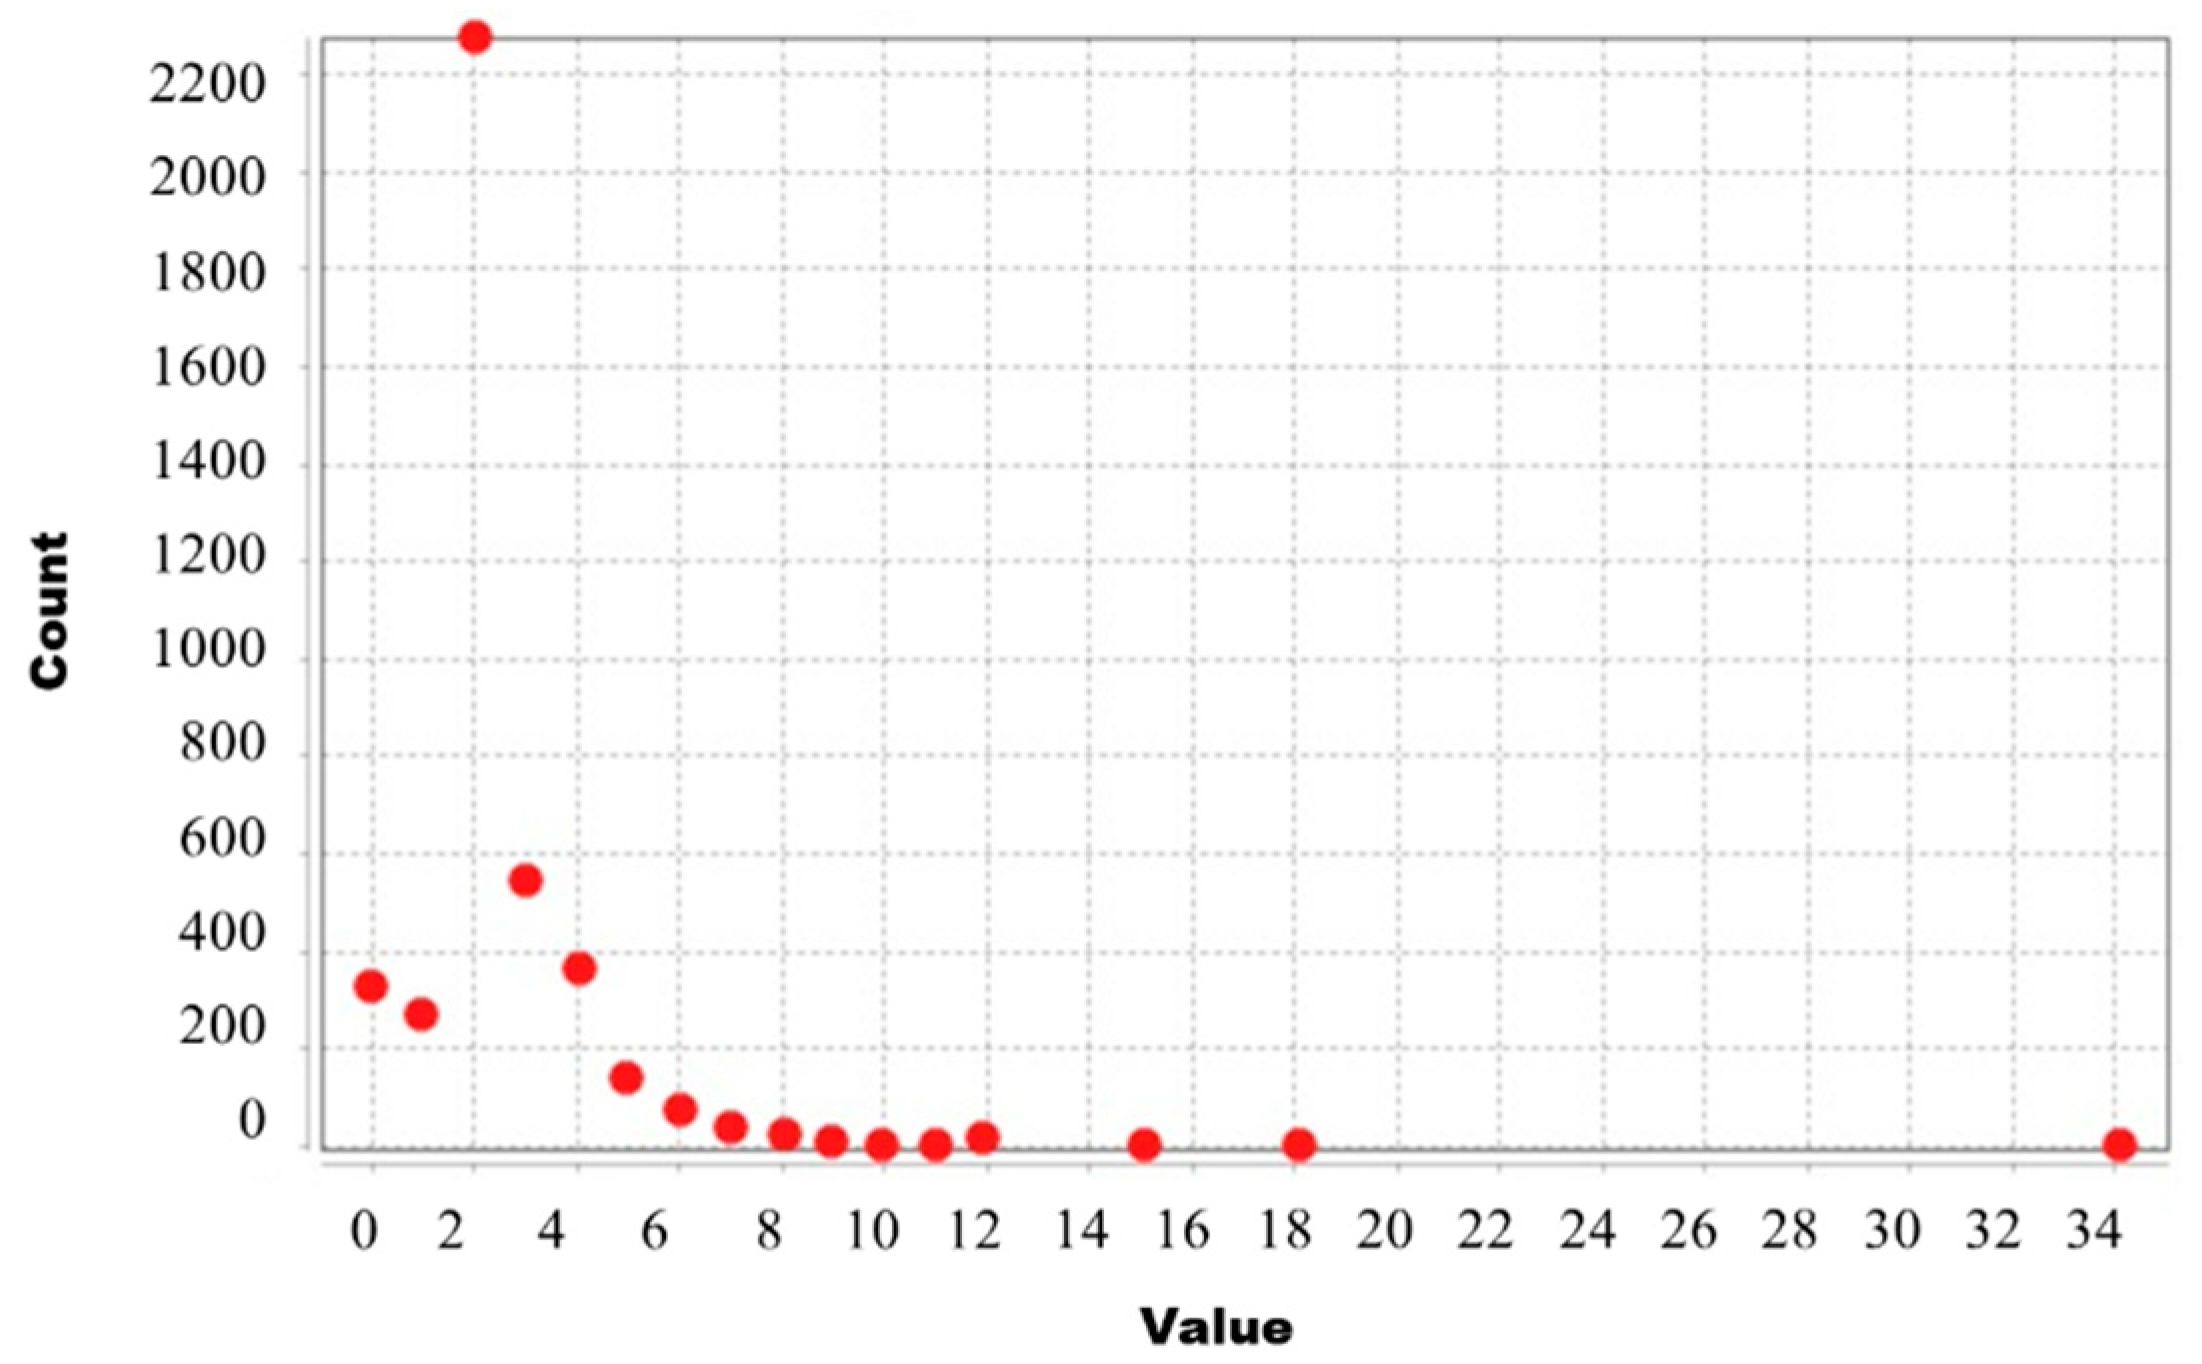
- Degree distribution
- 2.
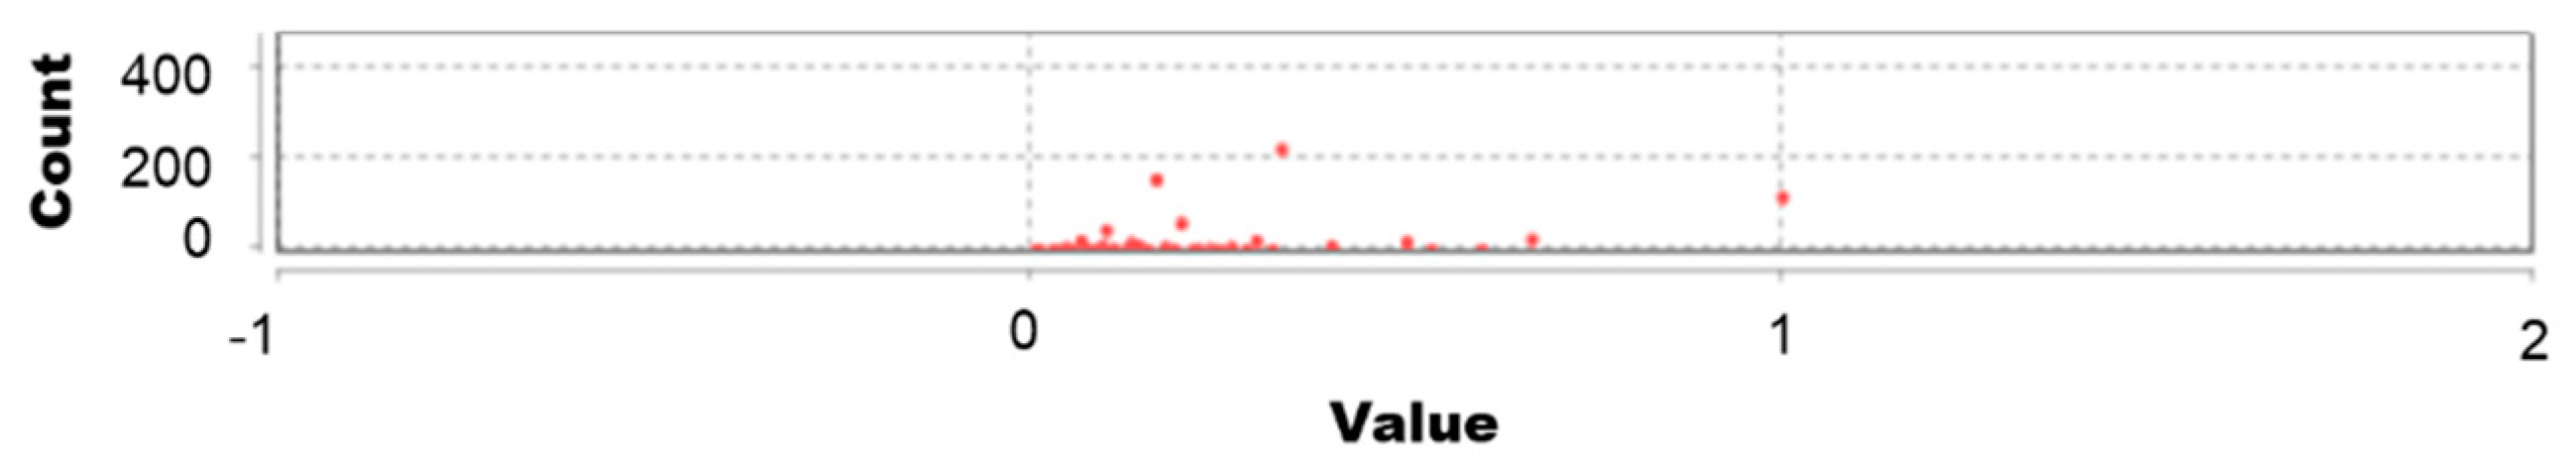
- Clustering coefficient
- 3.
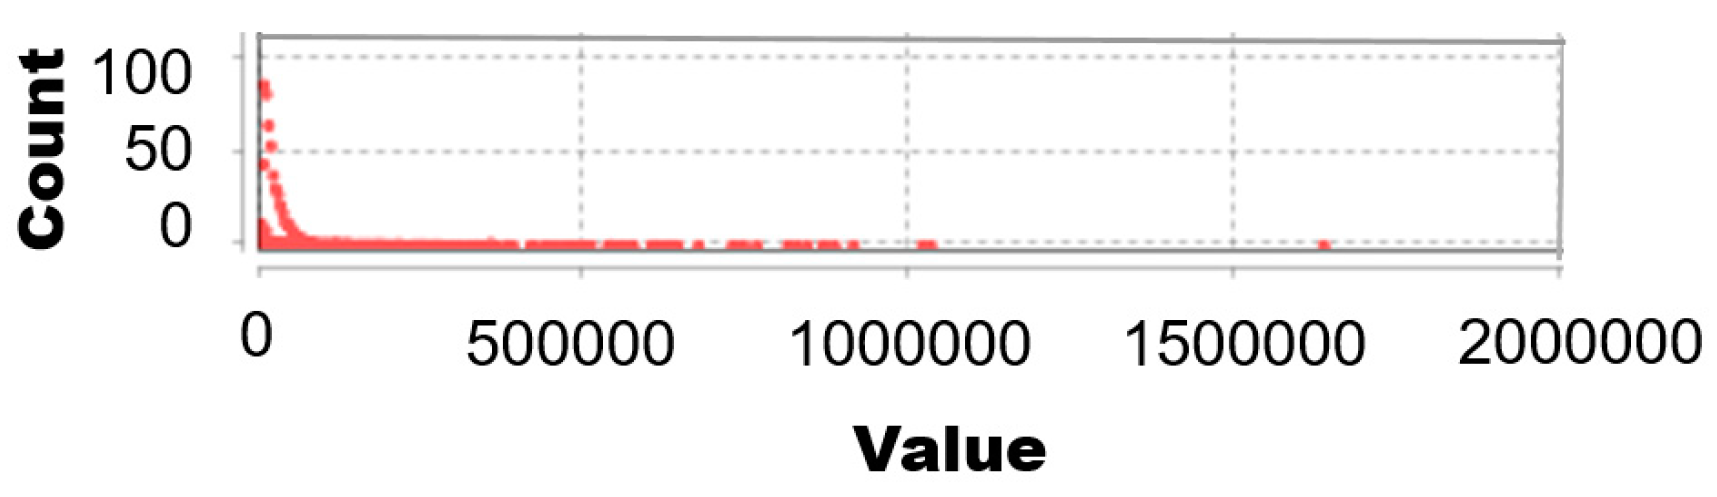
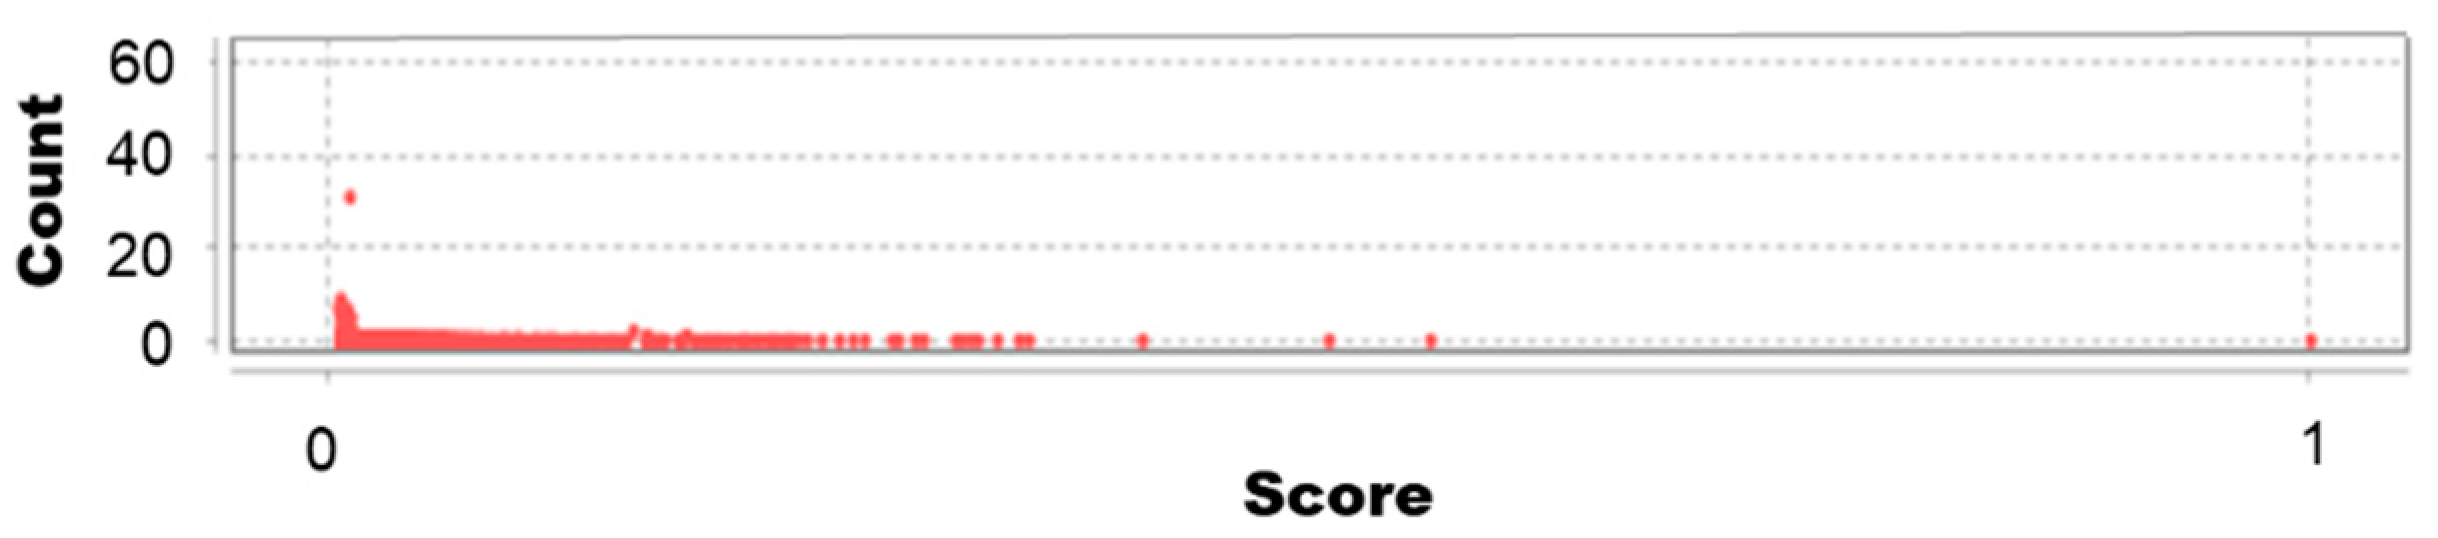
- Eigenvector Centrality
- 4.
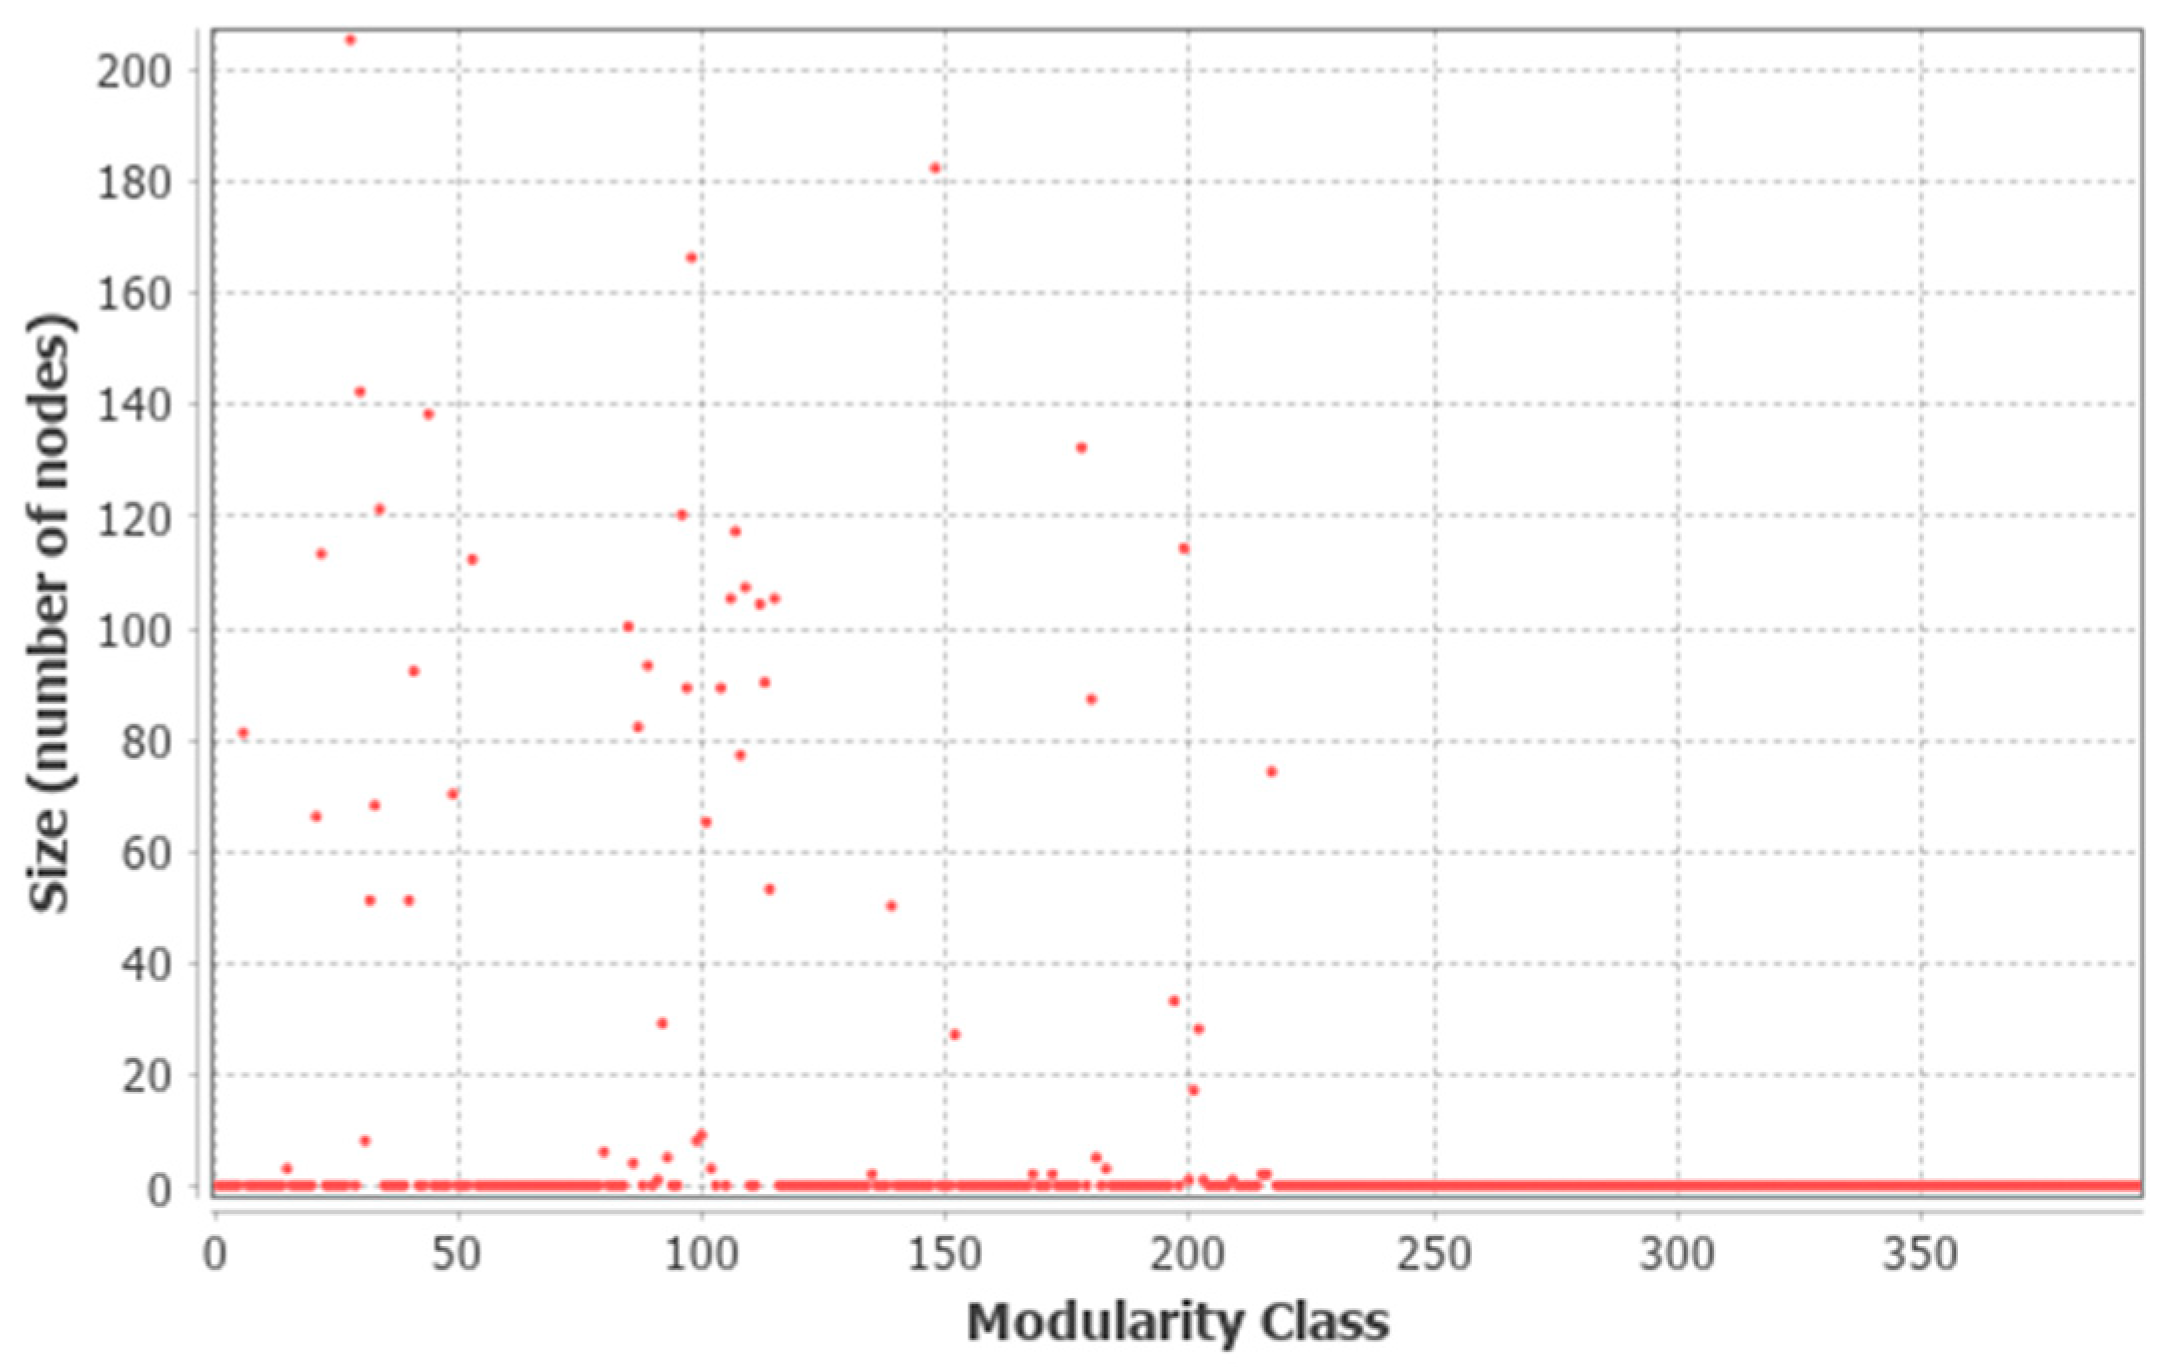
- Modularity class value
3.2.2. Structural Equation Model of Individual Behavior of Green Travel in Public Transportation
- (1)
- The path coefficient between the behavioral attitude and green travel intention in public transportation is 0.89. Therefore, the behavioral attitude has a significant positive influence on green travel behavioral intention, and its influence on green travel behavioral intention is greater than the two factors of subjective norms and behavioral perceptual outcome.
- (2)
- The path coefficient from subjective norm to green travel intention in public transportation is 0.35. Therefore, behavioral attitude has a positive influence on green travel intention, but its influence is lower than behavioral attitude and the result of behavioral perception.
- (3)
- The path coefficient from a behavioral perceptual outcome to green travel behavioral intention in public transportation is 0.41. Therefore, the subjective norm has a positive influence on green travel behavioral intention, but its influence is lower than the behavioral perceptual outcome.
4. Results
4.1. Network Analysis
4.1.1. Analysis of Topological Parameter in Complex Networks
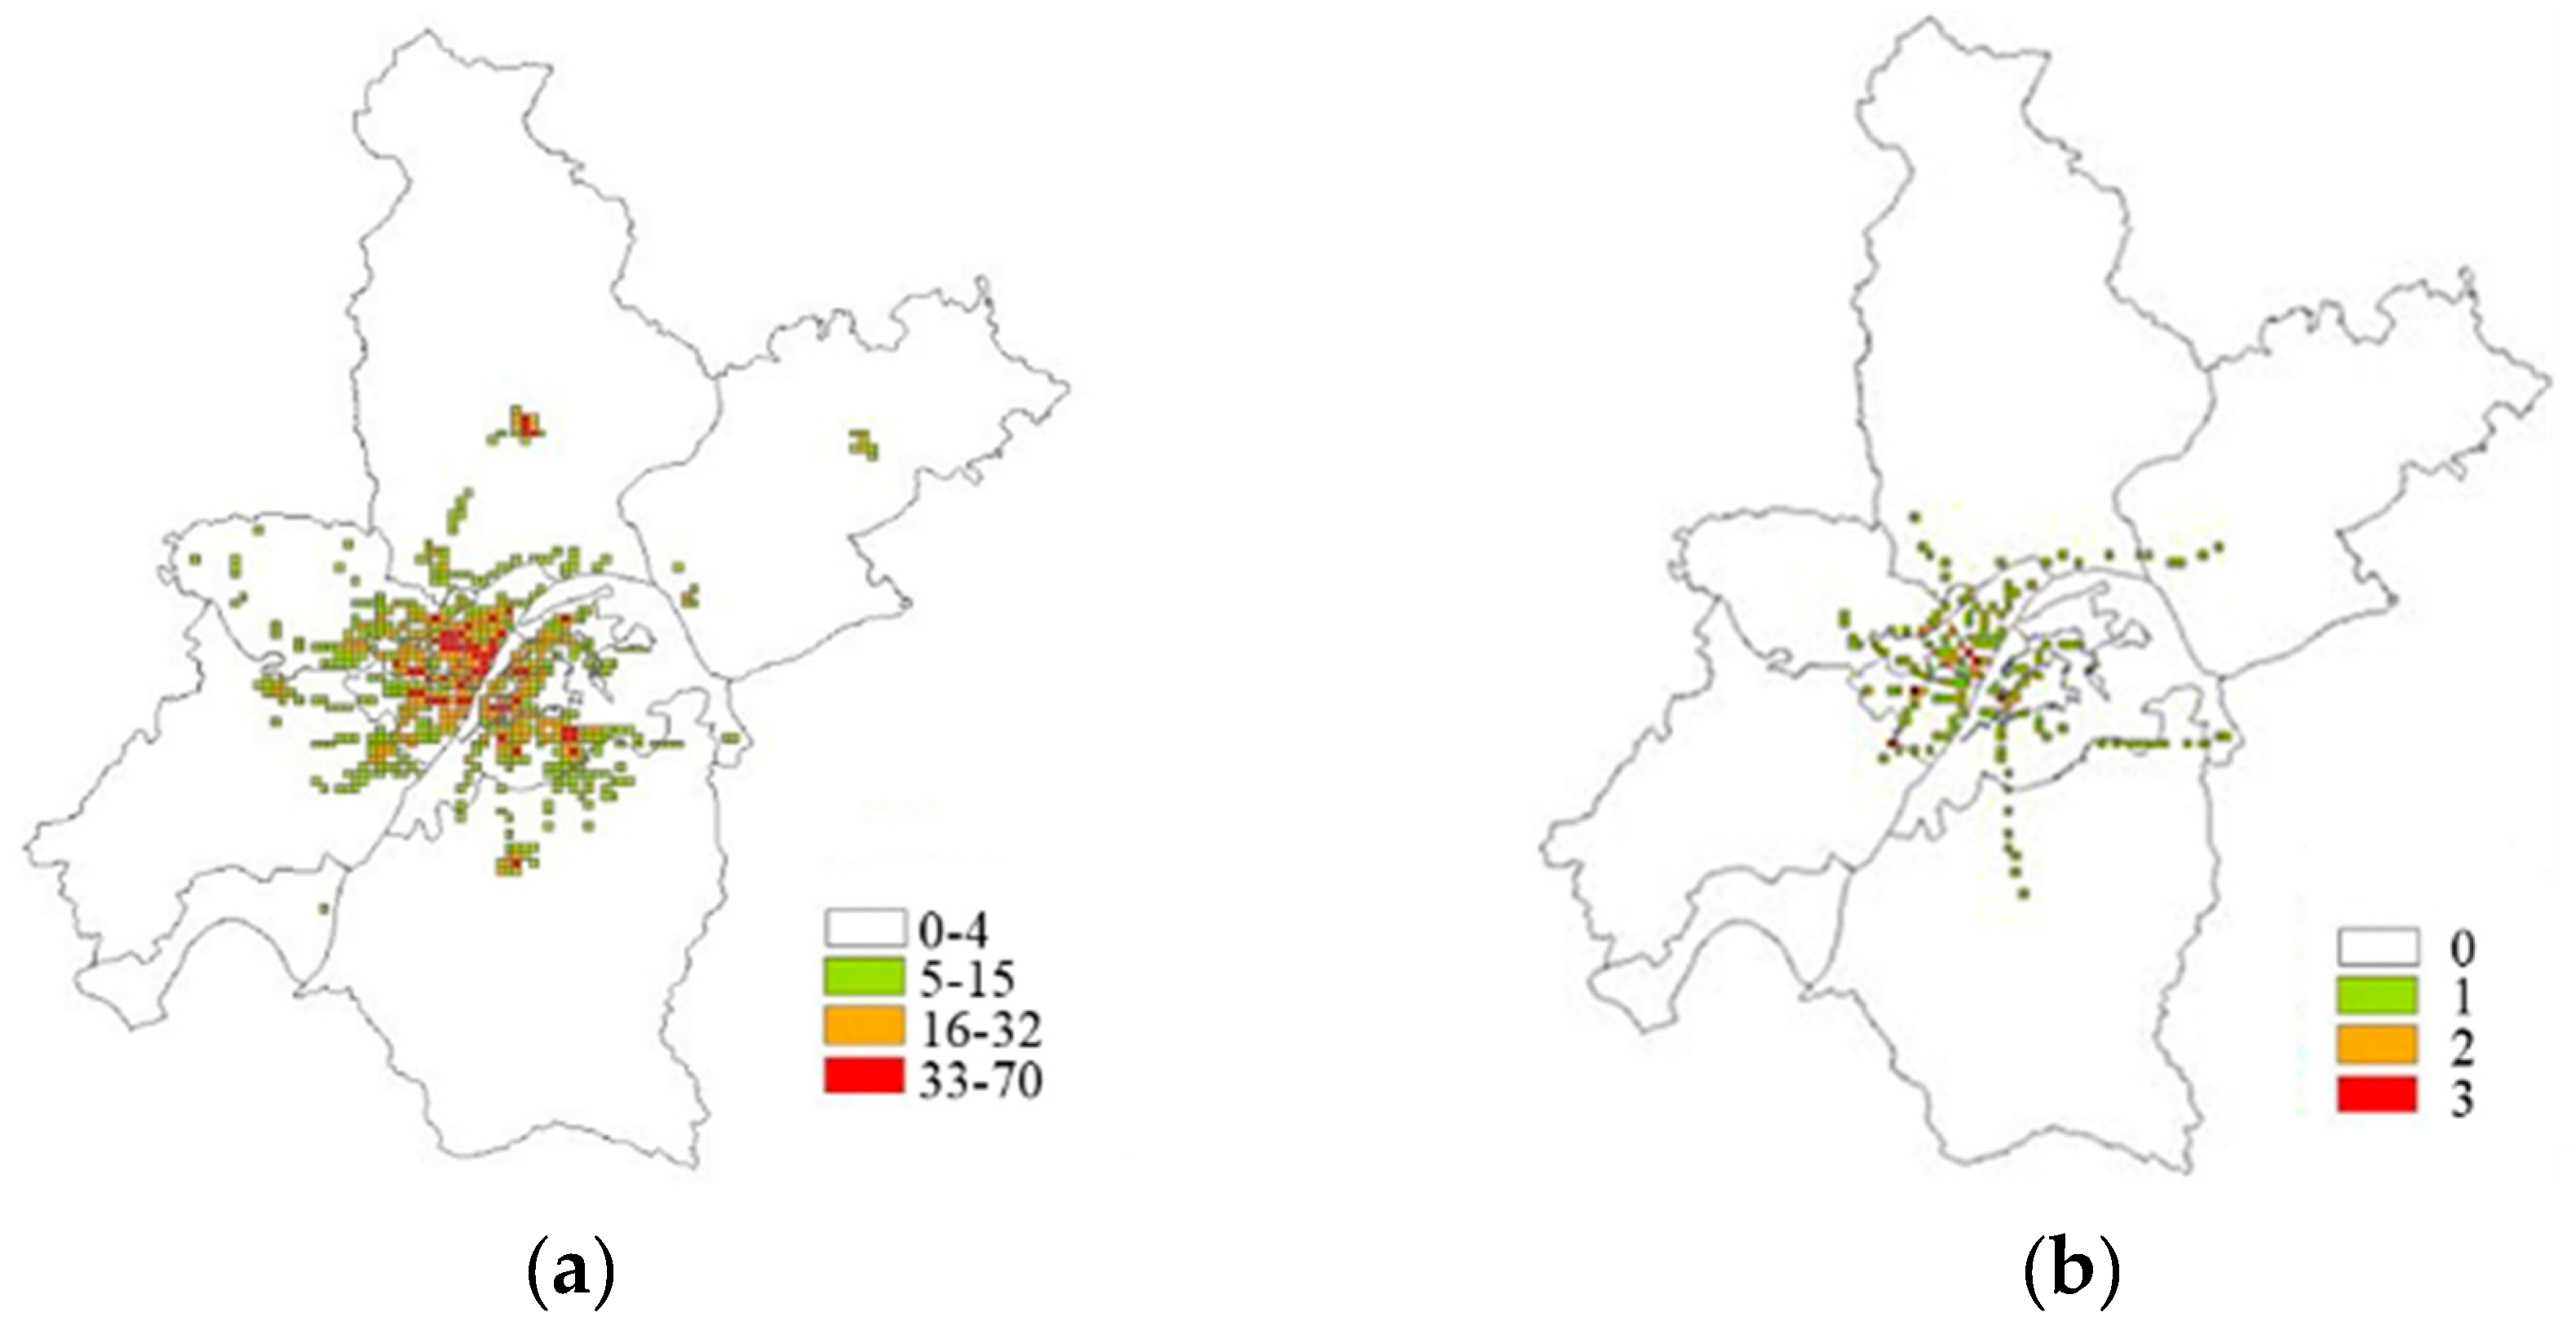
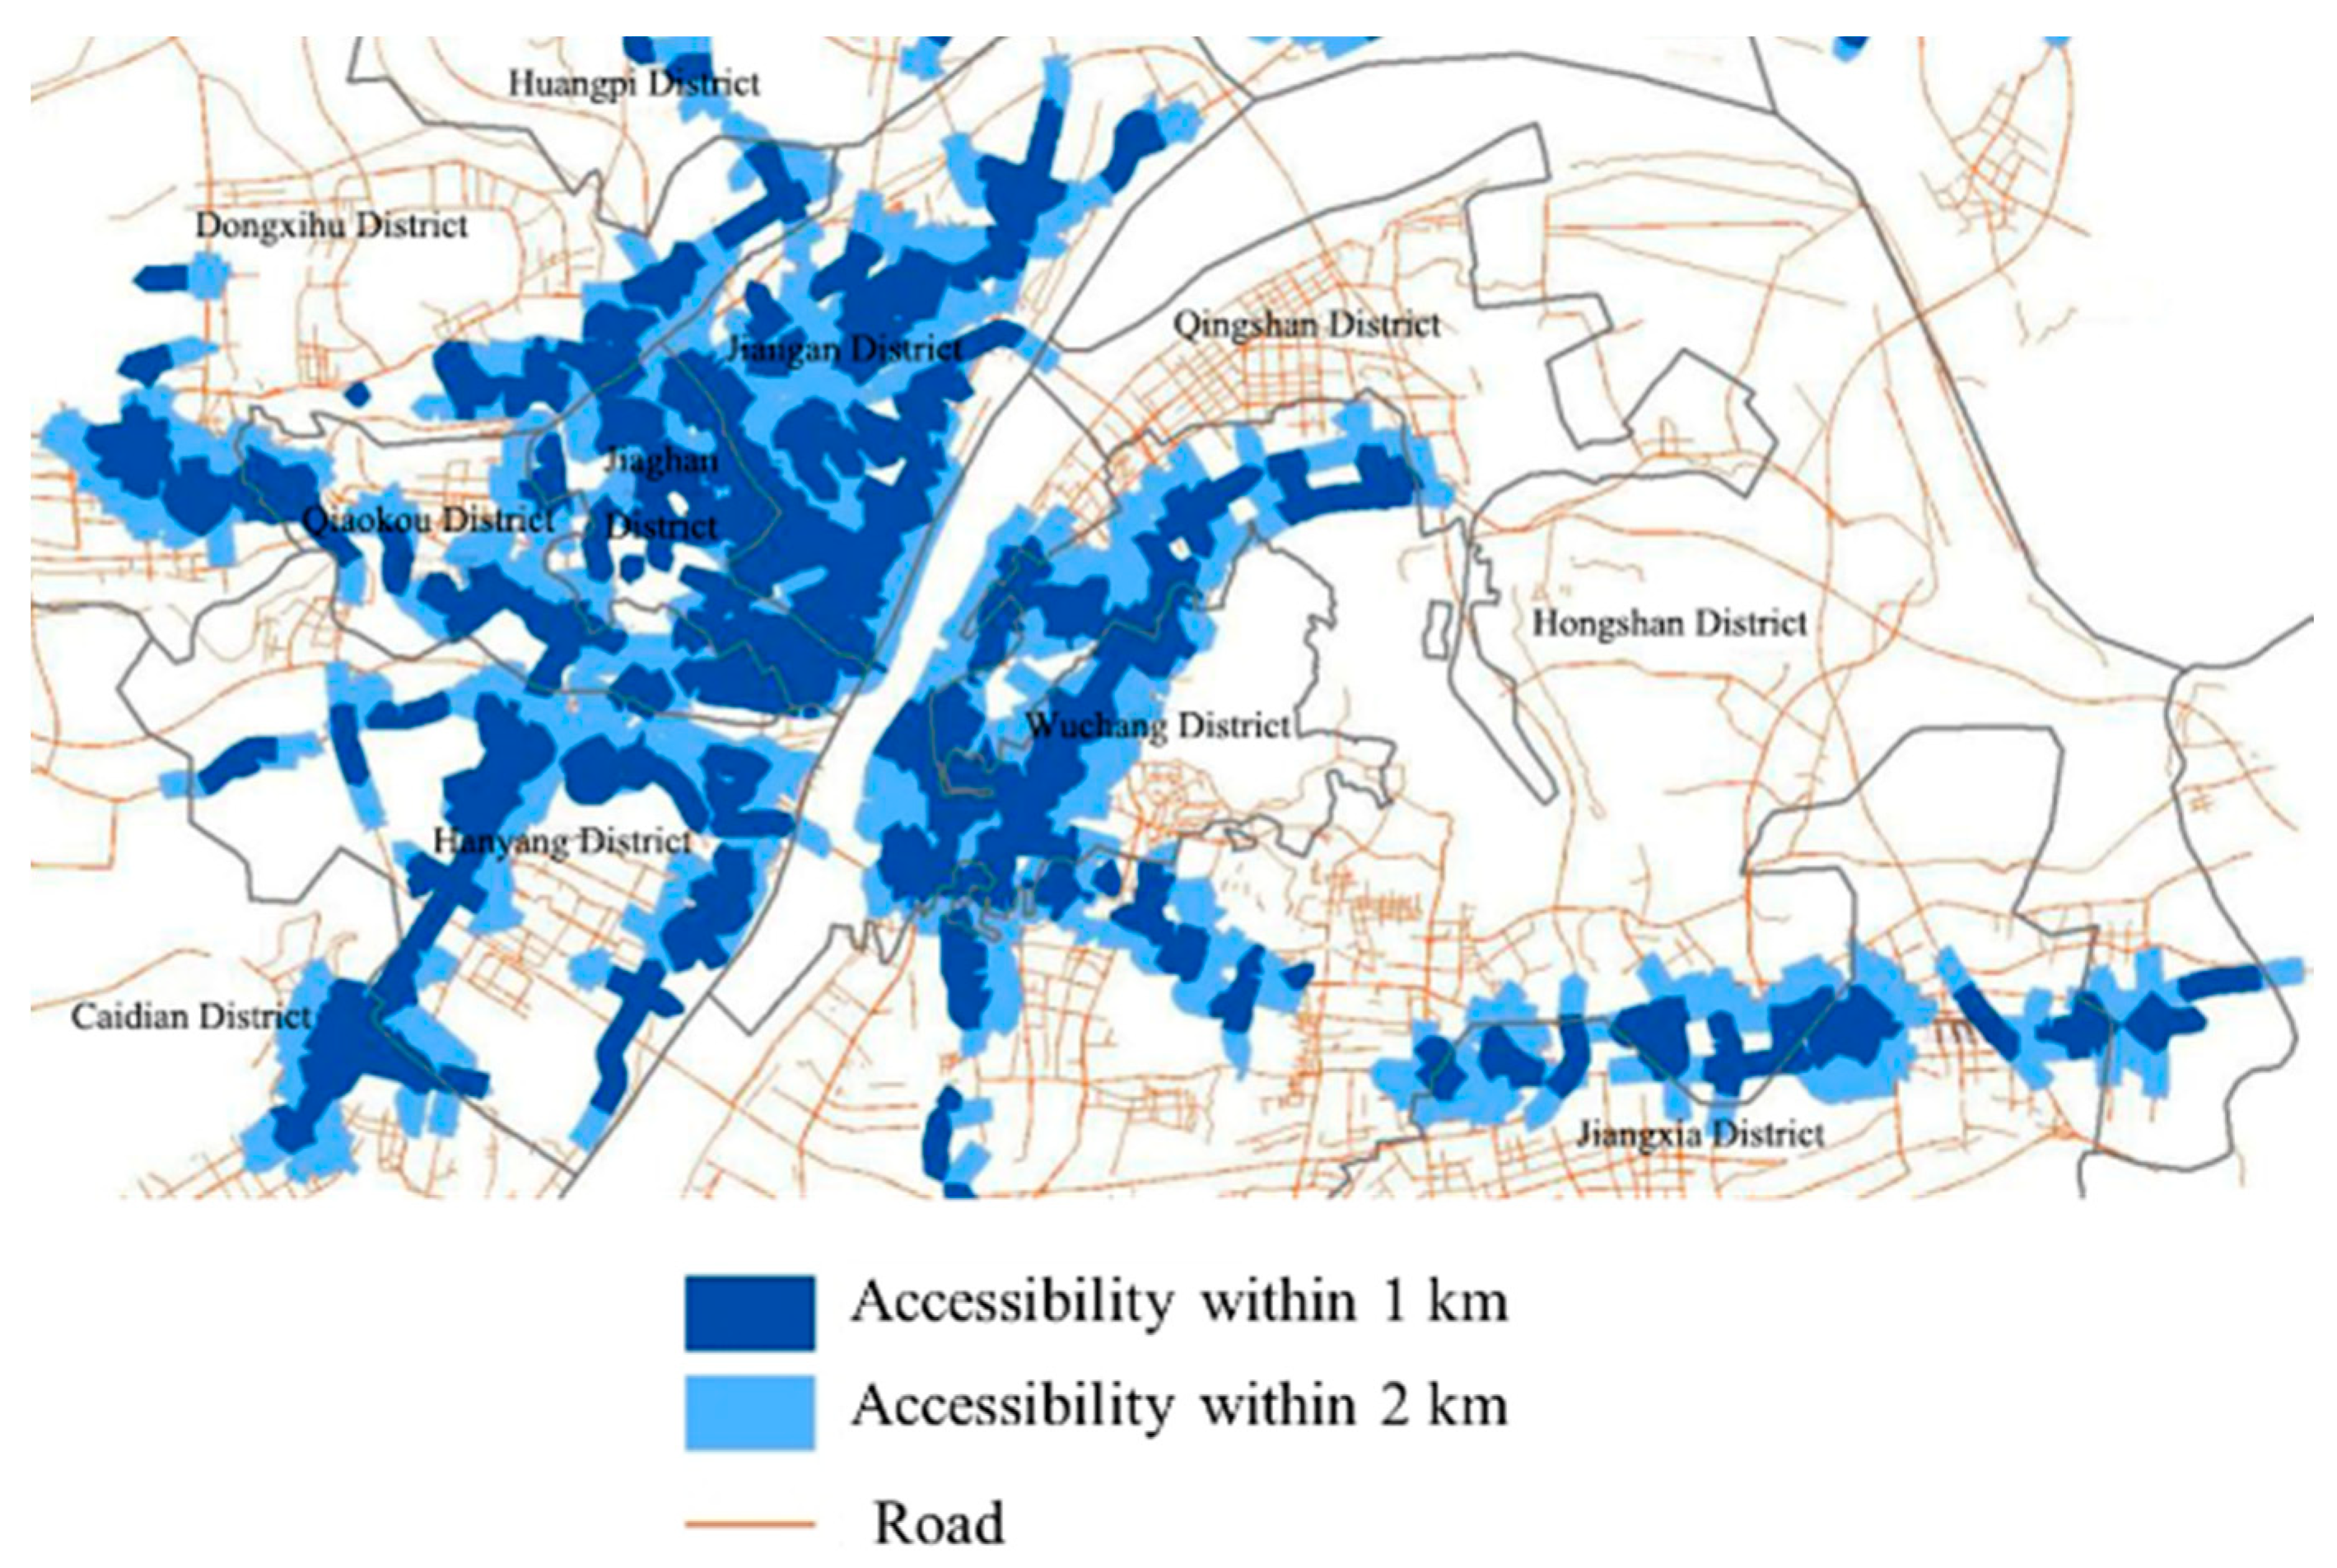
4.1.2. Accessibility of Bus-Subway Station Network
4.2. Analysis of Factors on Green Travel Behavioral Intention
5. Discussion and Suggestions
6. Conclusions
Author Contributions
Funding
Conflicts of Interest
References
- Jia, H.; Appolloni, A.; Wang, Y.Q. Green travel: Exploring the characteristics and behavior transformation of urban residents in China. Sustainability 2017, 9, 1043. [Google Scholar] [CrossRef] [Green Version]
- Ren, Y.; Wang, D.Y.; Wang, D.R.; Chen, F. Designing a green-space network with geospatial technology for Lijiang City. Int. J. Sustain. Dev. World Ecol. 2011, 18, 503–508. [Google Scholar] [CrossRef]
- Crucitti, P.; Latora, V.; Porta, S. Centrality in networks of urban streets. Chaos Interdiscip. J. Nonlinear Sci. 2006, 16, 15113. [Google Scholar] [CrossRef] [PubMed]
- Zhang, W.B.; Tian, Z.H.; Zhang, G.Y.; Dong, G.G. Spatial-temporal characteristics of green travel behavior based on vector perspective. J. Clean Prod. 2019, 234, 549–558. [Google Scholar] [CrossRef]
- Ahn, K.G.; Rakha, H. The effects of route choice decisions on vehicle energy consumption and emissions. Transp. Res. Part D Transp. Environ. 2008, 13, 151–167. [Google Scholar] [CrossRef]
- Zhang, X.; Chen, B.Z. Study on node importance evaluation of the high-speed passenger traffic complex network based on the Structural Hole Theory. Open Phys. 2017, 15, 1–11. [Google Scholar] [CrossRef]
- Zheng, J.J.; Xu, M.Y.; Li, R.F.; Yu, L.K. Research on group choice behavior in green travel based on planned behavior theory and complex network. Sustainability 2019, 11, 3765. [Google Scholar] [CrossRef] [Green Version]
- Krylatov, A.Y.; Zakharov, V.V. Competitive traffic assignment in a green transit network. Int. Game Theory Rev. 2016, 18, 1640003. [Google Scholar] [CrossRef]
- Muslim, N.H.; Keyvanfar, A.; Shafaghat, A.; Abdullahi, M.M.; Khorami, M. Green driver: Travel behaviors revisited on fuel saving and less emission. Sustainability 2018, 10, 325. [Google Scholar] [CrossRef] [Green Version]
- Kahn, M.E.; Morris, E.A. Walking the walk: The association between community environmentalism and green travel behavior. J. Am. Plan. Assoc. 2009, 75, 389–405. [Google Scholar] [CrossRef]
- McDonald, S.; Oates, C.J.; Thyne, M.; Timmis, A.J.; Carlile, C. Flying in the face of environmental concern: Why green consumers continue to fly. J. Mark. Manag. 2015, 31, 1503–1528. [Google Scholar] [CrossRef] [Green Version]
- Enzler, H.B. Air travel for private purposes. An analysis of airport access, income and environmental concern in Switzerland. J. Transp. Geogr. 2017, 61, 1–8. [Google Scholar] [CrossRef]
- Ho, C.; Mulley, C.; Tsai, C.H.; Ison, S.; Wiblin, S. Area-wide travel plans—Targeting strategies for greater participation in green travel initiatives: A case study of Rouse Hill Town Centre. Transportation 2017, 44, 325–352. [Google Scholar] [CrossRef]
- Geng, J.C.; Long, R.Y.; Chen, H.; Li, W.B. Exploring the motivation-behavior gap in urban residents’ green travel behavior: A theoretical and empirical study. Resour. Conserv. Recycl. 2017, 125, 282–292. [Google Scholar] [CrossRef]
- Jia, H. Green travel behavior in urban China: Influencing factors and their effects. Sustain. Dev. 2018, 26, 350–364. [Google Scholar] [CrossRef]
- Ru, X.J.; Wang, S.Y.; Chen, Q.; Yan, S. Exploring the interaction effects of norms and attitudes on green travel intention: An empirical study in eastern China. J. Clean Prod. 2018, 197, 1317–1327. [Google Scholar] [CrossRef]
- Shi, H.X.; Wang, S.Y.; Guo, S.D. Predicting the impacts of psychological factors and policy factors on individual’s PM2.5 reduction behavior: An empirical study in China. J. Clean Prod. 2019, 241, 118416. [Google Scholar] [CrossRef]
- Wu, Z.; Chen, Y.; Geng, L.; Zhou, L.; Zhou, K. Greening in nostalgia? How nostalgic traveling enhances tourists’ proenvironmental behavior. Sustain. Dev. 2019, 28, 1–12. [Google Scholar]
- Wuhan Institute of Traffic Development Strategy. Wuhan Traffic Development Annual Report in 2018; Wuhan Institute of Traffic Development Strategy: Wuhan, China, 2018. [Google Scholar]
- Kurant, M.; Thiran, P. Layered complex networks. Phys. Rev. Lett. 2006, 96, 138701. [Google Scholar] [CrossRef] [Green Version]
- Von Ferber, C.J.; Holovatch, T.; Holovatch, Y.; Palchykov, V. Public transport networks: Empirical analysis and modeling. Eur. Phys. J. B 2009, 68, 261–275. [Google Scholar] [CrossRef] [Green Version]
- Seaton, K.A.; Hackett, L.M. Stations, trains and small-world networks. Phys. A Stat. Mech. Appl. 2004, 339, 635–644. [Google Scholar] [CrossRef] [Green Version]
- Sun, R.C.; Shao, F.J. Complexity of Qingdao’s public transport line network. Complex Syst. Complex. Sci. 2009, 6, 63–68. [Google Scholar]
- Rhodes, R.E.; Beauchamp, M.R.; Conner, M.; de Bruijn, G.J.; Kaushal, N.; Latimer-Cheung, A. Prediction of depot-based specialty recycling behavior using an extended theory of planned behavior. Environ. Behav. 2015, 47, 1001–1023. [Google Scholar] [CrossRef]


| Proportion | [20,35) | [35,50) | [50,65) | [65,80) | ||
|---|---|---|---|---|---|---|
| Statistical Yearbook | 17.80% | 23.35% | 23.07% | 22.08% | 10.93% | 2.77% |
| Respondents | 18.16% | 28.82% | 25.36% | 18.44% | 8.36% | 0.86% |
| Factor | Research Indicators and Questions |
|---|---|
| Behavior intention | I would like to travel in a green way.(Q12) |
| Individual attitude (IA) | I think air quality is very important, and pay attention to the emission of pollutants.(Q1) |
| Green travel is better than other forms of travel.(Q2) | |
| I’m under a lot of financial pressure right now.(Q3) | |
| Subjective Norms (SN) | Many people recommended me to travel by bus or subway.(Q4) |
| I am willing to consider the suggestions of people around me and adjust my travel style.(Q5) | |
| TV, Internet and other media often recommend me to travel in public transportation.(Q6) | |
| Perceived behavioral control (BC) | It is not difficult for me to green travel alone without other people’s company or help.(Q7) |
| Green travel is safe.(Q8) | |
| Green travel is convenient.(Q9) | |
| Behavioral outcome perception (OP) | It’s cheaper for green travel in public transportation.(Q10) |
| Choosing green travel can protect the environment, which makes me feel very happy.(Q11) |
| Cronbach’s Alpha | Cronbach’s Alpha Based on Standardized Items | N of Items |
|---|---|---|
| 0.830 | 0.823 | 12 |
| Scale Mean if Item Deleted | Scale Variance if Item Deleted | Corrected Item-Total Correlation | Squared Multiple Correlation | Cronbach’s Alpha if Item Deleted | |
|---|---|---|---|---|---|
| Q1 | 44.69 | 24.029 | 0.663 | 0.488 | 0.802 |
| Q2 | 44.70 | 23.903 | 0.709 | 0.548 | 0.799 |
| Q3 | 46.98 | 33.498 | −0.501 | 0.354 | 0.881 |
| Q4 | 44.79 | 24.438 | 0.624 | 0.456 | 0.806 |
| Q5 | 44.90 | 24.673 | 0.591 | 0.384 | 0.809 |
| Q6 | 44.75 | 25.247 | 0.561 | 0.352 | 0.812 |
| Q7 | 44.52 | 24.715 | 0.559 | 0.331 | 0.811 |
| Q8 | 44.69 | 26.896 | 0.334 | 0.167 | 0.829 |
| Q9 | 44.69 | 26.152 | 0.382 | 0.203 | 0.826 |
| Q10 | 44.67 | 24.800 | 0.576 | 0.394 | 0.810 |
| Q11 | 44.62 | 24186 | 0.669 | 0.521 | 0.802 |
| Q12 | 44.63 | 24.098 | 0.754 | 0.711 | 0.797 |
| Kaiser-Meyer-Olkin Measure of Sampling Adequacy | 0.930 | |
|---|---|---|
| Bartlett’s Test of Sphericity | Approx. Chi-Square | 1690.500 |
| df | 66 | |
| Sig. | 0.000 | |
| df | RMSEA | IFI | CFI | GFI | TLI | |||
|---|---|---|---|---|---|---|---|---|
| Intention | 234.167 | 52 | 4.503 | 0.097 | 0.957 | 0.868 | 0.896 | 0.942 |
| Estimate | S.E. | C.R. | P | |||
|---|---|---|---|---|---|---|
| Intention | <--- | IA | 1.000 | |||
| Intention | <--- | SN | 0.327 | 0.053 | 6.182 | *** |
| Intention | <--- | BC | −0.029 | 0.069 | −0.423 | 0.672 |
| Intention | <--- | OP | 0.412 | 0.064 | 6.459 | *** |
| Q1 | <--- | IA | 1.000 | |||
| Q2 | <--- | IA | 1.135 | 0.099 | 11.422 | *** |
| Q3 | <--- | IA | −1.006 | 0.088 | −11.397 | *** |
| Q4 | <--- | SN | 1.000 | |||
| Q5 | <--- | SN | 1.009 | 0.122 | 8.200 | *** |
| Q6 | <--- | SN | 0.807 | 0.101 | 7.990 | *** |
| Q7 | <--- | BC | 1.000 | |||
| Q8 | <--- | BC | 0.843 | 0.198 | 4.257 | *** |
| Q9 | <--- | BC | 1.043 | 0.254 | 4.108 | *** |
| Q10 | <--- | OP | 1.000 | |||
| Q11 | <--- | OP | 1.178 | 0.195 | 6.033 | *** |
| Q11 | <--- | Intention | 1.000 |
| Estimate | S.E. | C.R. | P | ST | |||
|---|---|---|---|---|---|---|---|
| Intention | <--- | IA | 1.000 | *** | 0.89 | ||
| Intention | <--- | SN | 0.323 | 0.053 | 6.120 | *** | 0.35 |
| Intention | <--- | OP | 0.409 | 0.064 | 6.420 | *** | 0.41 |
| Q1 | <--- | IA | 1.000 | 0.58 | |||
| Q2 | <--- | IA | 1.140 | 0.100 | 11.374 | *** | 0.65 |
| Q4 | <--- | SN | 1.000 | 0.47 | |||
| Q5 | <--- | SN | 1.008 | 0.122 | 8.281 | *** | 0.48 |
| Q6 | <--- | SN | 0.807 | 0.101 | 7.980 | *** | 0.35 |
| Q10 | <--- | OP | 1.000 | 0.40 | |||
| Q12 | <--- | Intention | 1.000 | 0.74 | |||
| Q11 | <--- | OP | 1.182 | 0.197 | 5.985 | *** | 0.76 |
| Q3 | <--- | IA | −1.012 | 0.089 | −11.368 | *** | −0.65 |
| Degree | Number | Degree | Number |
|---|---|---|---|
| 1 | 328 | 9 | 22 |
| 2 | 275 | 10 | 12 |
| 3 | 2275 | 11 | 6 |
| 4 | 547 | 12 | 1 |
| 5 | 376 | 13 | 1 |
| 6 | 152 | 16 | 1 |
| 7 | 75 | 19 | 1 |
| 8 | 36 | 35 | 1 |
© 2020 by the authors. Licensee MDPI, Basel, Switzerland. This article is an open access article distributed under the terms and conditions of the Creative Commons Attribution (CC BY) license (http://creativecommons.org/licenses/by/4.0/).
Share and Cite
Zheng, J.; Cheng, Y.; Ma, G.; Han, X.; Yu, L. Feasibility Analysis of Green Travel in Public Transportation: A Case Study of Wuhan. Sustainability 2020, 12, 6531. https://doi.org/10.3390/su12166531
Zheng J, Cheng Y, Ma G, Han X, Yu L. Feasibility Analysis of Green Travel in Public Transportation: A Case Study of Wuhan. Sustainability. 2020; 12(16):6531. https://doi.org/10.3390/su12166531
Chicago/Turabian StyleZheng, Junjun, Yi Cheng, Gang Ma, Xue Han, and Liukai Yu. 2020. "Feasibility Analysis of Green Travel in Public Transportation: A Case Study of Wuhan" Sustainability 12, no. 16: 6531. https://doi.org/10.3390/su12166531