Article

The Spillover Effect between Carbon Emission Trading (CET) Price and Power Company Stock Price in China

1
School of Economics and Management, North China Electric Power University, Beijing 102206, China
2
Beijing Key Laboratory of New Energy and Low-Carbon Development, North China Electric Power University, Beijing 102206, China
3
School of Environment, Education & Development, The University of Manchester, Manchester M13 9PL, UK
*
Author to whom correspondence should be addressed.
Sustainability 2020, 12(16), 6573; https://doi.org/10.3390/su12166573
Submission received: 9 July 2020 / Revised: 30 July 2020 / Accepted: 1 August 2020 / Published: 13 August 2020
(This article belongs to the Section Economic and Business Aspects of Sustainability)

Abstract

:
The power sector is one of the major contributors to China’s carbon emissions, and its low-carbon transformation is of vital importance to China’s long-term sustainable development. This paper aims to investigate the spillover effect between the carbon emission trading (CET) market and power sector in China from a systematic perspective. We adopted the recently developed method of connectedness network and rolling window approach, and found that: (i) during our sample period, the total static spillover index and the average of total dynamic spillover indexes were 60.5735% and 57.9704%, respectively, and the spillover effect of this carbon-power system was relatively strong; (ii) there is weak bidirectional spillover effect between the CET market and the power sector, and the CET market is a net receiver of the information from the power sector; (iii) the CET market may exert a relatively high degree of impact on the power sector occasionally; (iv) for regulated power companies, their interactions with the carbon-power system may be related to its total holding installed capacity and the proportion of renewable energy installed. This study provides implications for policymakers, company managers, and market participants.

1. Introduction

Since the Industrial Revolution, humans have begun to develop and use resources on a large scale, which has led to a sharp increase in greenhouse gas emissions. The massive emission of greenhouse gases has caused a series of environmental problems worldwide, such as global warming and climate change. Therefore, how to effectively reduce greenhouse gas emissions has become a global problem. In order to solve this problem, carbon emission trading (CET) markets have been launched in many countries and regions since the announcement of the Kyoto Protocol in 2005, including Europe, California, Australia, China, etc. China, as the world’s largest emitter of greenhouse gases after 2006 [1], is crucial to the global process of reducing carbon emissions.
China has been facing dual pressure from external emission reduction commitments and domestic requirements for sustainable development and environmental protection. On the one hand, China has been facing the external pressure of accomplishing carbon emission mitigation goals. In 2009, China made a commitment at the Copenhagen Climate Conference to reduce the nation’s carbon intensity by 40%–45% compared to 2005, and to have at least 15% of primary energy produced from non-fossil energy sources by 2020 [2]. In 2016, China signed the Paris Agreement and promised to reduce carbon emissions per GDP by 60%–65% compared with 2005 and increase the share of non-fossil fuels in primary energy consumption to 20% by 2030. On the other hand, China has been undertaking the stress of domestic environmental and economic problems caused by the extensive use of energies. China’s energy consumption structure has long been dominated by fossil energies, such as coal, oil, and natural gas [3], and this status is likely to remain for the next few decades. According to the energy outlook report on China from BP in 2019, the consumption shares of coal, oil, and natural gas were 60%, 19%, and 7%, respectively, in 2017, while the number of non-fossil energies was only 14%. In addition, it is forecasted in the report that the consumption of coal, oil, natural gas, and non-fossil energies will reach 35%, 18%, 14%, and 33%, respectively, in 2040. Furthermore, China is undergoing a transformation of economic development, and it is in urgent need of improving the structure and efficiency of energy consumption. Under the international and domestic conditions mentioned above, China has actively constructed carbon trading pilot markets in Shenzhen, Beijing, Shanghai, Guangdong, Tianjin, Hubei, Chongqing, and Fujian since 2011. By May 2019, the cumulative transaction volume and the cumulative turnover of China’s carbon trading pilots had reached 310 million tons and 6.8 billion yuan. The Chinese CET market plays an important role in the world CET market.
On a global scale, the power industry is an important field of carbon emission reduction, as well as one of the main participants in the CET market, especially for China. For a long time, the power sector, especially thermal power generation, has been one of the major contributors to China’s carbon emissions. In 2005, the power sector accounted for about 43% of China’s total carbon emissions. Moreover, the power industry shows great emission reduction potential. From 2006 to 2016, the Chinese power industry reduced carbon dioxide emissions by 9.4 billion tons. In the next decades, China’s power demand will continue to grow, and the proportion of power in terminal energy consumption will continue to rise. In order to effectively achieve emission reduction targets and optimize the energy consumption structure, the power industry is selected as one of the main industries covered in China’s CET pilot markets. Under this circumstance, it is of great importance to examine the interactions between the power sector and the CET market in China.
In recent years, research on the interactions between the CET market and the power sector has gradually enriched. More attention has been paid to the European Union carbon emission trading (EU CET). First, some scholars studied the influence of the CET market on the electricity market. The CET market has an impact on the price of the power sector, which has been confirmed in empirical studies in many European countries, such as Germany, Spain, France, etc. [4,5,6]. Second, the electricity market also affects the CET market. Alberola et al. [7] and Boersen and Scholtens [8] conducted empirical studies on Phase I and Phase II of EU CET, respectively, and found that electricity prices have a significant effect on the formation of carbon prices. Zhu et al. [9] studied the more mature Phase II and Phase III of EU CET and found that at the short timescales and the medium timescales, electricity price plays a driving role in the formation of carbon price. Third, some scholars believe that the electricity market and the CET market are interactive. Keppler and Mansanet-Bataller [10] stated that electricity price and carbon price interact with each other: that is, electricity price will indirectly affect carbon price, and carbon price will also affect power price. Zhu [11] conducted a linear and nonlinear Granger causality test on electricity price and carbon price in the three phases of EU CET, and found that both markets have a mutual causal effect in different time spans. Ji et al. [12] selected 18 European listed power generation companies for empirical research, and found that an information spillover effect exists between the EU CET and the electricity market. This research proves that these two markets are closely connected at the industry level.
There is also literature about the interactions between EU CET and the power sector from the perspective of the financial market. At present, it is generally believed that the carbon price is related to the stock price of power companies, but the specific performance of this correlation may vary depending on the conditions of the carbon market, the power company, and the financial market. Oberndorfer [13] has studied the stock prices of power companies and European Union allowance (EUA) prices, and he believes that EUA price changes have a positive impact on the stock returns of non-renewable energy power enterprises in Europe. He also found that this effect will be greater during the EUA market shock, and that this effect will be different in different countries. Veith et al. [14] stressed that the stock prices of European power generation companies are positively correlated with the rise in the emission allowance prices. With the development of the carbon trading market in Europe, some scholars have expanded the time span and made some further findings. Mo et al. [15] pointed out that EUA price changes had a positive effect on the stock prices of European power enterprises in Phase I, which is consistent with the research results of Oberndorfer [13] and Veith et al. [14]. However, Mo et al. [15] found that the effect was negative in Phase II, which may be mainly due to the strict allocation of carbon allowances in Phase II. Moreno and Pereira [16] conducted a study on stock returns and EUA price changes in Spanish pollute sectors (power sector, chemical, metal, etc.), and found that EUA price changes in Phase III had a stronger negative impact on stock price returns in the power sector than in Phase II. However, some scholars hold different views for Phase II and Phase III. For example, da Silva et al. [17] believes that in the long run, EUA price changes have a positive impact on the stock returns of the power sector in Phase II, but in the short run, EUA price changes in Phase II and Phase III have no effect on the power sector’s stock returns. In addition, some scholars found that carbon price has different effects on different enterprises. Tian et al. [18] found that EUA price has no significant effect on the power stock portfolio as a whole, but it has a significant positive impact on the stocks of power companies with low carbon intensity in Phase II, and has a significant negative impact on power companies with high carbon intensity. Da Silva et al. [17] classified power companies into renewable energy source (RES) companies and non-RES companies based on whether renewable energy is the energy mainly used. The research results show that EUA have a positive impact on the stock returns of RES power companies only in Phase III, and a negative impact on the stock returns of non-RES power companies in Phase II.
In recent years, China’s CET market has attracted more attention. Some scholars find that the CET market affects not only the price of electricity, but also the power mix, consumption, and output of the power sector. Cong and Wei [19] simulated the impact of China’s carbon trading market on the power sector by building an agent-based model, and found that carbon trading would lead to the increase in the price of electricity and the increase in the proportion of clean energy in the power supply structure. Through constructing a computable general equilibrium (CGE) model, Lin and Jia [20] found that the carbon price level would affect the electricity consumption of the five major power consumption sectors, including citizens, service, equipment, steel, and electric power. Zhang et al. [21] and Li et al. [22] also used CGE models; they pointed out that carbon allowance allocation has an impact on the electricity price, the output of the electricity sector, and the electricity consumption. In addition, there is a small amount of research on the impact of the CET market from the financial perspective. Zhang et al. [23] selected 10 listed power generation companies in China for research, and found that in the long run, the carbon market has a significant influence on the value of power generation companies. Wen et al. [24] conducted an empirical study on 52 listed enterprises covering multiple industries in the Shenzhen carbon pilot market, and found that the value of these enterprises increased due to the operation of the CET market.
It can be seen from the above discussion that although there is abundant research on the interactions between the electricity market and the CET market, the research on those in China is relatively lacking. This is reflected in two aspects. Firstly, this current research is mostly at the industry level, and there is little at the company level. Secondly, there are very few studies on the relationship between carbon price and stock price.
To fill the research gap, this paper aims to examine the linkages and spillover effect between the CET market and power sector in China from a systematic perspective. For this purpose, a connectedness network of this carbon-power system is constructed. The connectedness network is a recently developed approach proposed by Diebold and Yilmaz [25] to measure the connectedness among markets or companies. This method has been adopted to investigate the linkages and spillovers between the oil sector and financial markets [26,27,28], oil sector and energy sector [29], regional electricity markets [30], global oil sectors [31], and energy companies [32]. To our knowledge, this paper might be the first study to use this new method developed recent years to study the CET market and power sector in China. On the whole, the contributions of this paper mainly include:
  • Although there is abundant research about the relationship between the CET market and energy markets in China, this paper is the first to examine the spillover effect between the CET market and power sector in China. The empirical results of the spillover effect between the two markets can reflect the effectiveness of the policy well. Based on the results, we put forward some suggestions for the construction of China’s CET market.
  • The existing research on the interactions between the CET market and power sector is mainly at the industry level, while this paper measures the connectedness between these two markets both at the industry level and company level with the connectedness network method. This could provide useful information for company managers and financial market participants when they make strategic decisions.
  • In addition to the connectedness network method, this paper adopts the rolling window method to obtain dynamic connectedness between these two sectors. By measuring time-varying connectedness, the relationship between the CET market and the power sector is further investigated.
The remainder of the paper is organized as follows. Section 2 describes the data and introduces the connectedness network and rolling window approach. Section 3 represents the empirical results of the static connectedness analysis and dynamic connectedness analysis and holds some discussions. Section 4 puts forward the main findings, implications and suggestions, limitations of this paper, and future research.

2. Data and Methodology

2.1. Data

The preliminary data used in this paper were in daily frequency from 23 June 2014, to 14 June 2019, containing 1214 daily observations.

2.1.1. Carbon Price

In terms of the carbon price, considering that the Fujian carbon trading pilot market has been established for a short time and the list of regulated enterprises cannot be obtained, this paper selected the average daily transaction prices of carbon allowances in Beijing, Shanghai, Shenzhen, Guangdong, Hubei, and Tianjin carbon trading pilot markets to represent the national carbon price. All the daily carbon spot trading prices came from the carbon k-line website (http://k.tanjiaoyi.com/).

2.1.2. Power Company Stock Price

For the stock prices, we selected 10 listed electric power enterprises regulated in Beijing, Shanghai, Shenzhen, Guangdong, Hubei, and Tianjin pilot markets, and collected the closing prices of their companies’ stocks on trading days from the WIND database (selecting Chinese yuan as the unified monetary unit) as stock prices. The listed power companies regulated by the CET pilot markets during the year of 2014 to 2019 were all included in this paper. These 10 enterprises were Guangzhou Hengyun Enterprises Holdings Ltd., Shenzhen Nanshan Thermal Power Co. Ltd., Guangdong Baolihua Electric Power Co. Ltd., Binhai Energy Development Co. Ltd., Shanghai Electric Power Co. Ltd., Beijing Jingneng Clean Energy Co. Ltd., Guangdong Electric Power Development Co. Ltd., Guodian Changyuan Electric Power Co. Ltd., Datang International Power Generation Company, and Huaneng Power International INC. The basic information of these enterprises is shown in Table 1.

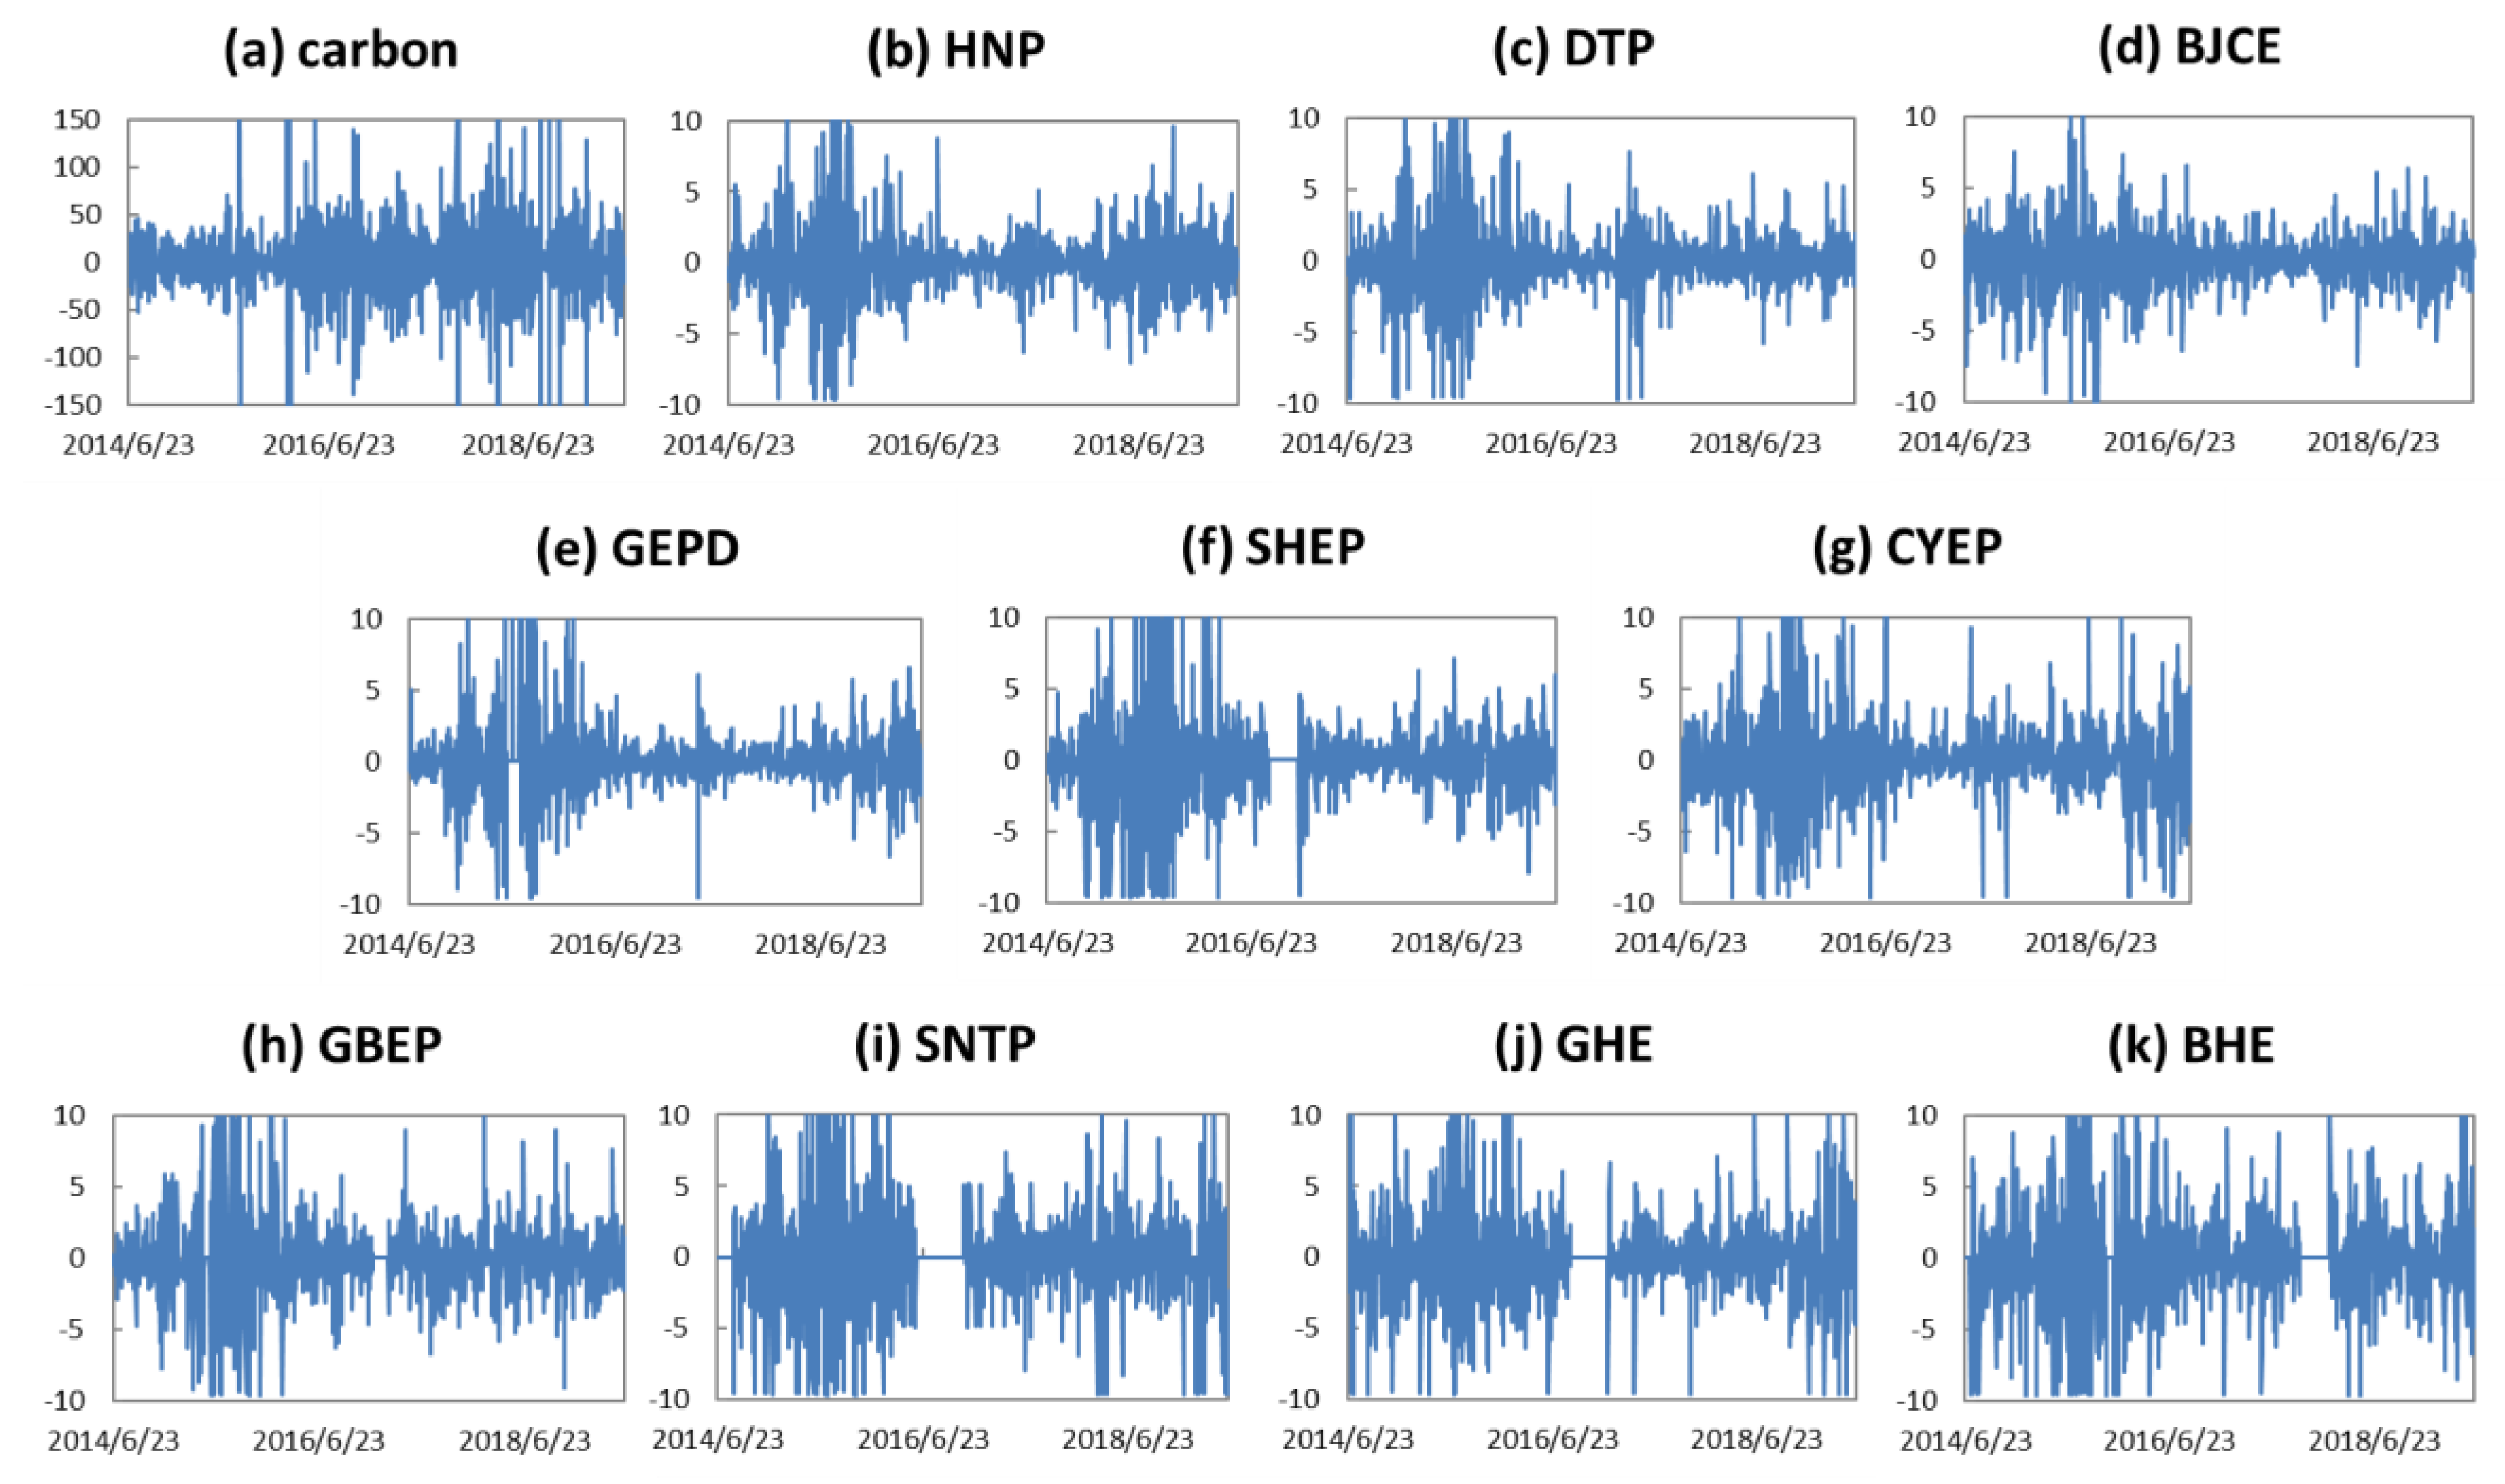
2.1.3. Preliminary Analysis

Based on the research of Zachmann et al. [6], Tian et al. [18], and Zhang et al. [31], the price return is represented by 100 times the difference between the natural logarithm of the price at time t and time t − 1. The formula is shown below:
v t = ( l n p t l n p t 1 ) × 100
where v t is the price return at time t, and p t and p t 1 represent the carbon price or stock price at time t and t − 1, respectively. The movement of carbon price returns and power enterprise stock price returns are shown in Figure 1a–k.
It can be seen from Figure 1 that all price returns are time-varying. Most of the carbon price returns fluctuate in the range of (−150, 150), while the stock price returns of power companies mostly fluctuate in the range of (−10, 10). By comparison, carbon price returns have changed more dramatically, which indicates that the carbon market faces higher uncertainty. Comparing the dynamic behavior of the stock price returns of these 10 power companies, they have similar volatility patterns, while the relationship between the volatility of carbon price returns and the volatility of power enterprise price returns is not obvious for the time being. In Section 3.1 Static Connectedness Analysis and Section 3.2 Dynamic Connectedness Analysis, we use the research methods of the connectedness network and rolling window to conduct further study on the relationship between these 11 variables. The main descriptive statistics of all variables are reported in Table 2.
It can be seen from Table 2 that carbon ranked third in the mean price return, which means it had a relatively high level of returns on average. The maximum (623.9094) of carbon price return was much higher than that of other power company stock price returns, and the minimum (−634.537) was much lower than that of other power company stock price returns. Moreover, the standard deviation (56.49274) of carbon price return was the highest. This indicates that the volatility of the carbon market is higher and the market participants in carbon trading markets face higher levels of uncertainty. As for power enterprises, the maximum stock price returns of Guangzhou Hengyun Enterprises Holdings Ltd. (GHE) and Guodian Changyuan Electric Power Co. Ltd. (CYEP) were much higher than that of others; the minimum stock price returns of all power enterprises were almost on the same low level; the standard deviation of power enterprises was low, and their price returns were much more stable than that of the carbon market.

2.2. Method

2.2.1. The Connectedness Network Method

The main method used in this paper was the connectedness network approach. This approach is based on the variance decomposition of the vector autoregressive (VAR) model, which was proposed and developed by Diebold and Yilmaz [25,33,34] when he studied spillovers between financial markets. In recent years, this method has been widely used in economic and energy research.
First, consider a k-variable covariance VAR model to be written as follows:
y t = c + A 1 y t 1 + A 2 y t 2 + + A p y t p + u t
where y t is a k-variable vector at time t (in this paper, it is an 11 × 1 vector of carbon price returns and electric power enterprises’ stock price returns), c is a k × 1 constant vector, A s are k × k autoregressive coefficient matrixes with different lag periods, y t p is a k-variable vector when the variable lags by p period, and u t is a k × 1 vector of errors at time t. When the covariance of the VAR model is stable, the model can be expressed as a moving average formula:
y t = i = 0 R i u t i
where R i can be expressed as R i = A 1 R i 1 + A 2 R i 2 + + A p R i p . R 0 is a unit matrix, and when i < 0 , A i is a zero matrix. Thus, R 1 , R 2 ,…, R p are obtained in turn.
Second, the variance was decomposed.
In the research of Diebold and Yilmaz [25], the generalized VAR framework proposed by Koop et al. [35] and Pesaran and Shin [36] was used, and d i j H is defined as the contribution of variable j to the H-step generalized forecasting error variance of variable i, which can be expressed as follows:
d i j H = σ i j 1 h = 0 H ( e i R h Ω u R h e j ) 2 i j H ( e i R h Ω u R h e i )
where σ j j is the standard deviation of variable j, e i is a selection vector with unit as its i-th element and zeros elsewhere, and Ω u is the covariance matrix of error vector u t . Then, by setting j = 1 k d i j H = 1 , d i j H is normalized to d ˜ i j H , which is shown below:
d ˜ i j H = d i j H j = 1 k d i j H
Third, the connectedness table was constructed.
All the normalized forecast error variance decompositions d ˜ i j H in Table 3 can be obtained according to Equations (3) and (4). The F r o m i = j = 1 k d ˜ i j H , for j i is defined as how much variable i gains from other variables in the system; T o i = j = 1 k d ˜ j i H , for i j is defined as how much variable i contributes to other variables in the system. Furthermore, N e t i = T o i F r o m i is defined as the net contribution of variable i to other variables in the system. If the net connectedness is positive, it means that the variable is an information transmitter, indicating that it contributes more to the changes of the system; if it is negative, it means that the variable is an information receiver, indicating that it receives more information from the system. The total spillover index (TSI) is defined to measure the connectedness of the system as follows:
Total   Spillover   Index   ( TSI ) = 1 k i , j = 1 k d ˜ i j H ,   i j

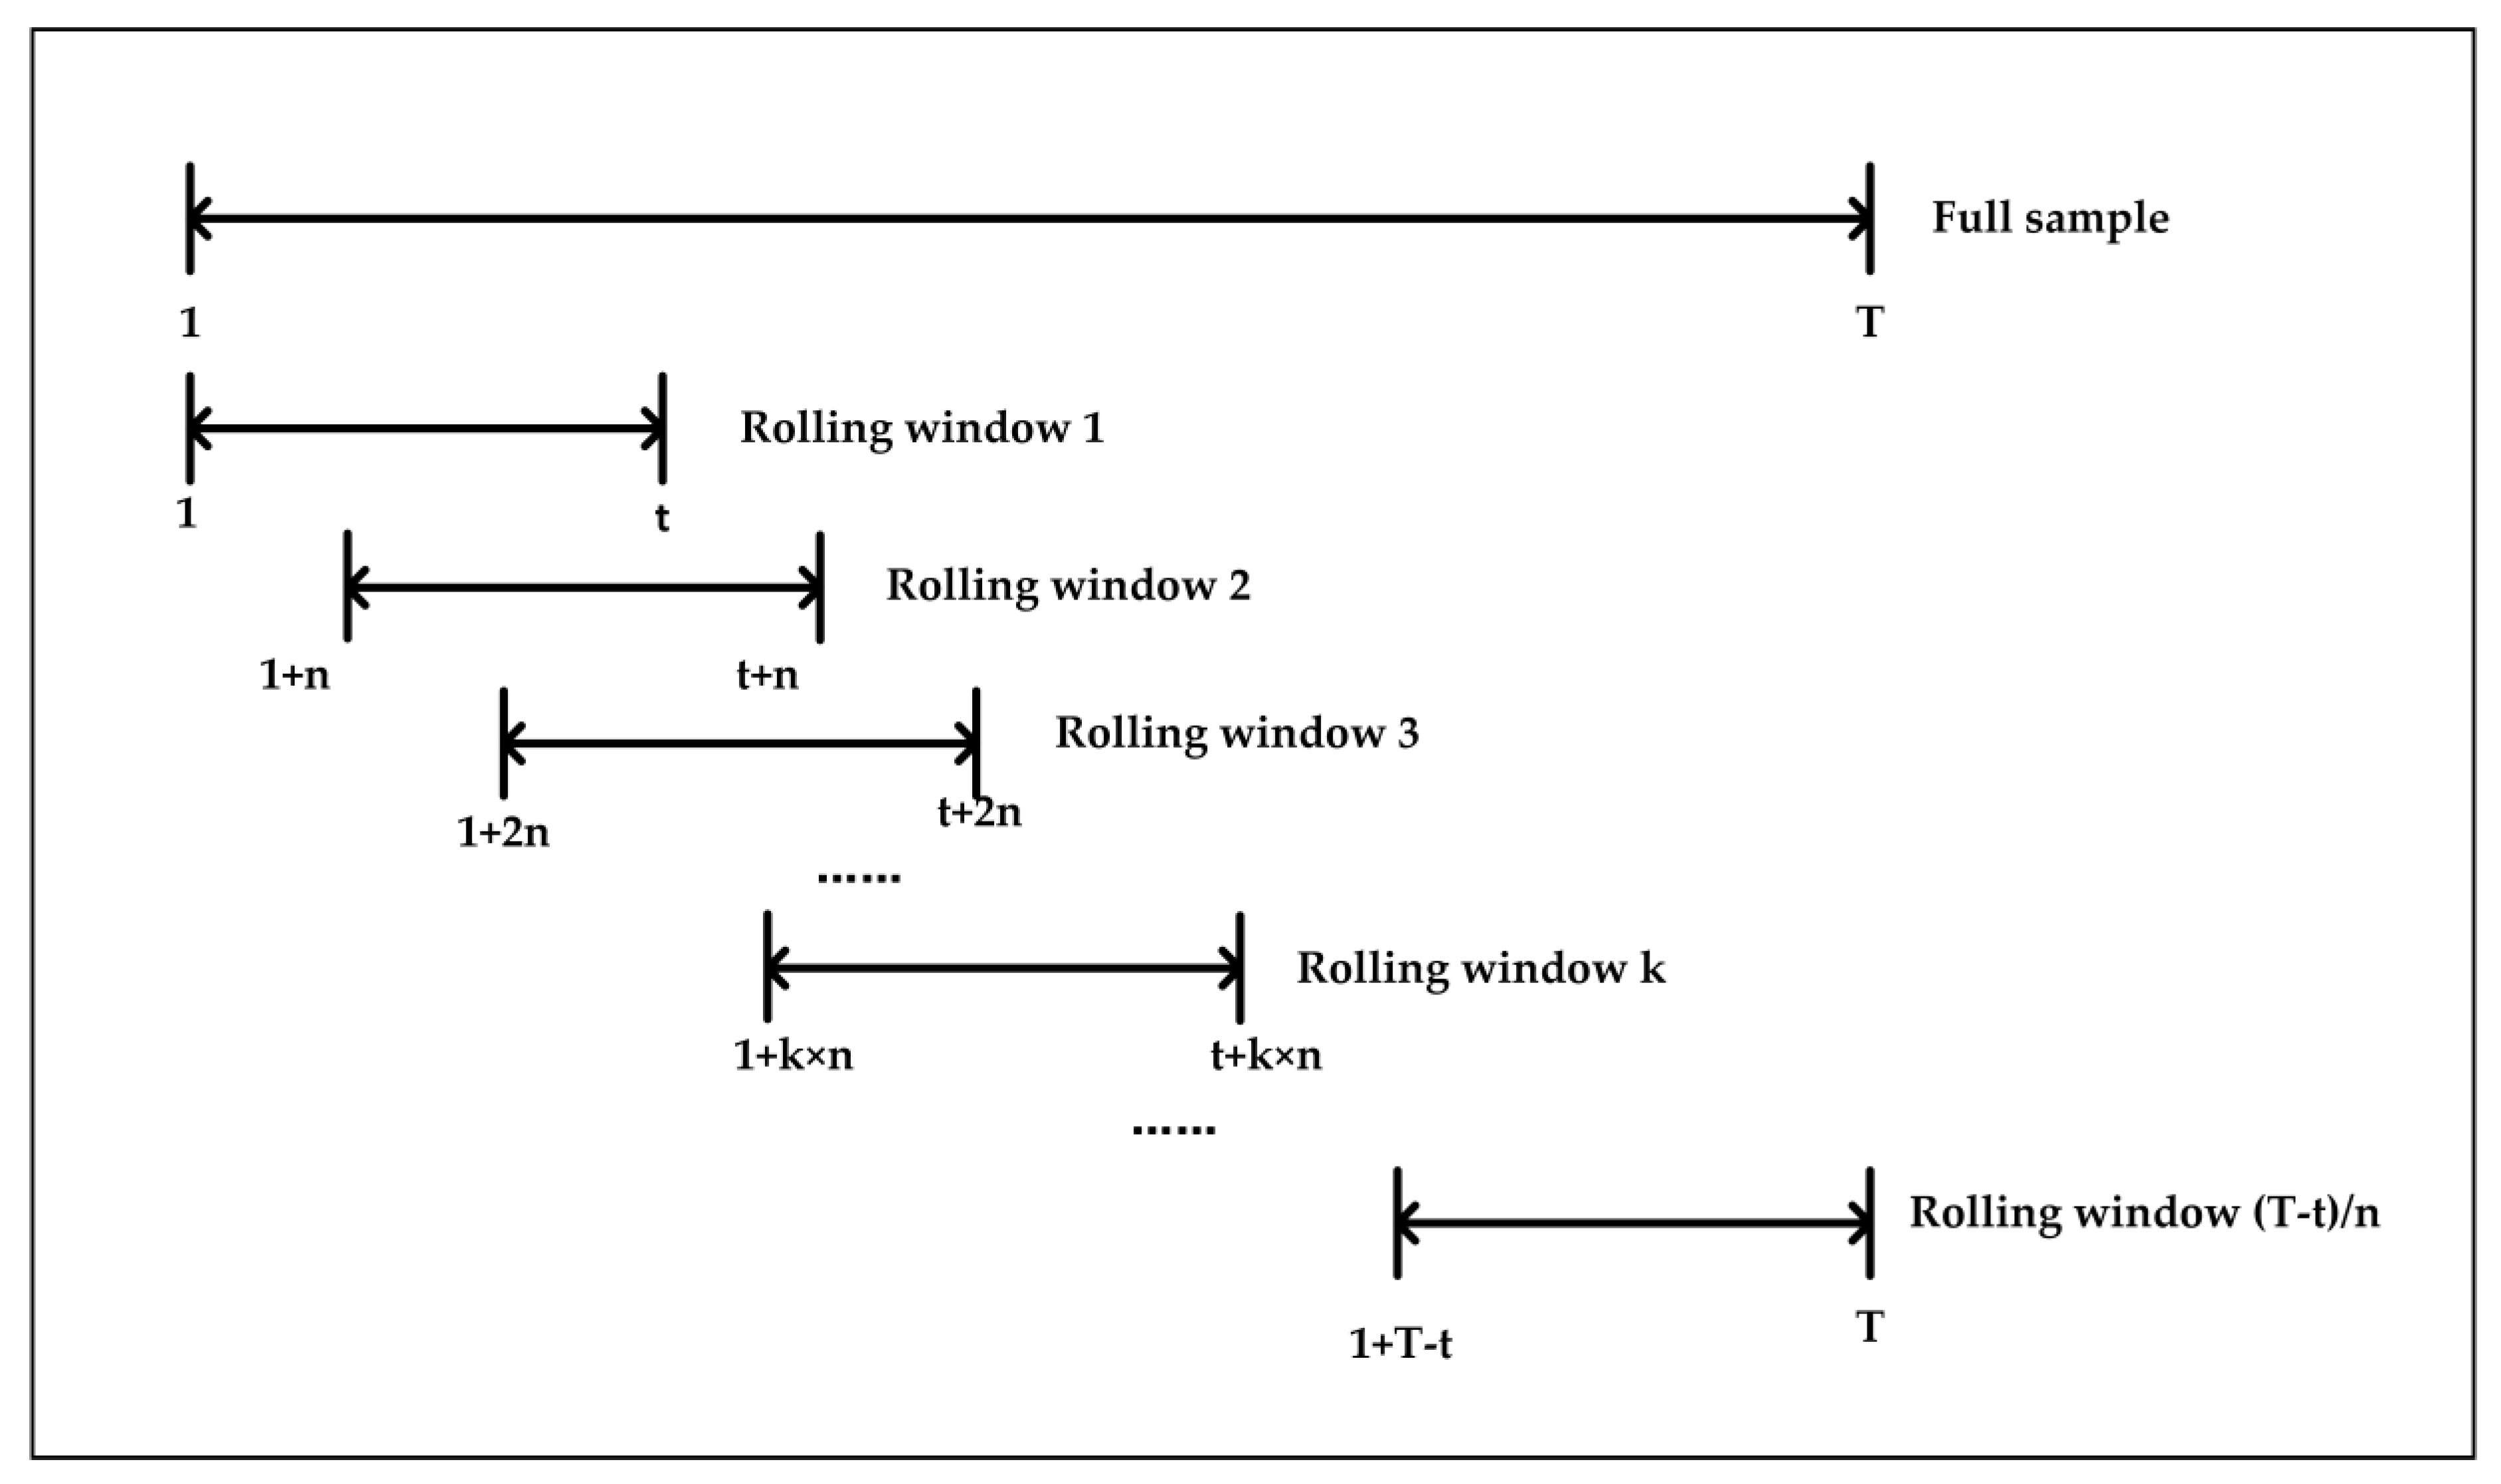
2.2.2. The Rolling Window Method

By using the approach illustrated in Section 2.2.1, the static connectedness of the system over a period of time could be obtained. In order to study the dynamic characteristics of the connectedness, the method of rolling window was introduced. In this method, the full sample was first divided into several continuous and overlapped sub-samples, as shown in Figure 2. Then, the connectedness in every rolling window was calculated. Finally, a continuous time series of connectedness was obtained.

3. Empirical Analysis and Discussion

In order to analyze the static and dynamic spillover effect of the carbon-power system, an empirical study was conducted in this section, and the full sample period was from 23 June 2014, to 14 June 2019.

3.1. Static Connectedness Analysis

After performing stationarity analysis on the time series of carbon price returns and stock price returns, we established a VAR model with a lag period of 3 and conducted 10-period-ahead forecasting error variance decomposition to obtain the spillover matrix between variables, as shown in Table 4.
Through the analysis of Table 4, we had seven main findings.
  • There was a significant system-wide spillover effect, and the variables of the carbon-power system were closely connected. The TSI was 60.5735%, which indicates that, on the whole, 60.5735% of the changes of the variables in the system could be explained by the changes of other variables in the system. As to each variable, it was found that all the variables gained more spillovers from others than themselves except for carbon price and Beijing Jingneng Clean Energy Co. Ltd. (BJCE). The spillovers carbon price and BJCE gains from the system were 35.3618% and 35.9368%, respectively, and others gained more than 60% from the system.
  • There were weak bidirectional spillovers between the carbon market and the electricity market, and the spillover effect was asymmetric. A total of 35.3618% of the changes of carbon price returns could be explained by the changes of power companies’ stock price returns, while the changes of the carbon price returns only contributed to the changes of power companies’ stock price returns by 0.0541%.
  • According to the second finding, the net connectedness of the carbon market was 35.3076% (35.3618% minus 0.0541%). This indicates that China’s carbon market mainly received information from the electricity market during the sample period, but transmitted less information to the electricity market. This was consistent with the results of the research of Ji et al. on EU CET [13]. The stock price of power enterprises can provide some information for the change of carbon price, and future research on carbon price should also take financial market factors into consideration.
  • BJCE only gained 35.9368% of spillovers from the system, which was far lower than that of the other nine companies. It was found that although the BJCE’s spillovers from carbon price was relatively low, the gap between BJCE’s and other power enterprises’ was very small. The main reason for its low spillovers was that it obtained less spillovers from other power enterprises. We therefore suppose that BJCE is weakly related to the other enterprises in the sample, and this assumption was supported by some information in its annual report. According to BJCE’s 2018 annual report, BJCE’s holding installed capacity in Beijing was 4702 MW, accounting for 54.25% of its total holding installed capacity. Its power generation accounted for more than 50% of Beijing’s gas-fired power generation and more than 60% of central heating. Furthermore, BJCE states that focusing on Beijing and surrounding areas is an important part of its development strategy.
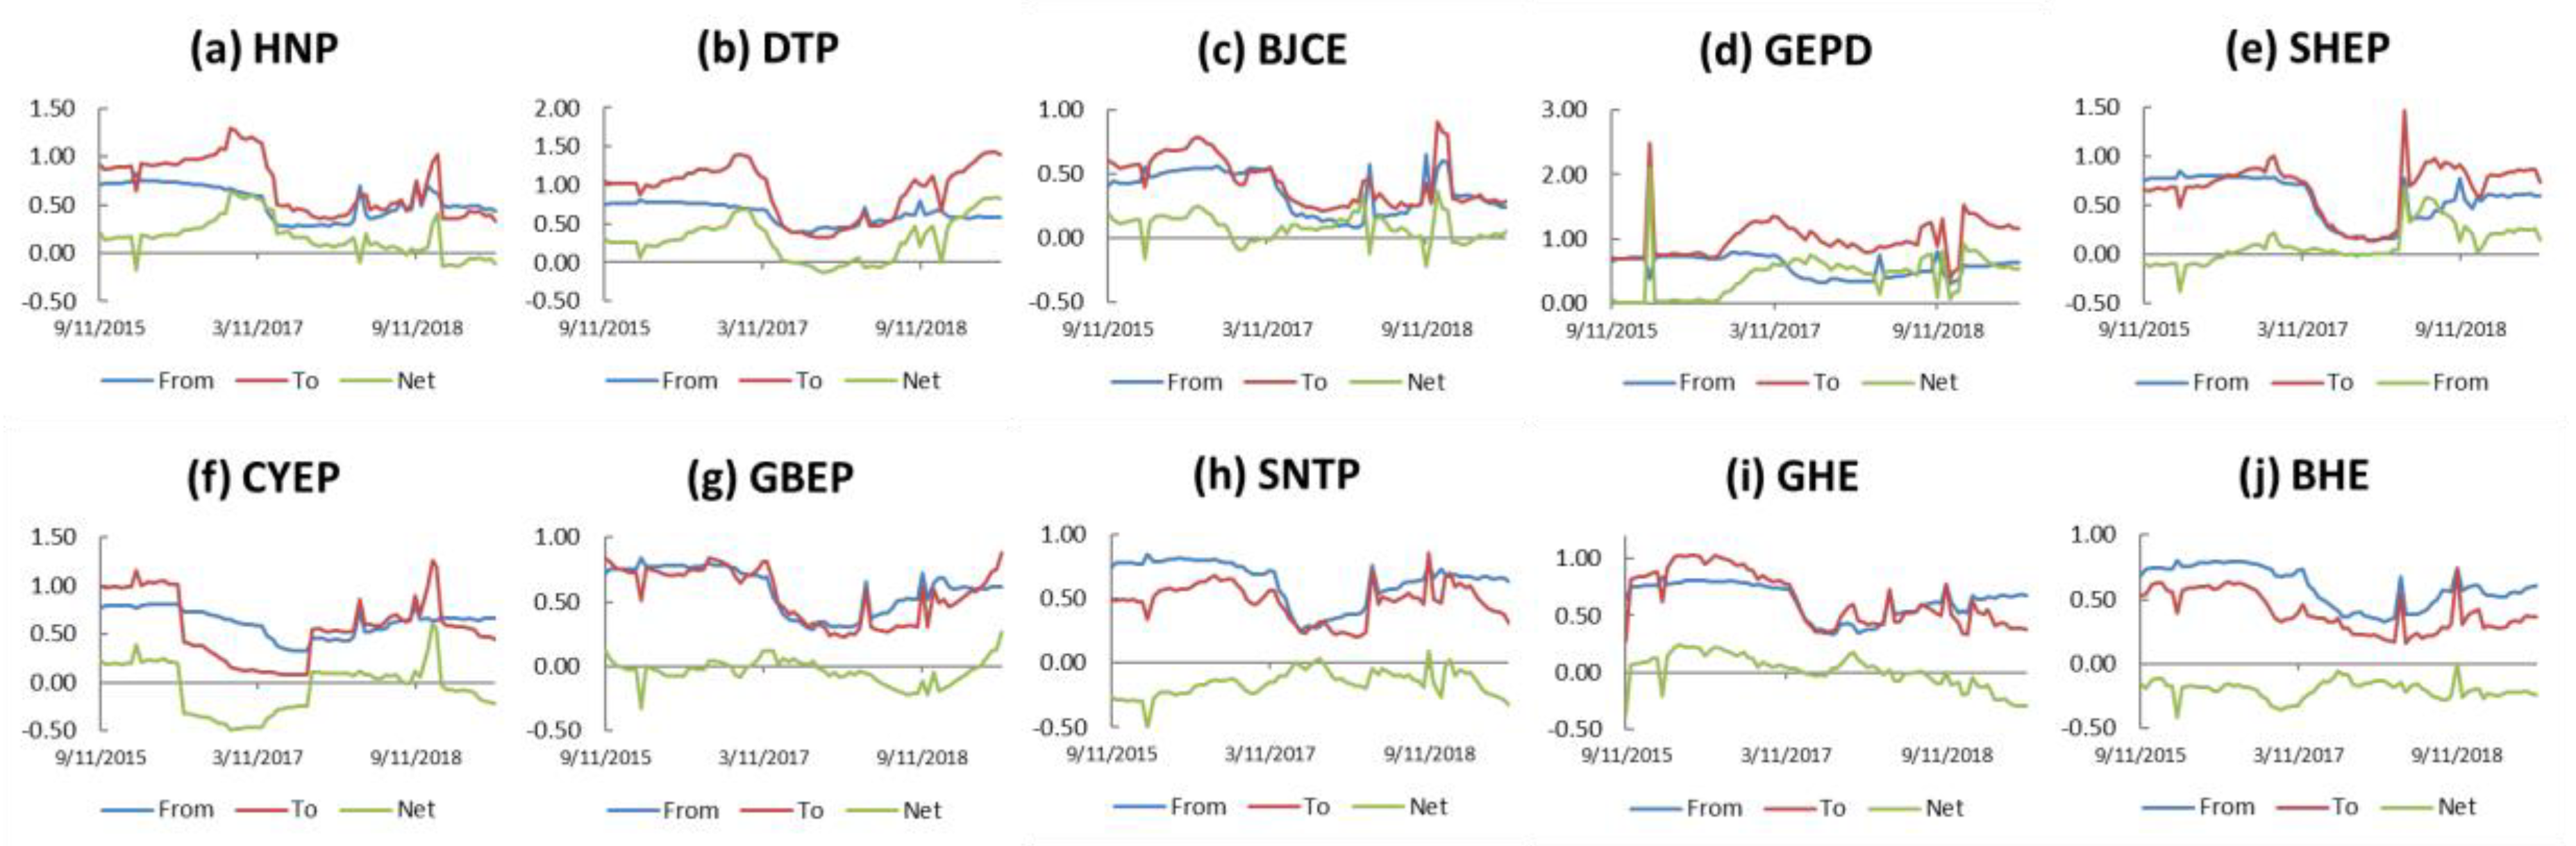
  • From the perspective of net connectedness, carbon, GHE, Shenzhen Nanshan Thermal Power Co. Ltd. (SNTP), Binhai Energy Development Co. Ltd. (BHE), and CYEP are information receivers, and Huaneng Power International INC. (HNP), Datang International Power Generation Company (DTP), BJCE, Guangdong Electric Power Development Co. Ltd. (GEPD), Shanghai Electric Power Co. Ltd. (SHEP), and Guangdong Baolihua Electric Power Co. Ltd. (GBEP) are information transmitters. For information transmitters, their stock returns are less likely to be affected by carbon price returns and other enterprises’ stock price returns. They play a leading role in the system to some extent. For information receivers, their stock returns are more likely to be affected by carbon price returns and other enterprises’ stock price returns. As a result, they face more uncertainty.
  • The interactions between the power enterprise and the carbon-power system may be related to its total holding installed capacity. According to Table 1, the information transmitters in the system were in a leading position in terms of total installed holding capacity, while SNTP and GHE, with the smallest capacity, were information receivers.
  • The interactions between power enterprises and the carbon-power system may be related to the degree of power enterprises’ dependence on renewable energy to generate electricity. As shown in Table 1, the proportions of information transmitters’ renewable energy holding installed capacity were at a very high or high level. The enterprises with very high, high, and medium levels of renewable energy holding installed ratios were information transmitters, while the renewable energy installed ratios of information receivers were at a low or very low level. This finding indicates that the stock price returns of power enterprises with a higher proportion of renewable energy installed are less likely to be affected by carbon price returns and stock price returns of other enterprises, and, thus, they are less likely to be exposed to uncertainty in the carbon-power system. This suggests that increasing the proportion of the renewable energy installed is helpful for power enterprises to reduce their risks.
We also calculated the net spillover between every two variables based on Table 4: that is, d ˜ j i H d ˜ i j H , as shown in Table 5. To more visually represent the spillover between every two variables and determine the direction of information flow, we depict it in Figure 3. From Figure 3, we obtained some new findings: i) DTP was an information transmitter for every other variable, and played a leading role in the system to some extent; ii) the net spillover of carbon price to each power company’s stock price was negative: that is, the carbon price was an information receiver for all power companies. This also confirms our finding that the carbon market is a net receiver of information for the electricity market. Our research results suggest that the CET market in China has not yet had the expected impact on power companies, which may be due to the low price and loose allocation of allowances.

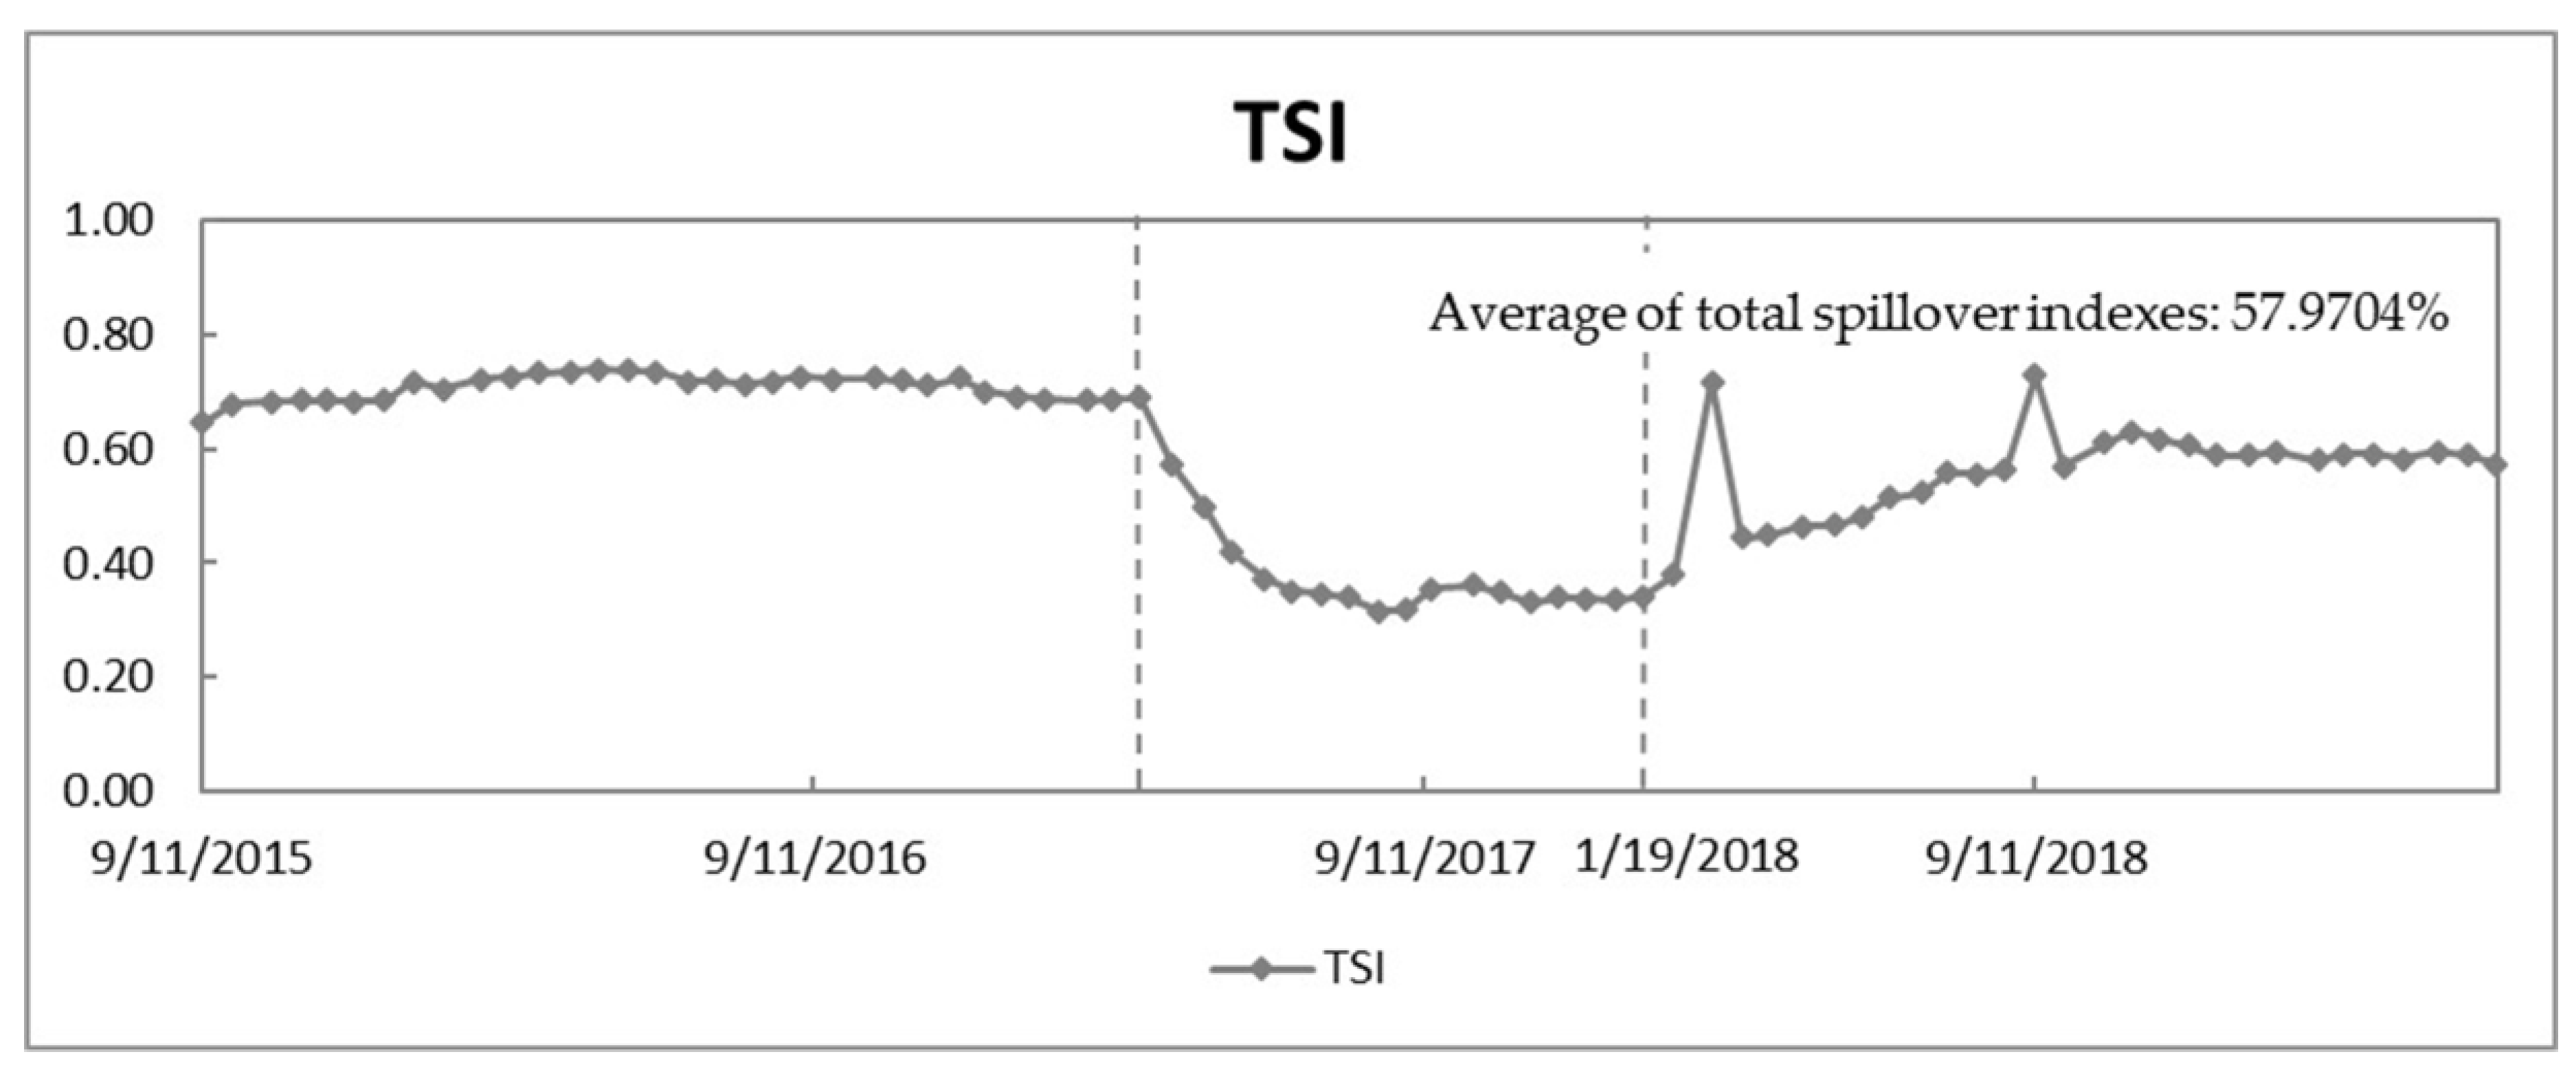
3.2. Dynamic Connectedness Analysis

In the full sample period, China’s CET market and financial market experienced some volatility, which may have had an impact on the connectedness in the system. Therefore, we studied the dynamic connectedness of the carbon-power system during this period using the rolling window method.
Referring to the research of Zhang et al. [26], we chose a quarter of the full sample as the size of the rolling window (302 observations), and obtained enough rolling windows to establish VAR models. The time series of the TSI under all rolling windows are depicted in Figure 4.
It can be seen from Figure 4 that the total spillover index changed with time, with the highest value reaching 73.8364% on 5 May 2016, and the lowest value reaching 31.6419% on 14 August 2017. The average value of total spillover indexes under all the rolling windows was 57.9704%, indicating the high level of information spillover in the system on average. It is worth noting that the average value of the total spillover index under the rolling window method was not the same as the static total spillover index. It was the average value of the total spillover index obtained in a series of overlapped sample periods. During the first stage, the spillover index of the sub-samples was above 60% and the trend was relatively stable. At the beginning of the second stage, the spillover index experienced a significant decline and gradually fell to the bottom. The spillover index gradually fell from 68.78% at the beginning of this stage to about 35%, and continued to the end of this stage. The third stage generally showed a trend of slow recovery, and finally returned to about 60%, but it did not return to the level of the first stage until the end of the stage.
Comparing the changes of the dynamic spillover index and the development and changes of the CET market and the financial market, it can be seen that connectedness has a certain correlation with the carbon market and the financial market:
  • In the first stage, from the end of 2015 to the beginning of 2017, the spillover index was generally at a relatively stable and relatively high level. During this period, China’s carbon trading market was very active, and both the volume and the price of carbon quota spot trading showed an upward trend with an obvious growth rate. In addition, the high spillover index during this period was also related to financial markets. In 2015, China’s stock market experienced several market shocks. In the first half of 2015, China’s stock market experienced a period of continuous rise, but from June to August, the stock market suffered a rare consecutive slump, with the Shanghai stock exchange composite index dropping by more than 40% from its highs. The impact of this incident lasted for a long time until the stock market gradually stabilized in 2016. When financial markets are more volatile, the connections between financial market participants are also strengthened, which also leads to a higher spillover effect of the carbon-power system.
  • In the second stage, the spillover index had a significant decline after March 2017, and reached its lowest level during this period. During this year, the carbon trading market was less active. It was found that the total trading volume of carbon quota spot and its growth rate declined compared with 2015 and 2016.
  • In the third stage, the spillover index showed a slow upward trend on the whole, during which China started the construction of a national carbon trading market and the total carbon trading volume picked up. In this stage, there were two spikes.
    (a)
    The first spike may have been affected by the release of the policy to construct the national CET market in China and a series of carbon emission verification activities. Since the end of 2017, China has begun the construction of a national CET market, and a series of policies and measures have been introduced in the following months. In December 2017, the National Development and Reform Commission (NDRC) announced the National Carbon Emission Trading Market Construction Plan (Power Generation Industry), which proposed to first launch the national CET market in the power industry. This policy released a very important message that the construction process of the CET market was going to be further promoted, which greatly strengthened the information flow in the carbon-power system. In addition, the NDRC issued a document in February 2018, requiring local governments to strictly check the carbon emission data of key enterprises in 2016 and 2017, which promoted power enterprises to actively participate in CET market to meet the allowance target.
    (b)
    The second spike may have been caused by the active allowance transactions. First, the regulated enterprises in the CET market in China have little incentive to engage in allowance trading and tend to make transactions close to the deadline of the compliance period. The deadline of the compliance period in pilot markets in 2018 was from May to July, and transactions during these months were very active. Second, the transactions were very active during September 2018, to October 2018, according to the market liquidity index of China’s CET market. (The index was released by the Beijing Green Finance Association. It was calculated based on the daily transaction volume of allowances in Shenzhen, Beijing, Shanghai, Tianjin, Guangdong, and Chongqing pilot markets, which reflects the activity of allowance transactions.) The index reached much higher levels during September and October than other periods. The active transactions in the CET market can enhance the interactions between the enterprises, as well as the information exchange in the system.
The dynamic connectedness of the CET market is depicted in Figure 5. It can be seen that the spillover level of carbon prices to the system was very low most of the time, but a relatively high degree of spillover occurred twice. This indicates that although carbon price had a very low spillover degree to the system in the long run, the CET market may have a great impact on the system in the short run. Since the spillover of the power market to the CET market was always higher than that of the CET market to the power market during the sample period, the net spillover of the carbon market was negative: that is, the CET market was an information receiver for the power market during all sub-sample periods.
Similarly, we obtained the dynamic connectedness of each power enterprise, which is depicted in Figure 6a–j. We found that the connectedness of power enterprises was time-varying, and different enterprises had different dynamic behavior, which indicated that the interaction patterns between power enterprises and the carbon-power system were different. It was also found that most companies had both positive and negative net connectedness, except for BHE and GEPD. BHE only had negative net connectedness, and GEPD only had positive net connectedness. Moreover, it can be found that power enterprises with large total installed holding capacity had a large proportion of positive net connectedness under sub-samples, such as HNP, DTP, BJCE, GEPD, and SHEP. This finding supports the findings in Section 3.1 Static Connectedness Analysis that the total installed holding capacity of power enterprises is one of the factors influencing their information interactions in the carbon-power system.

4. Conclusions

This paper uses a VAR-based connectedness network approach and the rolling window approach to examine the spillover effect between China’s CET market and power sector. To the best of our knowledge, this paper might be the first study to study the spillover effect between these two markets in China.

4.1. Main Findings

We have mainly obtained the following four research findings.
  • The spillover effect of this carbon-power system is relatively strong. This shows that the CET market and power companies are closely connected, and the emission trading policy has worked in China.
  • There is a weak spillover effect between the CET market and the power sector in China, and the CET market is a net receiver of the information from the power sector. This means that the information in the CET market cannot be quickly incorporated into the stock price of power companies, and the effectiveness of the policy still needs to be improved.
  • Through the analysis of dynamic connectedness, we found that, although the spillover of the CET market to the power sector is very low most of the time, the CET market occasionally generates a high degree of spillover for the power sector, which company managers and financial market participants should pay attention to.
  • From the perspective of the company level, we found that the interactions between the power company and the carbon-power system—that is, whether it is mainly affected by the system or plays a leading role in the system—may be related to the power generation capacity or energy mix of the power company.

4.2. Implications and Suggestions

To improve the current less effective policy, there are five policy recommendations for the government.
  • Set the total volume of allowances at national level and allocate them according to certain standards. In Phase I and Phase II of the EU CET market, the total volume of allowances—the emission cap—and allocation scheme were mainly set by the members of the market, which caused the over-allocation of allowances. To solve the problem, National Allocation Plans (NAPs) were canceled in Phase III, the cap was determined at the EU level, and a single set of rules were adopted to govern their allocations [37]. China should also set the emission cap at a national level and allocate allowances to different areas based on certain standards, which might be applicable for other countries or regions that plan to establish the CET market.
  • Gradually reduce the proportion of free allowance and increase the proportion of auctioned allowances. Compared to the free allocation of allowances, the auction is more efficient, as it is beneficial for allocating allowances to the agents who need them most [38]. For the CET market in China, only the Hubei and Guangdong pilot market has adopted the auction method, and the proportion of auctioned allowances is very low. The CET market in China should gradually increase the proportion of auctioned allowances to improve the efficiency of allowances allocation. Other countries or regions can also consider increasing the proportion of auctioned allowances with the development of the market to promote enterprises to reduce carbon emissions.
  • Adopt the benchmarking method to allocate free allowance. The grandfathering method was widely adopted by the members of EU CET market in Phase I and Phase II to allocate allowances, which is not conducive to promoting enterprises to invest in low-carbon technology. In Phase III, the benchmarking method was adopted, which can overcome the shortcomings of the grandfathering method. In China, the benchmarking method should be adopted to allocate free allowances before all the allowances are auctioned.
  • Promote the marketization of electricity prices. CET internalizes the external environmental cost, which increases the cost of regulated companies. However, the regulated electricity price in China has not incorporated an emission reduction cost, which damages the motivation of power companies actively involved in the CET market. Other countries with regulated electricity prices can also promote the power enterprises to participate in carbon trading through price marketization.
  • Improve the efficiency and transparency of information disclosure. Timely and transparent information can help regulated enterprises better understand the policies and market situations and provide an incentive for the companies to actively participate in carbon trading.
For the regulated power companies, they should enhance their awareness of emission reduction. In this paper, we found that although the carbon trading market in China has little impact on power enterprises, it sometimes has a large spillover effect on enterprises. As the CET market continues to mature, power enterprises should actively carry out research and development of energy conservation and emission reduction technologies, accumulate practical experience of participating in carbon trading, and cultivate relevant professionals.
For the investors in the financial market of power companies, they should pay more attention to the CET market when they make strategic decisions.

4.3. Limitations and Future Research

In this paper, it was found that the total holding installed capacity and renewable energy installed ratio may affect the spillover effect between power companies and carbon-power systems. However, we are not able to further verify the relationship between the proportion of renewable energy installed and the spillover effect of enterprises. This is because, on the one hand, the number of listed power enterprises participating in CET is still small, and the samples are not enough; on the other hand, the carbon disclosure system in China’s CET market is immature, and the information available is very limited. As more data become available, the impact of total holding installed capacity and the proportion of renewable energy installed on the interactions between power companies and carbon-power systems can be further investigated. Moreover, based on the study of dynamic connectedness, the hedging strategy between the CET market and financial market of power companies is worth being investigated.

Author Contributions

Y.L. presented the subject of the paper and gave some important support; D.N. put forward the idea of the article, conducted the empirical analysis, and wrote the original manuscript; B.L. provided some significant guidance; X.L. provided some advice and revised the manuscript. All authors have read and approved the final manuscript.

Funding

This research was funded by the “Natural Science Foundation of China Project” (Grant No. 71471058) and the “Beijing social science foundation research base project” (Grant No. 17JDGLA009).

Conflicts of Interest

The authors declare no conflict of interest.

References

  1. Zhang, Y.J.; Peng, Y.L.; Ma, C.Q.; Shen, B. Can Environmental Innovation Facilitate Carbon Emissions Reduction? Evidence from China. Energy Policy 2017, 100, 18–28. [Google Scholar] [CrossRef]
  2. Riti, J.S.; Song, D.; Shu, Y.; Kamah, M. Decoupling CO2 Emission and Economic Growth in China: Is There Consistency in Estimation Results in Analyzing Environmental Kuznets Curve? J. Clean. Prod. 2017, 166, 1448–1461. [Google Scholar] [CrossRef]
  3. Lin, B.; Chen, Y. Dynamic Linkages and Spillover Effects between CET Market, Coal Market and Stock Market of New Energy Companies: A Case of Beijing CET Market in China. Energy 2019, 172, 1198–1210. [Google Scholar] [CrossRef]
  4. Aatola, P.; Ollikainen, M.; Toppinen, A. Impact of the Carbon Price on the Integrating European Electricity Market. Energy Policy 2013, 61, 1236–1251. [Google Scholar] [CrossRef]
  5. Pereira, C.J.; Pereira, P. European Union Emissions Trading Scheme Impact on the Spanish Electricity Price during Phase II and Phase III Implementation. Util. Policy 2015, 33, 54–62. [Google Scholar] [CrossRef]
  6. Zachmann, G.; von Hirschhausen, C. First Evidence of Asymmetric Cost Pass-through of EU Emissions Allowances: Examining Wholesale Electricity Prices in Germany. Econ. Lett. 2008, 99, 465–469. [Google Scholar] [CrossRef] [Green Version]
  7. Alberola, E.; Chevallier, J.; Chèze, B. Price Drivers and Structural Breaks in European Carbon Prices 2005–2007. Energy Policy 2008, 36, 787–797. [Google Scholar] [CrossRef]
  8. Boersen, A.; Scholtens, B. The Relationship between European Electricity Markets and Emission Allowance Futures Prices in Phase II of the EU (European Union) Emission Trading Scheme. Energy 2014, 74, 585–594. [Google Scholar] [CrossRef]
  9. Zhu, B.; Ye, S.; Han, D.; Wang, P.; He, K.; Wei, Y.M.; Xie, R. A Multiscale Analysis for Carbon Price Drivers. Energy Econ. 2019, 78, 202–216. [Google Scholar] [CrossRef]
  10. Keppler, J.H.; Mansanet-Bataller, M. Causalities between CO2, Electricity, and Other Energy Variables during Phase I and Phase II of the EU ETS. Energy Policy 2010, 38, 3329–3341. [Google Scholar] [CrossRef] [Green Version]
  11. Zhu, B.; Han, D.; Chevallier, J.; Wei, Y.M. Dynamic Multiscale Interactions between European Carbon and Electricity Markets during 2005–2016. Energy Policy 2017, 107, 309–322. [Google Scholar] [CrossRef]
  12. Ji, Q.; Xia, T.; Liu, F.; Xu, J.H. The Information Spillover between Carbon Price and Power Sector Returns: Evidence from the Major European Electricity Companies. J. Clean. Prod. 2019, 208, 1178–1187. [Google Scholar] [CrossRef]
  13. Oberndorfer, U. EU Emission Allowances and the Stock Market: Evidence from the Electricity Industry. Ecol. Econ. 2009, 68, 1116–1126. [Google Scholar] [CrossRef] [Green Version]
  14. Veith, S.; Werner, J.R.; Zimmermann, J. Capital Market Response to Emission Rights Returns: Evidence from the European Power Sector. Energy Econ. 2009, 31, 605–613. [Google Scholar] [CrossRef]
  15. Mo, J.L.; Zhu, L.; Fan, Y. The Impact of the EU ETS on the Corporate Value of European Electricity Corporations. Energy 2012, 45, 3–11. [Google Scholar] [CrossRef]
  16. Moreno, B.; Pereira, P. How Do Spanish Polluting Sectors’ Stock Market Returns React to European Union Allowances Prices ? A Panel Data Approach. Energy 2016, 103, 240–250. [Google Scholar] [CrossRef]
  17. da Silva, P.P.; Moreno, B.; Figueiredo, N.C. Firm-Specific Impacts of CO2 Prices on the Stock Market Value of the Spanish Power Industry. Energy Policy 2016, 94, 492–501. [Google Scholar] [CrossRef]
  18. Tian, Y.; Akimov, A.; Roca, E.; Wong, V. Does the Carbon Market Help or Hurt the Stock Price of Electricity Companies? Further Evidence from the European Context. J. Clean. Prod. 2016, 112, 1619–1626. [Google Scholar] [CrossRef] [Green Version]
  19. Cong, R.; Wei, Y. Potential Impact of (CET) Carbon Emissions Trading on China’s Power Sector: A Perspective from Different Allowance Allocation Options. Energy 2010, 35, 3921–3931. [Google Scholar] [CrossRef]
  20. Lin, B.; Jia, Z. Impacts of Carbon Price Level in Carbon Emission Trading Market. Appl. Energy 2019, 239, 157–170. [Google Scholar] [CrossRef]
  21. Zhang, L.; Li, Y.; Jia, Z. Impact of Carbon Allowance Allocation on Power Industry in China’s Carbon Trading Market: Computable General Equilibrium Based Analysis. Appl. Energy 2018, 229, 814–827. [Google Scholar] [CrossRef]
  22. Li, W.; Zhang, Y.; Lu, C. The Impact on Electric Power Industry under the Implementation of National Carbon Trading Market in China: A Dynamic CGE Analysis. J. Clean. Prod. 2018, 200, 511–523. [Google Scholar] [CrossRef]
  23. Zhang, F.; Fang, H.; Wang, X. Impact of Carbon Prices on Corporate Value: The Case of China’s Thermal Listed Enterprises. Sustainability 2018, 10, 3328. [Google Scholar] [CrossRef] [Green Version]
  24. Wen, F.; Wu, N.; Gong, X. China’s Carbon Emissions Trading and Stock Returns. Energy Econ. 2020, 86, 104627. [Google Scholar] [CrossRef]
  25. Diebold, F.X.; Yılmaz, K.; Lynch, M.; Gregory, P. On the Network Topology of Variance Decompositions: Measuring the Connectedness of Financial Firms. J. Econ. 2014, 182, 119–134. [Google Scholar] [CrossRef] [Green Version]
  26. Zhang, D. Oil Shocks and Stock Markets Revisited: Measuring Connectedness from a Global Perspective. Energy Econ. 2017, 62, 323–333. [Google Scholar] [CrossRef]
  27. Aromi, D.; Clements, A. Spillovers between the Oil Sector and the S&P500: The Impact of Information Flow about Crude Oil. Energy Econ. 2019, 81, 187–196. [Google Scholar] [CrossRef]
  28. Maghyereh, A.I.; Awartani, B.; Bouri, E. The Directional Volatility Connectedness between Crude Oil and Equity Markets: New Evidence from Implied Volatility Indexes. Energy Econ. 2016, 57, 78–93. [Google Scholar] [CrossRef] [Green Version]
  29. Ma, Y.R.; Zhang, D.; Ji, Q.; Pan, J. Spillovers between Oil and Stock Returns in the US Energy Sector: Does Idiosyncratic Information Matter? Energy Econ. 2019, 81, 536–544. [Google Scholar] [CrossRef]
  30. Apergis, N.; Baruník, J.; Lau, M.C.K. Good Volatility, Bad Volatility: What Drives the Asymmetric Connectedness of Australian Electricity Markets? Energy Econ. 2017, 66, 108–115. [Google Scholar] [CrossRef]
  31. Zhang, D.; Ji, Q.; Kutan, A.M. Dynamic Transmission Mechanisms in Global Crude Oil Prices: Estimation and Implications. Energy 2019, 175, 1181–1193. [Google Scholar] [CrossRef]
  32. Restrepo, N.; Uribe, J.M.; Manotas, D. Financial Risk Network Architecture of Energy Firms. Appl. Energy 2018, 215, 630–642. [Google Scholar] [CrossRef]
  33. Diebold, F.X.; Yilmaz, K. Measuring financial asset return and volatility spillovers, with application to global equity markets Francis. Econ. J. 2009, 119, 158–171. [Google Scholar] [CrossRef] [Green Version]
  34. Diebold, F.X.; Yilmaz, K. Better to Give than to Receive: Predictive Directional Measurement of Volatility Spillovers. Int. J. 2012, 28, 57–66. [Google Scholar] [CrossRef] [Green Version]
  35. Koop, G.; Pesaran, M.H.; Potter, S.M. Impulse Response Analysis in Nonlinear Multivariate Models. J. Econ. 1996, 74, 119–147. [Google Scholar] [CrossRef]
  36. Pesaran, H.H.; Shin, Y. Capital Taxation and Production Efficiency in an Open Economy. Econ. Lett. 1999, 62, 85–90. [Google Scholar]
  37. Verde, S.F.; Teixidó, J.; Marcantonini, C.; Labandeira, X. Free Allocation Rules in the EU Emissions Trading System: What Does the Empirical Literature Show? Clim. Policy 2019, 19, 439–452. [Google Scholar] [CrossRef]
  38. Cong, R.G.; Wei, Y.M. Experimental Comparison of Impact of Auction Format on Carbon Allowance Market. Renew. Sustain. Energy Rev. 2012, 16, 4148–4156. [Google Scholar] [CrossRef]
Figure 1. The carbon price return and power enterprise stock price returns. (a–k) plot price returns of carbon, Huaneng Power International INC. (HNP), Datang International Power Generation Company (DTP), Beijing Jingneng Clean Energy Co. Ltd. (BJCE), Guangdong Electric Power Development Co. Ltd. (GEPD), Shanghai Electric Power Co. Ltd. (SHEP), Guodian Changyuan Electric Power Co. Ltd. (CYEP), Guangdong Baolihua Electric Power Co. Ltd. (GBEP), Shenzhen Nanshan Thermal Power Co. Ltd. (SNTP), Guangzhou Hengyun Enterprises Holdings Ltd. (GHE), and Binhai Energy Development Co. Ltd. (BHE).
Sustainability 12 06573 g001
Figure 2. The illustration of data partitions in the rolling window approach.
Sustainability 12 06573 g002
Figure 3. The connectedness network of the carbon-power system. (Note: The edges represent the flow of information, and the direction of the arrows indicates the direction of information flow. The gray edge represents weak information transmission, blue represents medium information transmission, and purple represents strong information transmission. Each node represents a variable, with green as the net receiver and orange as the net transmitter.).
Sustainability 12 06573 g003
Figure 4. Total spillover index with rolling windows. (Note: According to the trend of total spillover index (TSI) time series, it is roughly divided into three stages. The first stage is from 11 September 2015, to 24 March 2017; the second stage is from 24 March 2017, to 19 January 2018; the third stage is from 19 January 2018, to 13 June 2019).
Sustainability 12 06573 g004
Figure 5. Dynamic connectedness of carbon price.
Sustainability 12 06573 g005
Figure 6. The dynamic connectedness of each power enterprise. (aj) plots the dynamic connectedness of HNP, DTP, BJCE, GEPD, SHEP, CYEP, GBEP, SNTP, GHE, and BHE.
Sustainability 12 06573 g006
Table 1. The basic information of listed electric power enterprises.
Stock CodeNameTotal Holding Installed Capacity (104 kW)Main Methods of Power GenerationRenewable Energy Installed Ratio Abbreviation
600011.SHHuaneng Power Internatinal INC.10,599,100.00 thermal
wind
solar
hydroelectric
biomass
MediumHNP
601991.SHDatang International Power Generation Company6,285,330.00 Thermal
wind
solar
hydroelectric
biomass
MediumDTP
00579.HKBeijing Jingneng Clean Energy Co. Ltd.866,700.00 thermal
wind
solar
hydroelectric
Very HighBJCE
000539.SZGuangdong Electric Power Development Co. Ltd.2095.00 thermal
wind
hydroelectric
LowGEPD
600021.SHShanghai Electric Power Co. Ltd.1500.25 thermal
wind
solar
HighSHEP
000966.SZGuodian Changyuan Electric Power Co. Ltd.369.43thermal
wind
biomass
LowCYEP
000690.SZGuangdong Baolihua Electric Power Co. Ltd.351.80thermal
wind
Very LowGBEP
000037.SZShenzhen Nanshan Thermal Power Co. Ltd.126.00 thermalVery LowSNTP
000531.SZGuangzhou Hengyun Enterprises Holdings Ltd.117.00 thermalVery LowGHE
000695.SZBinhai Energy Development Co. Ltd.-thermalVery LowBHE
Table 2. Summary descriptive statistics of carbon and stock price returns.
MeanMaximumMinimumStd. Dev.SkewnessKurtosisJarque-Bera
Carbon0.034372623.9094−634.53756.49274−0.00931045.686492,169.34 ***
HNP−0.01612010.57661−9.576242.3909040.4834608.1451151386.345 ***
DTP0.01073210.60281−9.646032.4486300.2820568.7491171687.994 ***
BJCE0.00689219.63214−9.592842.2969641.03752512.904685180.164 ***
GEPD0.06265813.19648−15.14612.065816−0.3815709.8520942404.407 ***
SHEP−0.05407010.54752−9.557522.9455990.1233627.295312936.3269 ***
CYEP0.00943274.76124−9.617023.5586757.713434163.28291,311,556 ***
GBEP−0.03991010.59121−9.576242.7764940.3375246.889662788.3495 ***
SNTP−0.08996010.57737−9.591213.5316830.0452095.075112218.2298 ***
GHE0.04709472.80714−9.595473.6261296.735767136.5029910,728.2 ***
BHE−0.00009810.57553−9.568653.3191370.2125395.332773284.4058 ***
Note: *** denotes significance at the 1% level.
Table 3. The connectedness table.
y 1 y 2 y k From
y 1 d ˜ 11 H d ˜ 12 H d ˜ 1 k H F r o m 1
y 2 d ˜ 21 H d ˜ 22 H d ˜ 2 k H F r o m 2
y k d ˜ k 1 H d ˜ k 2 H d ˜ k k H F r o m k
To T o 1 T o 2 T o k TSI
Net T o 1 F r o m 1 T o 2 F r o m 2 T o k F r o m k
Table 4. The static return connectedness matrix for full sample.
VariableCarbonHNPDTPBJCEGEPDSHEPCYEPGBEPSNTPGHEBHEFrom
Carbon0.6463820.0493680.0209180.0124670.0261250.0543050.0529760.0574390.0169040.0261610.0369550.353618
HNP0.0000250.3705180.1876970.0425760.1210130.0801560.0467940.0644180.0321860.0268830.0277330.629482
DTP0.0000380.1636460.3101570.0447710.1362320.0979590.0542780.0714710.0439050.0386000.0389420.689843
BJCE0.0000200.0518460.0626350.6406320.0460640.0366660.0249960.0410930.0277410.0281280.0401790.359368
GEPD0.0000410.1074780.1365100.0337280.3633320.0928310.0495250.0924510.0486220.0391000.0363830.636668
SHEP0.0000560.0984030.1382710.0428680.1308790.3045320.0540690.0852480.0589410.0372530.0494810.695468
CYEP0.0000110.0879880.1177420.0425050.1100760.0808260.3276610.0893020.0491590.0465670.0481640.672339
GBEP0.0001420.0802200.0995230.0476250.1296210.0832100.0574490.3321300.0609790.0429790.0661220.667870
SNTP0.0000530.0636630.0995390.0570280.1091840.0888880.0506740.1024210.3116390.0493010.0676110.688361
GHE0.0001160.0598150.0934160.0537540.1065580.0673530.0568630.0799570.0552930.3628460.0640280.637154
BHE0.0000400.0525960.0826920.0754810.0790950.0713740.0501420.1042400.0619340.0553180.3670900.632910
To0.0005410.8150221.0389430.4528030.9948470.7535670.4977660.7880390.4556650.3902900.475598TSI = 0.605735
Net−0.3530760.1855400.3491000.0934350.3581790.058099−0.1745740.120169−0.232696−0.246864−0.157313
Table 5. The net pairwise connectedness table of the 10 electric power enterprises.
VariableCarbonHNPDTPBJCEGEPDSHEPCYEPGBEPSNTPGHEBHE
Carbon −0.049343−0.020879−0.012447−0.026084−0.054249−0.052965−0.057297−0.016852−0.026045−0.036915
HNP −0.0240510.009270−0.013540.0182460.0411930.0158010.0314770.0329320.024863
DTP 0.0178640.0002790.0403120.0634640.0280520.0556340.0548160.043750
BJCE −0.0123360.0062020.0175080.0065320.0292870.0256260.035302
GEPD 0.0380480.0605520.0371700.0605620.0674590.042712
SHEP 0.026757−0.0020380.0299470.0301000.021893
CYEP −0.0318530.0015150.0102960.001978
GBEP 0.0414410.0369780.038117
SNTP 0.005992−0.005677
GHE −0.008710
BHE

