Abstract
The deep integration of information technology (IT) and the real economy contributes to China’s high-quality economic sustainable development. From the perspective of efficiency, this paper aims to build an evaluation index system, with 30 provinces in China from 2011 to 2017 being taken as the research objects, conduct static and dynamic analysis by using the super-efficiency data envelopment analysis (DEA)-Malmquist index, and draw a spatial distribution diagram to reflect its changes. This study reveals that the integrated development of information technology and the real economy is unbalanced in China. The eastern region performs better with a development slowdown, while the central and western regions lag behind with a lot of room for improvement. The effect of regional agglomeration is obvious, which can be evidenced by the fact that those provinces with a high-efficiency value produce a radiation effect on their neighboring provinces. On the whole, the total factor productivity is increasing annually, with the technical progress being the main factor that affects the total efficiency. According to the results, the countermeasures and suggestions are put forward in this paper to provide reference for a better sustainability development of information technology and the real economy.
1. Introduction
The rapid development of cloud computing, internet of things, artificial intelligence (AI) and the fifth generation of communication technology has spurred a deep integration of the new generation of information technology and the real economy in various fields. It vigorously promotes the transformation and upgrading of the economic structure and lays a foundation for a new round of technological revolution. The Report on the Work of the Government in 2019 demonstrates the coordinated development of new generation of information technology, for example, artificial intelligence, and the real economy. It advocates quickening the development of advanced manufacturing industry, with the real economy as its core, and to deepen the integration of the Internet, big data, artificial intelligence and the real economy. The proposal Guidance on Promoting the Integration of Artificial Intelligence and the Real Economy was adopted at the seventh session of the central committee for deepening overall reform, stating the task of promoting the integration of information technology and the real economy.
As the cornerstone of China’s economic development, the real economy is more than the core carrier of national economic growth, but also the main supplier of people’s production and living needs. Since the reform and opening up, China has relied on the third global industrial transfer and leveraged labor resources and cost advantages to become a manufacturing base and a real economy power. So far, the Chinese economy has entered into the late industrialization period where the tertiary industry is playing a leading role. Since the domestic industrial economy is composed of both the real economy and the virtual economy, the contribution of the real economy to the economic growth has declined, while the virtual economy, dominated by the real estate and financial industry, is witnessing a rapid expansion. In addition, China’s real economy is facing a series of problems, such as weakening domestic demand, declining external demand, rising production costs, heavy tax burden, and lower investment yields, etc. [1]. However, the development of information technology provides the overall revitalization of China’s real economy with technological support and reform opportunities. As one of the China’s seven major strategic emerging industries, the new generation of information technology can improve the efficiency of social productivity and social operation, and optimize the allocation of resources, thus propelling the upgrading of the traditional industry.
The deep integration of information technology with the real economy is an important way for China to achieve industrial innovation and an optimized structure. The integration means to widely apply information technology into key areas of the real economy, thus gradually improving the level of China’s industries from “made in China” to “intelligent manufacturing in China” [2]. The information technology is going through a dramatic change, from the original computer communication equipment to big data and cloud computing with artificial intelligence as the core. In the process of integrating information technology with the real economy, production efficiency will be greatly improved. On the one hand, it can promote the rapid upgrading of primary and secondary industries such as agriculture and manufacturing. On the other hand, it can catalyze the innovation of tertiary industries such as the service industry, artificial intelligence industry and Internet of Things ecology.
At present, China is vigorously developing the information technology industry, such as the fifth-generation mobile communication and artificial intelligence, which is taking the lead in the world. At the same time, the scope and depth of integration in various provinces and cities is also continuously increased. Therefore, to explore the integrated development of information technology and the real economy can expand the space for real economy development. It also plays an important role in the transformation of the real economy, providing some reference for high-quality economic development in the future.
2. Literature Review
The real economy is an important pillar of economic prosperity. The development of the real economy is the foundation of a country and the source of wealth. The real economy covers many sectors, including agriculture, industry, the transportation and communication industry, the commercial service industry, cultural industry and other material production and service departments [3,4,5]. It also includes the production and service departments of education, knowledge, information, art, sports and other spiritual products [6,7,8,9]. The real economy has been evaluated in several studies. In these studies, the real economy is exclusive of the real estate and financial market. For example, using the GDP that excludes the financial market and real estate to measure the growth of the regional real economy [10]. The real economy has always been the basis for the development of human society, If the production activities of the real economy cease, people’s consumption and needs will not be guaranteed.
The development of the real economy is affected by many factors, including the virtual economy, financial market, policy uncertainty, technological innovation and so on. The virtual economy will also affect the real economy. The research shows that strengthening the interaction between the real economy and the virtual economy can speed up the transition from the industrialization period to the financial economy [11]. Chandrasekhar [12] analyzed the interaction between finance and the real economy from a global perspective. The similar result is found Niang’s [13] study. Their findings indicated that close link between financial markets and the real economy increases the growth of the real economy in different regions. Moreover, foreign investment will also affect the real economy. Giwa et al. [14] conducted an empirical analysis of the importance of attracting foreign investment to the growth of Nigeria’s real economy. As for policy uncertainty, Belke et al. [15] pointed out that the uncertainty of the Brexit policy has even damaged the real economy in both the UK and other European countries. Dihle et al. [16] concluded that the two sources of uncertainty affecting the real economy are volatility risk and disaster risk. In addition, sovereign credit rating will also affect the real economy for the national sovereign rating reflects a country’s willingness and ability to repay debts. Chen et al. [17] analyzed the impact of the revision of sovereign credit rating on the growth rate of the real economy. Among them, technological innovation is the most critical factor. Long [18] found technological innovation has a positive impact on the development of local real economy. Technological innovation promotes the development of the real economy through the optimization and upgrading of consumption and investment [19]. The new generation of information technology has an increasing impact on the real economy.
Information technology is a general technology and the foundation of economic development [20]. The contribution of information technology to economic development was regarded as an important factor in the economic development of many countries and regions. Weber and Bussell [21] found that information technology contributed to significantly different outcomes in global economic power. Yousefi [22] verified the influence of information technology on economic development based on evidence from developed and developing countries. Jonathan et al. [23] acknowledged the importance of information technology (IT) in enabling global strategy, enhancing coordination and reducing costs. Haseeb et al. [24] concluded that the information and communication technologies can improve our environment in the era of globalization. Qureshi [25] explained the importance of information technology to economic development from the perspective of development. Narcyz et al. [26] provided a multi-dimensional framework to prove the role of information and communication technologies in socioeconomic development
The information technology is an important indicator of a country’s economic development [27]. The researchers took some developed or developing countries as the research object to demonstrate the role of information technology in economic development. Jorgenson et al. [28] found that the development of information technology promotes the US economic growth postwar. The Netherlands’ IT brings about a favorable production cost. Besides, IT leads to flexibility and improves the planning, organization and control of work. [29]. Ramlan and Ahmed [30] believed information technology (IT) is critical to Malaysia’s economic growth. In Africa, information technology affects the development of urban infrastructure, which contributes to the sustainable development of the African economy [31,32]. Malaquias [33] discussed the role of information technology for development in Brazil. Khuntia et al. [34] discussed that information technology can play an important role in managing operations that support environmentally sustainable growth.
Information technology is also very important to China’s economic development. The progress of information technology optimized China’s economic structure and attracted foreign investment. Zhao found that the information technology is deeply integrating with the manufacturing industry in China, which changes the traditional economic model and drives the manufacturing industry to become intelligent [35]. Based on a case study of information technology in China, Zeng et al. [36] proposed a geographically and temporally weighted regression to unveil the local variations in regional technological path-dependency. Zheng et al. [37] analyzed information technology has dramatically changed tourism industry, particularly in facilitating and improving information discovery and dissemination in tourism industry in china.
In recent years, with the penetration of information technology into the real economy, the relationship between them is getting closer. A series of studies, such as the smart economy, smart manufacturing and smart city, have emerged, which essentially relates to the interaction between information technology and the real economy [38,39]. On the one hand, artificial intelligence (AI) technology can upgrade the real economy and the AI industry can bring innovation to the real economy [40]. On the other hand, IT improves the manufacturing efficiency with the help of the Internet, big data, AI, agriculture and manufacturing. Lei and Li [41] put forward the notion that the integration of information technology and the real economy can create a new business model.
The degree of integration between information technology and the real economy is evaluated by efficiency. The data envelopment analysis (DEA) method is suitable for the efficiency evaluation of a complex system. There are some advantages of DEA. First, it can cover multiple input and output variables in an analysis. Secondly, it does not need to assume a specific function for the analysis model, because it is a non-parametric method [42]. However, the traditional DEA model cannot be further evaluated. Thus, Andersen and Petersen [43] put forward the super-efficiency DEA model, which makes the efficiency value of the effective unit greater than one, and all decision-making units have comparability. For example, Jiang [44] used super-efficiency DEA to measure industrial ecological efficiency. Zhu et al. [45] used the super-efficiency structural equation modeling (SEM) method of data envelopment analysis (DEA) to measure the land use efficiency of 35 large and medium-sized cities from 2007 to 2015. The Malmquist index can measure the growth of total factor productivity and can be decomposed into the product of technological change and efficiency change. It is used to analyze the main reasons for productivity change. Firsova and Chernyshova [46] calculated the efficiency of regional innovation development based on the DEA-Malmquist index.
To sum up, many scholars have conducted in-depth researches on information technology and the real economy themselves, and the researches on the integration of these two subjects basically focus on the qualitative analysis, such as concepts, meanings and development strategies, etc. Therefore, based on theoretical analysis, this paper analyzes the integration efficiency of information technology and the real economy in China’s provinces from 2011 to 2017 with the super-efficiency DEA model and Malmquist index. Besides, from time and space dimensions, this paper also analyzes the current situation and spatial evolution of the integrated development of information technology and the real economy in China. At last, the paper provides new ideas for the industrial upgrading of China’s economic structure and the development of China’s real economy.
3. Index Selection
The integration of IT and the real economy is a complex system. Therefore, evaluation of its efficiency will involve various aspects of IT and the real economy. In order to ensure a more comprehensive, representative and practical index, this paper draws lessons from the research achievements in the field of informatization, information technology and information industry. From the perspective of input and output, the evaluation index system is built in combination with the integration mechanism of IT and the real economy (Table 1).

Table 1.
Index system of the integrated development of information technology (IT) and the real economy.
In terms of the input, according to the theory of production factors in economics, the development of an organization requires three basic production factors: human resources, material resources and financial resources. Therefore, the index system is built from three dimensions of manpower input, infrastructure investment and capital investment.
Based on the file “Industrial Classification for National Economic Activities” [47], this study selects “the number of employees (X1) and fixed asset (X4) in such services sectors as information transmission, software and IT” as manpower input and Capital investment. He and Zong [48] pointed out that the information technology permeates every production factor. And the subject of the integration of information technology and the real economy is the professional practitioner with information technology knowledge, and the object is the instrument of labor, including intelligent devices, the Internet and big data. The research chooses the penetration rates of mobile phones (X2) and Internet access ports (X3) as the infrastructure investment. The reason for this is that the integration of IT and the real economy relies on the development of intelligent terminal and the Internet. Researchers also took the penetration rates of mobile phones and the Internet as the measurement index on the influence of IT on economic development [49].
In terms of the output, the integration of IT and the real economy will significantly increase economic benefits, which can be divided into the output of the real economy and the output of information technology.
Considering the concept and scope of the real economy, this paper uses the method of Zhang [50] to use the real economy GDP (Y1) of each province, excluding the financial industry and real estate industry, to replace the output of the real economy. In addition, software business revenue (Y2) and turnover in technology market (Y3) represent the output of IT. As the core revenue of information and communication technology, software business can reflect the development level of information technology industry to some extent. As a representative index in technology transactions, the turnover in the technology market is often used to evaluate the technological innovation capacity in one region. Li and Dai [51] gauged the development of the information industry by the turnover in technology market. Therefore, this paper selects the turnover in the technology market as one of the outputs of information technology.
4. Methodology
As a new economic form based on information technology, the integration of IT and the real economy is still undergoing development and changes. In addition, since many influencing factors are involved in it, the integrated development cannot be evaluated by a single method, while the DEA method is applicable to a complex system containing multiple inputs and outputs. The Malmquist index is a non-parametric method for calculating total factor productivity, which is generally used in combination with DEA to calculate efficiency. Therefore, this paper uses the DEA-Malmquist index method to calculate and analyze the integration efficiency of China’s information technology and real economy. The framework of methodology is as follows in Figure 1.
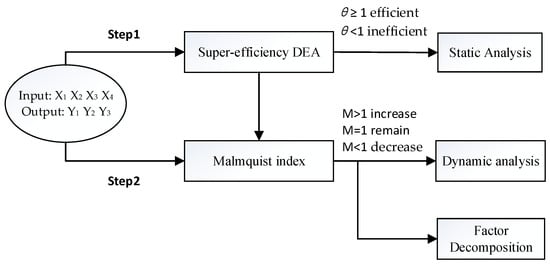
Figure 1.
Framework of methodology.
The study uses the DEA-Malmquist index to evaluate China’s information technology and real economy, which are the following two steps:
Step1: According to the input and output index system, the super-efficiency DEA model is used to statically analyze the integration efficiency of China’s information technology and the real economy. Then, the efficiency values of eastern, central and western regions are obtained. The panel data covers 30 provinces from 2011 to 2017. In addition, a spatial distribution map is drawn to fully display the results.
Step2: According to the index system, the Malmquist index is used to dynamically analyze the integration efficiency of China’s information technology and the real economy. In order to explore the internal factors of productivity changes, the author decomposes factors from the two dimensions of time and region and analyzes whether the changes in each province are caused by technological efficiency or technological progress.
4.1. Static Evaluation Model Based on Super-Efficiency DEA
The DEA method has been applied in many areas, for example, the evaluation of the energy utilization efficiency in industrial production and wastewater treatment [52]. Besides, Yang [53] used the DEA method to conduct an evaluation research on the construction efficiency of smart city in Wuhan from 2013 to 2016. Since the advent of DEA model, it has evolved into a comprehensive research method with more than ten models, which has been widely applied into the evaluation of regional economy, finance, education, logistics, and so on
In terms of the efficiency evaluation of the integrated development of IT and the real economy, each province and city is regarded as a decision-making unit (DMU). Assuming that the number of DMUs is n, and input vectors of each DMU, respectively, correspond to the input indexes in Table 1, while the output vectors correspond to the output indexes in Table 1. In order to better allocate resources, this research chooses the input-oriented model—the CCR (Charnes, Cooper and Rhodes) model, whose dual programming form is like that of Equation (1)—while evaluating the comprehensive efficiency of the DMU.
where θ is the efficiency of the DMU, and, respectively, denote the input factors and output factor , The variable is vector of weight for inputs and outputs, are vectors of slack. If and , the DMU is relatively efficient. Otherwise, the DMU is relatively inefficient.
The efficiency value of the traditional DEA model is always within the range of (0–1]. Therefore, it is impossible to compare them when there are multiple effective decision-making units at the same time. While the super-efficiency DEA model is a good solution to this problem. It can further calculate the efficiency value of effective DMU, so that the results can make a comprehensive arrangement and comparison of the interests of each decision-making unit. The super-efficiency DEA model is as follows in Equation (2).
Among them, θ represents the super-efficiency value of DMU, ε represents Archimedes infinitesimal, and denotes the effective weight of DMU. The super-efficiency DEA model only measures the benefit value of the effective evaluation unit and does not change the efficiency value of the invalid unit.
4.2. Dynamic Evaluation Model Based on Malmquist index
The Malmquist index has been used for measuring the total factor productivity by a great number of scholars. On the basis of the Malmquist index, Cave et al. [54] constructed the Malmquist productivity index, which can be used to analyze the change of productivity and calculate the panel date of time series. In the course of analyzing the total factor productivity of cities in China, Lin and Li [55] decomposed the index into the product of technological change and efficiency change to discuss the main factors affecting the productivity change.
Based on the ideas above and the index parameters of the integrated development of information technology and the real economy in different periods, this paper assumes time , DMU , with representing the i input of the r DMU in period t and representing the j output of the r DMU in period t. On the basis of Equation (1), the distance function of Malmquist index is calculated with Equation (3).
Replace the t in formula by t + 1 to calculate and . Put the calculated results into Equation (1), then the Malmquist exponent formula of the r DMU can be obtained by simplification as follows in Equation (4).
The M value represents the change in productivity. When the index M > 1, it indicates that the overall efficiency of the integration of information technology and the real economy increases annually. When the index M = 1, it means that the overall efficiency does not change as the year goes. When the index M < 1, it shows that the efficiency decreases year by year.
Then, factor decomposition is carried out for the Malmquist index. The Malmquist index is decomposed into technical efficiency change (EC) and technical progress change (TC), that is, M = EC × TC. The EC presents the change of DMU’s technical efficiency in the production frontier in different periods, while the TC reflects the change of the production frontier in different periods. The model is as follows in Equations (5) and (6).
Technical efficiency change:
Technical progress change:
5. Empirical Analysis
5.1. Data Sources
Based on the index system of integrated development of information technology and the real economy, this paper selects data samples of the index system of information technology development from 2011 to 2017 in each province, with the data timeliness being considered. Most raw data belong to the China Statistical Yearbook, China Statistical Yearbook on Science and Technology, and the China Statistical Yearbook on Electronic Information Industry from 2011 to 2018 [56]. At last, this paper obtains balanced panel data of 30 provinces and cities for 7 years, with Tibet Autonomous Region being put aside due to its insufficient data.
5.2. Static Analysis on the Efficiency of Integrated Development Nationwide
This paper utilizes the super-efficiency DEA model and the DEA-solver Pro5.0 software (Reachsoft, Beijing, China) to calculate the integration efficiency of IT and the real economy in 30 provinces from 2011 to 2017. Additionally, the qualities of economic development of these 30 provinces are sorted based on the benefit index. In order to have a deeper understanding of the gap between different regions, this paper classifies 30 provinces into the east, central and west part of China, and then obtains the average efficiency among different regions (Table 2).
Table 2.
Super-efficiency values of integrated development of IT and the real economy in 30 provinces.
According to Table 2, the efficiency values of 30 provinces generally show an escalating trend from 2011 to 2017. In the eastern region, the efficiency value is over 1, which means the input resources were fully utilized, while the central region did not reach DEA efficiency until 2017. Moreover, the western region was a late starter. However, thanks to the input of resources and the construction of information infrastructure, the efficiency has already increased to 0.946 in 2013, almost reaching DEA efficiency. It can be found that, in 2014, with the popularization of 4G and the rapid development of e-commerce, the overall efficiency of the country reached the highest value. However, there was still a huge gulf between the development efficiency of different provinces and regions.
The mean of eastern China ranks the first across the country, with the integrated development efficiency being effective all along, but growing slowly year by year. Thanks to many Internet companies and high-tech industries, Beijing maintains a rapid development of efficiency, which reaches its peak of 4.456 in 2017, taking an obvious leading position. The average super-efficiency values of Tianjin, Jiangsu province, Shanghai, Shandong province, Guangdong province and Liaoning province are all effective, which means the input resources of information technology are fully utilized. While the values of Hebei province, Zhejiang province, Fujian province, Hainan province, Jilin province, and Heilongjiang province are less than 1, representing that the input resources need adjustment to achieve efficiency.
Although the mean of central China ranks the second, the figure 0.930 is not efficient. However, the super-efficiency values of three provinces of Henan, Hunan, Hubei are all over 1, achieving DEA efficiency. Among these, Hubei province boasts the highest average value, which can be explained by the heavy investment on information technology resources and the smart city. The rankings of these seven provinces are: Hubei > Hunan > Henan > Anhui > Shanxi > Jiangxi. Among these seven provinces, Shanxi province has seen an obvious increase in efficiency value, with a maximum of 1.535 in 2017, which shows that Shanxi, the greatest coal producer in China, has made great advances in industry transformation of low pollution and high tech, and its efficiency of the integrated development is higher and higher.
The mean of the western region is in the third place, and the DEA efficiency is not obtained, which indicates that the input resources of information technology are not fully utilized, and that the integrated development lags behind that of the eastern and central regions. The average efficiency values of Guizhou province and the Inner Mongolia Autonomous Region are relatively higher, reaching DEA efficiency. This study indicates that the Guizhou province vigorously promoted the construction of electronic information and digital content industrial parks and advanced the e-commerce industry in 2013. As for the Inner Mongolia Autonomous Region, it began to foster the electronic information industry and promote the commodity electronic trading in 2011. Therefore, the efficiency values of these two provinces are higher. The efficiency value of Sichuan province is between 0.9 and 1, that is to say, if the input resources being slightly adjusted, the DEA can be effective. The efficiency values of the rest of the provinces are not high, only maintaining a steady growth between 2011 to 2014.
In order to better compare and reflect the interval differences, the Stata software is used to draw the spatial distribution diagram of the efficiency value, which is divided into seven intervals of [0,0.5],[0.5,0.6],[0.6,0.7][0.7,0.8][0.8,0.9][0.9,1.0][1.0,5], with those provinces belonging to the maximum interval filled by the darkest color and so on.
As shown in Figure 2, the integrated development varies from one region to another in China. In 2011, the eastern region performed better, while the efficiency values of different provinces in the central and western regions differed greatly. By 2017, the high efficiency values were mainly concentrated in the Bohai rim, Yangtze river delta and Pearl River Delta regions, showing an obvious agglomeration effect. It was also found that Beijing, Tianjin and Guangdong province had a radiation effect on neighboring provinces. According to Figure 2, the colors displayed on their surrounding provinces are gradually deepened, indicating that the investment resources of information technology are continuously optimized under the influence of neighboring provinces.
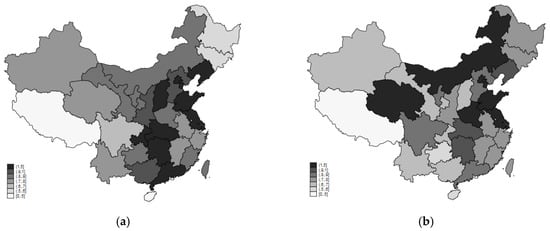
Figure 2.
Spatial distribution of the integrated development efficiency of IT and the real economy in provinces nationwide in 2011 and 2017. (a) 2011, (b) 2017.
5.3. Dynamic Analysis on the Integrated Development Efficiency of IT and the Real Economy
This paper uses the Malmquist index to dynamically analyze the integrated development of information technology and the real economy in China; moreover, it uses the factor decomposition to analyze the internal reasons that affect the efficiency of fusion. Besides, DEAP2.1 software is used to calculate the results based on the index data.
5.3.1. Dynamic Analysis
This section uses the Malmquist index to analyze the dynamic changes of the integrated development efficiency in 30 provinces and get the value of the eastern, central and western regions. The results are shown in Table 3.
Table 3.
Malquist values of the integrated development of IT and the real economy in 30 provinces.
By comparing the Malmquist index of each province in Table 3, it is found that the means of eastern region and western region are more than 1, showing an upward trend. Additionally, the growth rates of the eastern provinces are lower than those of the western provinces. This is mainly because the efficiency value of eastern region is relatively high, which leads to a slow growth accordingly. Since 2011, the overall efficiency of western region has increased. This is mainly because the government encourages the development of cloud computing, Internet and other artificial intelligence industries in the context of the large-scale development of the western region, thus optimizing the industrial structure in the western region. The mean of central China is 0.990, displaying a downward trend. Moreover, the Malmquist indexes of the central and western regions fluctuate significantly, while the ones of eastern region are relatively stable.
Figure 3 shows the fluctuations of various regions from 2011 to 2017. After analyzing the Malmquist index, it can be found that the growth rates of the eastern region from 2011 to 2016 are all higher than the national average, but grow slowly after 2017, suggesting that the integration development efficiency of the eastern region has reached a relatively high level with a slow growth. The growth rates of the central region from 2011 to 2016 does not reach the national average until 2015. As for the western region, the growth rates slightly fluctuate around the national average. Due to the overall weak development of the western region, its marginal effect is not effective. Therefore, a few investments would lead to great room for improvement.
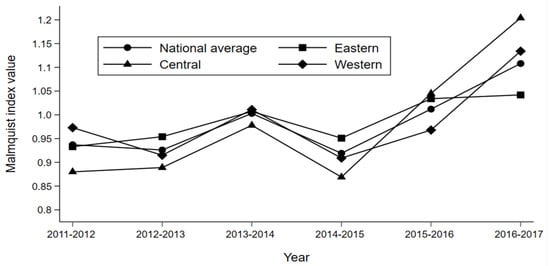
Figure 3.
Comparison of Malmquist indexes in various regions from 2011 to 2017.
The Malmquist indexes of different cities in China is shown in Figure 4. According to Figure 4, the overall efficiency of the integrated development of information technology and the real economy in China has been improved. From 2011 to 2012, the development of the central and western provinces is slow. However, the Malmquist index value significantly increase from 2016 to 2017. Besides, the uneven development across the country is also ameliorated.
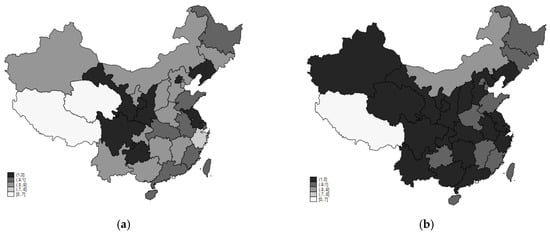
Figure 4.
Spatial distribution of Malmquist index in different cities in China. (a) 2011—2012; (b) 2016—2017.
5.3.2. Factor Decomposition
In order to further explore the internal causes affecting the Malmquist index, Formula (5) and Formula (6) above are used to carry out the factor decomposition of the Malmquist index, which can be decomposed into technical efficiency and technical progress. The results are shown in Table 4.
Table 4.
Changes and decomposition of Malmquist indexes in all provinces from 2011 to 2017.
It can conclude that the indexes of various regions and cities differ from one another. From the regional perspective, the declines in both technical efficiency and technical progress in the eastern region lead to the drop of the Malmquist index. Contrastingly, in the central and western regions, although the technical efficiency shows an increase, the decrease in technical progress results in the decline of the Malmquist index. From the perspective of provinces, only Beijing, Shanghai and Liaoning province obtain a rise in technical efficiency, technical progress and Malmquist index. And the decreased Malmquist index of most provinces and cities are influenced by either falling technical progress or technical efficiency.
From time dimension, Table 5 shows the influence of technological efficiency and technological progress on the integration efficiency. The results are shown in Table 5. From the point of the overall average, the average value of technical efficiency increases by 0.6%, the average value of technical progress falls by 3.4%, and the one of total factor productivity declines by 2.7%, mainly resulting from the drop of technical progress. From the time dimension, the total factor productivity shows a rising trend from 2015 to 2017 due to the improved technical progress. While the productivity goes down from 2011 to 2015 because of the decreased technical progress.
Table 5.
Variation and decomposition of Malmquist indexes from 2011 to 2017.
A similar change trend in the Malmquist index and technical progress are found in Figure 5, which demonstrates that the two have a higher correlation with each other, indicating that the Malmquist index is greatly influenced by technical progress, and that the improved integration of information technology and the real economy and the investment in technological innovation are closely related.
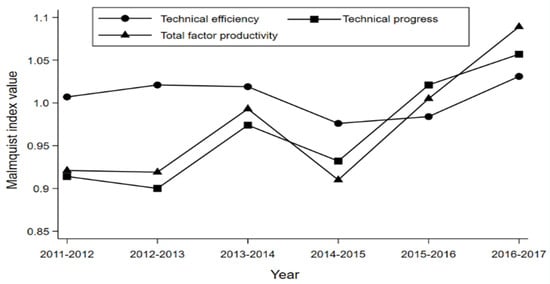
Figure 5.
Variation and decomposition of Malmquist indexes from 2011 to 2017.
6. Conclusions
6.1. Discussion
This research aims to examine the integration efficiency of information technology and the real economy of 30 provinces and of the eastern, central and western regions; it divides the development efficiency into technological progress and technological efficiency. The results demonstrate the internal reasons that affect the integrated development of IT and the real economy, thus promoting the sustainable development of the real economy. The topic of this study is based on the fact that China’s real economy is facing difficulties. At the same time, the government has proposed a strategic policy for the integrated development of IT and the real economy. Many scholars have studied the relationship between information technology and the real economy from theoretical and empirical perspectives. In addition, scholars in the past have done a lot of research on the interactions among technology, finance, and the economy [57,58,59]. With the proposal of a smart economy and smart city, the relationship between information technology and the real economy is getting closer, and research on the integration of information technology and the real economy can also offer a new lens for economic development.
Therefore, using super-efficiency DEA and the Malmquist index, this paper constructs an evaluation index system of information technology and the real economy. It conducts static and dynamic analyses of the integrated development of 30 provinces and cities from 2011 to 2017 and then an index factor decomposition is carried out. The results show that:
- (1)
- Since 2011, the overall efficiency of the integration of information technology and the real economy in 30 provinces and cities has been on the rise. The super-efficiency value of the eastern region has been effective, which means the input resources were fully utilized. The central part of China reached DEA efficiency in 2017, while the western region has not achieved efficiency yet.
- (2)
- The development efficiency of IT and the real economy was unbalanced in different regions, with the high efficiency mainly concentrated in the Bohai Rim region, the Yangtze River Delta and the Pearl River Delta.
- (3)
- The growth rate of the eastern region has been high with a moderate growth since 2017, contributing to a marginal effect. The economic growth of central region surpassed the national average in 2015, while the one of western region fluctuated around the national average
- (4)
- The average value of technical efficiency increased by 0.6%, the values of technical progress and total factor productivity fell by 3.4% and 2.7%, respectively, with the technical progress being the main factor influencing the total factor productivity.
6.2. Management Implications
The goal of management implications is to guide management decisions by recommending clear management guidance based on the results of static and dynamic analysis. In light of the factor decomposition of IT and the real economy in respect of 30 provinces in China, this study provides suggestions on how to promote the sustainable growth of IT and the real economy in China, which will, in turn, fosters China’s sustainable development.
- (1)
- Strengthening regional exchanges and cooperation. In view of the unbalanced development efficiency among various provinces and cities, regional cooperation should be strengthened. Such areas as Bohai Rim area, Yangtze River Delta, and Pearl River Delta region should play a leading role and speed up the flow of information resources so as to promote the transfer of the factors of production in technology information and the real economy. Besides, the capital cities in each province are encouraged to play a leading role in sharing information with surrounding cities.
- (2)
- Optimizing the allocation of information resources and promoting the transformation of intelligent works. We are expected to actively advance the construction of infrastructure such as cloud computing and 5G, increasing capital investment on information transmission and technology software, deepen reform and innovation with market demand and new generation of IT. At the same time, we all have a role to play in stimulating the innovation vitality of traditional entities, thus building an information economy driven by data and man–machine cooperation. For the eastern region with a better development, it is necessary to continue to invest in the research on core technologies. As for the central and western regions, it is advisable to build IT centers and explore ways for the transformation of innovation achievements.
- (3)
- Intensifying core technology innovation and promoting the development of information economy. The empirical study shows that the technical progress is critical to the improved integration of IT and the real economy. Therefore, technological innovation should be emphasized in this process: on the one hand, to continue to strengthen cutting-edge studies based on IT, including block-chain, machine learning, cloud services and so on, so as to significantly improve the development of software and hardware. On the other hand, to intensify informationization in the real economy by constructing a new generation of IT system, which can shorten the production circle, furthering the intelligent manufacturing and wisdom industry, encouraging the applications of IT in every step of manufacturing. We can also facilitate the network integration, thus achieving the upgrading of intelligence and informatization in various industries in the real economy.
6.3. Research Gaps and Direction of Further Studies
Although the conclusions obtained by using the super DEA-Malmquist model in this research present important practical guidance for integration of IT and the real economy, it should be noticed that the research is by no means free of its limitations. First and foremost, at the output level, the indicator system in this research is established from the perspective of the real economy and the output value of information technology. In reality, besides the desirable output, the production process also includes undesired output, such as waste gas and wastewater, etc. Therefore, the future research may focus on undesired output indicators. Secondly, this research is to study the overall development of China’s information technology and the real economy in recent years, and analyze the internal reasons that affect development. While the external factors have not been discussed. Hence, the future research can use regression models to explore the external influence factors. Thirdly, the national economy industry is composed of the real economy and the virtual economy. The influence of the information technology and the virtual economy has not been figured out. Therefore, future research can try to study the integration of information technology and other economic industries, such as the integration efficiency of information technology and financial industries, and the integrated development of information technology, the real economy and the virtual economy, etc. The methodology, the approach and the context of this study can serve as a practical model for future researchers. The research on industrial relations is also of great significance to the sustainable development of economy.
Author Contributions
The main activities of the team of authors can be described as follows. L.Y. and H.Z. designed the didactic scenario, initiated the study and was significantly involved in its conception. Y.Q. wrote the draft of the article, designed and refined the study from a didactic and motivational perspective. Conceptualization, Z.W.; investigation, H.Z.; resources, Z.W. and L.Y.; writing—original draft preparation, Y.Q.; writing—review and editing, L.Y.; supervision, L.Y.; project administration, L.Y.; funding acquisition, L.Y. All authors have read and agreed to the published version of the manuscript.
Funding
The works that are described in this paper are funded by the General Program of National Natural Science Foundation of China, “Research on Random Symmetrical Cone Complementarity Problems and Related Topics” (No: 11671250).
Acknowledgments
The authors thank the reviewers for their careful reading and providing some pertinent suggestions.
Conflicts of Interest
The authors declare no conflict of interest. The funders had no role in the design of the study; in the collection, analyses, or interpretation of data; in the writing of the manuscript, or in the decision to publish the results.
Abbreviations
| IT | Information Technology |
| DEA | Data Envelopment Analysis |
| AI | Artificial Intelligence |
| GDP | Gross Domestic Product |
| DMU | Decision-Making Unit |
| CCR | Charnes and Cooper and Rhodes |
| EC | Technical Efficiency Change |
| TC | Technical Progress Change |
References
- Guo, F.; Pu, X. China Real Economy Development Report 2012. China Econ. Wkly. 2012, 49, 37–51. [Google Scholar]
- Zhou, J. Intelligent manufacturing is the main direction of Made in China 2025. Enterp. Obs. 2019, 11, 54–55. [Google Scholar]
- Huggins, R.; Thompson, P. Culture and Place-Based Development: A Socio-Economic Analysis. Reg. Stud. 2015, 49, 130–159. [Google Scholar] [CrossRef]
- Tijani, A.A.; Oluwasola, O.; Baruwa, O.I. Public sector expenditure in agriculture and economic growth in Nigeria: An empirical investigation. Agrekon 2015, 54, 76–92. [Google Scholar] [CrossRef]
- Huang, N.J.; Huang, N.; Wang, Y. US economic policy uncertainty on Chinese economy: Industry level analysis. Appl. Econ. Lett. 2020, 27, 789–802. [Google Scholar] [CrossRef]
- Raspe, O.; Oort, F.V. The Knowledge Economy and Urban Economic Growth. Eur. Plan. Stud. 2006, 14, 1209–1234. [Google Scholar] [CrossRef]
- Burillo, P.; Barajas, A.; Gallardo, L.; García-Tascón, M. The Influence of Economic Factors in Urban Sports Facility Planning: A Study on Spanish Regions. Eur. Plan. Stud. 2011, 19, 1755–1773. [Google Scholar] [CrossRef]
- Chen, Y. Translation, the Knowledge Economy, and Crossing Boundaries in Contemporary Education. Educ. Philos. Theory 2016, 48, 1284–1297. [Google Scholar] [CrossRef]
- Choi, T.M.; Taleizadeh, A.A.; Yue, X. Game theory applications in production research in the sharing and circular economy era. Int. J. Prod. Res. 2019, 58, 118–127. [Google Scholar] [CrossRef]
- Huang, Q. On the Development of China’s Real Economy in the New Era. China’s Ind. Econ. 2017, 9, 5–24. [Google Scholar]
- Lu, X.; Guo, K.; Dong, Z.; Wang, X. Financial development and relationship evolvement among money supply, economic growth and inflation: A comparative study from the U.S. and China. Appl. Econ. 2017, 49, 1032–1045. [Google Scholar] [CrossRef]
- Chandrasekhar, C.P. Finance and the Real Economy: The Global Conjuncture. Can. J. Dev. Stud. 2003, 24, 215–227. [Google Scholar] [CrossRef]
- Niang, A.A.; Diagne, A.; Pichery, M.C. Exploring the finance-real economy link in U.S.: Empirical evidence from panel unit root and cointegration analysis. Empir. Econ. 2011, 40, 253–268. [Google Scholar] [CrossRef]
- Giwa, B.A.; George, E.O.; Okodua, H.; Adediran, O.S. Empirical analysis of the effects of foreign direct investment inflows on Nigerian real economic growth: Implications for sustainable development goal-17. Cogent. Soc. Sci. 2020, 6, 1727621–1727632. [Google Scholar] [CrossRef]
- Belke, A.; Dubova, I.; Osowski, T. Policy uncertainty and international financial markets: The case of Brexit. Appl. Econ. 2018, 50, 3752–3770. [Google Scholar] [CrossRef]
- Dihle, H.; Mentges, R. Real options or disaster risk? Distinguishing uncertainty effects on investment. Appl. Econ. 2018, 50, 3771–3786. [Google Scholar] [CrossRef]
- Chen, H.Y.; Yang, S.L. Contagion effects of sovereign credit rating revisions on the real economy: Is it trade or finance? Appl. Econ. 2018, 50, 5604–5619. [Google Scholar] [CrossRef]
- Long, X. Scientific and technological innovation and real economy development. China’s Econ. Issues 2018, 6, 21–30. [Google Scholar]
- Zhuang, L.; Wang, Y. Research on the Influence Mechanism of Fintech Innovation on the Development of real economy. Soft Sci. 2019, 33, 43–46. [Google Scholar]
- Gibbs, D.; Tanner, K. Information and communication technologies and local economic development policies: The British case. Reg. Stud. 1997, 31, 765–774. [Google Scholar] [CrossRef]
- Weber, S.; Bussell, J. Will Information Technology Reshape the North-South Asymmetry of Power in the Global Political Economy? Stud. Comp. Int. Dev. 2005, 40, 62–84. [Google Scholar] [CrossRef]
- Yousefi, A. The impact of information and communication technology on economic growth: Evidence from developed and developing countries. Econ. Innov. New Technol. 2011, 20, 581–596. [Google Scholar] [CrossRef]
- Whitaker, J.; Ekman, P.; Thompson, S. How Multinational Corporations Use Information Technology to Manage Global Operations. J. Comput. Inf. Syst. 2017, 57, 112–122. [Google Scholar] [CrossRef]
- Haseeb, A.; Xia, E.; Saud, S.; Ahmad, A.; Khurshid, H. Does information and communication technologies improve environmental quality in the era of globalization? An empirical analysis. Environ. Sci. Pollut. Res. 2019, 26, 8594–8608. [Google Scholar] [CrossRef] [PubMed]
- Qureshi, S. Perspectives on development: Why does studying information and communication technology for development (ICT4D) matter? Inf. Technol. Dev. 2019, 25, 381–389. [Google Scholar] [CrossRef]
- Roztocki, N.; Soja, P.; Weistroffer, R.H. The role of information and communication technologies in socioeconomic development: Towards a multi-dimensional framework. Inf. Technol. Dev. 2019, 25, 171–183. [Google Scholar] [CrossRef]
- González-Sánchez, V.M. Information and Communication Technologies and entrepreneurial activity: Drivers of economic growth in Europe. Serv. Ind. J. 2013, 33, 7–8. [Google Scholar] [CrossRef]
- Jorgenson, D.W.; Ho, M.S.; Samuels, D. The impact of information technology on postwar US economic growth. Telecomm. Policy 2016, 40, 398–411. [Google Scholar] [CrossRef]
- Van der Vlist, A.J.; Vrolijk, M.H.; Dewulf, G.P.M.R. On information and communication technology and production cost in construction industry: Evidence from the Netherlands. Constr. Manag. Econ. 2014, 32, 641–651. [Google Scholar] [CrossRef]
- Ramlan, J.; Ahmed, E.M. Information and Communication Technology (ICT) and human capital management trend in Malaysia’s economic development. Appl. Econ. Lett. 2009, 16, 1881–1886. [Google Scholar] [CrossRef]
- Murphy, J.T.; Carmody, P.; Surborg, B. Industrial transformation or business as usual? Information and communication technologies and Africa’s place in the global information economy. Rev. Afr. Polit. Econ. 2014, 41, 264–283. [Google Scholar] [CrossRef]
- Das, D.K. Exploring Perspectives of the Information Technology Industry in a South African City. Sustainability 2019, 11, 6520. [Google Scholar] [CrossRef]
- Malaquias, R.F.; Malaquias, F.F.O.; Hwang, Y. The role of information and communication technology for development in Brazil. Inf. Technol. Dev. 2017, 23, 179–193. [Google Scholar] [CrossRef]
- Khuntia, J.; Saldanha, T.J.V.; Mithas, S.; Sambamurthy, V. Information Technology and Sustainability: Evidence from an Emerging Economy. Prod. Oper. Manag. 2018, 27, 756–773. [Google Scholar] [CrossRef]
- Zhao, J. Promoting the integration and development of new generation information technology and real economy: Based on the perspective of intelligent manufacturing. Sci. Sci. Technol. Manag. 2020, 41, 3–16. [Google Scholar]
- Zeng, J.; Wu, W.; Liu, Y.; Huang, C.; Zhao, X.; Liu, D. The local variations in regional technological evolution: Evidence from the rise of transmission and digital information technology in China’s technology space, 1992–2016. Appl. Geogr. 2019, 112, 102080. [Google Scholar] [CrossRef]
- Zheng, X.; Xu, X.; Yin, P. A Study of the Contribution of Information Technology on the Growth of Tourism Economy Using Cross-Sectional Data. J. Glob. Inf. Manag. 2019, 27, 39–58. [Google Scholar]
- Guo, Q.; Zhang, M. An agent-oriented approach to resolve scheduling optimization in intelligent manufacturing. Robot. Comput. Integr. Manuf. 2010, 26, 39–45. [Google Scholar] [CrossRef]
- Ruhlandt, R.W.S. The governance of smart cities: A systematic literature review. Cities 2018, 81, 1–23. [Google Scholar] [CrossRef]
- He, Y.; Fang, K. Theoretical interpretation of the integration of artificial intelligence and real economy. Acad. J. 2008, 50, 56–67. [Google Scholar]
- Lei, S.; Li, Y. Promoting the deep integration of Internet, big data, artificial intelligence and real economy. Econ. Res. Ref. 2018, 8, 50–58. [Google Scholar]
- Wei, Q. Data Envelopment analysis (DEA). Chin. Sci. Bull. 2000, 17, 1793–1808. [Google Scholar]
- Andersen, P.; Petersen, N.C. A Procedure for Ranking Efficient Units in Data Envelopment Analysis. Manag. Sci. 1993, 39, 1261–1265. [Google Scholar] [CrossRef]
- Dai, Z.; Guo, L.; Jiang, Z. Study on the industrial Eco-Efficiency in East China based on the Super Efficiency DEA Model: An example of the 2003–2013 panel data. Appl. Econ. 2016, 48, 5779–5785. [Google Scholar] [CrossRef]
- Zhu, X.; Zhang, P.; Wei, Y.; Li, Y.; Zhao, H. Measuring the efficiency and driving factors of urban land use based on the DEA method and the PLS-SEM model—A case study of 35 large and medium-sized cities in China. Sustain. Cities. Soc. 2019, 50, 101646. [Google Scholar] [CrossRef]
- Firsova, A.; Chernyshova, G. Efficiency Analysis of Regional Innovation Development Based on DEA Malmquist Index. Information 2020, 11, 294. [Google Scholar] [CrossRef]
- Standardization Administration of China. Industrial Classification for National Economic Activities; China Statistical Publishing House: Beijing, China, 2017. [Google Scholar]
- He, Y.; Zong, S. Artificial intelligence, intelligent economy and intelligent labor value based on Marx’s labor theory of value. Res. Mao Zedong Deng Xiaoping Theory 2017, 10, 36–43. [Google Scholar]
- Asongu, S.A.; Odhiambo, N.M. How enhancing information and communication technology has affected inequality in Africa for sustainable development: Empirical investigation. Sustain. Dev. 2019, 27, 647–656. [Google Scholar] [CrossRef]
- Zhang, L. Financial development, technological innovation and real economy growth: An empirical study based on spatial econometrics. Financ. Econ. Res. 2016, 31, 14–25. [Google Scholar]
- Li, X.; Dai, S. Development evaluation and model optimization of Wuhan: Theory and empirical evidence. China Soft Sci. 2018, 1, 77–89. [Google Scholar]
- Ding, T.; Wu, H.; Jia, J.; Wei, Y.; Liang, L. Regional assessment of water-energy nexus in China’s industrial sector: An interactive meta-frontier DEA approach. J. Clean. Prod. 2020, 244, 118797. [Google Scholar] [CrossRef]
- Yang, K. Intelligent approach for smart city based on DEA model: Taking Wuhan, China as an example. J. Intell. Fuzzy Syst. 2008, 35, 2667–2677. [Google Scholar]
- Caves, D.; Christensen, L.; Diewert, W. Multilateral comparisons of the output and input, and the productivity using superlative index Numbers. Econ. J. 1982, 95, 73–86. [Google Scholar] [CrossRef]
- Liu, B.; Li, Q. Dynamic empirical analysis of total factor productivity in Chinese cities: 1990–2006 Malmquist index method based on DEA model. Nankai Econ. Res. 2009, 3, 139–152. [Google Scholar]
- National Bureau of Statistics, PRC. China Statistical Yearbook; China Statistical Publishing House: Beijing, China, 2017.
- Rahman, M.S.; Shahari, F. The nexus between financial integration and real economy: Solow-growth model concept. Res. Int. Bus. Financ. 2017, 42, 1244–1253. [Google Scholar] [CrossRef]
- Li, Y.; Jin, X.; Tian, W. Econometric Analysis of Disequilibrium Relations Between Internet Finance and Real Economy in China. Int. J. Comput. Intell. Syst. 2019, 12, 1454–1464. [Google Scholar] [CrossRef]
- Farooq, M.O.; Selim, M. Conceptualization of the real economy and Islamic finance: Transformation beyond the asset-link rhetoric. Thunderbird. Int. Bus. Rev. 2019, 61, 685–696. [Google Scholar] [CrossRef]


© 2020 by the authors. Licensee MDPI, Basel, Switzerland. This article is an open access article distributed under the terms and conditions of the Creative Commons Attribution (CC BY) license (http://creativecommons.org/licenses/by/4.0/).