1. Introduction
With the rapid socio-economic development in China, China has experienced urbanization on a scale unprecedented in recent decades. Urbanization leads to high-density development of land use in urban areas for the increasing population. High-density land uses cause high-intensity traffic demand. Land use and transport are hot topics within sustainable transportation in China, as they are undergoing a major demographic transition of rapid and intense urbanization [
1]. As to relieve the burden of traffic network for high-intensity traffic demand, the public transport leading oriented development is considered as a rational and sustainable strategy to balance the urban high-density land use development and the high-intensity traffic demand. Metro, with the advantages of being efficient, smooth, green, safe, large-volume, and land-saving, is the first choice of transport mode which is developing in many metropolises all over the world [
2].
Metro, as a sustainable urban transport mode, has been expanding aggressively in recent decades. It attracts lots of residents and is taken as the first choice of trip mode for most commuters in many metropolises, such as Beijing, Shanghai, and Tokyo [
3]. However, the capacity of metro always cannot meet the traffic demand during the rush hours. These phenomena cause traffic congestion within metro vehicles and metro stations, which lead to stampede accidents, being shut in the door, falling into the pathway, burglary, and other social problems. It calls for traffic agents to reinforce the operation and management standard by some advanced public transport technologies, to improve the service quality and increase the passenger travel shares rate of metro.
As to improving the operation and management standard of urban public transport system, researchers have developed kinds of mathematical models to explore the influence factors and relationships in the development and operation of public transport system. Kalantari [
4] used the user planning support model to evaluate the potential relationship between public transport and the areas needed for future urban development. Holst [
5] used a standard forecasting model to study the prediction of public transport passenger flow in sparsely populated areas and discussed their applicability. Corolli [
6] used a heuristic method of problem structure to consider the random factors affecting the passenger demand in air traffic flow management. Ortuzar and willumsen [
7,
8], concerned with the interface between the decision-maker and the transport system, developed mental and mathematical models to assist the decision-maker to improve transport system management skills.
Passenger flow prediction is considered the foremost and pivotal technology in improving the management standard and service level of metro, as well as other public transport modes. In the area of passenger flow prediction for public transport, the mathematical prediction models that the researchers have used can be divided into linear models and nonlinear models, as far as we know. With linear models, the empirical data are mainly used to predict passenger flow under theoretical assumptions and specific condition parameters. Linear time series model [
9], historical average model [
10], nearest neighbor model [
11], and error component model [
12] are the kind of linear models which are used to infer the trend of passenger flow in some scenarios with specific theoretical assumptions. Xue [
13] used the linear time series model to predict the short-term passenger flow of public transport, and the results showed that the time series model has defects in predicting the short-term passenger flow and it is more suitable for predicting the long-term passenger flow. The nonlinear models, such as nonlinear time series model [
14,
15], support vector machine model [
16], and neural network model [
17,
18], are considered to have more accuracy in describing the characteristics of transit systems and better performance than linear models in passenger flow prediction. Castro [
19] used a support vector machine model to predict traffic flow under typical and atypical traffic conditions and achieved better prediction results.
In the aspect of data use in passenger flow prediction, to our best knowledge, the state-of-the-art researches on passenger flow prediction for urban public transport in the libraries were mostly based on the historical data of Integrated Circuit (IC) cards. A series of machine learning models based on IC card data were used to explore the residents’ trip choice behavior and transit trip pattern for decision-making support in transit operation and management. The algorithms in these machine learning models can be divided into two groups as conventional statistical-based methods [
13,
20,
21] and computational intelligence-based methods [
22,
23,
24]. Wei [
25] combined empirical mode decomposition with back propagation neural network to predict short-term passenger flow. The results showed that the prediction accuracy of the neural network is better than that of the Autoregressive Integrated Moving Average (ARIMA) model and Seasonal Autoregressive Integrated Moving Average (SARIMA) model. Yang [
26] concluded that the Artificial Neural Network (ANN) model has the highest accuracy and shortest training time in evaluating passenger flow compared with several conventional statistical algorithms and computational intelligence algorithms.
Machine learning and deep learning frameworks such as TensorFlow, PyTorch, Keras were developed and applied in engineering. The neural network is becoming increasingly mature in research and easier to use in application, including in the area of traffic engineering. Ou [
27] and Zhang [
28] used the convolutional neural network to predict the origin-destination flow of traffic networks. Long Short-Term Memory (LSTM) neural network and Gated Recurrent Unit (GRU) were developed to capture the time dependence of time series in different time periods, and the research indicates that these models have excellent performance in the field of traffic flow prediction [
21,
29,
30,
31]. Yang [
32] enhanced the LSTM model and compared with the conventional LSTM and Recurrent Neural Network (RNN), the experimental results showed that the training time and accuracy of the proposed model had a better performance. The researchers used LSTM and ANN to predict the traffic flow in different applications. They found that the LSTM model has the capability of effectively capturing the long-term and short-term characteristics of traffic flow and achieves higher accuracy in prediction compared with other algorithms [
33,
34,
35].
In the aspect of land use development, it is well known that urban mass transit, such as light rail, Bus Rapid Transit (BRT), and metro, will increase the value of land use along the transit line [
36,
37]. Some researchers focus on the commercial investment based on the location of metro stations and land use [
38,
39,
40,
41]. Jian [
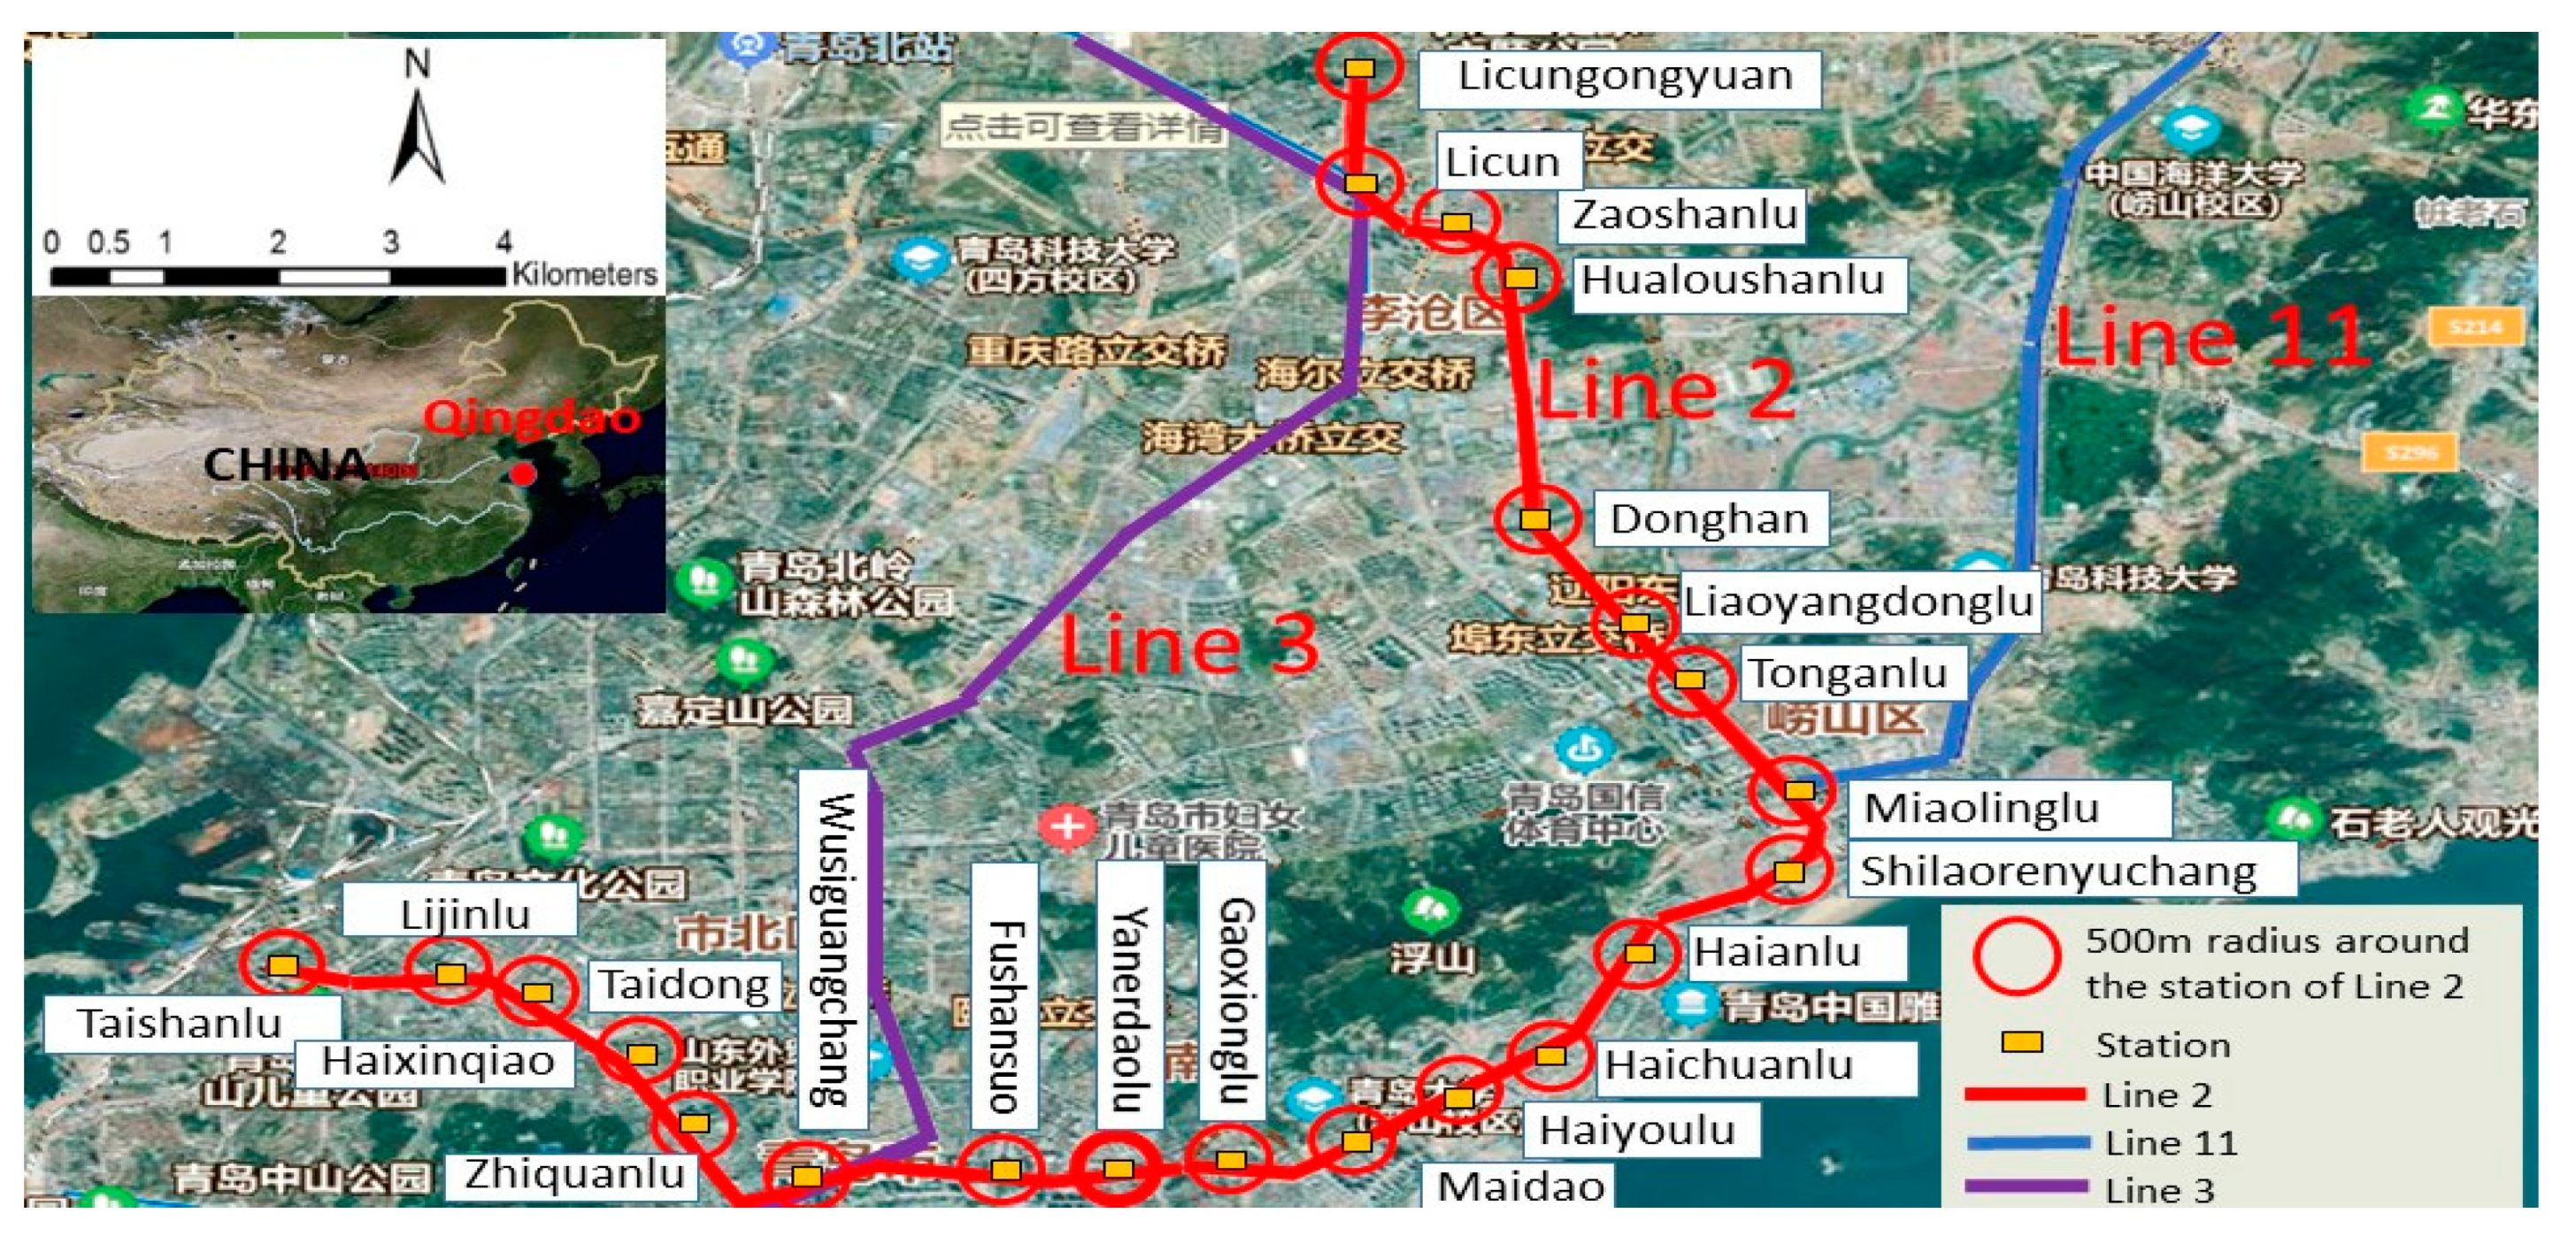
42] studied the relationship of land use and metro passenger flow within a 500 m radius around the metro station in Osaka, Japan, and found that urban commercial building tends to be more dense when its location is closer to the metro station. Lin [
43] explored the impact of the location of metro stations impacting on the customer flow of the shopping malls, and found out that there is a multi-relationship among the land price, the construction of the metro station, and the customer flow. Zheng [
44] found that new metro station has a positive impact on the number and diversity of the catering services which are near the metro station. Izanloo [
45] used the secondary data analysis method to determine the impact of commercial land on the number of trips. The results show that there is a strong correlation between commercial land and traffic flow.
From the perspective of investment economic, there is a potential association between the land uses around metro station and the metro passenger flow. To the best of our knowledge, there is little research on the metro passenger flow prediction based on the land uses. The analysis of the potential relationship between land uses around the metro station and the metro passenger flow is important for metro passenger flow prediction. This paper attempts to predict the metro passenger flow based on the relationship between land uses and metro stations. The main work of this paper focuses on:
- (1)
Using mathematical and neural network modeling methods to predict metro passenger flow based on the land uses around the metro stations, along with considering the spatial correlation of metro stations within the metro line and the temporal correlation of time series in passenger flow prediction, and then exploring the potential association between the land uses and the metro passenger flow;
- (2)
Providing a feasible solution to predict the passenger flow based on land uses around the metro stations and then potentially improving the understanding of the land uses around the metro station impact on the metro passenger flow, exploring the prediction procedure of the land uses to metro passenger flow.
The rest of this paper is organized as follows.
Section 2 describes the data source used in this study, which includes the land uses data around the metro stations and the raw metro passenger flow data.
Section 3 introduces the models of passenger flow prediction based on the metro line and single station. The effectiveness of the proposed model and its application are discussed in
Section 4.
Section 5 concludes this article with a summary of contributions and limitations, as well as the perspectives on future work.
4. Discussion
From the existing research, we know that the passenger flow in the metro IC card data has temporal correlation and spatial correlation, and many factors affect metro passenger flow. In terms of space, in a period, the increase or decrease of the passenger flow is affected by the passenger flow input of adjacent stations. However, these influences will decrease as the distance increases. In terms of time, the passenger flow of the metro station will fluctuate with time, and the fluctuation trend is regular in a similar period. Furthermore, in different time periods, such as working days and holidays, the time-changing impact on metro passenger flow is not the same. Therefore, in the study of prediction of passenger flow, it is necessary to comprehensively consider the influence of spatial correlation and temporal correlation on metro station passenger flow. From the perspective of the whole metro line, there is spatial correlation between passenger flow information, and from a single metro station, the passenger flow information has time correlation with time. This paper started from the whole line and a single station, and explored the influence of space and time on station passenger flow.
Section 3.1 and
Section 3.2 explored the relationship between the passenger flow and the land uses around the station from the whole line and the single station, respectively.
Section 3.1, based on the spatial correlation of the passenger flow at each station of the metro, carried out the equation with the passenger flow of the whole line and the land uses around the stations. In the fitting equation, to ensure accuracy, this paper chose the average value of the coefficients as the final coefficients of the equation. In the prediction process, we used the first 19 stations to fit the whole line equation and used the last three stations to verify the accuracy of the equation.
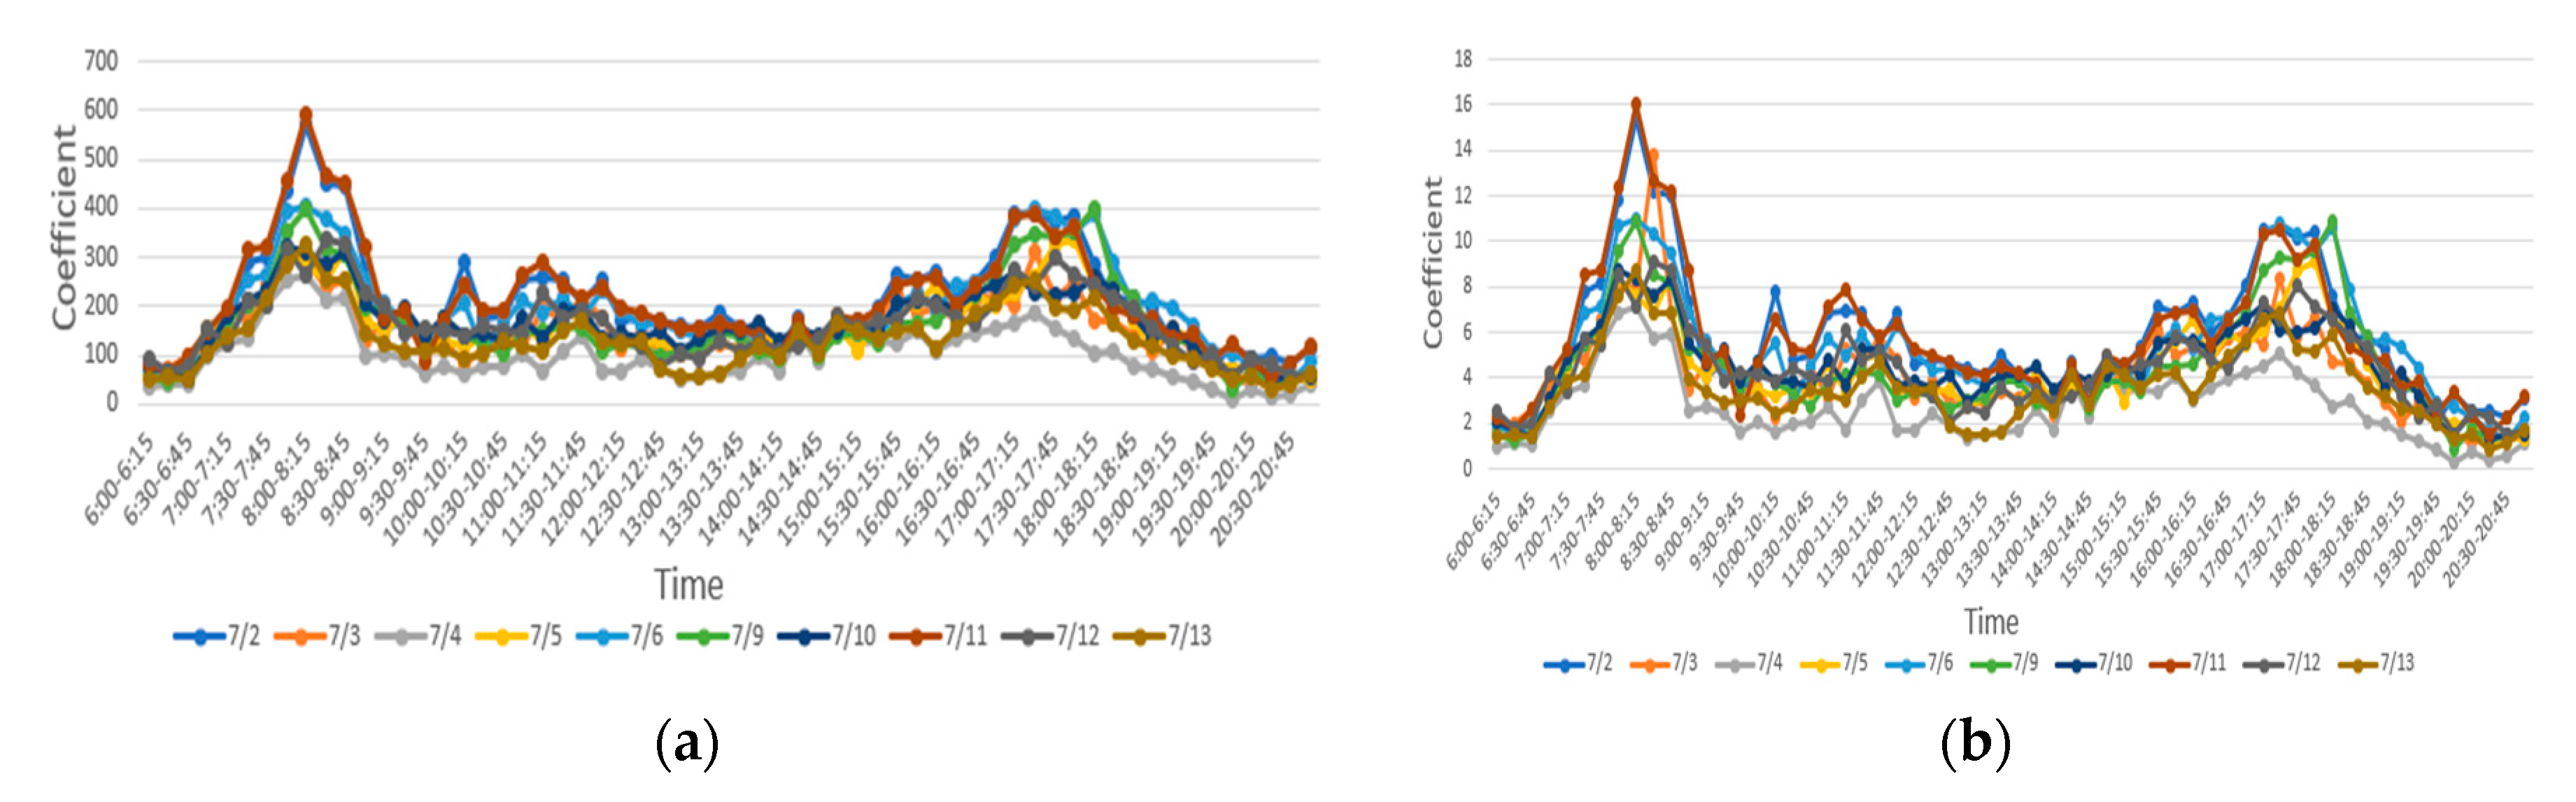
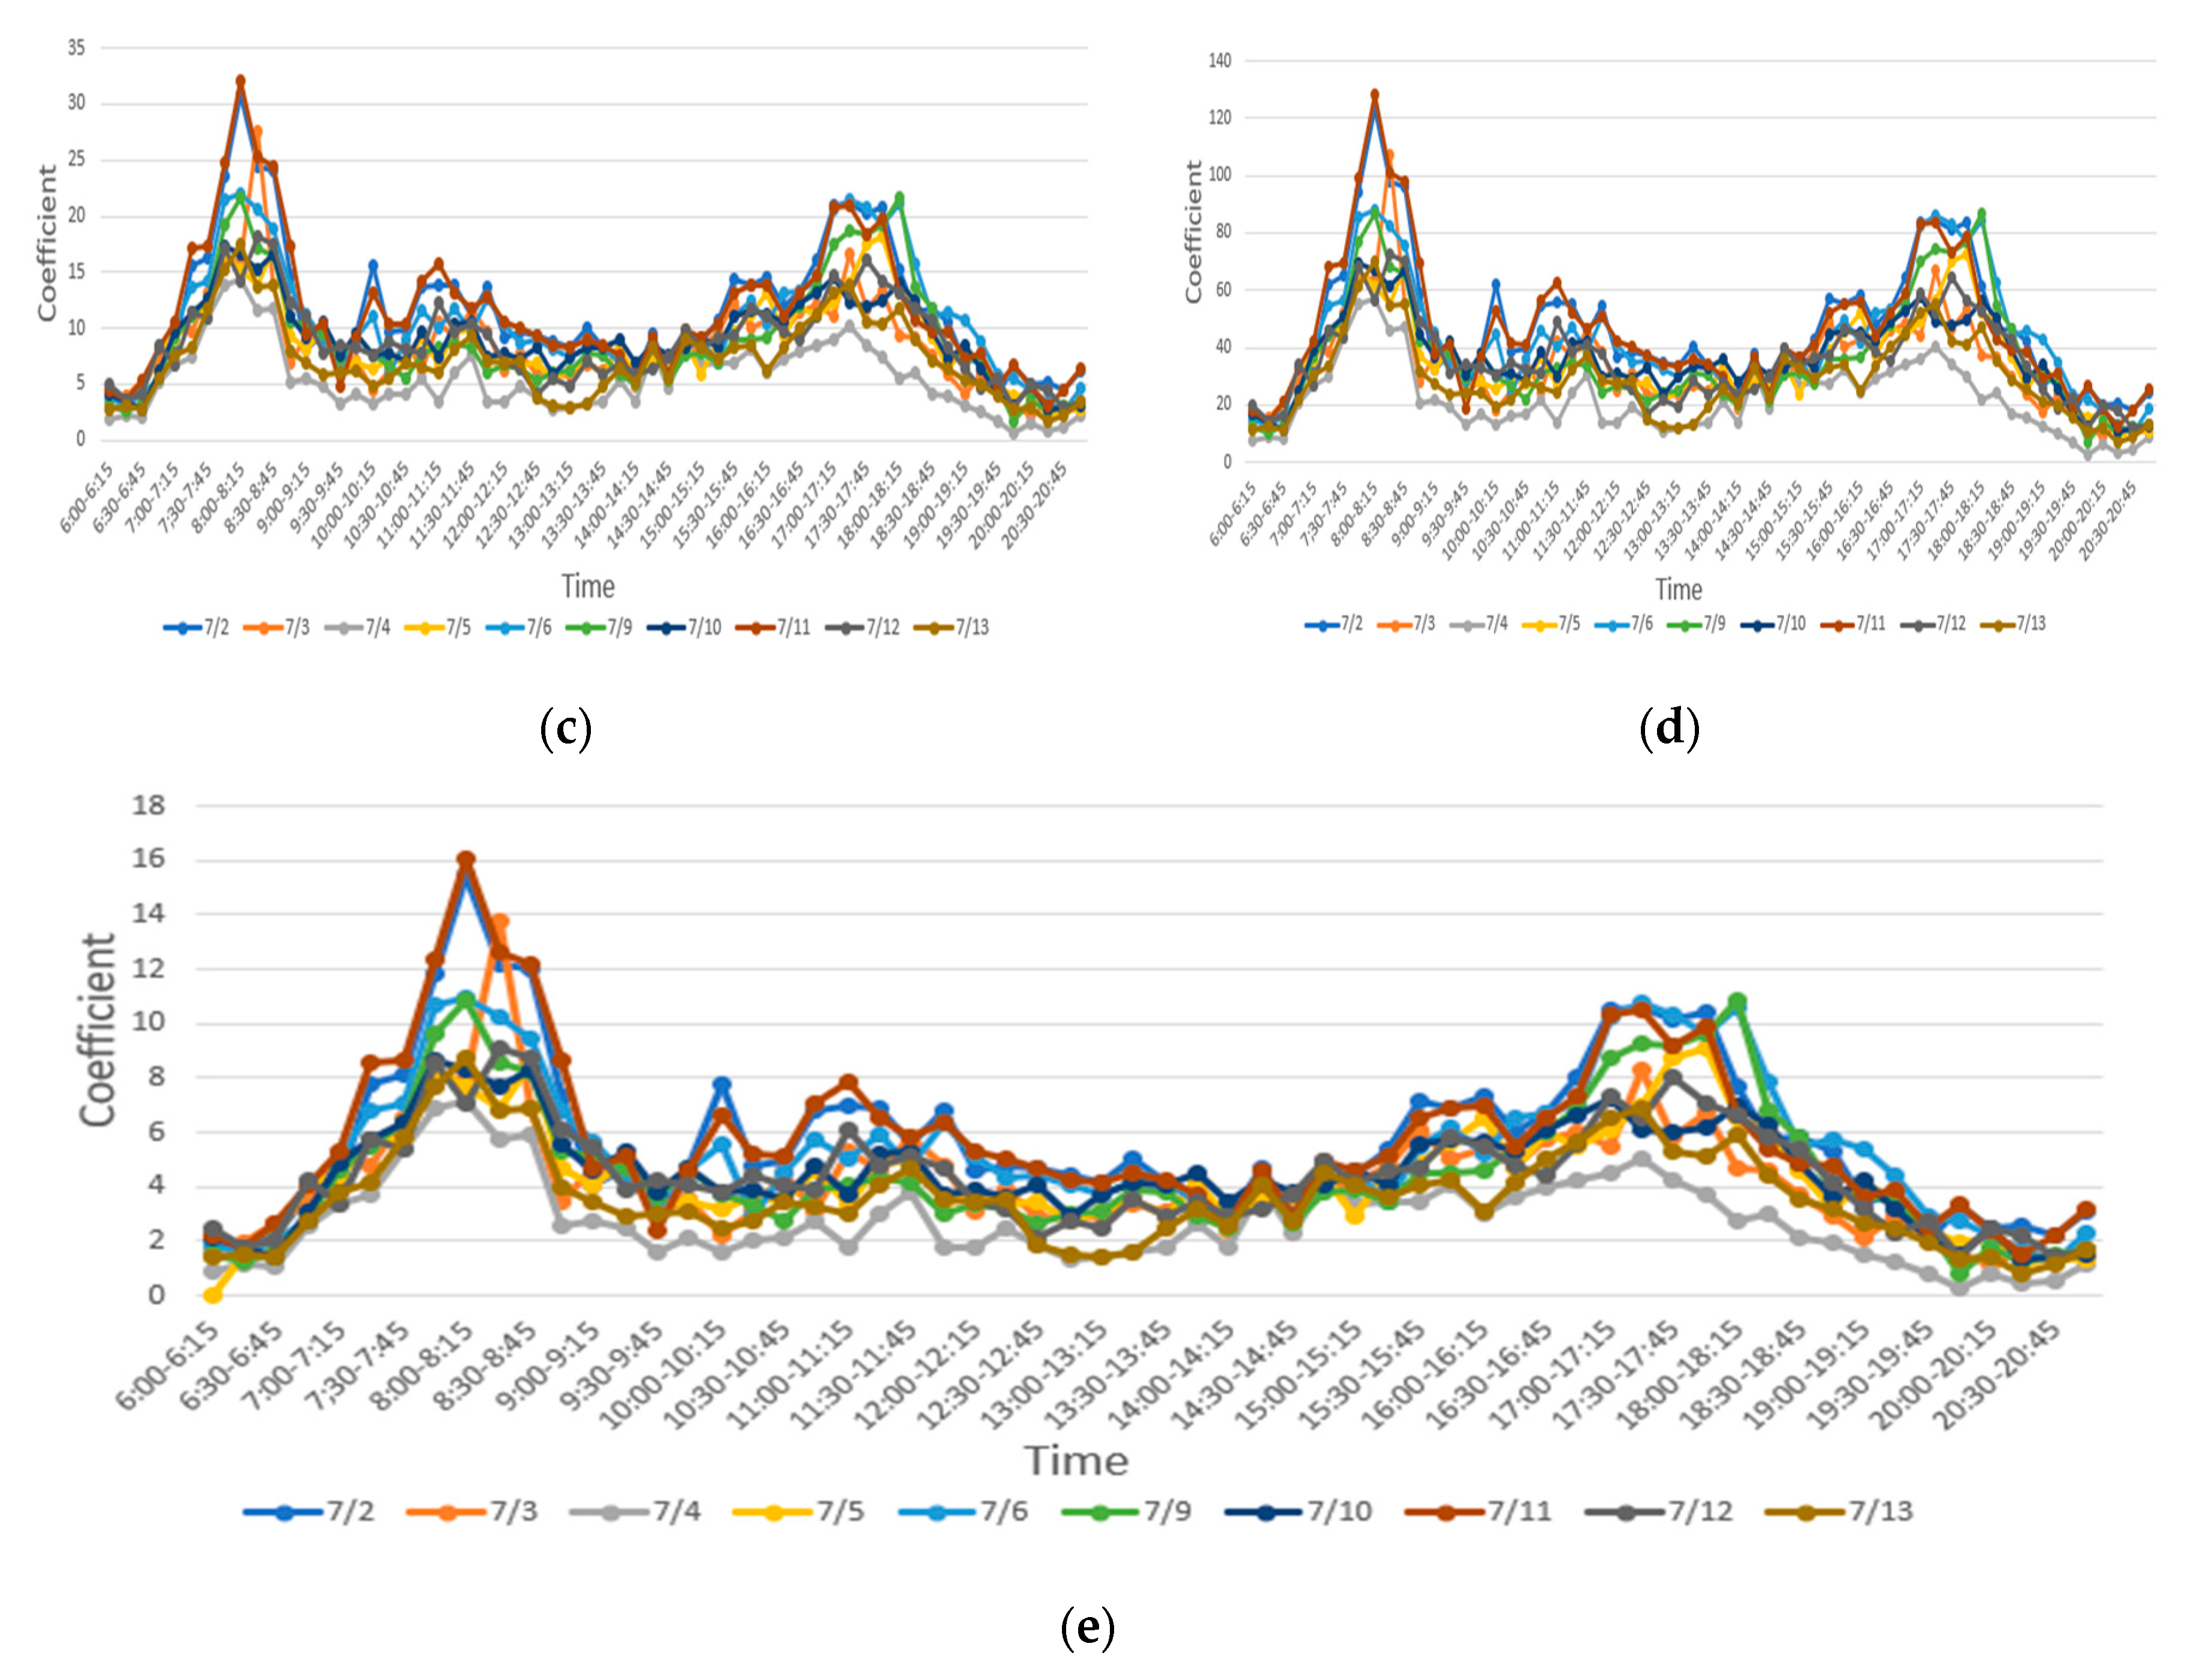
Section 3.2 was based on the temporal correlation between the passenger flow of a single metro station and the land uses around the station. In this section, we used metro station 20 as an example, using the passenger flow of two consecutive weekdays and selecting 15 min as the interval, and then obtain the coefficients of land use by using linear programming. The results show that the passenger flow and the coefficient are all changing along with time. ANN and LSTM were used for training the prediction.
Section 3.1 and
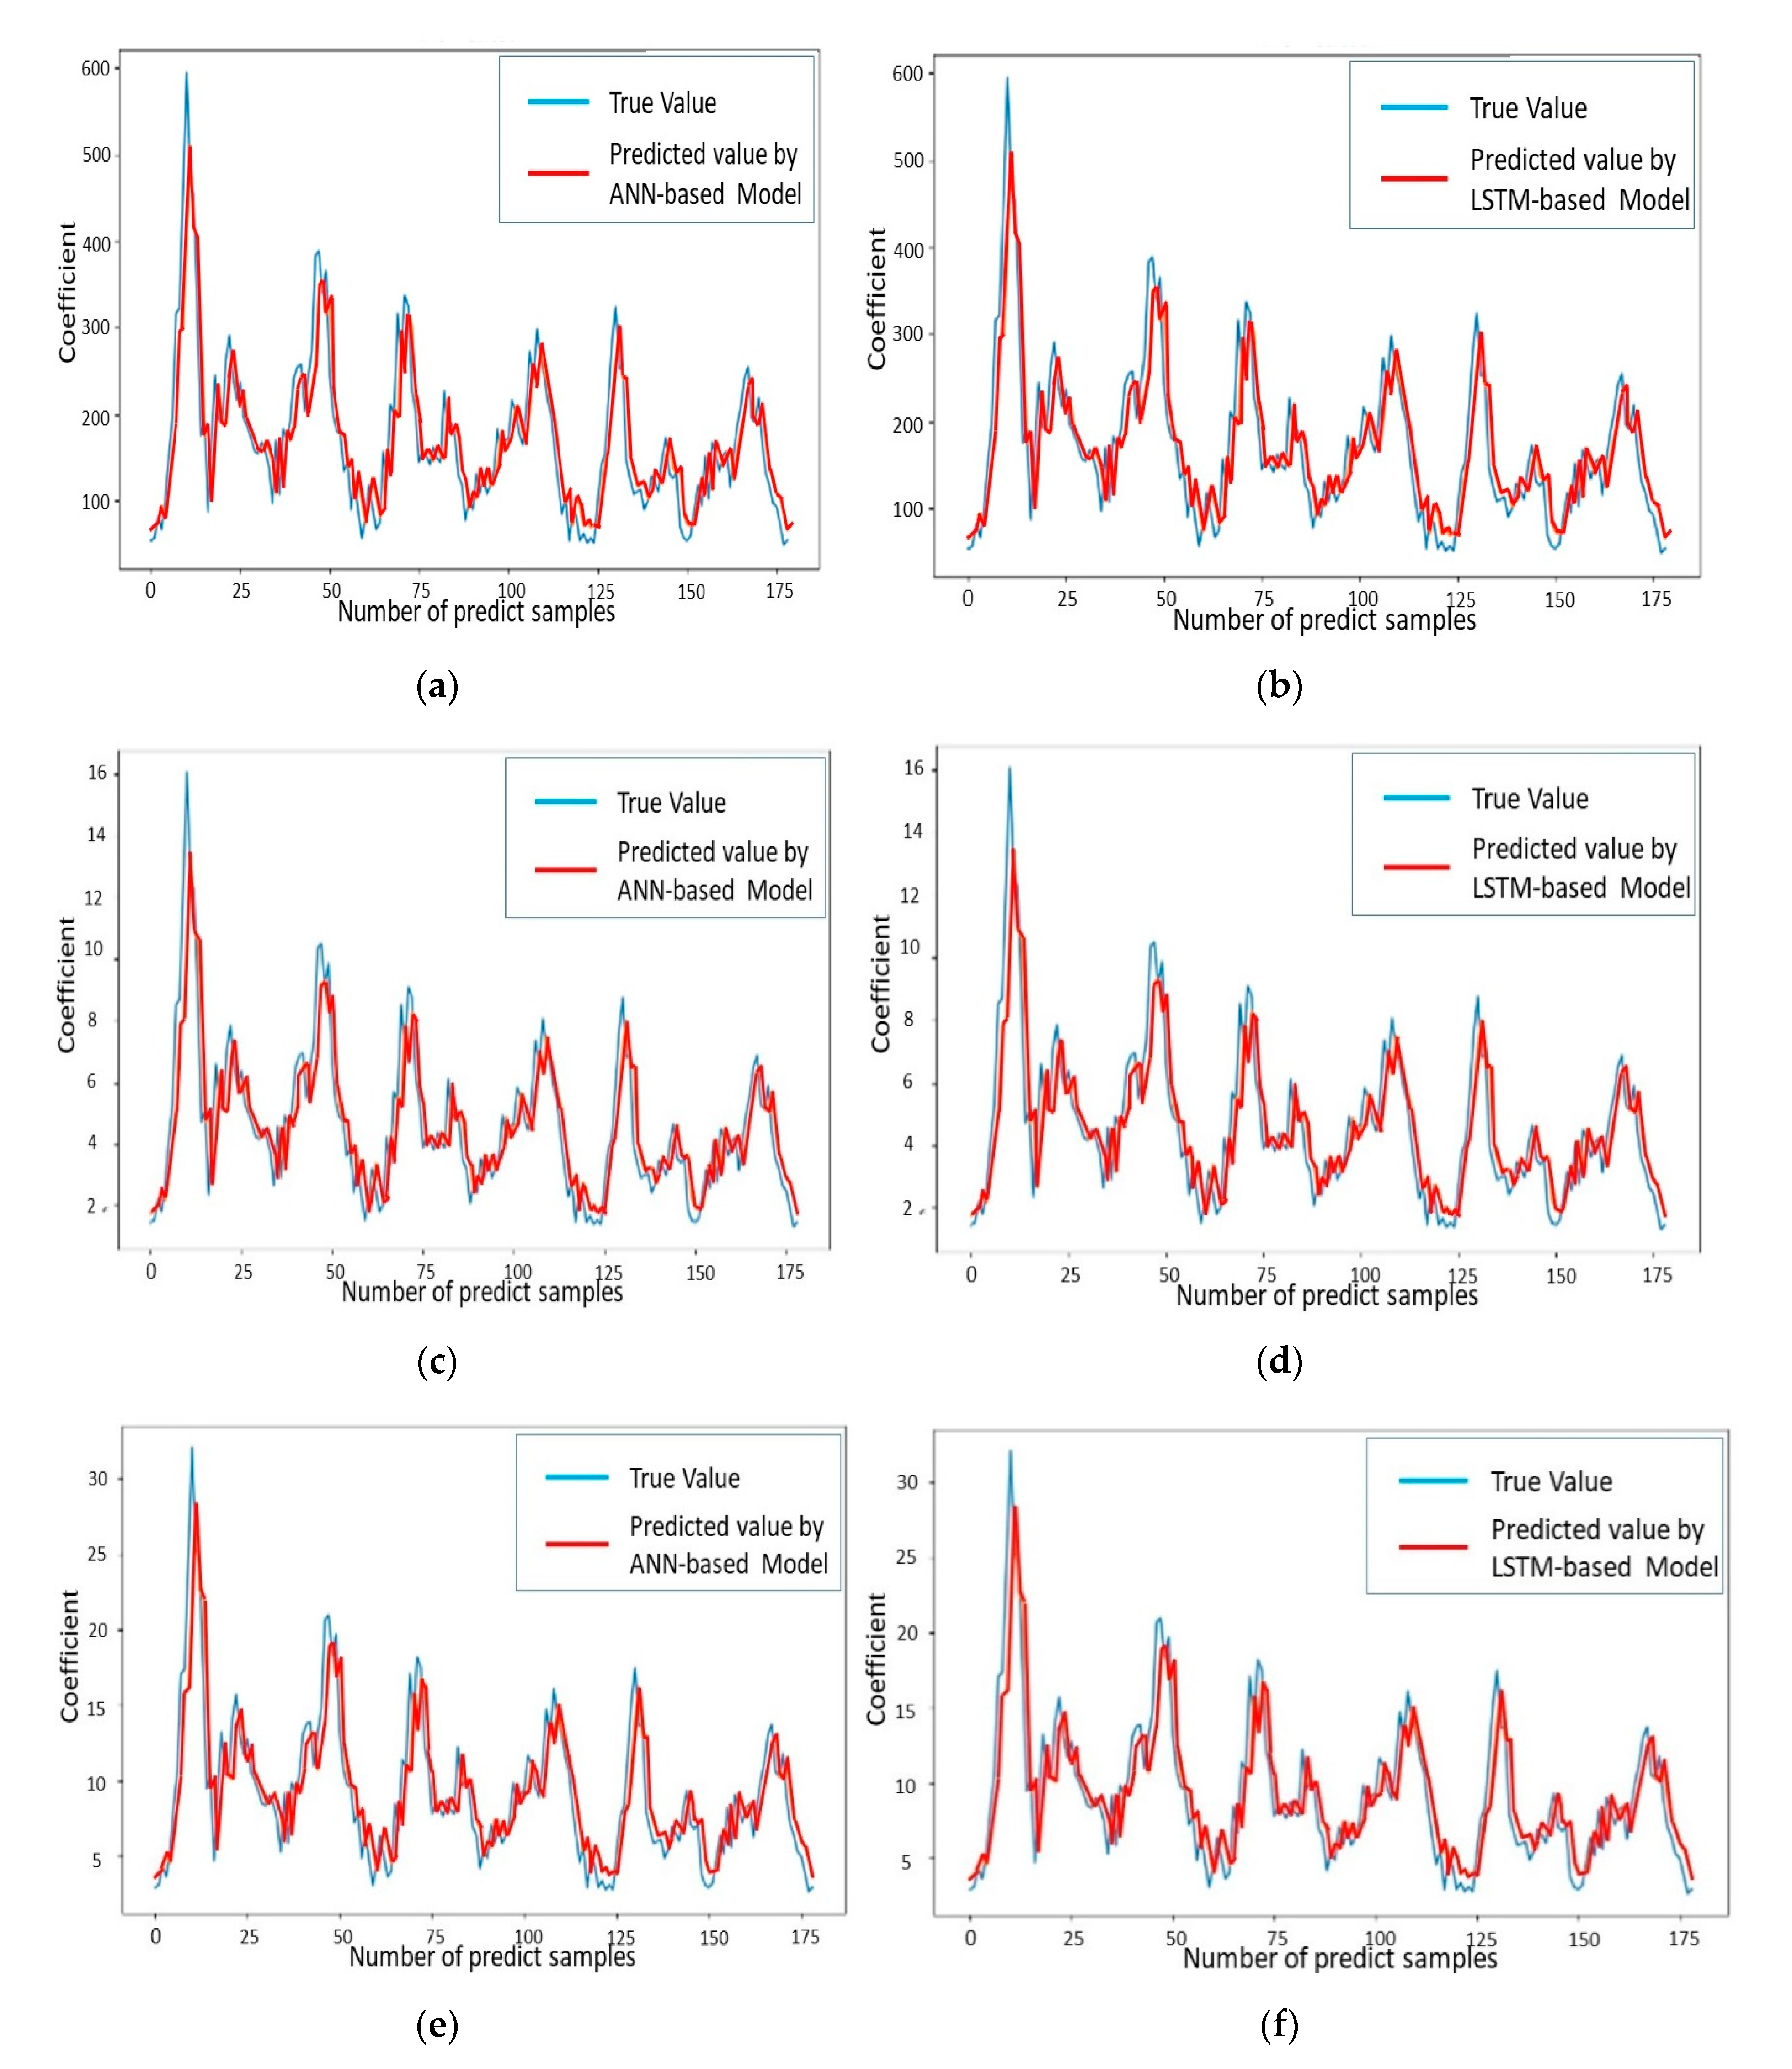
Section 3.2 both forecast the passenger flow of evening rush hour for station 20. Based on whole line regression analysis, the predicted passenger flow of station 20 in morning rush hour was 866. The actual value of passenger flow was 788. The MAPE was 11.6%. Based on single station regression analysis and machine learning, the predicted passenger flow by ANN-based model and LSTM-based model were 580 and 576, respectively. The true value of passenger flow was 589. The MAPE was 3.24% and 3.86%, respectively. The MAE and MAPE of the prediction results by the ANN-based model and LSTM-based model were relatively small, both within the acceptable range. It can be inferred that there is a certain relationship between the passenger flow of the metro station and the land uses around the metro station.
At the same time, we also noticed that the accuracy of passenger flow prediction by using a single station is higher than that by using the whole line. There are two possible reasons for our analysis.
- (1)
In the study of the whole line, the collinearity screening was made for land uses area when using the passenger flow and the land uses around the station, as shown in
Table 3. After screening, the Commercial Residential Land (CRL) was eliminated, and only four types of land use were selected as variables. In the study of a single station, five types of land use were selected as the influencing factors, and the land uses were relatively rich so that more accurate prediction results were obtained.
- (2)
In the study of the whole line, based on the prediction of metro station, the coefficient of the fitting equation was the average coefficient of 10 working days, and the average coefficient was used to predict, the error analysis was made between the prediction results and the average passenger flow of station 20 in 10 working days. However, in the study of single station, the selected passenger flow was the real value of daily passenger flow of 10 working days. Therefore, the prediction results and accuracy were in line with our expectations.
It can be concluded that there is a strong relationship between the passenger flow of the metro station and the land uses around the station. Compared with the whole line, considering the single station achieved more accurate prediction results. Therefore, in the study of metro passenger flow prediction, it is necessary to take the land uses around the station into account, and it is particularly important to take into account land uses around a single station.
5. Conclusions
In this paper, we used mathematical and neural network modeling methods to identify the relationship between the land uses around a metro station and the metro passenger flow. First, we used the categorical regression model to predict the metro passenger flow by considering the spatial relationships between the metro stations within the metro line. Then, Artificial Neural Network and Long Short-Term Memory were used to learn, train, and identify the coefficients of land use in the fitting equation. Based on the metro IC data during July 2018 and 500 m coverage of land uses around the stations along metro line 2, the prediction results show that the mean absolute percentage error of metro line prediction model with categorical regression, single metro station prediction model with artificial neural network, and single metro station prediction model with long short-term memory are 11.6%, 3.24%, and 3.86, respectively. From the effectives and results of the proposed model in this paper, we can conclude that:
- (1)
The finding of this paper can be reconfirmed that there is an association between land use around a metro station and metro passenger flow. Metro passenger flow prediction based on single metro station with short time interval data and using the Artificial Neural Network method achieved higher accuracy and performance. Metro passenger flow prediction based on whole line metro station with rush hour data and using conventional regression method achieved higher accuracy than that of peak hours. It is considered that passenger flow prediction based on land use around metro station will get higher accuracy in using the spatial and temporal information synchronization;
- (2)
The composition of land use around the metro station or along the metro line impacts on the passenger flow generation and the perdition accuracy. The more classifications of land use around the metro station, the higher accuracy will be obtained. The computational complexity and the neural network training time will increase sharply. It was found that the area of commercial residential land will affect the prediction accuracy randomly.
The aim of this paper was to explore the potential association between the land uses and the metro passenger flow, and potentially improve the understanding of the land uses around metro station impact on the metro passenger flow. However, the proposed method is not free from limitation. The first limitation is that we just considered the surface area of land use around the metro station. However, the land use intensity impacts the population density, which will generate metro travel demand. In addition, the value and location of land around the metro station affect the population density and transport mode choice of residents. They are the influences in metro passenger flow prediction. The second limitation is that the station number of other public transit modes was not considered. However, the condition and convenience of public transit network around the metro station will affect the attraction of metro trips by local residents. The third limitation is that the Origin-Destination (OD) of metro passengers was not used in the prediction model. The metro passenger flow is not only affected by the land uses around the metro station, but also by the OD of metro passengers.
These impactor factors and problems should be considered and added in further research. In the near future, further research work will focus on:
- (1)
To improve the prediction accuracy, the influence range of the metro station should be identified instead of a 500 m radius range;
- (2)
More factors affecting the metro travel demand and metro travel choice, such as weather, holidays, and resident distribution, should be included in the model modeling.


