Abstract
Korea is one of the fastest-growing CO2-emitting countries but has recently experienced a dramatic slowdown in emissions. The objective of the study is to examine the driving factors of long-term increases (1990–2015) and their slowdown (2012–2015) in emissions of Korea. This study uses an extended index decomposition analysis model that better fits Korea’s emission trends of the last 25 years by encompassing 19 energy end-use sectors (18 economic sectors and a household sector) and three energy types. The results show that emission increases in the long term (1990–2015) come from economic growth and population growth. However, improvements in energy intensity, carbon intensity, and economic structure offset large portions of CO2 emissions. The recent slowdown (2012–2015) mainly resulted from a decline in energy intensity and carbon intensity in the economic sectors. Among the different energy types, electricity has played a significant role in decreasing emissions because industries have reduced the consumption of electricity per output and the source of electricity generation has shifted to cleaner energies. These results imply that the Korean government should support strategies that reduce energy intensity and carbon intensity in the future to reduce CO2 emissions and maintain sustainable development.
1. Introduction
South Korea is one of the fastest-growing GHG (greenhouse gas)-emitting countries. The average annual growth rate of Korea’s GHG has been 3.8% since 1990, the highest among the Organisation for Economic Co-operation and Development (OECD) members (e.g., USA 0.3%, EU –0.6%, and OECD 0.2%) [1]. This rapid increase in CO2 emissions has led Korea to become the fourth largest contributor to climate change among OECD countries as of 2014, an increase in ranking from eighth in 1990 [2].
However, Korea has recently experienced a dramatic slowdown in GHG growth. The annual average emission growth rate has dropped to 0.3% since 2012. Furthermore, the economy achieved negative emission growth in 2014 for the second time [3]. This was phenomenal, as its first cut in 1998 was due to the Asian financial crisis that reduced CO2 emissions in other Asian countries including China, Japan, Indonesia, Thailand, Malaysia, and the Philippines [2]. An interesting question is how Korean society achieved this slowdown in recent years after experiencing a long-term emission increase.
This study aims to examine the driving factors of the national energy-related CO2 emissions in Korea between 1990 and 2015. We are particularly interested in the drivers that led to the emission downturn after 2012. To find the driving forces, we use index decomposition analysis (IDA). Another popular approach in the literature is structural decomposition analysis (SDA). For our analysis, IDA is more useful, as it requires a smaller amount of data compared to SDA. IDA uses aggregated sectoral data so that it is useful to calculate with relatively long-term datasets. Unlikely, SDA can capture indirect effects of final demand on CO2 emission growth by using input–output tables. However, the input–output tables are not usually published annually and long-term datasets are not available (see [4,5] for a detailed comparison between IDA and SDA).
It is not difficult to find IDA studies in energy or environmental fields. For example, in a case study about Turkish CO2 emission growth, [6] found that the economic activity was the main driver of it. Ref. [7] found that fuel shifts are the biggest contributor to the reduction in CO2 emissions from EU’s power sector after 2007. Ref. [8] demonstrated that the use of household appliances has increased Chinese residential energy consumption between 2002 and 2010. The IDA technique is also applied to group studies across 33 countries [9], G20 countries [10], the European Union [11], and the Asia-Pacific Economic Cooperation (APEC) countries [12]. Two survey papers by [13,14] covered a comprehensive and in-depth review on the IDA studies. This method is also employed for Korea’s energy consumption and CO2 emissions. Ref. [15] analyzed Korea’s energy-related CO2 trends with four driving factors in three terms (1990–1997, 1997–1998, and 1998–2005) for 14 sectors. They found economic growth contributed the most to CO2 emission increases in Korea. Since manufacturing is one of the primary CO2-emitting industries in Korea, [16,17] focused on the industry’s emissions and found that the effects of structural change and energy intensity play major roles in offsetting greenhouse gas emissions in Korea. However, these studies do not address the recent slowdown that has happened since 2012.
We further adopted the IDA method to better fit the emission trends in Korea over the last 25 years. The household sector plays a significant role in Korea’s emission growth [18]. Accordingly, we introduced an extended model similar to [19,20] and considered not only economic sectors, but also the household sector, which is not typically considered in the standard IDA model [21]. Additionally, [18] reported that Korea has increased CO2 emissions by consuming more electricity and gas, but fewer coal and oil products. To capture contributions of each energy sector to emission changes in the last few years, we further decompose the results into three energy types (coal and oil products, electricity, and gas). We find that electricity in particular played a significant role in recent emission reductions in Korea. This conclusion would not have been realized without this detailed disaggregation.
2. Data and Methodology
2.1. Estimation of CO2 Emissions by Sector
The estimation procedure of energy-related CO2 emissions follows the IPCC 1996 guidelines [22]. Sectoral energy consumption data are employed from the energy balance [23] that contains energy use by fuel type (primary energy), energy transformation, and energy end-use sectors (final energy). Primary energy is the sum of final energy and energy transformation. Our analysis is based on the sum of final energy and energy transformation to analyze CO2 emissions by end-use sectors. Consequently, we examined national energy-related CO2 emissions. We focus only on the use of fossil fuels in the final energy because non-fossil energies such as nuclear, hydro, renewable energy, and biomass combustion are excluded from energy-related carbon emissions according to [24] and international conventions, such as [25]. In order to estimate CO2 emissions, two factors are adopted: the conversion factor and carbon emission factor. The former is to convert gross calorific values into net calorific values, while the latter one is to acquire the amount of CO2 emissions according to energy consumption. Following the recommendations of [24,26], national specific emission factors [3] are used rather than IPCC data. We provide a sensitivity analysis by using the IPCC emission factors in the Supplementary Materials.
Table 1 presents the re-classified energy end-use sectors for the sectoral analysis. We match the end-use sector of the energy balance with the industry of national accounts [27]. Apart from the economic sectors, we also take into account the household sector involving the residential sector and household vehicle use. We reallocate the contribution of private car use to emission increases, which originally belonged to land transportation, into the household sector for the following reasons: (i) the literature usually classifies energy consumption associated with private car use as household energy consumption (e.g., [28,29]); (ii) private car use hardly makes economic profit; and (iii) a change in the fuel used in private cars is related to the lifestyle of the household. In order to separate energy consumption for household vehicle use from the land transportation sector, the Energy Consumption Survey [30] and Transportation Statistics [31] are used.

Table 1.
Modified energy end-use sectors.
We reallocate the CO2 emissions from energy transformation into the energy end-use sectors (the 18 economic sectors and the household sector) as in [1]. In the energy balance for Korea [23], energy transformation consists of electricity generation, district heating, gas manufacturing, and its own use and loss. Electricity and gas are the goods produced by other energies, but at the same time, they are the energies consumed by end-users. Some studies treat them as economic sectors, while others regard them as energy types like coal, oil, and natural gas [14,32]. This study treats them as types of energies because it is important to capture electricity and gas consumption behavior given recent trends in Korea. The energy substitution of coal and oil products with electricity or gas is a remarkable trend in Korea’s recent energy use [18]. As electricity and gas are ultimately consumed by end-users, the associated carbon emissions also need to be assigned to the 19 end-use sectors.
This study examines a relatively longer term of data, over 25 years (1990–2015 inclusively) for analysis. We use the Korean energy balance database from 1990 because data prior to 1990 do not distinguish residential sectors from commercial sectors. The last year for this analysis is 2015. National account sector classification has dramatically changed since 2015 such that matching the end-use sector of energy balance with that of national accounts in a systematic manner is impractical. Data frequency is annual. As the analysis relies on multiple datasets, uncertainty may exist, such as data quality or measurement assumptions. For example, measurement errors in national accounts are recognized in the economics literature [33,34,35]. The energy balance database also carries uncertainty in measuring energy demand and supply. Accordingly, the influence of uncertainty on the results and conclusions can vary with such datasets.
2.2. IDA
We extend the Kaya identity [36] to differentiate the 18 economic sectors from the household sector. The national energy-related CO2 emissions at time t consists of emissions in the economic sector i and in the household sector H.
where CO2, Energy, GDP, HFCE, and POP are abbreviations for CO2 emissions, energy consumption, real gross domestic product, household final consumption expenditure, and population, respectively. To simplify the notation, each factor is rewritten as CI for the carbon emissions per energy use, EI for the energy consumption per GDP, STR for the economic structure, PGDP for GDP per capita, CIH for the household carbon emissions per energy use by households, EIH for the household energy consumption per household expenditure, and HC for household final consumption expenditure per capita.
We then apply the LMDI approach for its simplicity and popularity in recent IDA studies (see [5,37,38] for detail on the desirable properties of the LMDI). Changes in carbon emissions between two periods can be decomposed as follows:
where and others are similar forms.
Economic sectors consequently have five effects (CI, EI, STR, PGDP, and POP), while the household sector has four (CIH, EIH, HC, and POPH). The CI effect measures not just changes in the conversion and carbon emissions factors, but also changes in fuel types (e.g., changes in the relative mix of electricity sources). The EI effect captures the energy consumption per GDP, reflecting innovation in energy efficiency technology. The effect of the shift in economic structure in terms of carbon emissions (e.g., from a high-carbon economy to a low-carbon economy or vice versa) is assessed in STR. The PGDP effect captures the economic growth (GDP per capita), whereas the POP effect represents the population growth. The summation of the five factors is consequently identical to the CO2 emissions increase in the 18 economic sectors. In the case of households’ contribution, CIH and EIH account for households’ substitution among energies and changes in energy consumption per household expenditure, respectively. The HC factor captures changes in households’ expenditure per capita. Lastly, POPH measures the contribution of population growth to households’ emissions increases. Table 2 shows driving factors’ acronyms and descriptions.
Table 2.
Driving factors: acronyms and descriptions.
3. Results and Discussion
3.1. Driving Forces of the Increase in CO2 Emissions between 1990–2015
Korea’s CO2 emissions have increased from 228.1 megatonnes (Mt) CO2 in 1990 to 609.2 MtCO2 in 2015. The right side of Table 3 displays the contributions of nine driving factors of the total emission increase for the last 25 years (381.2 MtCO2 = 609.2 MtCO2 − 228.1 MtCO2) and reveals that the effect of economic growth (PGDP) is dominant. Economic growth (PGDP) accounts for 92.7% of the emissions increases, which is consistent with those of [15,16,39]. The growth in population (POP) is another significant driver of the emissions increases. The considerable contributions of PGDP and POP to the emission growth may seem obvious as the Korean economy and the population have continuously increased in the last 25 years.
Table 3.
CO2 emissions and IDA results of the 19 end-use sectors (1990–2015) (unit: MtCO2, %).
On the contrary, three effects (CI, EI, and STR) are negative. In particular, the negative STR effect (−15.4%) implies that structural change in the industries is an important factor in offsetting CO2 emissions over an extended period. The role of carbon intensity, energy intensity, and structural change in reducing emissions in the long term is also observed in other countries, such as the United States, Japan, Canada, Australia, Mexico, China [12], Spain [40], and Ireland [41].
One of the most important sectors among the 19 end-users is the household sector. Households were the largest CO2-emitting sector in 1990 and the second largest in 2015. Household behavior accounts for an 11.9% increase in emissions, mainly due to an increase in HC (18.9%) and POPH (3.7%). The intuitive reasoning behind the large contribution of HC and POPH is the same as before: the growth in the Korea’s economy and population. Nonetheless, the changes in energy intensity and carbon intensity greatly reduced emissions (EIH: −9.2%, CIH: −1.5%). We further break down the two negative factors, CIH and EIH, into three energy types (coal and oil products, electricity, and gas). Figure 1 shows only coal and oil products contributed to negative EIH and CIH, while both electricity and gas increased emissions. The negative EIH of coal and oil products (and the positive CIH of electricity and gas) imply that households have consumed relatively fewer coal and oil products (and more electricity and gas) compared to 1990. The net effect of this energy substitution is a large carbon reduction, which is consistent with [18]. The negative CIH of coal and oil products can be interpreted as the consequence of the energy substitution within the products: from more carbon intensive products (e.g., coal) to less intensive ones (e.g., oils). This trend also contributed to offsetting the emissions caused by economic growth in Korea.
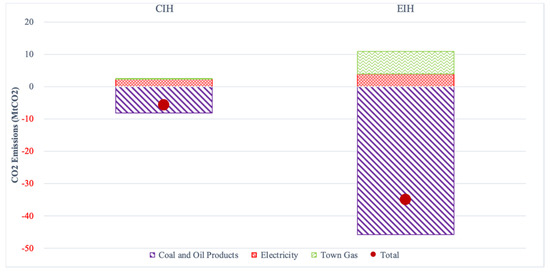
Figure 1.
Household carbon emissions per energy use by households (CIH) and household energy consumption per household expenditure (EIH) by three energy types.
The iron and steel sector, the petroleum chemical sector, the commercial sector, and the fabricated metal sector also made large contributions to emissions growth. These four sectors show a relatively large positive EI (5.6%, 2.4%, 0.6%, and 4.9%, respectively), which demonstrates these industries consumed more energy during the production process and increased CO2 emissions. Instead, the electronic equipment, transportation equipment, and other manufactured products sector, the road transportation sector, and the non-metallic mineral products sector have large negative EI effects (−4.1%, −5.1%, and −3.7%, respectively).
The time series of Korea’s emissions and the driving factors reveals three findings (see Figure 2). First, CO2 emissions growth peaked in 2010 (54.3 MtCO2). The sudden surge in 2010 is attributed to PGDP (25.3 MtCO2), HC (4.0 MtCO2), and STR (17.4 MtCO2), implying an influence of economic recovery during the post-global financial crisis period. This “rebound effect” that resulted in a surge of carbon emissions occurred around the world [42]. The upturn in CO2 emissions in 1999 (31.2 MtCO2) right after the Asian financial crisis was also dominantly derived from the PGDP effect (28.7 MtCO2) and HC (7.6 MtCO2), verifying the rebound effect after the economic shock.
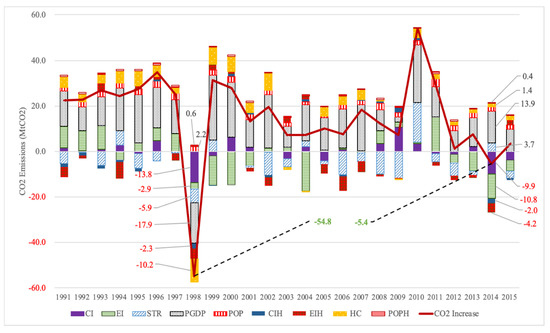
Figure 2.
Time series IDA results by nine driving factors.
Second, the rapid CO2 emissions growth in Korea has fallen since 2012. Except for 1998, the emission growth rate is higher than 1.4% before 2012. After 2012, however, it drops to 1.2% at most. The annual average emission growth rate for 2012–2015 is 0.3%.
Third, a reduction in emissions is observed in 2014. This was the first reduction in Korea since 1998. The first emissions cut observed in 1998 is clearly a result of the economic shock in relation to the PGDP of −17.9 MtCO2 and HC of −10.2 MtCO2. However, this emissions reduction in 2014 was achieved even with positive economic growth (13.9 MtCO2) and a corresponding household consumption increase (1.4 MtCO2). The economy lowered its carbon emissions owing to EI (−10.8 MtCO2), EIH (−4.2 MtCO2), CI (−9.9 MtCO2), and CIH (−2.0 MtCO2). These results demonstrate that the Korean economy achieved a CO2 reduction in 2014 through the improvement of carbon intensity and energy intensity.
3.2. A Recent Slowdown in CO2 Emissions after 2012
The recent slowdown in CO2 in the Korean economy is remarkable, as seen in Table 4. While the average annual growth rate (AAGR) of emissions before the slowdown period (1990–2011) is 4.9% (17.8 MtCO2 per annum), it plunges to 0.3% (1.7 MtCO2 per annum) after 2012. While the economic growth of 5.7% is also downgraded to 2.7%, the consumption of energy (4.9% to 1.0%) and electricity (7.9% to 1.5%) was reduced faster than the GDP.
Table 4.
Average annual growth rate (AAGR) of major variables before and after 2012 (unit: %, %p).
Calculating the contributions of the nine factors, we find a noticeable change in EI after 2012 (−7.8 MtCO2). Table 5 shows that economic sectors have increased the use of energy and consequently sped up the emissions growth until 2011 (0.7 MtCO2 per annum). However, it turns into one of the main contributors to the CO2 reduction after 2012 (−7.0 MtCO2 per annum). The CI effect also shows a similar direction. The positive contribution of CI before 2012 (0.6 MtCO2 per annum) changes to a negative effect for 2012–2015 (−3.3 MtCO2 per annum). This implies that the Korean economy mitigated large amounts of carbon by increasingly relying on less carbon-intensive energy sources.
Table 5.
Annual averages of the nine factors before and after 2012 (unit: MtCO2).
To see how Korean society has changed the use of energies during the slowdown period, Table 6 further breaks down CI (and CIH) and EI (and EIH) by the three energy types (coal and oil products, electricity, and gas). We find that electricity played a significant role. Before 2012, the economy increased electricity consumption, emitting more CO2 (EI: 3.4 MtCO2 per annum). For 2012–2015, however, it achieved CO2 reductions by using less electricity per GDP (EI: −1.8 MtCO2 per annum). In addition, the negative CI and CIH effects are mainly caused by electricity (−3.0 MtCO2 and −0.5 MtCO2 per annum), which implies that power generation has changed such that it now uses less carbon-intensive energy sources. This is distinctive when compared to the positive CI and CIH effects by electricity before the slowdown (1.0 MtCO2 and 0.2 MtCO2 per annum). During the slowdown period (2012–2015), the share of renewables in electricity production has doubled (from 2% to 4%) and the share of nuclear power that does not produce direct CO2 emissions has increased by 2% (from 29% to 31%), according to [23]. Meanwhile, less power was generated from natural gas (from 22% to 19%), while the share of coal-fired power has been stable (39% in both 2012 and 2015). This implies that the source of power generation has shifted to cleaner energies, thereby reducing carbon emissions.
Table 6.
Annual averages of CI and EI effects by three energy types before and after 2012 (unit: MtCO2).
When analyzing the long-term driving forces between 1990 and 2015, we point to the shift in energy use of households from coal and oil products to electricity and gas as a contributor to emission cuts. For the recent years from 2012 to 2015, however, households used more coal and oil products, but less electricity and gas relative to the rise in household expenditure. Table 6 reports that the EIH of coal and oil products is 0.2 MtCO2, while that of electricity and gas is −0.3 MtCO2 and −1.1 MtCO2 per annum. It is also possible to see contributions of each economic sector to the slowdown. Table 7 shows that substantial emissions have recently declined through improvement in energy intensity (EI) among four industries: commercial (0.5 MtCO2 → −2.0 MtCO2); electronic equipment, transportation equipment, and other manufactured products (−0.3 MtCO2 → −2.4 MtCO2); petroleum chemical (0.7 MtCO2 → −1.4 MtCO2); and fabricated metal (0.9 MtCO2 → −0.2 MtCO2). We further analyze the difference in EI by separating energy types and find that commercial and fabricated metal have reduced the energy intensity of electricity, while electronic equipment, transportation equipment, and other manufactured products and petroleum chemical have reduced consumption of coal and oil products per outputs (Figure 3). Commercial, petroleum chemical, and fabricated metal improved the energy intensity of gas as well, leading to the observed decline in CO2 during the slowdown period.
Table 7.
Annual averages of CI and EI effects by economic sectors before and after 2012 (unit: MtCO2).
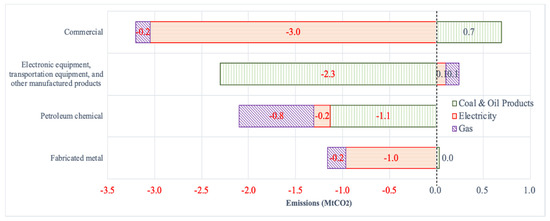
Figure 3.
The decomposition of the EI difference by energy types for four economic sectors.
3.3. Discussion
Based on the results of the IDA analysis, it is clear that the negative EI and CI effects have made CO2 emissions reductions possible for the slowdown (2012–2015) period. Ref. [43,44] reported that a recent decline in carbon intensity and energy intensity has been observed in many countries. In particular, the negative EI effect is reported in several country-case studies, such as Ireland [41], Spain [40], Turkey [6], and a group of 33 other countries [9]. Given that a rise in CO2 emissions is naturally linked to economic and population growth over long periods of time, it would be meaningful to make continued efforts towards lowering carbon and energy intensity for sustainable development.
The EI effect, a major contributor to the recent slowdown, is closely related to innovation in energy efficiency technology. The Korean government has implemented several policies to improve energy efficiency through technological innovation, including the First National Energy Master Plan (2008–2030) [45] and the Second National Energy Plan [46]. Additionally, the Emission Trading Scheme that started in 2015 also provides incentives to develop energy efficiency technologies at the firm level. These strategies would be effective in maintaining this recent carbon reduction in Korea.
From an energy type perspective, the role of electricity in recent years is remarkable. In the long term, increasing the consumption of electricity relative to other energies has led to emissions growth in Korea [18]. The reliance on electricity is mainly due to its cheapest price among the OECD countries [47]. The price of electricity in Korea has been a debatable aspect of striking a balance in the reduction of CO2 emissions. Korea has kept electricity prices low to enhance firms’ competitiveness and lower citizens’ living costs. However, the rapid increases in electricity consumption itself have become a source of increasing CO2 emissions. Furthermore, Korea suffered a serious rolling power outage in 2011. The government has recently raised electricity prices not only to reduce carbon emissions but also to manage power demand. During the slowdown period (2012–2015), the electricity price has increased by 5.0% per year, which is far higher than the growth rates in OECD countries with low electricity prices such as the US (1.2%), Canada (−1.3%), and Mexico (−4.9%) [48]. This rapid increase in electricity price could influence the observed reduction in electricity consumption in Korea, one of the most significant contributors to the recent CO2 emissions reduction.
Another contributor to the slowdown is the CI (CIH) of electricity. This is mainly caused by a change in the source of power generation into cleaner energies. As reported in the literature (e.g., [20]), the carbon intensity reductions by the diversification of the energy mix towards cleaner sources could be a crucial factor contributing to emissions mitigation. The Korean government recently declared a GHG emissions reduction roadmap in 2016 to switch power generation from coal-fueled power to cleaner energy sources by 2030. To constantly reduce CO2 emissions, the plan needs to be well implemented.
4. Conclusions
Korea has experienced fast increases over three decades and downturns in CO2 emissions since 2012, which is an interesting fact to explore Korea’s GHG situation. To examine the driving forces behind Korea’s energy-related CO2 emissions from 1990 to 2015, this study investigates drivers of the recent slowdown in CO2 emissions and differences from long-term driving forces of emissions before 2012. To take a close look at Korea’s unique emissions trends and their driving factors in depth, this study adopts an extended IDA approach that considers 18 economic sectors as well as the household sector. To better fit Korea’s CO2 emissions, this study reallocates the CO2 emissions from energy transformation into the energy end-use sectors. We further analyze the sectors by segregating three energy types used in each sector (i.e., coal and oil products, electricity, and gas). This segregation enables us to capture a significant role of electricity in slowing down emissions. The detailed step-by-step decomposition is one of the contributions of this study to environmental economics and can be applicable to other countries in similar situations.
The IDA results demonstrate that the growth in GDP per capita lead to Korea’s long-term increases in CO2 emissions between 1990 and 2015, while the change in energy intensity, carbon intensity, and economic structure have reduced CO2 emissions. The recent CO2 emissions slowdown (2012–2015) is mainly due to a reduction in energy intensity (EI) and carbon intensity (CI, CIH). In particular, electricity has played a significant role; Korean society reduced its consumption of electricity per GDP (or household consumption) and the source of power generation has shifted to cleaner sources during the slowdown period. As the United Nations’ (2015) Sustainable Development Goals take into account environmental issues as being a high priority around the world, the Korean government will need to focus more on climate policies that improve CI and EI to maintain the slowdown trend for long periods of time.
The limitation of this study is that the indirect effects of final demand on the emissions growth could not be calculated with IDA techniques. To compare the differences of effects by using the two methods (e.g., IDA and SDA), further research can examine how the changes in final demand affect CO2 emissions in Korea directly and indirectly.
Supplementary Materials
The following are available online at https://www.mdpi.com/2071-1050/12/17/6924/s1, Table S1. CO2 emissions and IDA results of the 19 end-use sectors (1990-2015) (unit: MtCO2, %), Table S2. Annual averages of the nine factors before and after 2012 (unit: MtCO2).
Author Contributions
Conceptualization, methodology, formal analysis, and writing W.O. and J.Y. All authors have read and agreed to the published version of the manuscript.
Funding
This work was partially supported by the Greenhouse Gas Inventory and Research Center of Korea. Wankeun Oh gratefully acknowledges the financial support from the Hankuk University of Foreign Studies Research Fund 2020.
Acknowledgments
The authors thank Yong-Gun Kim and two anonymous referees for very helpful comments and suggestions.
Conflicts of Interest
The authors declare no conflict of interest.
References
- International Energy Agency. Indicators for CO2 Emissions; International Energy Agency: Paris, France, 2018. [Google Scholar] [CrossRef]
- World Bank. World Development Indicators; World Bank: Washingtong, DC, USA, 2020. [Google Scholar]
- Greenhouse Gas Inventory & Research Center of Korea (GIR). National Greenhouse Gas Inventory Report of Korea; The Government of the Republic of Korea: Seoul, Korea, 2016.
- Hoekstra, R.; van den Bergh, J.C.J.M. Comparing structural decomposition analysis and index. Energy Econ. 2003, 25, 39–64. [Google Scholar] [CrossRef]
- Su, B.; Ang, B.W. Structural decomposition analysis applied to energy and emissions: Some methodological developments. Energy Econ. 2012, 34, 177–188. [Google Scholar] [CrossRef]
- İpek Tunç, G.; Türüt-Aşık, S.; Akbostancı, E. A decomposition analysis of CO2 emissions from energy use: Turkish case. Energy Policy 2009, 37, 4689–4699. [Google Scholar] [CrossRef]
- Karmellos, M.; Kopidou, D.; Diakoulaki, D. A decomposition analysis of the driving factors of CO2 (Carbon dioxide) emissions from the power sector in the European Union countries. Energy 2016, 94, 680–692. [Google Scholar] [CrossRef]
- Nie, H.; Kemp, R. Index decomposition analysis of residential energy consumption in China: 2002–2010. Appl. Energy 2014, 121, 10–19. [Google Scholar] [CrossRef]
- Andreoni, V.; Galmarini, S. Drivers in CO2 emissions variation: A decomposition analysis for 33 world countries. Energy 2016, 103, 27–37. [Google Scholar] [CrossRef]
- Yao, C.; Feng, K.; Hubacek, K. Driving forces of CO2 emissions in the G20 countries: An index decomposition analysis from 1971 to 2010. Ecol. Inform. 2015, 26, 93–100. [Google Scholar] [CrossRef]
- Fernández González, P.; Landajo, M.; Presno, M.J. The Divisia real energy intensity indices: Evolution and attribution of percent changes in 20 European countries from 1995 to 2010. Energy 2013, 58, 340–349. [Google Scholar] [CrossRef]
- Lee, K.; Oh, W. Analysis of CO2 emissions in APEC countries: A time-series and a cross-sectional decomposition using the log mean Divisia method. Energy Policy 2006, 34, 2779–2787. [Google Scholar] [CrossRef]
- Ang, B.W.; Zhang, F.Q. A survey of index decomposition analysis in energy and environmental studies. Energy 2000, 25, 1149–1176. [Google Scholar] [CrossRef]
- Xu, X.Y.; Ang, B.W. Index decomposition analysis applied to CO2 emission studies. Ecol. Econ. 2013, 93, 313–329. [Google Scholar] [CrossRef]
- Oh, I.; Wehrmeyer, W.; Mulugetta, Y. Decomposition analysis and mitigation strategies of CO2 emissions from energy consumption in South Korea. Energy Policy 2010, 38, 364–377. [Google Scholar] [CrossRef]
- Jeong, K.; Kim, S. LMDI decomposition analysis of greenhouse gas emissions in the Korean manufacturing sector. Energy Policy 2013, 62, 1245–1253. [Google Scholar] [CrossRef]
- Choi, K.-H.; Oh, W. Extended Divisia index decomposition of changes in energy intensity: A case of Korean manufacturing industry. Energy Policy 2014, 65, 275–283. [Google Scholar] [CrossRef]
- Kim, Y.-G.; Yoo, J.; Oh, W. Driving forces of rapid CO2 emissions growth: A case of Korea. Energy Policy 2015, 82, 144–155. [Google Scholar] [CrossRef]
- Wu, L.; Kaneko, S.; Matsuoka, S. Driving forces behind the stagnancy of China’s energy-related CO2 emissions from 1996 to 1999: The relative importance of structural change, intensity change and scale change. Energy Policy 2005, 33, 319–335. [Google Scholar] [CrossRef]
- de Freitas, L.C.; Kaneko, S. Decomposition of CO2 emissions change from energy consumption in Brazil: Challenges and policy implications. Energy Policy 2011, 39, 1495–1504. [Google Scholar] [CrossRef]
- Mousavi, B.; Lopez, N.S.A.; Biona, J.B.M.; Chiu, A.S.F.; Blesl, M. Driving forces of Iran’s CO2 emissions from energy consumption: An LMDI decomposition approach. Appl. Energy 2017, 206, 804–814. [Google Scholar] [CrossRef]
- Intergovernmental Panel on Climate Change. Revised 1996 IPCC Guidelines for National Greenhouse Gas Inventories; Intergovernmental Panel on Climate Change: Geneva, Switzerland, 1997. [Google Scholar]
- Ministry of Trade Industry and Energy (MOTIE) and Korea Energy Economics Institute (KEEI). Yearbook of Energy Statistics 2017; KEEI: Ulsan, Korea, 2017. [Google Scholar]
- Intergovernmental Panel on Climate Change. 2006 IPCC Guidelines for National Greenhouse Gas Inventories; Intergovernmental Panel on Climate Change: Geneva, Switzerland, 2006. [Google Scholar]
- Energy Information Administration. Monthly Energy Review; EIA: Washington, DC, USA, 2018.
- United Nations Statistical Commission. International Recommendations for Energy Statistics; UNSD: New York, NY, USA, 2018. [Google Scholar]
- Bank of Korea. Economic Statistics System; Bank of Korea: Seoul, Korea, 2017. [Google Scholar]
- Biesiot, W.; Noorman, K.J. Energy requirements of household consumption: A case study of The Netherlands. Ecol. Econ. 1999, 28, 367–383. [Google Scholar] [CrossRef]
- Anker-Nilssen, P. Household energy use and the environment—A conflicting issue. Appl. Energy 2003, 76, 189–196. [Google Scholar] [CrossRef]
- Ministry of Trade Industry and Energy (MOTIE). Energy Consumption Survey 2014; MOTIE: Sejong City, Korea, 2015.
- Ministry of Land Infrastructure and Transport MOLIT. Statistics System; MOLIT: Sejong City, Korea, 2017.
- Nag, B.; Parikh, J. Indicators of carbon emission intensity from commercial energy use in India. Energy Econ. 2000, 22, 441–461. [Google Scholar] [CrossRef]
- Mankiw, N.G.; Shapiro, M.D. News or Noise: An Analysis of GNP Revision; Survey of Current Business; National Bureau of Economic Research: Cambridge, MA, USA, 1986. [Google Scholar]
- Aruoba, S.B.; Diebold, F.X.; Nalewaik, J.; Schorfheide, F.; Song, D. Improving GDP measurement: A measurement-error perspective. J. Econom. 2016, 191, 384–397. [Google Scholar] [CrossRef]
- Orphanides, A. Monetary Policy Rules Based on Real-Time Data. Am. Econ. Rev. 2001, 91, 964–985. [Google Scholar] [CrossRef]
- Kaya, Y. Impact of Carbon Dioxide Emission Control on GNP Growth: Interpretation of Proposed Scenarios; IPCC Energy and Industry Subgroup: Geneva, Switzerland, 1990. [Google Scholar]
- Ang, B.W. Decomposition analysis for policymaking in energy: Which is the preferred method? Energy Policy 2004, 32, 1131–1139. [Google Scholar] [CrossRef]
- Ang, B.W. LMDI decomposition approach: A guide for implementation. Energy Policy 2015, 86, 233–238. [Google Scholar] [CrossRef]
- Jung, S.; An, K.-J.; Dodbiba, G.; Fujita, T. Regional energy-related carbon emission characteristics and potential mitigation in eco-industrial parks in South Korea: Logarithmic mean Divisia index analysis based on the Kaya identity. Energy 2012, 46, 231–241. [Google Scholar] [CrossRef]
- Cansino, J.M.; Sánchez-Braza, A.; Rodríguez-Arévalo, M.L. Driving forces of Spain’s CO2 emissions: A LMDI decomposition approach. Renew. Sustain. Energy Rev. 2015, 48, 749–759. [Google Scholar] [CrossRef]
- O’Mahony, T. Decomposition of Ireland’s carbon emissions from 1990 to 2010: An extended Kaya identity. Energy Policy 2013, 59, 573–581. [Google Scholar] [CrossRef]
- Peters, G.P.; Marland, G.; Le Quéré, C.; Boden, T.; Canadell, J.G.; Raupach, M.R. Rapid growth in CO2 emissions after the 2008–2009 global financial crisis. Nat. Clim. Chang. 2012, 2, 2–4. [Google Scholar] [CrossRef]
- Peters, G.P.; Andrew, R.M.; Canadell, J.G.; Fuss, S.; Jackson, R.B.; Korsbakken, J.I.; Le Quéré, C.; Nakicenovic, N. Key indicators to track current progress and future ambition of the Paris Agreement. Nat. Clim. Chang. 2017, 7, 118–122. [Google Scholar] [CrossRef]
- International Energy Agency. Energy Efficiency 2017; International Energy Agency: Paris, France, 2017. [CrossRef]
- The Korean Government. The First National Energy Master Plan (2008–2030); The Korean Government: Seoul, Korea, 2008.
- The Korean Government. The Second National Energy Master Plan; The Korean Government: Seoul, Korea, 2014.
- International Energy Agency. Energy Prices in US Dollars; International Energy Agency: Paris, France, 2020. [CrossRef]
- International Energy Agency. Energy Prices in National Currency per Toe; International Energy Agency: Paris, France, 2018. [CrossRef]


© 2020 by the authors. Licensee MDPI, Basel, Switzerland. This article is an open access article distributed under the terms and conditions of the Creative Commons Attribution (CC BY) license (http://creativecommons.org/licenses/by/4.0/).