Article

Using a Sensory Learning Framework to Design Effective Curricula: Evidence from Indigenous Nutrition Education Programs

W. P. Carey School of Business, Morrison School of Agribusiness, Arizona State University, Mesa, AZ 85212, USA
*
Author to whom correspondence should be addressed.
Sustainability 2020, 12(17), 7077; https://doi.org/10.3390/su12177077
Submission received: 11 July 2020 / Revised: 25 August 2020 / Accepted: 27 August 2020 / Published: 30 August 2020
(This article belongs to the Special Issue Sustainable Agri-Food Systems)

Abstract

:
As health disparities among Native Americans persist, promoting better health outcomes is of paramount concern among Indigenous populations. A variety of programs exist that try to alleviate problems resulting in higher rates of diet-related chronic diseases and premature death. For this study, we collaborated with an Indigenous-led nonprofit that implemented a series of nutrition education courses designed to empower community members to make healthier food choices. The theoretically based curriculum, which provided learners with information in the form of sensory-based modules, e.g., food preparation, food handling, cultural awareness, and practical cooking skills, was introduced in various communities in the Great Plains and Southwest. The nutrition education programs were modeled after a canonical educational learning model, Bloom’s Taxonomy, designed to provide participants with information and resources necessary to make healthier food choices across three cognitive domains (i.e., tiers). We used a mixed-methods approach, coupling Principal Components Analysis with a qualitative SWOT (Strengths, Weaknesses, Opportunities, Threats) analysis, to assess each program’s capacity to enhance learning retention, i.e., to assess the salience of information provided and the extent to which each program was more or less successful in participants’ learning. We found that course content and instruction are strongly correlated with program satisfaction. In addition, from the qualitative analysis, we found that as each successive module of the program challenged higher cognitive domains, participants were more likely to indicate satisfaction in the course material as well as state a desired change in their behavior, which we attribute to participants’ ability to synthesize and evaluate information. Aspects of this programming framework have the potential to be adapted to and integrated into other Native communities striving for the successful adoption of healthier diets.

1. Introduction

Native Americans are disproportionately affected by many diet-related chronic health problems, including diabetes and obesity [1]. According to the Centers for Disease Control (CDC), Native American adults have the highest rates of diabetes compared to any other race or ethnicity [2]. Many factors may contribute to worsening health conditions. The CDC explains that social determinants of health, including access to and availability of food options, are major predictors of health outcomes [3]. The inability to achieve optimal health within and beyond Native communities has been largely attributed to insufficient access to places that sell healthy, affordable foods, and this is particularly burdensome to low-income communities. Coupled with high rates of poverty and unemployment prevalent in reservation communities, these populations may be at an increased risk of food insecurity, where households are unable to acquire enough food for their families to lead an “active, healthy life” [4]. Limited research exists that examines the levels of food insecurity among Native Americans, yet at least one study finds that food insecurity is higher among Native Americans compared to non-Natives [5].
Before settler contact, Native Americans, especially in desert cultures, relied on a balance of animal- and plant-based foods sourced from hunting and gathering to meet their dietary needs. Arid plants were high in fiber and contained hypoglycemic compounds that, combined with regular physical activity, resulted in higher metabolic efficiency and limited insulin secretion for most Native Americans [6]. Following the displacement of Native people from their lands and relocation to geographically isolated reservations, the US government established food annuities, and today the Food Distribution Program on Indian Reservations (FDPIR) has become an essential component of household food security [7,8]. However, these boxes have been found to be nutritionally inferior and not culturally appropriate [9], as they exclude traditional foods that their ancestors had before settlers arrived in America. Instead, the composition of foods is calorie-dense and high in fats and sugars. Some claim that, over time, the exposure to commodity foods has not only contributed to the deterioration of the knowledge of the traditional Native American diet, but has also coincided with increased rates of degenerative diseases that were historically low among Indigenous populations [10].
Tribal communities have taken steps to address mounting health concerns with an emphasis on cultural suitability through the development of health and wellness programs. For example, the Stanford Chronic Disease Self-Management Program was intended to address diabetes within urban Native communities in Santa Clara Valley, California [11]. The program had the highest retention rate of any class offered at the Indian Health Center, in addition to increasing fitness center usage by 34% [11]. Another wellness program in Alaska took these efforts further by using a community-based approach to incorporate Yup’ik values into the curriculum [12]. Along these lines, there is an ongoing desire for nutrition education that teaches basic cooking skills and incorporates culturally sensitive elements into food preparation as a means to drive improvements in food choices [13]. To our knowledge, no study has specifically examined Indigenous-based nutrition education programs.
For this study, we collaborated with an Indigenous-led nonprofit and examined a series of nutrition education programs designed to empower community members to make healthier food choices and to develop a deeper awareness of their communities’ cultures and traditions. We were interested in evaluating whether a theoretically sound educational framework, namely Bloom’s Taxonomy [14], when applied to an Indigenous nutrition education programming, would be perceived positively by participants. Thus, the aim of this study was to explore the use of Bloom’s Taxonomy as a framework underpinning Indigenous nutrition education programs and to identify key outcomes from participation in such programs. We found that designing a curriculum with objectives characterized according to Bloom’s Taxonomy appeared to improve overall participant satisfaction and retention of information—two outcomes that are linked with behavioral change and improved health outcomes [15,16,17]. Of the programs we examined in this study, a “train-the-trainer” (T3) program had the most favorable results as determined by participants’ program sentiments. This also supports the rationale for using Bloom’s Taxonomy as a framework for designing program curricula, since a T3 program utilized learning objectives from all tiers which build higher-order thinking skills and the development of self-efficacy.

2. Application of Bloom’s Taxonomy to Nutrition Education Programs

Although many barriers and accompanying interventions exist that contribute to achieving optimal health, in this study, we focused on barriers experienced at the individual level, such as lack of knowledge, weak motivation, and misperceptions about what constitutes a nutritionally sound, ancestral diet. Furthermore, we considered providing information as the primary mechanism to overcome individual-level barriers and incite changes in individuals’ behavior.
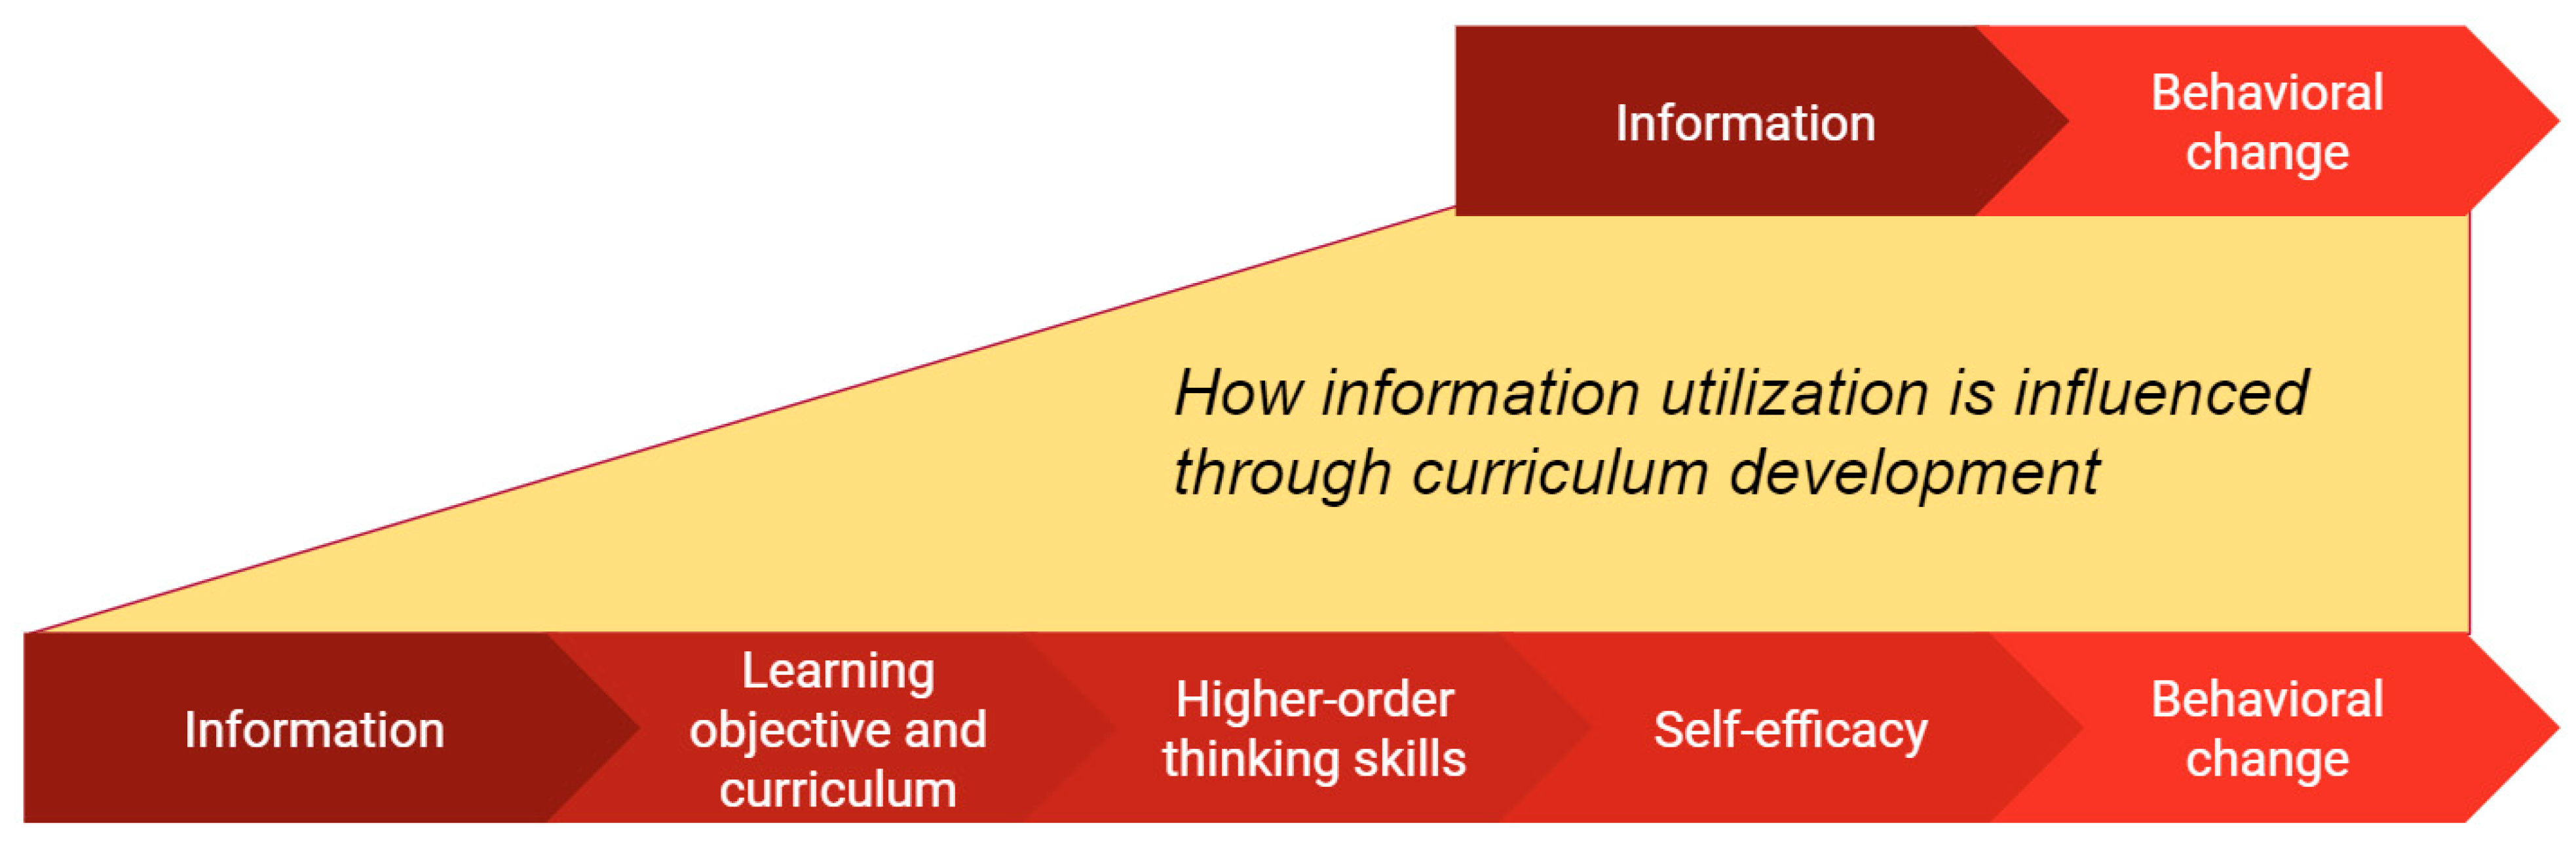
To facilitate the discussion, we bring the reader’s attention to the theory of change framework, summarized in Figure 1. When barriers to accessing healthy foods are attributed to lack of knowledge, providing information is one intervention that can allow for improved food choices [18]. This relationship is represented in the top panel of Figure 1. Information as an intervention tool is empowering, because it preserves a participant’s ability to make a choice after receiving the information from that intervention, whereas other interventions may inadvertently result in participants becoming dependent on the program in the long term. Examples of this can be seen in food bank utilization rates or long-term use of other temporary assistance programs [19,20]. Information-based programs can also be more cost-effective compared to other types of programs [21,22]. One study found that an increase in health literacy contributed to an increase in diabetes knowledge and self-management behavior, in which participants were more likely to self-monitor and adjust their behavior to manage their symptoms [23]. Although studies have found success in using information as a strategy to overcome barriers that inhibit improved food choices, information alone is more often ineffective when used as an intervention tool. The ineffectiveness of information-based campaigns on overall behavioral change has been shown in studies on substance abuse prevention interventions, where attitudes on substance abuse became more negative, but abusing behavior either did not change or increased [24]. In a study examining the most commonly consumed foods among Native American women in Oklahoma, Taylor et al. [25] found that providing information on fat content had little effect on the consumption of fried potatoes and fried chicken, which was slightly correlated with an increase in consumption of these foods. The perception that food was healthier (lower in fat or sugar) did not influence consumption behavior. Another example is seen in the usage of nutrition labels on packaged foods, where about two-thirds of college students and young adults utilize the information “sometimes,” “rarely,” or “never” [26]. Providing information can also lead to a perception of more options to choose from, which can be overwhelming and discourage consumers from making the desired choice due to trade-offs from equally but uniquely beneficial options [27]. From these studies, we gather that information alone as an intervention mechanism, while providing short-term relief, is constrained to addressing symptoms of underlying problems, and thus behavior change cannot be reliably achieved.
The literature examining the effectiveness of information-based programs as strategies to improve food choices generally fails to consider the extent to which participants are actively engaging with the material and utilizing higher-order thinking. The increased retention of information that leads to actual behavioral change is primarily through self-efficacy. Self-efficacy, or an individual’s perception of their capability to perform certain actions, has been linked to self-regulated behavioral change in the domains of physical exercise, nutrition and weight control, and addictive behaviors [28]. Programs that include self-efficacy as a primary goal may be more likely to have success in changing individual behavior [15]. There is also research that suggests that utilizing higher-order thinking skills is linked to self-efficacy [16,17]. As opposed to simple memorization and understanding of basic facts, higher-order thinking, i.e., the ability to analyze and apply information, has been linked to retention of learned information and a more positive educational experience [29]. Therefore, for programs attempting to change behavior through informational learning, curriculum design as a tool to foster higher-order thinking skills is a central link between information and behavior change. Together, these intermediary connections represent the importance of curriculum development in information utilization, an assumption that is often missing from many information-based interventions. This relationship is presented in the bottom panel of Figure 1.
The theory of change framework described here contributes to the development of sustainable nutrition education programs in that it can optimize the intended impact on participants by influencing the extent to which participants retain, integrate, and apply concepts, while simultaneously making better use of available resources. We posit that developing a nutrition education program using Bloom’s Taxonomy provides a framework for coordinators to ensure that program goals are met with a higher likelihood of adoption. The result is that information is better dispersed to participants, who can use program resources to generate the knowledge and skills they need to change their behavior.
Bloom’s Taxonomy is a canonical educational model that is used during curriculum design to scaffold learning outcomes and is the learning framework we applied in this study. It has been used primarily in curriculum development and analysis in school settings but has applications in a variety of settings [30,31,32]. In this study, we used a condensed model of Bloom’s Taxonomy, which categorizes cognitive domains into three tiers (see Figure 2).
Tier One, the least complex level, correlates to the cognitive domains of knowledge and comprehension, where the main focus is on learning new terms and subject matter in addition to understanding these ideas in different contexts [14]. Tier One corresponds to initial exposure to program topics and concepts, where the learning objective for participants would be to learn something new and not necessarily return home having learned a new skill. Tier Two represents the cognitive domains of application and analysis and builds upon Tier One by requiring participants to take the existing subject matter and apply it to current and real-world situations, as well as identify implications that might arise when a new action or variable is introduced [14]. Tier Two incorporates an interdisciplinary approach by connecting program topics to different industries, settings, and places in time, where subject matter takes on a new meaning with a changing environment. Tier Three, the most complex level, encompasses the cognitive domains of synthesis and evaluation and represents the pinnacle of educational acumen, where participants take all previously attained knowledge and apply it in a way that demonstrates mastery of the material and an ability to build off of it in a meaningful way [14]. In a program that aims to change the behavior of participants, being able to synthesize and evaluate new information creates self-sufficiency that truly validates whether the program has the capacity to make a significant impact on learning outcomes.
Multiple clinical education studies to develop assessments based on Bloom’s Taxonomy have shown that learning at the comprehension level, or “remember and understand” tier of Bloom’s Taxonomy framework in Figure 2, is a predictor of how students will perform at higher cognitive levels. These studies have shown that students were much more likely to answer knowledge and comprehension questions correctly compared to analysis and application questions depending on their performance [33,34,35]. These results indicate that the cumulative nature of learning has a generally positive effect on information retention. The extent to which program curriculum development influences the retention of information in participants outside of academic settings has not been thoroughly investigated. The cases in which Bloom’s Taxonomy has been used most similarly to that of this study are in improving evaluation in extension services [36] and in measuring the impact of garden programs in schools [37]. In both cases, the outcomes of interest are more hands-on in nature and focus on information that is tied to the development of specific skills, such as improving crop yields.

3. Material and Methods

3.1. Nutrition Education Programs

As previously mentioned, we focused on three distinct Native-serving programs, whose curricula were designed by the Indigenous-led nonprofit Partnership with Native Americans (PWNA) [38]. PWNA programs provide relief and resources for a variety of quality-of-life issues for Native Americans, such as K–12 education, access to healthy food and clean water, emergency services for rural and remote tribal communities, and long-term capacity building. PWNA programs provide the ideal portfolio of nutrition education offerings to apply the Bloom’s Taxonomy framework, as each of the three programs used to engage participants and convey program concepts access the distinct cognitive domains and learning strategies. We examined these three programs, each of which provides information in ways that correspond to different tiers of Bloom’s Taxonomy.
Bloom’s Taxonomy was used in the context of this study because PWNA’s programs aim to use information as a mechanism for behavioral change in a small classroom setting, even though the classroom is not based in academia. Because the programs deal with different levels of cognitive engagement, Bloom’s Taxonomy is suitable as a tool to examine the curriculum of each program. The overall goal is that, by using Bloom’s Taxonomy to design curriculum that engages participants in higher-order levels of thinking, the likelihood of behavioral change will be much higher [16,17,28]. Just as Bloom’s Taxonomy was developed to categorize educational goals, the nutrition education programs offered through PWNA work in a similar manner. Each of the programs offers a distinct curriculum and, just as in developing a teaching module, each focuses on defining a clear set of objectives for the learner (in this case, the participant). To correlate the condensed Bloom’s Taxonomy model (Figure 2) with its application to the Indigenous nutrition education programs reviewed in this study, we have summarized the learning objectives of each program and their corresponding tiers in Table 1.

3.1.1. Tier One: Remember and Understand

The Native Youth Food Sovereignty Summit (NYFSS) served to expose youth to food sovereignty concepts and information about healthy food. The three-day event in Rapid City, South Dakota, taught youth how to read nutrition labels, determine appropriate serving sizes, and forage for common traditional herbs, as well as understand the meaning of traditional stories as they relate to nutrition and food sovereignty. This program is considered the first tier because it is the initial delivery of the information without any requirement of the youth to apply their new knowledge. Some activity-based learning was programmed to keep the attention of the youth and help them learn new concepts more than it was to ensure that they learned new skills. A total of 21 youth participated in this event, with representation from five tribes in South Dakota (Cheyenne River, Rosebud, Oglala, Eagle Butte, and Wounded Knee).

3.1.2. Tier Two: Apply and Analyze

The STRIVE (Seek-Teach-Reclaim-Indigenous-Venture-Endure) forum event brought together community and industry leaders to discuss success, challenges, and opportunities relating to Indigenous food security and food sovereignty. Over two days, representatives from tribal communities and the Arizona Department of Agriculture were invited to speak about funding and networking resources, traditional foods and recipes, and emerging policies impacting Indigenous health in the Southwest. The STRIVE forum is considered a second-tier event, because it provides context to existing knowledge that participants have, provides them with information about how they can enhance what they already know, and presents opportunities for further engagement. Many participants have experience in related fields, so the STRIVE forum aims to provide structured information on relevant current events and teaches them new concepts that lead to improvements in nutritional and food-related outcomes within their communities. A total of 45 community representatives were present, with representation from 15 tribes.

3.1.3. Tier Three: Create and Evaluate

PWNA’s T3 program recruited community leaders from over 10 tribes on reservations across five states (Arizona, Colorado, Montana, South Dakota, Utah) to learn how to prepare and cook healthy foods, with an emphasis on traditional foods and cooking methods. The T3 program duration is one to three days, with multiple sessions held in different tribal communities. After program completion, T3 graduates are expected to demonstrate their mastery of cooking skills by preparing and serving a community meal, in addition to teaching a new wave of community members the cooking skills in their respective professions or within their families. In 2018, T3 graduates fed 936 tribal members during these community meals. The T3 program is a third-tier program, because it requires participants to learn nutritional information, practice cooking skills, and demonstrate their proficiency in those skills by serving a community meal. It is anticipated that the higher the cognitive demands, the more effective the information will be in educating participants and influencing a change of behavior, thus contributing to improvements in health outcomes.

3.2. Participants

Participants in PWNA’s programs are Native American and primarily living on reservations within the organization’s service area, which consists of nine states in the Midwest and Southwest United States. With few exceptions, participants opt in voluntarily and are not selected using any specific criteria. Youth participating in the NYFSS were recruited in groups by community members with whom they had a mutual connection, but eligibility to the program was open to all Native youth, and program advertising was widespread. For the STRIVE forum, community and industry leaders from PWNA’s professional network were contacted to participate. T3 program participants have varied roles in the community and are either the main food purchaser and preparer for their family or work in foodservice, such as a school or senior center cafeteria, bar, or restaurant.

3.3. Measures

It is difficult to measure direct indicators of learning that will result in behavioral change, so another learning factor that is relevant to this study is participant satisfaction. In online settings, student satisfaction had a significant influence on retention, perceived usefulness of the course, and course interaction [39,40]. In employment-related training, program satisfaction was linked to perceived learning and learning transfer of the material to the workplace [41]. Another study examining learning in university courses also found that student satisfaction factors were closely associated with perceived learning [42]. In this study, participant satisfaction with program content was used as a proxy for learning retention due to their close association and the volume of satisfaction data collected during the programs. Satisfaction measurements were readily available compared to more in-depth, long-term investigations on participant learning. Because of the evidence of satisfaction and positive behavioral changes, in our study, we relied on data collected from post-event evaluation questionnaires that measure participant satisfaction, the outcome variable in our empirical analysis, and three separate indices determined by program design parameters that we use as predictors of program satisfaction.

3.4. Data

For each program, five forms of primary data were collected. These are categorized as follows: (1) pre-event surveys, (2) post-event surveys, (3) post-event evaluation questionnaires, (4) a follow-up survey, and (5) detailed field notes recorded from direct observation. Each form of data collected is summarized by program type in Table 2.
At the NYFSS, both pre-event and post-event surveys (N = 18; N = 21) were collected from youth participants, as well as field notes. A consent form was signed by a parent or legal guardian indicating their permission that their child could take part in the surveys. In addition, youth were informed about the purpose of the survey and an assent form was signed by the youth before participating in both the pre- and post-event surveys. The NYFSS surveys were developed with influence from the food sovereignty assessment tool used by the First Nations Development Institute [43] to measure the youths’ understanding of traditional and ancestral foods, as well as their understanding of food sovereignty.
Post-event evaluation questionnaires were administered by PWNA and given to participants at the STRIVE forum and T3 programs. The purpose of the questionnaires was to measure participant satisfaction with the program and solicit feedback on program components. The post-event evaluation questionnaire for the STRIVE forum consisted of twelve questions: eight questions measured on a five-point Likert scale and four open-ended questions. The Likert-scale questions asked participants to indicate their level of agreement regarding program content (two questions), instruction (three questions), adequacy of the facilities (two questions), and satisfaction (one question). For the T3 program, the questionnaire consisted of fourteen questions: twelve questions were nearly identical to the STRIVE post-evaluation questionnaire, but also contained two additional questions on training objectives and materials provided. In addition, a follow-up survey was sent out some time after the T3 program completion, asking five additional questions to determine if graduates utilized the skills they had learned.
In total, 395 individuals participated in either STRIVE or T3 during the period of August 2018 to October 2019. The characteristics of the study sample are presented in Table 3.
The majority of the participants were female (72.4%). It was not mandatory for participants to fill out the questionnaire, so the number of completed questionnaires varies across program locations. From those who participated, 254 post-event evaluation questionnaires were collected (N = 26 for STRIVE, N = 228 for T3). However, only eight of the 26 sites reported individual-level data. The eight sites with an individual-level questionnaire are locations A, B, C, E, G, H, M, and U in Table 3; however, sites A, F, and L used different post-event evaluation questionnaires, so we excluded these sites from our analysis. In addition, three of the T3 sites did not use the same post-event evaluation questionnaire, so we excluded the individual results from these sites, leaving 76 usable post-event evaluation questionnaires.
The questions in the evaluation asked respondents to characterize their experience based on how much they agree or disagree with the statements on the questionnaire measured according to a five-point Likert scale, with 1 being the least favorable and 5 being the most favorable (1 = Strongly Disagree; 2 = Disagree; 3 = Neither Agree nor Disagree; 4 = Agree; 5 = Strongly Agree). In general, the questions fall into one of three question types: content, instruction, and adequacy of resources, which are summarized in Table 4. Each question is turned into a variable that corresponds to the three question-types. Content1 corresponds to the question “The topics covered were relevant”; Content2 corresponds to the question “The content of the sessions was organized and easy to follow.” Instruction1 refers to the question “Participation and interaction were encouraged”; Instruction2 refers to the question “The presenters were very knowledgeable”; and Instruction3 refers to “The presenters were well prepared.” The final subgroup of questions on adequacy of resources generates two variables: Resources1 corresponding to the question “The time allotted for the event was sufficient”; and Resources2 “The meeting room and facilities were adequate and comfortable.” Mean scores for the content, instruction, and adequacy of resources questions were generally high, ranging from 4.54 (Resources1) to 4.78 (Instruction2).
Program satisfaction (Satisfaction) was also measured on a five-point Likert scale, with 1 being the least satisfied and 5 being the most satisfied (1 = Very Poor; 2 = Poor; 3 = Fair; 4 = Good; 5 = Excellent). Because the survey was a paper survey, there was no way to force a response for each question; therefore, we dropped one observation due to missing information for Satisfaction. Based on the responses to the evaluation questionnaires, participants were generally very satisfied with the programs, with an average score of 4.95 out of 5 (N = 75; s.d. = 0.280; min = 3; max = 5).

3.5. Strategy of Data Analysis

As organizations like PWNA continue to make investments in educational programs to enhance nutritional awareness, we seek to understand the relationship between program design components and learning retention. As noted above, it is difficult to measure direct indicators of learning, so instead we focused on another learning factor that is relevant to this study—participant satisfaction. In other words, if the curriculum for nutrition education programs renders higher levels of satisfaction, then we would interpret this relationship as demonstrable evidence that such a design may lead to mastery in the course learning objectives. Subsequently, we seek to elicit insights from the qualitative data on ways in which to improve curriculum design and address other factors that may limit programmatic success.
In this mixed-methods study, two forms of analysis were conducted. First, we examined relevant program parameters (i.e., content, instruction, and adequacy of resources) to rank their relative significance and to describe the interrelation of patterns using a data reduction technique, specifically, Principal Component Analysis (PCA). Principal component scores were then used as independent variables in a multivariate linear regression analysis to measure statistical correlations with satisfaction outcomes.
We coupled the quantitative approach with a qualitative study using SWOT (Strengths, Weaknesses, Opportunities, Threats) analysis, described in detail below. We applied the SWOT procedure to assess the program’s capacity to enhance learning retention, i.e., to assess the salience of information provided and the extent to which each program was more or less successful in participants’ learning. Using a SWOT analysis provides deep insights concerning the programs’ design, modeled after Bloom’s Taxonomy, in demonstrating favorable results in reaching learning objectives. Success was deduced by how participants’ responses in the open-ended questions of the post-event evaluation questionnaires correspond to the programs’ objectives and the extent to which learning modules engage participants at successively higher cognitive domains.

3.5.1. Principal Component Analysis

The purpose of this analysis was to use principal component scores derived from the principal component analysis in a multivariate linear regression model to assess which program design elements are more likely to indicate greater levels of program satisfaction. Using this two-step process offers several advantages. First, the design of the evaluation questionnaire has multiple questions where the answers are likely to be highly correlated. PCA reduces a large number of variables into a smaller set of linear combinations (i.e., components) which are then used as covariates in a regression analysis [44,45]. This eliminates issues of collinearity in our estimation procedure. Second, many studies use PCA in program evaluation for data reduction purposes. Using PCA, we can extract the features within the set of evaluation questions to determine which factor(s) most likely yield higher satisfaction scores. These results are important in calibrating course learning objectives for ongoing program evaluation. Finally, in using PCA, we can demonstrate the interrelation that exists between the different dimensions of curriculum design to determine the presence of latent patterns in students’ responses [38]. These patterns can be detected if more than one component is statistically and significantly correlated to program satisfaction.
Due to data collection limitations, the PCA in the subsequent section focuses primarily on the STRIVE and T3 programs. The NYFSS post-event evaluation survey was substantively different from the post-event evaluation questionnaires for STRIVE and T3, thereby restricting comparisons. Data from the STRIVE and T3 programs were collected using uniform post-event evaluation questionnaires, which were not collected from NYFSS participants. Statistical analyses were conducted in Stata/MP v. 15.1.

3.5.2. SWOT Analysis

To complement the PCA, insights from participant evaluation instruments were developed into an aggregate SWOT analysis. The methodology for constructing the SWOT analysis was taken from “Strategy: Create and Implement the Best Strategy for Your Business,” published by the Harvard Business Review [46]. Though SWOT analyses are primarily used for strategizing business and organizational decision-making, the tool has been adapted to consider the strengths, weaknesses, opportunities, and threats of PWNA’s programs as they relate to program implementation and participant satisfaction. Internal strengths (S) are aspects of program implementation that went well, as indicated by participant evaluation surveys and alignment with program objectives. Internal barriers (W) are obstacles that prevented program implementation from running smoothly or affected participant satisfaction. External opportunities (O) provide insight into new areas of growth through connections with community partners and community members. External barriers (T) are obstacles out of control of PWNA staff that may threaten program attendance, participant engagement, and achievement of program outcomes. In the analysis that follows, we overlay this framework and provide specific insights into the programmatic design that would yield continued sustainable success.
Survey data collected at the NYFSS along with the open-ended responses to the post-event evaluation questionnaires from the STRIVE forum and T3, and the follow-up questionnaires from the T3, were used in the SWOT analysis.

4. Results

4.1. Results from the Principal Component Analysis

First, we present correlation coefficients between the responses variables in the post-event evaluation questionnaire in Table 5. As expected, the majority of responses are correlated with each other at a significance level of 99%. The evidence of correlation across variables linked with program design motivates our choice of factor analysis using PCA. Using PCA allows us to reduce the number of variables concerning program design into a linear combination of the data to better explain program satisfaction and demonstrate the relationships between the various programmatic dimensions (e.g., content, instruction, and adequacy of resources). In addition, each variable can be ranked according to their relative significance within each program-design element (content, instruction, and adequacy of resources).
The number of components from the application of the PCA to the 76 participant observations is selected based on Kaiser’s [47] criterion of retaining those whose eigenvalues are greater than one [45,48]. As an additional check, we examined the results from the scree test offered by Cattell [49], which depicts the eigenvalues relative to their magnitude. Results from this additional test confirm that the number of components falling before the inflection point is equal to one.
We ran two separate models: (1) Pooled questions model and (2) Partitioned (by question type) model. We performed principal component factor analysis using the responses from the individual questionnaires from both the STRIVE forum and the T3 program (N = 76), as well as by separating responses between the STRIVE forum (N = 26) and the T3 program (N = 50). We performed a varimax rotation for each of the analyses, which reduces some of the factor loadings to zero to facilitate interpretation. The results of Model 1, shown in Table 6, indicate that the first component accounts for 52.9% of the total variance, and the second component accounts for 15.7% of the total variance. The first and second components are a combination of the different variables derived from the questionnaire, i.e., the factor loadings for each principal component are the combination of the different variables with relatively similar weighting. In Model 1, we find that Content1 (“The topics covered were relevant.”) has the highest loading for Factor1, while Resources2 (“The meeting room and facilities were adequate and comfortable.”) has the highest loading for Factor2. We find similar results when we partition the sample by program type (STRIVE and T3).
In the second model, we ran three separate PCAs by isolating the question types (content-, instruction-, and resource-related) to determine which aspect within the content, instruction, and resource adequacy question blocks are more heavily weighted. The results for Model 2, reported in Table 7, indicate that the first component represents 75.4% (Content), 71.2% (Instruction), and 72.4% (Adequacy of Resources) of the variance within each question type, respectively.
The factor loadings are displayed in Table 8. When we split the responses according to program type, we find that the factor loadings change for Factor1 change. For the STRIVE forum, Instruction3 (“The presenters were well prepared.”) is ranked most highly, while for the T3 programs, Content2 (“The content of the sessions was organized and easy to follow.”) is ranked higher. Unlike Model 1, we do not see evidence suggesting that we should retain more than one component for each factor loading. The loadings for the three principal components are also presented in Table 6 – Panel B. We find that Instruction3 (“The presenters were well prepared.”) has the highest loading factor within the instruction-question block, while the elements within content (Content1 and Content2) and resources (Resources1 and Resources2) are ranked equally.
For each model, we collected the PC scores and included them as covariates in a series of linear regression models. We regressed Satisfaction on the PC scores, and the results are displayed in Table 9. In Model 1, two score values are collected because the results from the PCA indicated two components with eigenvalues greater than one. The results from the regression analysis for Model 1 show that Score 1 has a positive and significant association with Satisfaction. Recalling from the above, Content1 had the highest factor loading when including all respondents (N = 76), which suggests that having content that is specific and relevant to the program is statistically and significantly related to program satisfaction. Score 1 also has a statistically significant relationship with Satisfaction when we separate the STRIVE forum responses, indicating that the relative importance of Instruction3 has a positive association with program satisfaction. No statistically significant results are reported for the T3 subsample.
The second model includes three scores, which correspond to the single component from each question block. For the entire sample and the subset of STRIVE respondents, Score 2 (associated with Instruction3) shows a positive and significant statistical relationship with Satisfaction. The extent that we can make any meaningful inferences about these program design components and program satisfaction is limited, due to the small sample size of completed questionnaires. However, it appears that well-prepared instructors are a central component in delivering learning material that will generate favorable results. We couple this quantitative analysis with a qualitative study that explores this evidence in more depth, especially because many of the programmatic intricacies cannot be determined from the scale-based post-event evaluation questions. Therefore, we examined the open-ended questions from the post-event evaluation questionnaire and follow-up survey, and expanded our analysis to include evidence from the youth program (NYFSS).

4.2. Results from SWOT Analysis

Insights from the aggregate SWOT analysis are summarized in Table 10. The SWOT analysis is applied to the qualitative data and evaluates the extent to which each program was successful in improving the salience of information and whether there were noticeable learning outcomes among participants.

4.2.1. Internal Strengths (S)

PWNA’s programs are unique in that they cater specifically to Native American communities. Including Native beliefs and values in program curriculum is essential not only for keeping the interest of participants but also to aid in the larger goals of improving nutritional health outcomes and revitalizing Indigenous diets and practices. This was something that was accomplished in all three programs. T3 participants commented on the integration of Indigenous values into the curriculum:
“[The] menu incorporated traditional food in unique ways.”
“I appreciate the language with regard to respecting food.”
“Food is so important and I love how you stressed the importance of our relationship with it.”
“[I enjoyed the] women together in the kitchen sharing food memories, traditions, language, etc.”
The STRIVE forum and NYFSS also incorporated traditional food into the curriculum, despite the lack of focus on physical food preparation. Ingredients such as tepary beans, squash, and pine nuts were included in meals served at the STRIVE forum. At the Native Youth Food Sovereignty Summit, some youth tried traditional foods for the first time, where meatloaf and chili were prepared using buffalo meat. One participant said: “The traditional food was buffalo meat which was something I did not know existed.”
In addition to linking foods used with traditional stories, T3 trainers also adapted modern nutrition tools to better suit Native culture. One example was incorporating the Lakota food wheel into a lesson on nutrition, which is comparable to the Western food pyramid. Minor changes such as these aid in the retention of information and the overall cohesion of participants as a group united in the goals of improving the nutrition of their families and community.
T3 participants greatly appreciated how knowledgeable the trainers were on nutrition and food preparation. One participant said, “[The] chef can be questioned on things that you don’t really know.” Other participants mentioned that the trainers were “good with people.” Another type of knowledge valued by participants was the Indigenous way of knowing, as expressed by the statement: “The information was shared directly from a person with knowledge and wisdom from the community.”
The cooking and preparation classes were family-friendly, and in many cases, three generations of family members were present to learn about preparing healthy food. Many participants were motivated to take the training so that they could prepare healthier meals for their families. Additionally, some participants stated that the training brought back memories of family members cooking in more traditional ways:
“[The training] made me remember my mother and her drying of cherries, corn, squash, etc.”
“[It] brought back memories of life as a young person remembering the way my grandma dried food to feed us throughout the winter.”
Since families were often present at the training sessions, the goal of teaching family members what was learned and transferring new skills to the home kitchen may be much easier for participants.

4.2.2. Internal Barriers (W)

Most internal barriers for program implementation and participant learning were of a technical or logistical nature, rather than any flaw with the program curriculum itself. Acquiring the ideal amount of space for training appeared to be the main barrier for the T3 program, as there was either not enough space for all attendees to view the cooking demonstrations or the space was so large that it created audio issues for participants who are hard of hearing. At the Native Youth Food Sovereignty Summit, there were often delays in getting the youth to the right learning stations and a need for additional chaperones made transitions difficult. For speakers at the STRIVE forum, technical issues caused delays that prevented everyone from being able to speak within the original timeframe. Though these are not a result of the curriculum design, they still interfere with participant learning by distracting from the lessons being taught or reducing the overall time that participants have to learn.
Participant evaluations indicated a desire for more hands-on activities across all programs, but particularly for the STRIVE forum and classes where participants mainly remained inside and listened to lecture-based lessons. The STRIVE forum was not designed to be a physically interactive event, but nonetheless participants noted that they would have preferred more engaging activities to break up the monotony of speakers. Youth in the NYFSS were much more likely to pay attention when they were physically engaged in an activity as opposed to simply listening to a speaker. T3 participants whose class curriculum included foraging cited that activity as an aspect of the program they enjoyed most, indicating that similar activities included in all training would most likely improve participant satisfaction.
Another weakness of the programs that may adversely impact participant learning is the lack of take-home resources. Though youth in the NYFSS received a notebook and folder to keep the materials they received, participants in the T3 program and STRIVE forum did not receive physical resources and expressed a desire for them in their post-event evaluation instruments. T3 graduates also requested that a recipe book be made to take home. Participants come from communities that may not have reliable internet access, so having take-home resources to refer back to may be an important component in retaining information learned during the programs. These resources would also be beneficial for visual learners and those with impaired vision.
Some improvements could be made to advertising the training to improve program turnout. A couple of participants suggested that more advertising be done to attract more community members to the program:
“Do more advertising, continue with such training.”
“Have more of our Native people get involved.”
Many T3 participants said they would attend future events in their communities. Hosting multiple class sessions in the same communities might be a way to encourage higher attendance and have a greater impact in those areas.

4.2.3. External Opportunities (O)

Participants from the STRIVE forum and T3 program mentioned that more time would be an improvement. For the STRIVE forum, participants desired more time for connecting with other attendees and listening to stories from different tribes. Additional time for T3 training was cited as a potential improvement because most classes were taught over one to three days. Building more time into the curriculum would improve the consistency of lesson topics offered. One T3 participant suggested a semester of cooking, which opens opportunities for more in-depth lessons and skill-building activities.
A promising source of external opportunities lies with community partners, who can not only play a role in training but can also assist with securing training venues and providing additional contacts. Community members have previously donated items for T3 training sessions, such as garden produce and goat products. An untapped opportunity as expressed by T3 and STRIVE participants would be to further involve community Elders in training sessions, since their input is valuable as a source of Indigenous knowledge and in contributing to discussions on cultural practices. Program participants expressed a desire to recruit experts from within the community for training, of which Elders would be one such group.
Where intergenerational engagement was a strength for the T3 program, it is an opportunity for the NYFSS and STRIVE forum. Some STRIVE participants mentioned wanting more youth involvement in future events. They desired more opportunities to share what they have learned and mentor youth. This can be accomplished in events such as the NYFSS, where a larger youth population is present.
Diabetes is a large concern in many Native communities. Though touched upon in the T3 and NYFSS program curriculum, lessons covering ways to prevent or combat diabetes would be beneficial to program participants, who have either expressed an interest in this area or cited diabetes as a motivation for taking the training. Should any classes or programs be developed especially for diabetes prevention and treatment, opportunities would also exist to measure the impact of the intervention specifically on the incidence of diabetes in the community.
For many participants, the program provided opportunities to meet new people, create partnerships, and develop plans for collaboration in the future. This was seen especially within the STRIVE forum, as creating these opportunities was part of the overall purpose of the event. Participants suggested a form of organized alumni network to keep in contact with each other after program completion. Actions such as these may not only strengthen PWNA’s programs over time with new resources and connections but make way for new initiatives with the potential to reach more people and effectively impact nutritional and health outcomes.

4.2.4. External Barriers (T)

The most prominent external barrier as identified by PWNA staff was low program attendance, particularly within the T3 program and NYFSS. In both programs, there were late arrivals. For the NYFSS, schedule conflicts with other community events (e.g., basketball games, ceremonies) had a significant impact on youth attendance. T3 classes were sometimes shortened by a day from lack of attendance. The weather was another significant external barrier that prevented full attendance for training. In programs that are intended to be community-oriented, low attendance may impact learning by minimalizing meaningful group discussion on program concepts.
There are also significant external constraints that may prevent program graduates from being able to fully utilize the information obtained from PWNA’s programs. These may include the availability and affordability of fresh produce, scheduling conflicts that limit the amount of time for shopping for fresh produce and the time needed to prepare healthier meals, and other attitudes about healthy foods that the programs were unable to address. Though T3 program participants often received canning and dehydrating equipment along with other basic cooking tools (knives, aprons, etc.), a lack of cooking equipment or appliances could still be a significant obstacle for families wanting to prepare healthier foods. STRIVE participants may encounter significant economic and political hurdles in their attempts to start food sovereignty initiatives in Indigenous communities. These are threats that may compromise the success of all three programs in creating a social impact on health outcomes despite otherwise effective curriculum design and implementation.

5. Study Limitations

The current evaluation method for measuring social impact through PWNA’s programs is still in its early stages, with questionnaires mainly assessing participant satisfaction with program content and other features. One T3 participant stated: “I wish there was a way we could quantify the impact this will have.” Baseline data on participant understanding of food preparation and nutrition topics was not collected and response rates for the evaluations were low on average, making the new knowledge and skills obtained by participants more difficult to measure. For T3 graduates, another evaluation was sent out to determine whether they utilized the skills they had learned in their workplace and home. However, without exploring the impact of the program on families in Native communities in further depth, it is difficult to assess to what degree health and behavioral outcomes improved. The low completion rates of the evaluations at some program sites is a threat to the validity of the statistical analysis of this study and further communicates the need for future evaluation to be thorough. Because class topics were inconsistent and dependent on the tools available and current season, evaluations tailored specifically to topics taught could reveal whether some lessons are more effective and valuable to participants than others. Providing some form of incentive for providing feedback may encourage higher evaluation response rates among participants.

6. Conclusions

This study evaluated the curriculum design, modeled after Bloom’s Taxonomy, of a Native-based nutrition education program and assessed how the programs were perceived by participants. The curricula emphasizes incorporating Indigenous elements into the program design and implementation such that Native beliefs and values are respected. The results indicate improvements to overall participant satisfaction and retention of information, which offers encouraging evidence toward behavioral change and, ultimately, improved health outcomes. Indicators of satisfaction must also be met with input from participants and the community to obtain effective results, as well as contributions from multiple disciplines. This study comes at an important time when the attention to Native American issues has been largely ignored.
While the results from this study offer a promising outlook on culturally appropriate nutrition education programming, effective curriculum design may not have the anticipated impact on behavioral change or health outcomes for reasons beyond the scope of the program and this study. Without proper evaluation methods, it is unclear whether there are persisting attitudes about healthy foods that would prevent families from fully utilizing the information they received in training. To expand the effectiveness of nutrition education programs, one might also consider the role of community members in serving as health champions. In programs that focus on disease management, patients consider care managers as playing a vital role in recovery [50], so eliciting best practices from other wellness initiatives may be important to consider when developing strategies that address diet-related health outcomes. Nonetheless, multiple barriers to eating healthy foods exist and providing information is only one way to remove a portion of them. There are still the issues of accessing and affording healthy food and finding the time to prepare meals, of which other program types may be a solution. Regardless, a multifaceted approach will be required to make a substantial change in this area.
Beyond the scope of this study, it is important to recognize that numerous interventions targeting nutritional disparities exist that seek to break down existing barriers to acquiring healthy foods and adopting a more nutrient-rich diet; however, these either may not be available or suitable for introduction in Indian Country. Some programs aim to address environmental barriers, such as the lack of access to nearby grocery stores. Mobile produce trucks have emerged as a solution to address not only a lack of access to food retailers in underserved communities but also a lack of transportation for some households. Other programs focus on alleviating household barriers, such as a lack of access to financial resources. Many states now offer the DoubleUp Food Bucks program that allows families who participate in the Supplemental Nutrition Assistance Program (SNAP) to receive twice the amount of groceries with their benefits. Alternatively, adjusting some aspects of an individual’s environment has been shown to be more effective in changing consumer habits than providing information alone [51]. “Nudging,” a theory rooted in soft paternalism, is a technique used to influence consumer behavior by limiting the available options to make the desirable choice easier to select [52]. While this approach may work for participants from other populations, it could be met with resistance among the Native people due to their history with paternalistic influences and the resentment that has followed. The idea of nudging and soft paternalism is also mainly successful in environments where behavior can be influenced by changing the options available to them, such as a school cafeteria [53,54]. Although some success has been seen in implementing a community-based approach to changing the food retail environment [55], nudging-based interventions may not be easily accomplished in Native American communities that often vary in resources across locations influencing many to leave their reservation to obtain their food elsewhere. Because little research has been completed on the extent to which information-based programs measure participant learning retention and the way information is provided to them, it is worthwhile to explore this mechanism in more depth. Any findings that support information as a mechanism for behavioral change add credibility to the existing literature and also provide a more culturally appropriate way to address nutrition issues within Native communities. Moreover, nutraceuticals, commonly deemed as “Westernized” products, have shown benefits in maintaining health and reducing the risk of chronic disease [56]. Many of the benefits derived from these supplements mimic the medicinal properties of Indigenous plants that are used by traditional healers [57]. In this way, encouraging nutrition education programs that not only aim to promote a healthy diet but take advantage of Native traditions can prove to have peripheral benefits.
Future research will explore ways to improve program evaluation such that evaluation methods are culturally sensitive and still effective at measuring social impact. To determine if these food education programs are effective in improving health outcomes, sufficient program evaluation is needed. This will further validate the impact of curriculum design on achieving an improved nutritional outcome in Native communities, in addition to the development of more sustainable programs through better utilization of program resources intended for long-term impact on participants. Additionally, this will also communicate to stakeholders the rationale for continuing financial support for these programs.

Author Contributions

Conceptualization, L.C.; data curation, K.G.; formal analysis, K.G. and L.C.; investigation, L.C.; methodology, L.C.; supervision, L.C.; writing—original draft, K.G.; writing—review and editing, L.C. All authors have read and agreed to the published version of the manuscript.

Funding

This research received no external funding.

Conflicts of Interest

The authors declare no conflict of interest.

References

  1. Subica, A.M.; Agarwal, N.; Sullivan, J.G.; Link, B.G. Obesity and associated health disparities among understudied multiracial, Pacific Islander, and American Indian adults. Obesity 2017, 25, 2128–2136. [Google Scholar] [CrossRef] [PubMed] [Green Version]
  2. Centers for Disease Control and Prevention. National Diabetes Statistics Report, 2020; Centers for Disease Control and Prevention, US Department of Health and Human Services: Atlanta, GA, USA, 2020.
  3. Centers for Disease Control. Social Determinants of Health. Available online: https://www.cdc.gov/socialdeterminants/index.htm (accessed on 6 August 2020).
  4. Feeding America. How Do You Measure Hunger? Available online: https://www.feedingamerica.org/hunger-in-america/food-insecurity (accessed on 6 August 2020).
  5. Gundersen, C. Measuring the extent, depth, and severity of food insecurity: An application to American Indians in the USA. J. Popul. Econ. 2008, 21, 191–215. [Google Scholar] [CrossRef]
  6. Teufel, N. Nutrient Characteristics of Southwest Native American Pre-contact Diets. J. Nutr. Environ. Med. 1996, 6, 273–284. [Google Scholar] [CrossRef]
  7. Mucioki, M.; Sowerwine, J.; Sarna-Wojcicki, D. Thinking inside and outside the box: Local and national considerations of the Food Distribution Program on Indian Reservations (FDPIR). J. Rural Stud. 2018, 57, 88–98. [Google Scholar] [CrossRef]
  8. Sowerwine, J.; Mucioki, M.; Sarna-Wojcicki, D.; Hillman, L. Reframing food security by and for Native American communities: A case study among tribes in the Klamath River basin of Oregon and California. Food Secur. 2019, 11, 579–607. [Google Scholar] [CrossRef]
  9. Shanks, C.B.; Smith, T.; Ahmed, S.; Hunts, H. Assessing foods offered in the Food Distribution Program on Indian Reservations (FDPIR) using the Healthy Eating Index 2010. Public Health Nutr. 2016, 19, 1315–1326. [Google Scholar] [CrossRef] [PubMed] [Green Version]
  10. Milburn, M.P. Indigenous nutrition: Using traditional food knowledge to solve contemporary health problems. Am. Indian Q. 2004, 28, 411–434. [Google Scholar] [CrossRef]
  11. Jernigan, V. Community-based participatory research with Native American communities: The chronic disease self-management program. Health Promot. Pract. 2010, 11, 888–899. [Google Scholar] [CrossRef]
  12. Rasmus, S. Indigenizing CBPR: Evaluation of a community-based and participatory research process implementation of the Elluam Tungiinun (Toward Wellness) program in Alaska. Am. J. Community Psychol. 2014, 54, 170–179. [Google Scholar] [CrossRef] [Green Version]
  13. Pelican, S.; Proulx, J.M.; Wilde, J.; Del Vecchio, A. Dietary guidance workshop helps tribal program cooks make changes. J. Am. Diet. Assoc. 1995, 5, 591–592. [Google Scholar] [CrossRef]
  14. Krathwohl, D. A revision of Bloom’s taxonomy: An overview. Theory Pract. 2002, 41, 212–218. [Google Scholar] [CrossRef]
  15. Anderson, E.; Winett, S.; Wojcik, R. Self-regulation, self-efficacy, outcome expectations, and social support: Social cognitive theory and nutrition behavior. Ann. Behav. Med. 2007, 34, 304–312. [Google Scholar] [CrossRef] [PubMed]
  16. Coutinho, S. Self-efficacy, metacognition, and performance. N. Am. J. Psychol. 2008, 10, 165–172. [Google Scholar]
  17. McKinnon, J.L. Effects of Scaffolding Higher Order Thinking Questions on Reader Self-Efficacy and Critical Thinking of Sixth Grade Students. Ph.D. Thesis, Education & Educational Psychology, Western Connecticut State University, Danbury, CT, USA, 2012. [Google Scholar]
  18. Ratner, R.; Soman, K.; Zauberman, D.; Ariely, G.; Carmon, D.; Keller, Z.; Wertenbroch, F. How behavioral decision research can enhance consumer welfare: From freedom of choice to paternalistic intervention. Mark. Lett. 2008, 19, 383–397. [Google Scholar] [CrossRef]
  19. Paynter, S.; Berner, M.; Anderson, E. When Even the ‘Dollar Value Meal’ Costs Too Much: Food Insecurity and Long Term Dependence on Food Pantry Assistance. Public Adm. Q. 2011, 35, 26–58. [Google Scholar]
  20. Tarasuk, V.; Maclean, H. The institutionalization of food banks in Canada: A public health concern. Can. J. Public Health Rev. Can. Sante Publique 1990, 81, 331–332. [Google Scholar]
  21. Burney, J.; Haughton, B. EFNEP: A nutrition education program that demonstrates cost-benefit. J. Am. Diet. Assoc. 2002, 102, 39–45. [Google Scholar] [CrossRef]
  22. Rajgopal, R.; Cox, R.; Lambur, M.; Lewis, E. Cost-Benefit Analysis Indicates the Positive Economic Benefits of the Expanded Food and Nutrition Education Program Related to Chronic Disease Prevention. J. Nutr. Educ. Behav. 2002, 34, 26–37. [Google Scholar] [CrossRef]
  23. Van Der Heide, I.; Uiters, E.; Rademakers, J.; Struijs, J.; Schuit, A.; Baan, C. Associations Among Health Literacy, Diabetes Knowledge, and Self-Management Behavior in Adults with Diabetes: Results of a Dutch Cross-Sectional Study. J. Health Commun. 2014, 19, 115–131. [Google Scholar] [CrossRef] [Green Version]
  24. Derzon, J.H.; Lipsey, M.W. A meta-analysis of the effectiveness of mass-communication for changing substance-use knowledge, attitudes, and behavior. Mass Media Drug Prev. Class. Contemp. Theor. Res. 2002, 231–258. [Google Scholar] [CrossRef]
  25. Taylor, C.A.; Keim, K.S.; Gilmore, A.C.; Parker, S.P.; Van Delinder, J.L. Most commonly consumed foods and food perceptions in Native American women. Am. J. Health Behav. 2006, 30, 613–625. [Google Scholar] [CrossRef] [PubMed]
  26. Hieke, S.; Harris, J.L. Nutrition information and front-of-pack labelling: Issues in effectiveness. Public Health Nutr. 2016, 19, 2103–2105. [Google Scholar] [CrossRef] [PubMed] [Green Version]
  27. Gourville, J.T.; Soman, D. Overchoice and assortment type: When and why variety backfires. Mark. Sci. 2005, 24, 382–395. [Google Scholar] [CrossRef]
  28. Schwarzer, R.; Fuchs, R. Self-efficacy and health behaviours. Predict. Health Behav. Res. Pract. Soc. Cogn. Models 1996, 163, 196. [Google Scholar]
  29. Mitchell, R.A.; Regan-Smith, M.R.; Fisher, M.; Knox, I.; Lambert, D. A New Measure of the Cognitive, Metacognitive, and Experiential Aspects of Residents’ Learning. Acad. Med. 2009, 84, 918–926. [Google Scholar] [CrossRef] [Green Version]
  30. Arizona State University. Learning Objectives Builder. ASU TeachOnline. Available online: https://teachonline.asu.edu/objectives-builder/ (accessed on 6 March 2020).
  31. Hanna, W. The new Bloom’s taxonomy: Implications for music education. Arts Educ. Policy Rev. 2007, 108, 7–16. [Google Scholar] [CrossRef]
  32. Ovca, A.; Mojca, J.; Peter, R. Curriculum Analysis of Food Safety Competences at Elementary and Upper-Secondary Level of Formal Education Inside Food-Related Programs in Slovenia. J. Food Sci. Educ. 2018, 17, 42–51. [Google Scholar] [CrossRef] [Green Version]
  33. Dobson, C.; Seeley, R. Measuring Higher Cognitive Development in Anatomy and Physiology Students. Idaho State University Dissertation, Pocatello, ID. 2001. Available online: https://www.proquest.com/docview/252070504 (accessed on 27 August 2020).
  34. Knecht, K.T. Assessing cognitive skills of pharmacy students in a biomedical sciences module using a classification of multiple-choice item categories according to Bloom’s taxonomy. Am. J. Pharm. Educ. 2001, 65, 324. [Google Scholar]
  35. Verenna, A.M.A.; Noble, K.A.; Pearson, H.E.; Miller, S.M. Role of comprehension on performance at higher levels of Bloom’s taxonomy: Findings from assessments of healthcare professional students. Anat. Sci. Educ. 2018, 11, 433–444. [Google Scholar] [CrossRef]
  36. Rennekamp, R.A.; Engle, M. A case study in organizational change: Evaluation in Cooperative Extension. New Dir. Eval. 2008, 2008, 15–26. [Google Scholar] [CrossRef]
  37. Klemmer, C.D.; Waliczek, T.M.; Zajicek, J.M. Development of a science achievement evaluation instrument for a school garden program. HortTechnology 2005, 15, 433–438. [Google Scholar] [CrossRef] [Green Version]
  38. Partnership with Native Americans. Available online: http://www.nativepartnership.org/ (accessed on 1 July 2020).
  39. Johnson, R.; Hornik, S.; Salas, E. An empirical examination of factors contributing to the creation of successful e-learning environments. Int. J. Hum. Comput. Stud. 2008, 66, 356–369. [Google Scholar] [CrossRef]
  40. Lee, Y.; Choi, J. A structural equation model of predictors of online learning retention. Internet High. Educ. 2013, 16, 36–42. [Google Scholar] [CrossRef]
  41. Lim, D.H.; Morris, M.L. Influence of trainee characteristics, instructional satisfaction, and organizational climate on perceived learning and training transfer. Hum. Resour. Dev. Q. 2006, 17, 85–115. [Google Scholar] [CrossRef]
  42. Lo, C.C. How student satisfaction factors affect perceived learning. J. Scholarsh. Teach. Learn. 2010, 10, 47–54. [Google Scholar]
  43. First Nations Development Institute. Food Sovereignty Assessment Tool, 2nd ed.; First Nations Development Institute: Longmont, CO, USA, 2014. [Google Scholar]
  44. Azzone, G.; Soncin, M. Factors driving university choice: A principal component analysis on italian institutions. In Proceedings of the 4th International Conference on Higher Education Advances (HEAd’18), Valencia, Spain, 20–22 June 2018. [Google Scholar]
  45. Kellow, J.T. Using principal components analysis in program evaluation: Some practical considerations. J. Multidiscip. Eval. 2006, 5, 89–107. [Google Scholar]
  46. Harvard Business Review. Strategy: Create and Implement the Best Strategy for Your Business; Harvard Business Essentials: Boston, MA, USA, 2005. [Google Scholar]
  47. Kaiser, H.F. The application of electronic computers to factor analysis. Educ. Psychol. Meas. 1960, 20, 141–151. [Google Scholar] [CrossRef]
  48. Stevens, J. Applied Multivariate Statistics for the Social Sciences, 2nd ed.; Earlbaum: Hillsdale, NJ, USA, 1992. [Google Scholar]
  49. Cattell, R.B. The meaning and strategic use of factor analysis. In Handbook of Multivariate Experimental Psychology; Cattell, Ed.; Rand McNally: Chicago, IL, USA, 1966. [Google Scholar]
  50. Ciccone, M.M.; Aquilino, A.; Cortese, F.; Scicchitano, P.; Sassara, M.; Mola, E.; Rolla, R.; Caldarola, P.; Giorgino, F.; Pomo, V.; et al. Feasibility and effectiveness of a disease and care management model in the primary health care system for patients with heart failure and diabetes (Project Leonardo). Vasc. Health Risk Manag. 2010, 6, 297. [Google Scholar] [CrossRef] [Green Version]
  51. Verplanken, B.; Wood, W. Interventions to break and create consumer habits. J. Public Policy Mark. 2006, 25, 90–103. [Google Scholar] [CrossRef] [Green Version]
  52. Downs, J.S.; Loewenstein, G.; Wisdom, J. Strategies for promoting healthier food choices. Am. Econ. Rev. 2009, 99, 159–164. [Google Scholar] [CrossRef] [Green Version]
  53. Campbell-Arvai, V.; Arvai, J.; Kalof, L. Motivating sustainable food choices: The role of nudges, value orientation, and information provision. Environ. Behav. 2014, 46, 453–475. [Google Scholar] [CrossRef]
  54. Saksvig, B.I.; Gittelsohn, J.; Harris, S.B.; Hanley, A.J.; Valente, T.W.; Zinman, B. A pilot school-based healthy eating and physical activity intervention improves diet, food knowledge, and self-efficacy for native Canadian children. J. Nutr. 2005, 135, 2392–2398. [Google Scholar] [CrossRef] [Green Version]
  55. Gittelsohn, J.; Rowan, M. Preventing diabetes and obesity in American Indian communities: The potential of environmental interventions. Am. J. Clin. Nutr. 2011, 93, 1179S–1183S. [Google Scholar] [CrossRef] [PubMed] [Green Version]
  56. Padmavathi, M. Chronic disease management with nutraceuticals. Int. J. Pharm. Sci. Invent. 2013, 2, 1–11. [Google Scholar]
  57. Koithan, M.; Farrell, C. Indigenous native American healing traditions. J. Nurse Pract. Jnp. 2010, 6, 477. [Google Scholar] [CrossRef] [PubMed] [Green Version]
Figure 1. Conceptual Diagram Linking Information to Behavioral Change.
Sustainability 12 07077 g001
Figure 2. Condensed Learning Model Adapted from Bloom’s Taxonomy (Krathwohl 2002).
Sustainability 12 07077 g002
Table 1. Partnership with Native Americans (PWNA)’s Program Objectives Organized by Cognitive Domain.
PWNA Program Objectives
Program/TierTier 1Tier 2Tier 3
RememberUnderstandApplyAnalyzeEvaluateCreate
Native Youth Food Sovereignty Summit (NYFSS)NYFSS1NYFSS5NYFSS9
NYFSS2NYFSS6
NYFSS3NYFSS7
NYFSS4NYFSS8
STRIVE ForumSTR1STR2STR3STR4 STR5
STR6
Train-the-Trainer (T3) Cooking and Food Preparation ClassesTTT1TTT3TTT5TTT7TTT9TTT11
TTT2TTT4TTT6TTT8TTT10TTT12
TTT13
TTT14
TTT15
TTT16
OBJECTIVE KEY
NYFSS1.Define food sovereignty.TTT1.Recall the traditional stories associated with food.
NYFSS2.List examples of traditional foods.TTT2.Describe the nutritional and life benefits of a healthier diet.
NYFSS3.Recall the traditional stories associated with food.TTT3.Explain the basics of mirepoix and homemade stock.
NYFSS4.Describe the nutritional and life benefits of a healthier diet.TTT4.Identify common medicinal herbs and explain how they are used.
NYFSS5.Explain the significance of serving sizes and meal portions.TTT5.Practice personal hygiene, knife skills, and kitchen safety.
NYFSS6.Identify sources of hidden sugar in food.TTT6.Demonstrate cutting techniques for meats such as chicken, turkey, and buffalo.
NYFSS7.Compare and contrast traditional and modern foods.TTT7.Integrate traditional ingredients into recipes.
NYFSS8.Identify common medicinal herbs and explain how they are used.TTT8.Deconstruct recipe into their component ingredients.
NYFSS9.Sketch Native communities of the present and future.TTT9.Experiment with new foods.
STR1.Network with industry professionals and community leaders.TTT10.Recommend healthy and traditional recipe or ingredient alternatives.
STR2.Identify barriers and opportunities to achieving food sovereignty.TTT11.Develop sustainable nutrition initiatives in indigenous communities.
STR3.Demonstrate what progress is being made toward solving indigenous food issues.TTT12.Coordinate a community meal event.
STR4.Connect key stakeholders (local growers, farmers, and distributors) and opportunities for continued growth.TTT13.Reconstruct traditional food and culture.
STR5.Facilitate meaningful conversation on indigenous issues.TTT14.Preserve local produce by canning, pickling, and/or dehydration.
STR6.Collaborate on new events and programs in Native communities.TTT15.Create balms and salves from native plants.
TTT16.Prepare meals using healthy and fresh ingredients.
Table 2. Summary of Data Collected, by Program Type.
Included in Analysis
ProgramData CollectedPrincipal Component AnalysisRegression AnalysisSWOT
(Strengths, Weaknesses, Opportunities, Threats)
Native Youth Food Sovereignty Summit (NYFSS)(1) Pre-event survey
(2) Post-event survey ⁺
(5) Field notes
NoNoYes
STRIVE Forum(3) Post-event evaluation questionnaireYesYesYes
Train-the-Trainer (T3) Cooking and Food Preparation Classes(3) Post-event evaluation questionnaire
(4) Follow-up survey
YesYesYes
⁺ NYFSS post-event survey asks different questions and therefore is not included in the principal component analysis.
Table 3. List and Response Rate of Program Participants, by Location and Program Type.
LocationProgram TypeTotal Number of ParticipantsFemale ParticipantsMale ParticipantsNumber of EvaluationsIndividual Evaluation Forms Available (Y/N)Response Rate
ASTRIVE45311426Y58%
BT3106410Y100%
CT39819Y100%
DT39N/AN/AN/ANN/A
ET3127512Y100%
FT3151146N40%
GT313949Y69%
HT31513211Y73%
IT315N/AN/AN/ANN/A
JT31611312N75%
KT32115616N76%
LT33223926N81%
MT312848Y67%
NT38711N13%
OT39639N100%
PT39729N100%
QT3131038N62%
RT32117418N86%
ZT310739N90%
TT39279N100%
UT32011918Y90%
VT31815315N83%
WT31817113N72%
XT311N/AN/AN/ANN/A
YT313N/AN/AN/ANN/A
ZT312N/AN/AN/ANN/A
Total39524192254 26%
T3 = Train-the-Trainer; Of the 26 sites, 8 sites had completed and collected individual evaluation forms. Note: Some information was not collected and this is represented by “N/A”.
Table 4. Summary of Evaluation Questionnaire Responses.
VariableFactor ClassificationPlease Rate How Much You Agree or Disagree with the Following Statement…Number of ResponsesMean ScoreStandard DeviationMinMax
Content1ContentThe topics covered were relevant.764.750.43645
Content2ContentThe content of the sessions was organized and easy to follow.764.590.67725
Instruction1InstructionParticipation and interaction were encouraged.764.710.53725
Instruction2InstructionThe presenters were very knowledgeable.764.780.50635
Instruction3InstructionThe presenters were well prepared.754.720.48135
Resources1Adequacy of ResourcesThe time allotted for the event was sufficient.764.540.72025
Resources2Adequacy of ResourcesThe meeting room and facilities were adequate and comfortable.764.670.68125
Satisfaction My overall rating for this class is754.950.28035
Table 5. Pairwise Correlation Table between Evaluation Questions.
Content1Content2Instruction1Instruction2Instruction3Resources1Resources2
Content11.0000
Content20.5085 *1.0000
Instruction10.4841 *0.4412 *1.0000
Instruction20.5290 *0.5088 *0.4455 *1.0000
Instruction30.4928 *0.6746 *0.5123 *0.7313 *1.0000
Resources10.3080 *0.5397 *0.3403 *0.4089 *0.5519 *1.0000
Resources20.07860.4861 *0.24660.17060.3284 *0.4484 *1.0000
* indicates significance at the 99% confidence level.
Table 6. Results from Principal Component Analyses, Model (1).
Model (1): Pooled questions, All Respondents
FactorEigenvalueDifferenceProportionCumulative
Factor13.70372.59410.52910.5291
Factor21.10960.47050.15850.6876
Factor30.63920.12340.09130.7789
Factor40.51570.03190.07370.8526
Factor50.48390.14200.06910.9217
Factor60.34190.13580.04880.9706
Factor70.2061 0.02941.0000
N. Observations76
Model (1): Pooled questions, STRIVE only
FactorEigenvalueDifferenceProportionCumulative
Factor13.95632.84440.56520.5652
Factor21.11200.33330.15890.7240
Factor30.77870.31530.11120.8353
Factor40.46330.03510.06620.9015
Factor50.42830.23340.06120.9627
Factor60.19490.12850.02780.9905
Factor70.0665 0.00951.0000
N. Observations26
Model (1): Pooled questions, T3 only
FactorEigenvalueDifferenceProportionCumulative
Factor13.16371.89830.45200.4520
Factor21.26540.40290.18080.6327
Factor30.86250.15150.12320.7559
Factor40.71090.12490.10160.8575
Factor50.58600.31410.08370.9412
Factor60.27190.13230.03880.9801
Factor70.1396 0.01991.0000
N. Observations49
Table 7. Results from Principal Component Analyses, Model (2).
Model (2): Partitioned by question type, All Respondents
Content
FactorEigenvalueDifferenceProportionCumulative
Factor11.50851.01690.75420.7542
Factor20.4916 0.24581.0000
N. Observations76
Instruction
FactorEigenvalueDifferenceProportionCumulative
Factor12.13461.53240.71150.7115
Factor20.60220.33910.20070.9123
Factor30.2632 0.08771.0000
N. Observations75
Adequacy of Resources
FactorEigenvalueDifferenceProportionCumulative
Factor11.44840.89670.72420.7242
Factor20.5516 0.27581.0000
N. Observations76
Model (2): Partitioned by question type, STRIVE only
Content
FactorEigenvalueDifferenceProportionCumulative
Factor11.67361.34730.83680.8368
Factor20.3264 0.16321.0000
N. Observations26
Instruction
FactorEigenvalueDifferenceProportionCumulative
Factor12.31531.78660.77180.7718
Factor20.52870.37260.17620.9480
Factor30.1560 0.052001.0000
N. Observations26
Adequacy of Resources
FactorEigenvalueDifferenceProportionCumulative
Factor11.31780.63560.65890.6589
Factor40.6822 0.34111.0000
N. Observations26
Model (2): Partitioned by question type, Train-the-Trainer (T3) only
Content
FactorEigenvalueDifferenceProportionCumulative
Factor11.39080.78150.69540.6954
Factor20.6092 0.30461.0000
N. Observations50
Instruction
FactorEigenvalueDifferenceProportionCumulative
Factor11.75440.88520.58480.5848
Factor20.86920.49270.28970.8745
Factor40.3765 0.12551.0000
N. Observations49
Adequacy of Resources
FactorEigenvalueDifferenceProportionCumulative
Factor11.49330.98660.74670.7467
Factor20.5067 0.25331.0000
N. Observations50
Table 8. Results from Principal Component Analyses, Rotated Factor Loadings.
Model (1)Model (2)
All RespondentsSTRIVE onlyT3 onlyAll RespondentsSTRIVE onlyT3 only
VariableFactor1Factor2Factor1Factor2Factor1Factor2Factor1Factor1Factor1
Content10.827−0.0200.779−0.2500.8170.0340.8690.9150.834
Content20.5960.6000.861−0.1860.8720.1230.8690.9150.834
Instruction10.6850.1960.741−0.3280.809−0.0510.7480.7820.589
Instruction20.8190.1610.875−0.0380.8340.2670.8730.9230.787
Instruction30.7680.4190.8890.0980.8010.3990.9010.9230.888
Resources10.3810.6970.6630.5190.4430.7160.8510.8120.864
Resources20.0000.9030.2530.792−0.0360.8310.8510.8120.864
Bold indicates the highest component loading within each factor.
Table 9. Results from Linear Regression Models, Dependent Variable: Satisfaction.
Model (1)Model (2)
All Respondents STRIVE T3 All Respondents STRIVE T3
Score 10.126***0.210*−0.008 −0.0209 −0.068 0.0151
(0.030) (0.081) (0.020) (0.043) (0.126) (0.026)
Score 20.008 0.0426 0.037 0.157***0.283*0.0399
(0.030) (0.081) (0.020) (0.043) (0.131) (0.026)
Score 3 −0.022 0.000 −0.0336
(0.034) (0.089) (0.023)
Constant4.947***4.888***4.980***4.946***4.887***4.979***
(0.030) (0.080) (0.020) (0.029) (0.079) (0.020)
N74 25 47 74 25 49
R-sq0.204 0.238 0.071 0.228 0.289 0.102
Standard errors in parentheses; * p < 0.05, *** p < 0.001; Scores indicate predicted factor components, where each factor is a linear combination of the variables from the following question types: Content, Instruction, Adequacy of Resources.
Table 10. SWOT Analysis Findings Summary.
SWOT Analysis/ProgramNYFSSSTRIVET3
Internal Strengths (S)
Incorporated Indigenous elements into the program curriculum
Trainers were knowledgeable
Intergenerational engagement
Internal Weaknesses (W)
Technical and/or logistical issues
Need for more hands-on activities
Lack of take-home resources
External Opportunities (O)
Intergenerational engagement
More time for training
Including community partners
Content on diabetes
Development of collaborations and partnerships
External Threats (T)
Low program attendance
Other healthy food barriers (e.g., affordability, availability)

