Examining Interrelationships between Tourist Travel Mode and Trip Chain Choices Using the Nested Logit Model

Abstract
:1. Introduction
2. Data
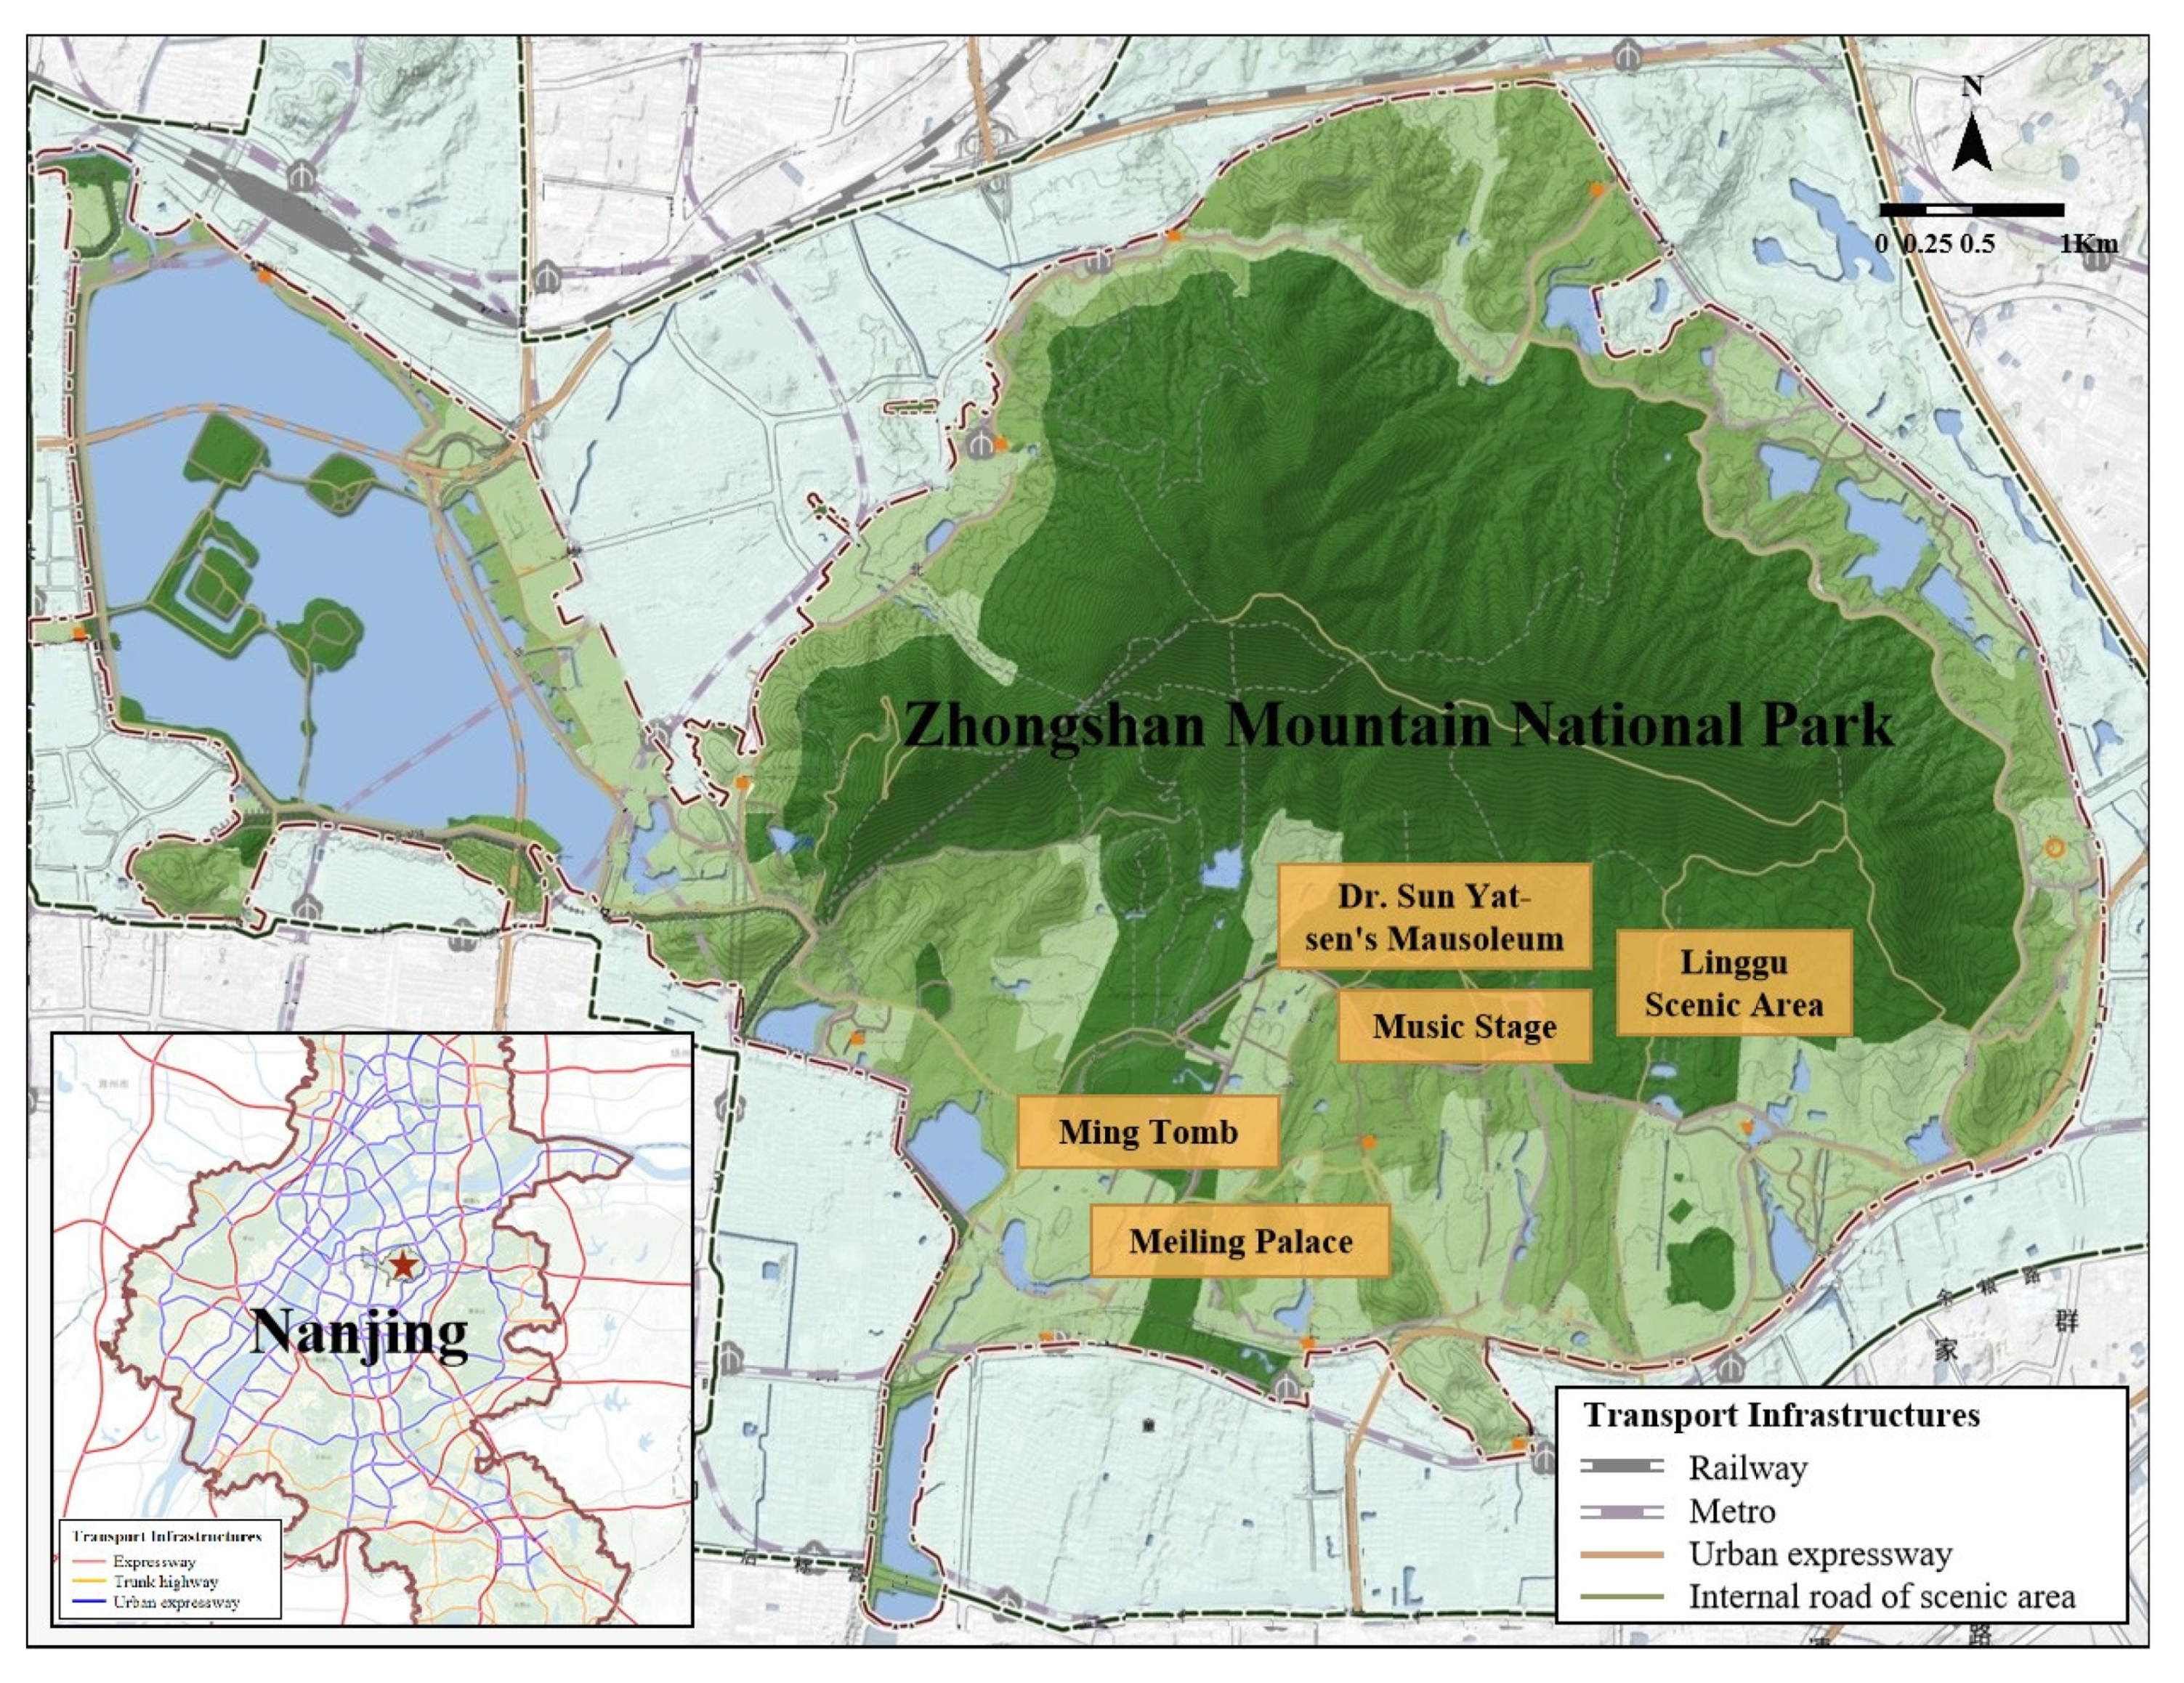
2.1. Study Area
2.2. Survey Design
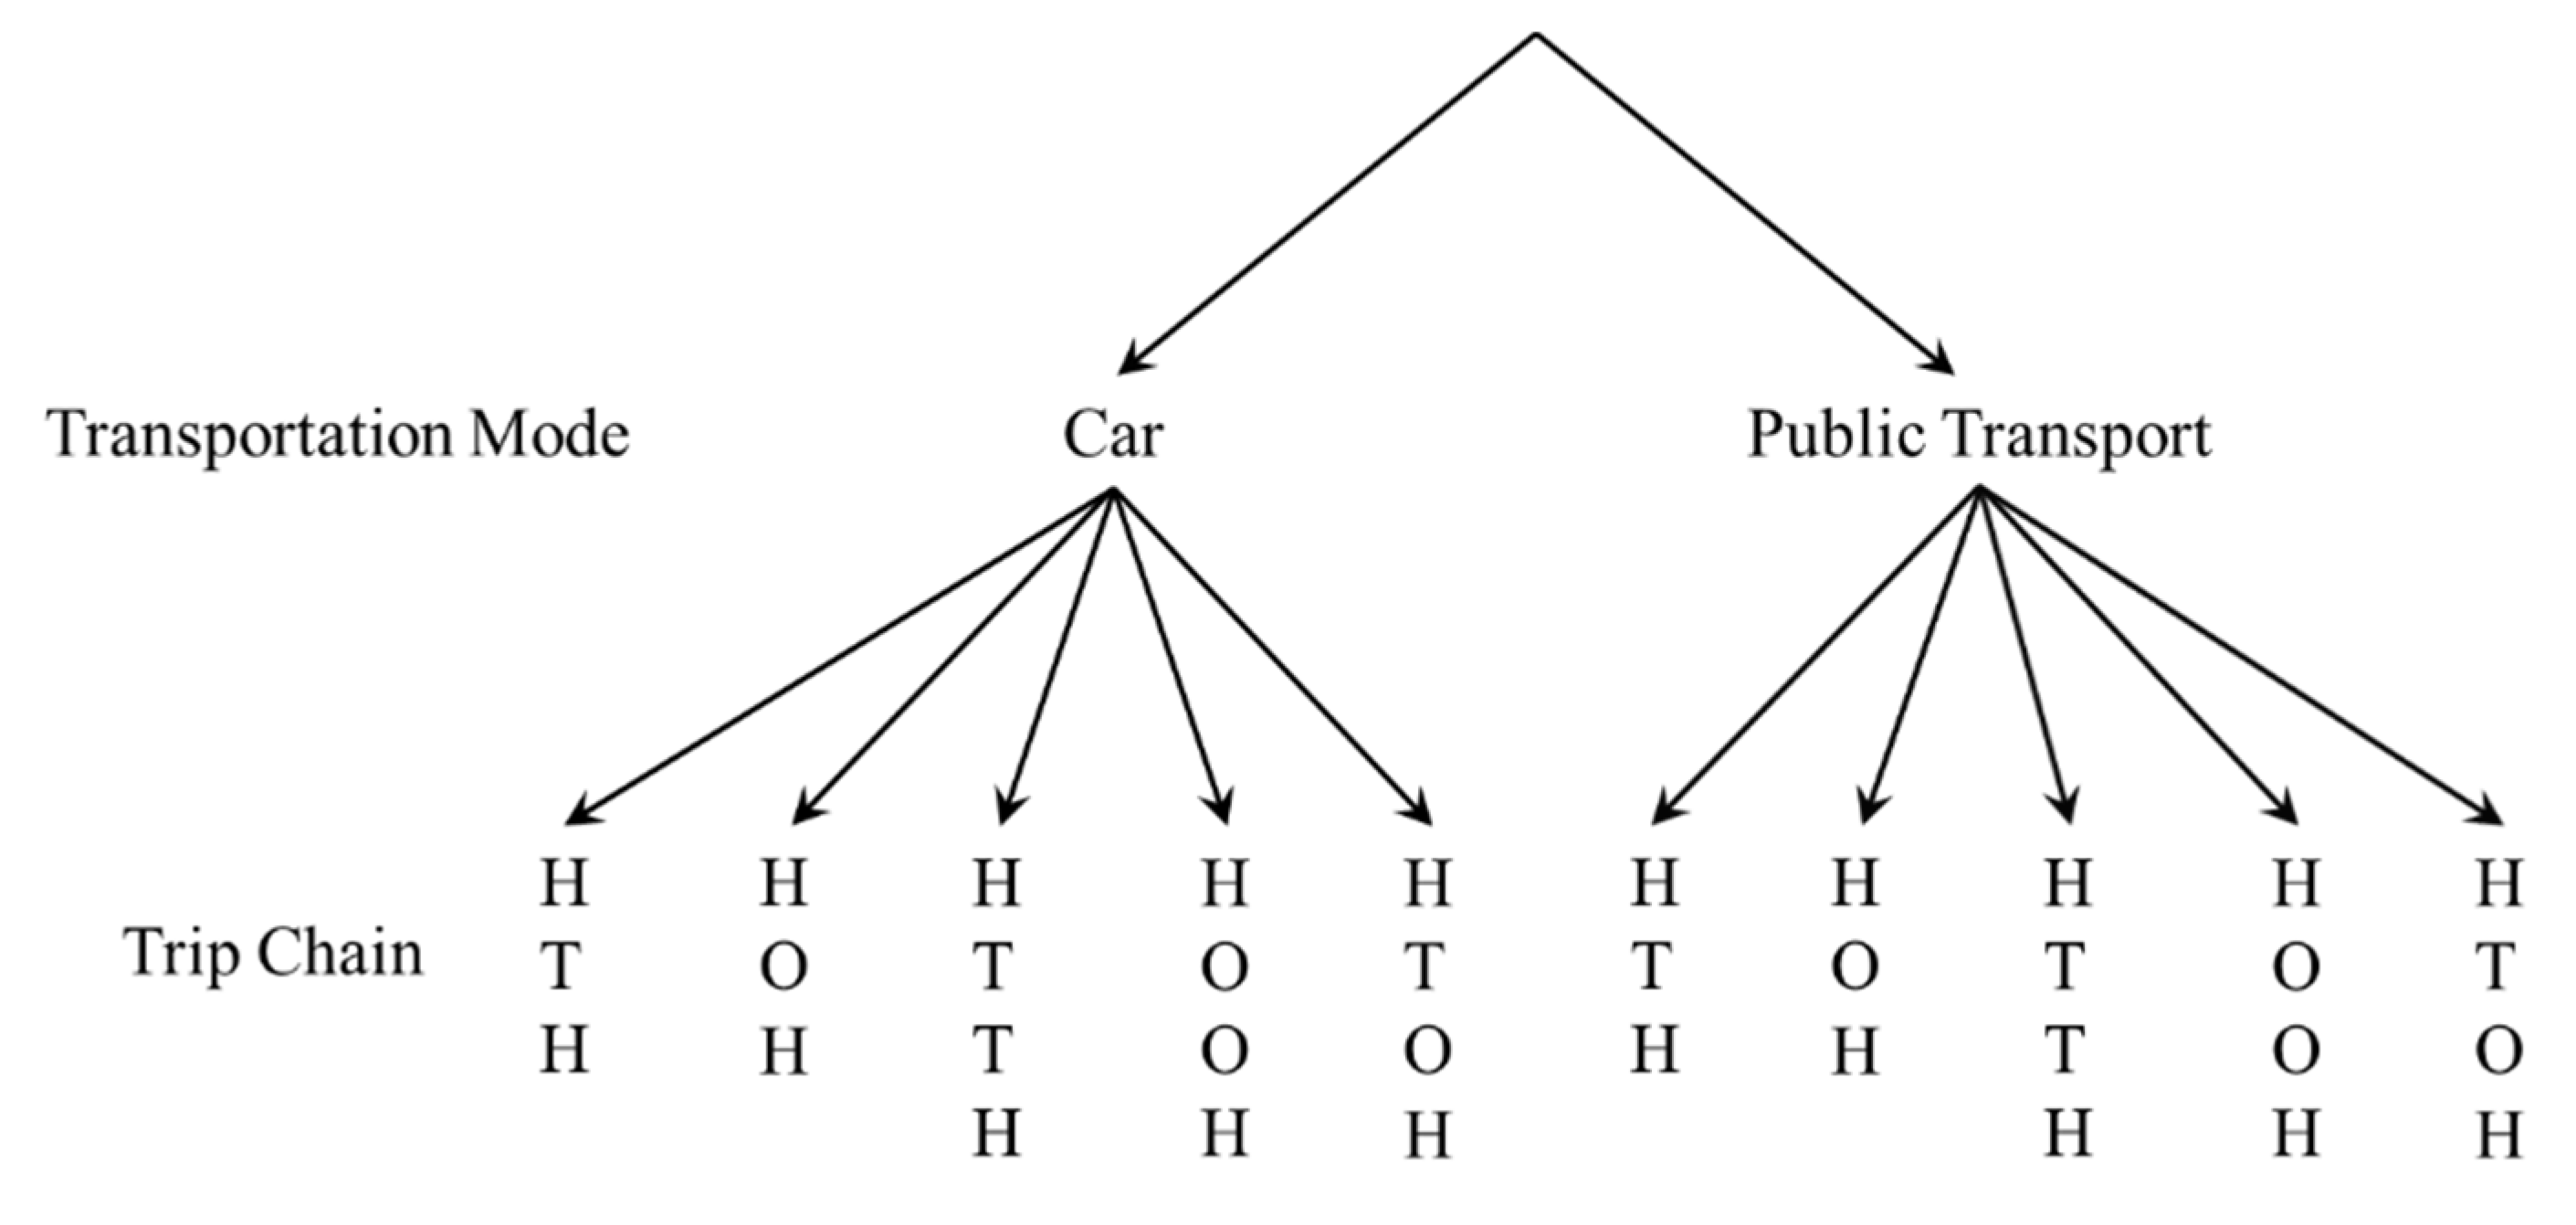
- HTH: There is one tour activity during the day. This trip chain contains only a single tour-related activity stop.
- HOH: There is only one non-tour-related activity during the day. This chain contains only a single non-tour-related activity stop.
- HTTH: There are two tour activities during the day. This chain contains two tour-related activity stops with a mid-trip, with no non-tour-related activity stops.
- HOOH: There are two non-work activities during the day. This chain contains two non-tour-related stops with a mid-trip.
- HTOH: There are two types of activities during the day. This chain combines a tour-related stop and a non-tour-related stop with a mid-trip.
2.3. Sampling and Data Collection
2.4. Descriptive Statistics
3. Methodology
3.1. Model Structure
3.2. Utility Function
3.3. Explanatory Variables
4. Results
4.1. Inclusive Value Parameters
4.2. Influential Factors
5. Discussion
5.1. Relationship between Transportation Modes and Trip Chains
5.2. Explanatory Variables for Trip Chain Choices
5.3. Explanatory Variables Influencing Transportation Mode Choices
6. Conclusions
Author Contributions
Funding
Acknowledgments
Conflicts of Interest
References
- China Statistical Yearbook. 2019. Available online: http://www.stats.gov.cn/tjsj/ndsj/2019/indexch.htm (accessed on 11 September 2020).
- Wang, B.; Shao, C.; Li, J. Holiday travel behavior analysis and empirical study under integrated multimodal travel information service. J. Transp. Syst. Eng. Inf. Technol. 2015, 39, 21–36. [Google Scholar] [CrossRef]
- Yang, L.; Shen, Q.; Li, Z. Comparing travel mode and trip chain choices between holidays and weekdays. Transp. Res. 2016, 91, 273–285. [Google Scholar] [CrossRef]
- Schneider, F.; Ton, D.; Zomer, L.B. Trip chain complexity: A comparison among latent classes of daily mobility patterns. Transportation 2020, 1–23. [Google Scholar] [CrossRef] [Green Version]
- Cheng, L.; Chen, X.; Yang, S. An exploration of the relationships between socioeconomics, land use and daily trip chain pattern among low-income residents. Transp. Plan. Technol. 2016, 39, 358–369. [Google Scholar] [CrossRef]
- Wan, Q.; Li, Z.; Qi, Y. Comparing uncertainties in travel mode choice decisions for various trip chains. Adv. Mech. Eng. 2019, 11. [Google Scholar] [CrossRef] [Green Version]
- Hadiuzzaman, M.; Farazi, N.P.; Hossain, S. Structural equation approach to investigate trip-chaining and mode choice relationships in the context of developing countries. Transp. Plan. Technol. 2019, 42, 391–415. [Google Scholar] [CrossRef]
- Putu, H.; Sakti, A.A.; Muhammad, I.R.; Sumarni, H. Choice models of trip chain and transportation mode for international tourists in tourism destination island. Int. J. Geomate 2019, 16, 195–203. [Google Scholar]
- Zhao, X. The Research of Tourist Behavior Based on Trip-Chain Doctoral Dissertation; Beijing University of Technology: Beijing, China, 2012. [Google Scholar]
- Le, K.; Diem, T. Factors affecting tourists’ public transport use and areas visited at destinations. Tour. Geogr. 2015, 17, 738–757. [Google Scholar]
- Masiero, L.; Zoltan, J. Tourists intra-destination visits and transport mode: A bivariate probit model. Ann. Tour. Res. 2013, 43, 529–546. [Google Scholar] [CrossRef]
- Wu, L.L.; Zhang, J.; Fujiwara, A. Dynamic Analysis of Japanese tourists’ three stage choices: Tourism participation, destination choice, and travel mode choice. Transp. Res. Rec. 2012, 2322, 91–101. [Google Scholar] [CrossRef]
- Jaume, G.; Catalina, J.; Josep, M.R.; Francesc, S. A Study of Traveller Decision-Making Determinants: Prioritizing Destination or Travel Mode. Tour. Econ. 2015, 21, 1149–1167. [Google Scholar]
- Li, G.F.; Long, H.Y. Chengdu Tour Transportation Behavior. J. Transp. Eng. Inf. 2016, 14, 36–41. [Google Scholar]
- Park, D.; Lee, G.; Kim, W.G. Social Network Analysis as a Valuable Tool for Understanding Tourists’ Multi-Attraction Travel Behavioral Intention to Revisit and Recommend. Sustainability 2019, 11, 2497. [Google Scholar] [CrossRef] [Green Version]
- Barros, V.G. Transportation choice and tourists’ behavior. Tour. Econ. 2012, 18, 519–531. [Google Scholar] [CrossRef]
- Gutiérrez, A.; Daniel, M. The Determinants of Tourist Use of Public Transport at the Destination. Sustainability 2016, 8, 908. [Google Scholar]
- Martin, M.J.M.; Guaita, M.J.M.; Molina, M.V. An Analysis of the Tourist Mobility in the Island of Lanzarote: Car Rental Versus More Sustainable Transportation Alternatives. Sustainability 2019, 11, 739. [Google Scholar] [CrossRef] [Green Version]
- Thrane, C. Examining tourists’ long-distance transportation mode choices using a Multinomial Logit regression model. Tour. Manag. Perspect. 2015, 15, 115–121. [Google Scholar] [CrossRef]
- Vo, V.C. Estimation of travel mode choice for domestic tourists to Nha Trang using the multinomial probit model. Transp. Res. Part A Policy Pract. 2013, 49, 149–159. [Google Scholar]
- Antolin, G.; Alonso, B.; Cordera, R. The Effect of Introducing Parking Policies on Managing Mobility to Beaches in Touristic Coastal Towns. Sustainability 2019, 11, 3528. [Google Scholar] [CrossRef] [Green Version]
- Azari, K.A.; Arintono, S.; Hamid, H. Effects of parking and cordon charge policies on tourist’s modal shift in central business district of Mashhad city, Iran. Curr. Issues Tour. 2012, 15, 489–496. [Google Scholar] [CrossRef]
- Nutsugbodo, R.Y.; Amenumey, E.K.; Mensah, C.A. Public transport mode preferences of international tourists in Ghana: Implications for transport planning. Travel Behav. Soc. 2018, 11, 1–8. [Google Scholar] [CrossRef]
- Nakamura, H.; Abe, N. Tourist decisions in renting various personal travel modes: A case study in Kitakyushu City, Japan. Tour. Manag. 2016, 55, 85–93. [Google Scholar] [CrossRef]
- Orsi, F.; Geneletti, D. Assessing the effects of access policies on travel mode choices in an Alpine tourist destination. J. Transp. Geogr. 2014, 39, 21–35. [Google Scholar] [CrossRef]
- Pettebone, D.; Newman, P.; Lawson, S.R. Estimating visitors’ travel mode choices along the Bear Lake Road in Rocky Mountain National Park. J. Transp. Geogr. 2011, 19, 1210–1221. [Google Scholar] [CrossRef]
- Aaron, G.; Miravet, D.; Òscar, S. Transport Mode Choice by Tourists Transferring from a Peripheral High-Speed Rail Station to Their Destinations: Empirical Evidence from Costa Daurada. Sustainability 2019, 11, 3200. [Google Scholar]
- Sven, G.; Bente, G. Sustainable mode of transport choices at the destination—Public transport at German destinations. Tour. Rev. 2018, 73, 401–420. [Google Scholar]
- Wang, B.B. Reconstruction and Evolution Analysis of Holiday Activity Chain under Integrated Multimodal Travel Information Service. Ph.D. Thesis, Beijing Jiaotong University, Beijing, China, 2017. [Google Scholar]
- Nanjing Smart Tourism Big Data Operation Monitoring Platform Data Report. Available online: http://wlj.nanjing.gov.cn/njswhgdxwcbj/202006/P020200612355023226717.pdf (accessed on 12 June 2020).
- Ben-Akiva, M.; Lerman, S.R. Discrete Choice Analysis: Theory and Application to Travel Demand; The MIT Press: London, UK, 1985; pp. 285–291. [Google Scholar]
- Kenneth, E.T. Discrete Choice Models with Simulation; The Cambridge University Press: Cambridge, UK, 2002; pp. 81–90. [Google Scholar]


| Transportation Mode | Trip Chain | Total | ||||
|---|---|---|---|---|---|---|
| HTH | HOH | HTTH | HOOH | HTOH | ||
| Public Transport | 14.4% | 3.7% | 41.9% | 5.2% | 15.6% | 80.7% |
| Private Car | 5.5% | 0.6% | 7.3% | 1.8% | 4.0% | 19.3% |
| Total | 19.9% | 4.3% | 49.2% | 7.0% | 19.6% | 100.0% |
| Independent Variables | Percentage | Independent Variables | Percentage |
|---|---|---|---|
| Tourists Attribute | Transfer Times | ||
| Native tourist | 51.7% | 1 time | 32.4% |
| Non-local tourists | 48.3% | 2 times | 32.4% |
| Occupation | 3 times | 24.2% | |
| Students | 46.8% | >3 times | 11.0% |
| Others | 53.2% | Travel Time | |
| Licence Ownership | <30 min | 4.0% | |
| Driving licence | 63.6% | 30 min–1 h | 26.3% |
| No driving licence | 36.4% | 1–2 h | 41.6% |
| Car Ownership | 2–3 h | 19.0% | |
| 1 car | 26.3% | >3 h | 9.2% |
| 2 cars | 57.5% | Travel Distance | |
| >2 cars | 14.4% | <5 km | 4.9% |
| no car | 1.8% | 5–10 km | 19.3% |
| Travel Companies | 10–30 km | 41.6% | |
| alone | 2.4% | 30–50 km | 17.1% |
| 1 companion | 7.6% | 50–100 km | 12.8% |
| 2 companions | 56.6% | >100 km | 4.3% |
| >2 companions | 33.3% | Travel Cost | |
| Travel Day length | <10 (CNY) | 18.3% | |
| 1 day | 52.6% | 10–30 (CNY) | 41.6% |
| 2 days | 19.0% | 30–50 (CNY) | 14.7% |
| 3 days | 11.0% | 50–100 (CNY) | 12.5% |
| >3 days | 17.4% | >100 (CNY) | 12.8% |
| HTH | HOH | HTTH | HOOH | HTOH | HTH-BUS | HOH-BUS | HTTH-BUS | HOOH-BUS | HTOH-BUS | |
|---|---|---|---|---|---|---|---|---|---|---|
| Constant Term | ||||||||||
| X | - | - | - | - | - | 1.1607 | −4.1054 *** | 3.6870 *** | 2.2747 | 2.9010 |
| Y | - | - | - | - | −4.2091 *** | - | - | - | - | - |
| Explanatory Variables for Trip Chain Choice | ||||||||||
| Time | −0.2643 | −0.2265 | 0.6938 *** | −0.0440 | - | - | - | - | - | - |
| Cost | 0.4463 | −0.7645 | 0.3264 * | −1.3169 *** | - | - | - | - | - | - |
| Distance | −0.1398 | −1.3229 *** | −0.8283 *** | −0.3066 | - | - | - | - | - | - |
| Transfer | −0.7721 *** | −1.1999 *** | −0.4082 *** | −0.6938 *** | - | - | - | - | - | - |
| Explanatory Variables for Mode Choice | ||||||||||
| Native | - | - | - | - | - | −2.4662 *** | 5.2901 *** | −1.0124 ** | 19.4952 *** | −2.2752 * |
| Occupation | - | - | - | - | - | 5.6928 *** | 285.4050 *** | 25.5862 *** | 13.6307 | 55.4410 *** |
| Licence | - | - | - | - | - | 1.8054 *** | −37.6769 *** | 5.8608 *** | −3.6370 | 6.5521 *** |
| Car | - | - | - | - | - | −0.5459 | −2.1405 *** | −1.0364 *** | −4.3685 *** | −4.6962 *** |
| Companions | - | - | - | - | - | 1.2178 *** | −32.8571 *** | 0.6454 ** | 0.7522 | - |
| Day Length | - | - | - | - | - | 0.7828 *** | −3.0537 *** | −0.3234 | 4.2474 *** | 1.4186 *** |
| Inclusive Value Parameters | ||||||||||
| Inclusive Value | −0.3015 *** | −0.1442 *** | 0.0530 ** | 0.1146 *** | 0.0597 *** | - | - | - | - | |
| 0.0944 *** | 0.5515 *** | 0.0220 ** | 0.0350 *** | 0.0114 *** | - | - | - | - | ||
| BUS | CAR | BUS-HTH | BUS-HOH | BUS-HTTH | BUS-HOOH | CAR-HTH | CAR-HOH | CAR-HTTH | CAR-HOOH | |
|---|---|---|---|---|---|---|---|---|---|---|
| Constant Term | ||||||||||
| X | - | - | −0.1525 | - | - | - | −1.4465 | - | - | - |
| Y | - | −4.3635 *** | - | - | - | - | - | - | - | - |
| Explanatory Variables for Mode Choice | ||||||||||
| Time | 0.7872 *** | - | - | - | - | - | - | - | - | - |
| Cost | −0.5905 *** | - | - | - | - | - | - | - | - | - |
| Distance | −0.0599 | - | - | - | - | - | - | - | - | - |
| Transfer | −0.6832 *** | - | - | - | - | - | - | - | - | - |
| Explanatory Variables for Trip Chain Choice | ||||||||||
| Native | - | - | 1.9809 *** | 1.4964 ** | 4.4955 *** | 1.0337 ** | 2.2624 *** | 2.6518 | 0.4265 | −1.2800 |
| Occupation | - | - | 0.5463D8 *** | −0.2770D7 *** | −0.6488D8 *** | 0.1326D8 *** | - | - | - | - |
| Licence | - | - | −2.6287 *** | −4.0151 *** | −6.5710 *** | −1.3413 *** | −2.0750 *** | −0.5081 | 0.8759 | −1.4465 |
| Car | - | - | 1.2632 *** | 1.7051 ** | 4.6029 *** | 0.1801 | 0.6665 | 1.1630 | 0.5295 | 1.4238 * |
| Companions | - | - | −0.9747 *** | −0.5968 | −3.0084 *** | −0.8960 *** | −0.2570 | −1.3439 * | −0.5780 | −0.7767 |
| Day Length | - | - | 0.6545 *** | −0.1363 | 5.4239 *** | 0.0808 | −0.7228 ** | −1.8871 | −0.1758 | −0.1280 |
| Inclusive Value Parameters | ||||||||||
| Inclusive Value | 0.1726 *** | 0.9959 *** | - | - | - | - | - | - | - | |
| 0.0051 *** | 0.4598 *** | - | - | - | - | - | - | - | ||
© 2020 by the authors. Licensee MDPI, Basel, Switzerland. This article is an open access article distributed under the terms and conditions of the Creative Commons Attribution (CC BY) license (http://creativecommons.org/licenses/by/4.0/).
Share and Cite
Qi, C.; Zhu, Z.; Guo, X.; Lu, R.; Chen, J. Examining Interrelationships between Tourist Travel Mode and Trip Chain Choices Using the Nested Logit Model. Sustainability 2020, 12, 7535. https://doi.org/10.3390/su12187535
Qi C, Zhu Z, Guo X, Lu R, Chen J. Examining Interrelationships between Tourist Travel Mode and Trip Chain Choices Using the Nested Logit Model. Sustainability. 2020; 12(18):7535. https://doi.org/10.3390/su12187535
Chicago/Turabian StyleQi, Cong, Zhenjun Zhu, Xiucheng Guo, Ruiying Lu, and Junlan Chen. 2020. "Examining Interrelationships between Tourist Travel Mode and Trip Chain Choices Using the Nested Logit Model" Sustainability 12, no. 18: 7535. https://doi.org/10.3390/su12187535