Laundry Care Regimes: Do the Practices of Keeping Clothes Clean Have Different Environmental Impacts Based on the Fibre Content?


Abstract

1. Introduction
2. Materials and Methods
2.1. Wardrobe Survey
- Wool and blends include pure wool, merino, cashmere and wool blend materials
- Cotton and blends include pure cotton, denim and cotton blend materials
- Synthetic fibres include all synthetic fibres. The most common types were given as examples in the questionnaire (polyester, polyamide/nylon, acrylic, and polypropylene)
- Regenerated cellulosic fibres include all fibres manufactured from cellulose. The most common types were given as examples in the questionnaire (viscose/rayon, modal, lyocell and acetate).
- When the term “man-made fibres” is used, the category refers both to synthetic and regenerated fibres.
2.2. Laundry Diaries
2.3. Energy and Water Use Data
3. Results
3.1. Cleaning and Drying Methods
3.1.1. Washing with Washing Machine
3.1.2. Washing by Hand
3.1.3. Dry Cleaning
3.1.4. Clothes Dryers
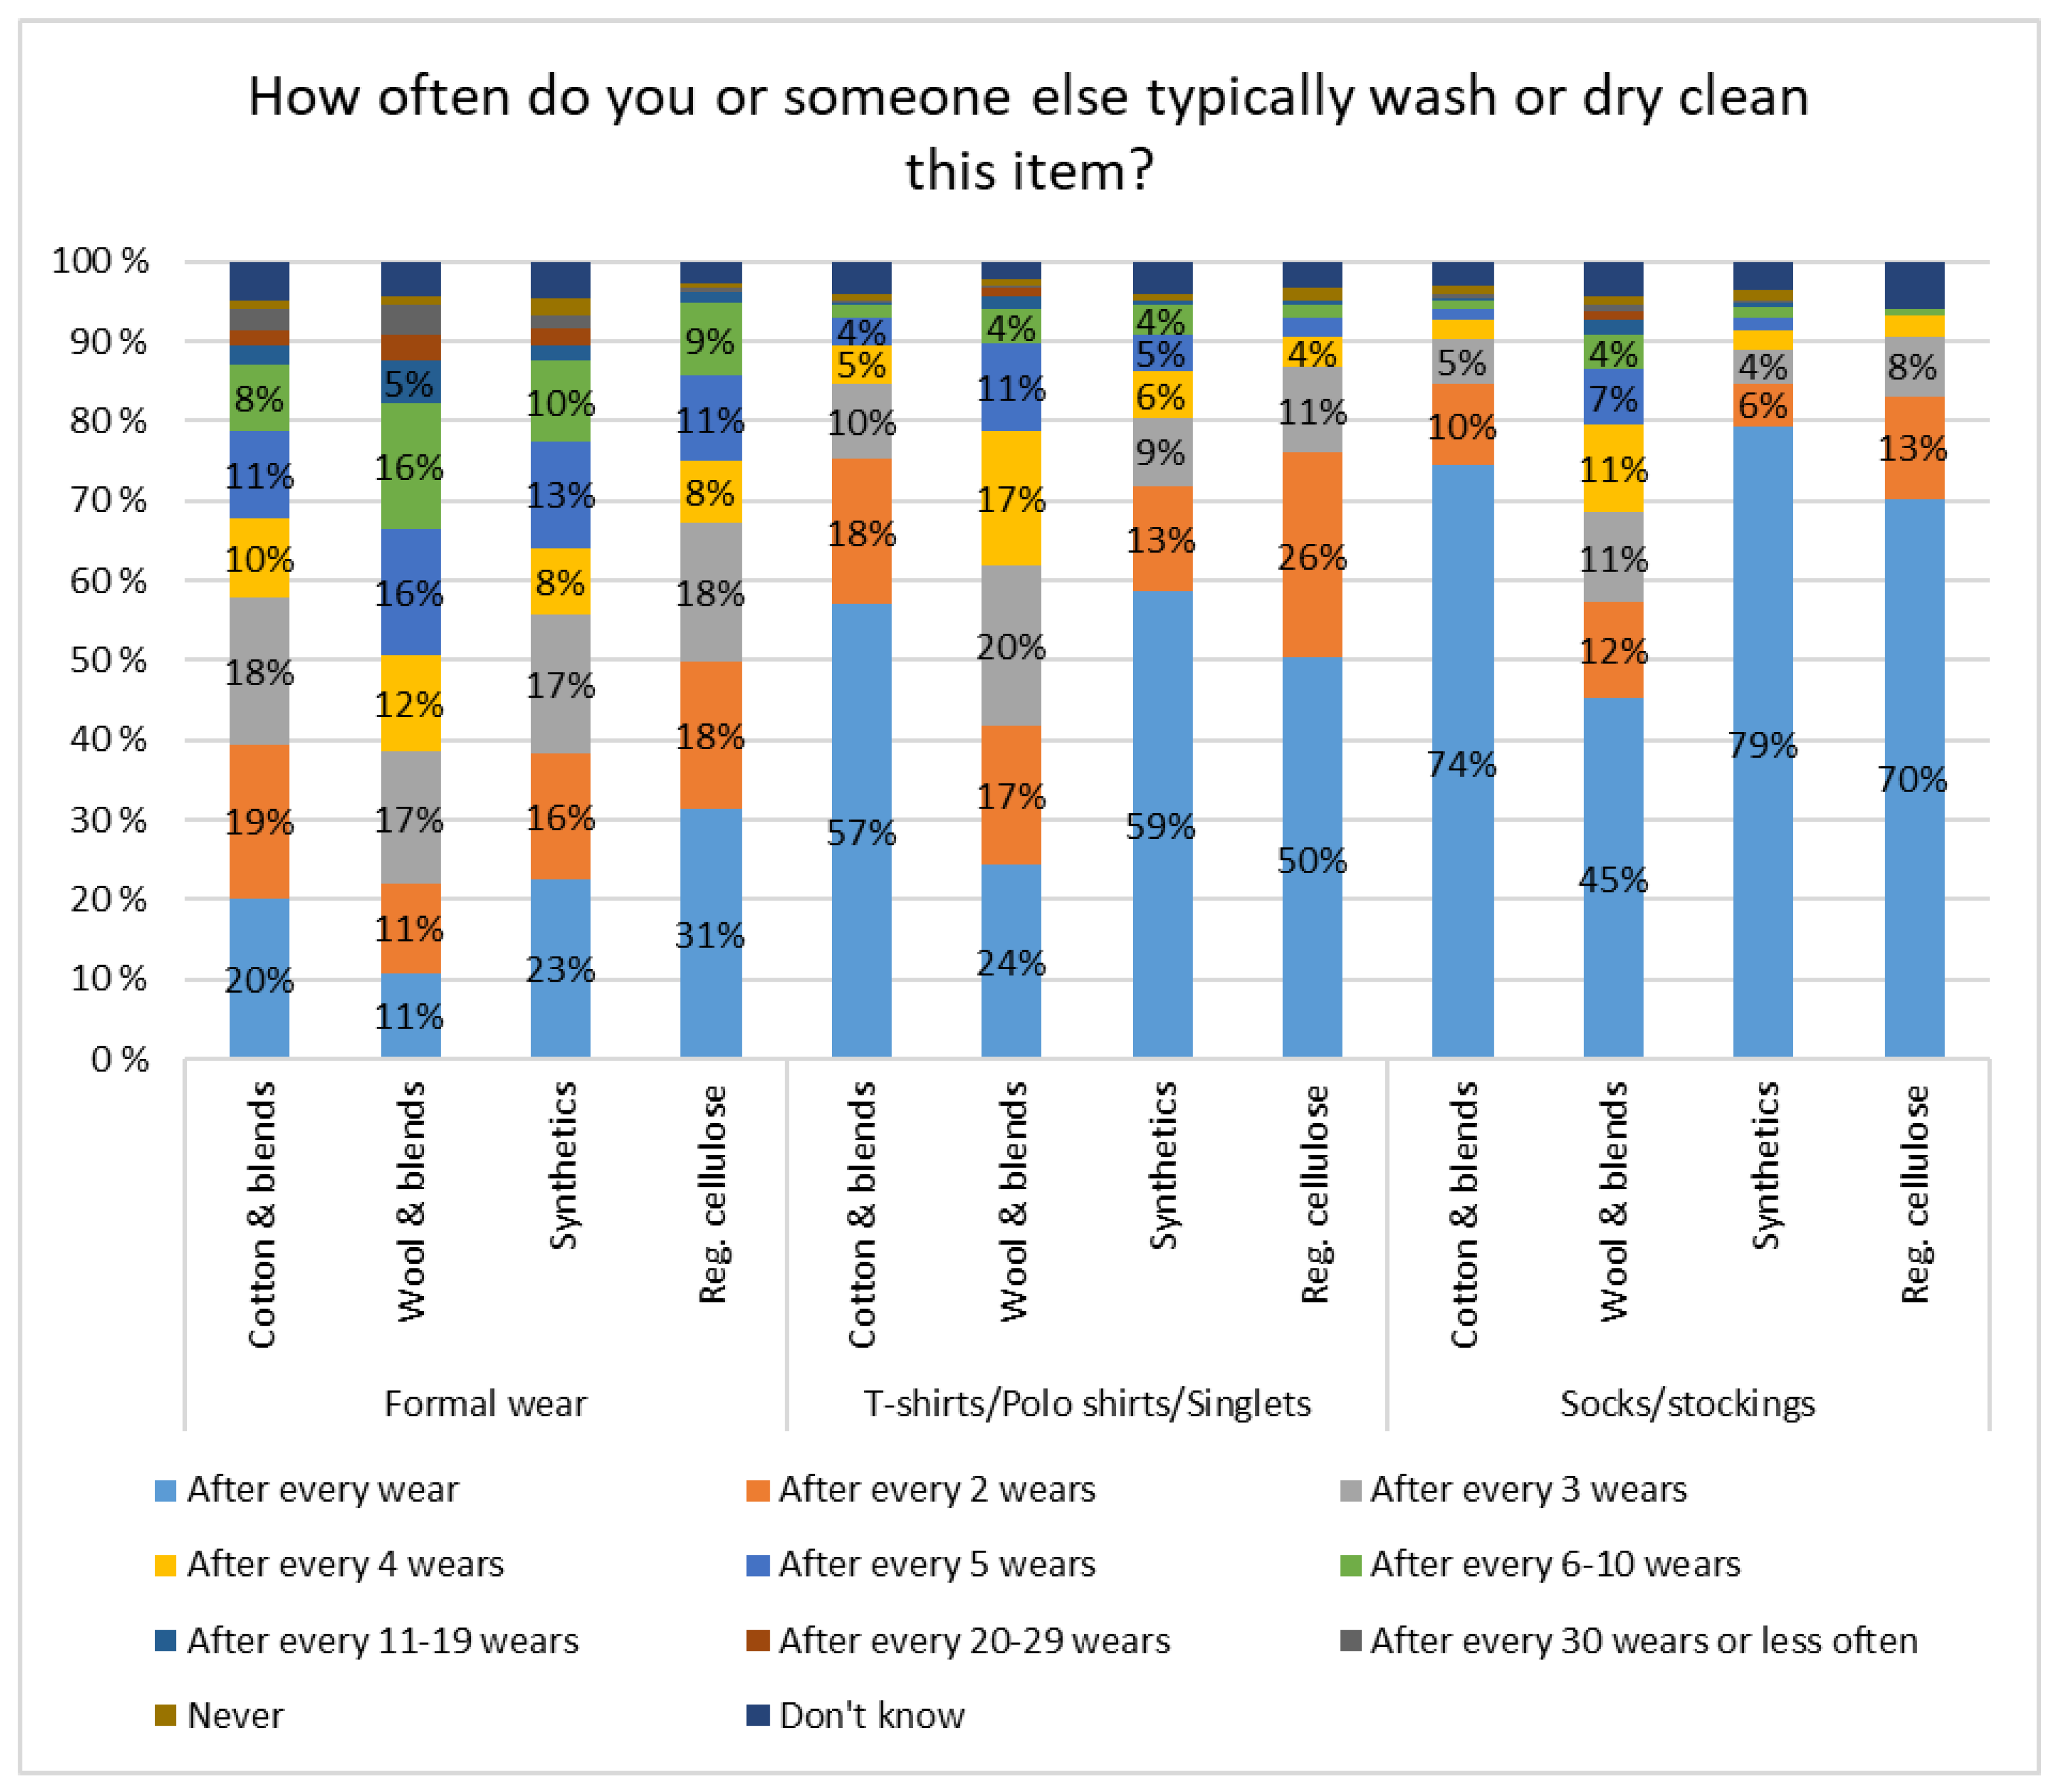
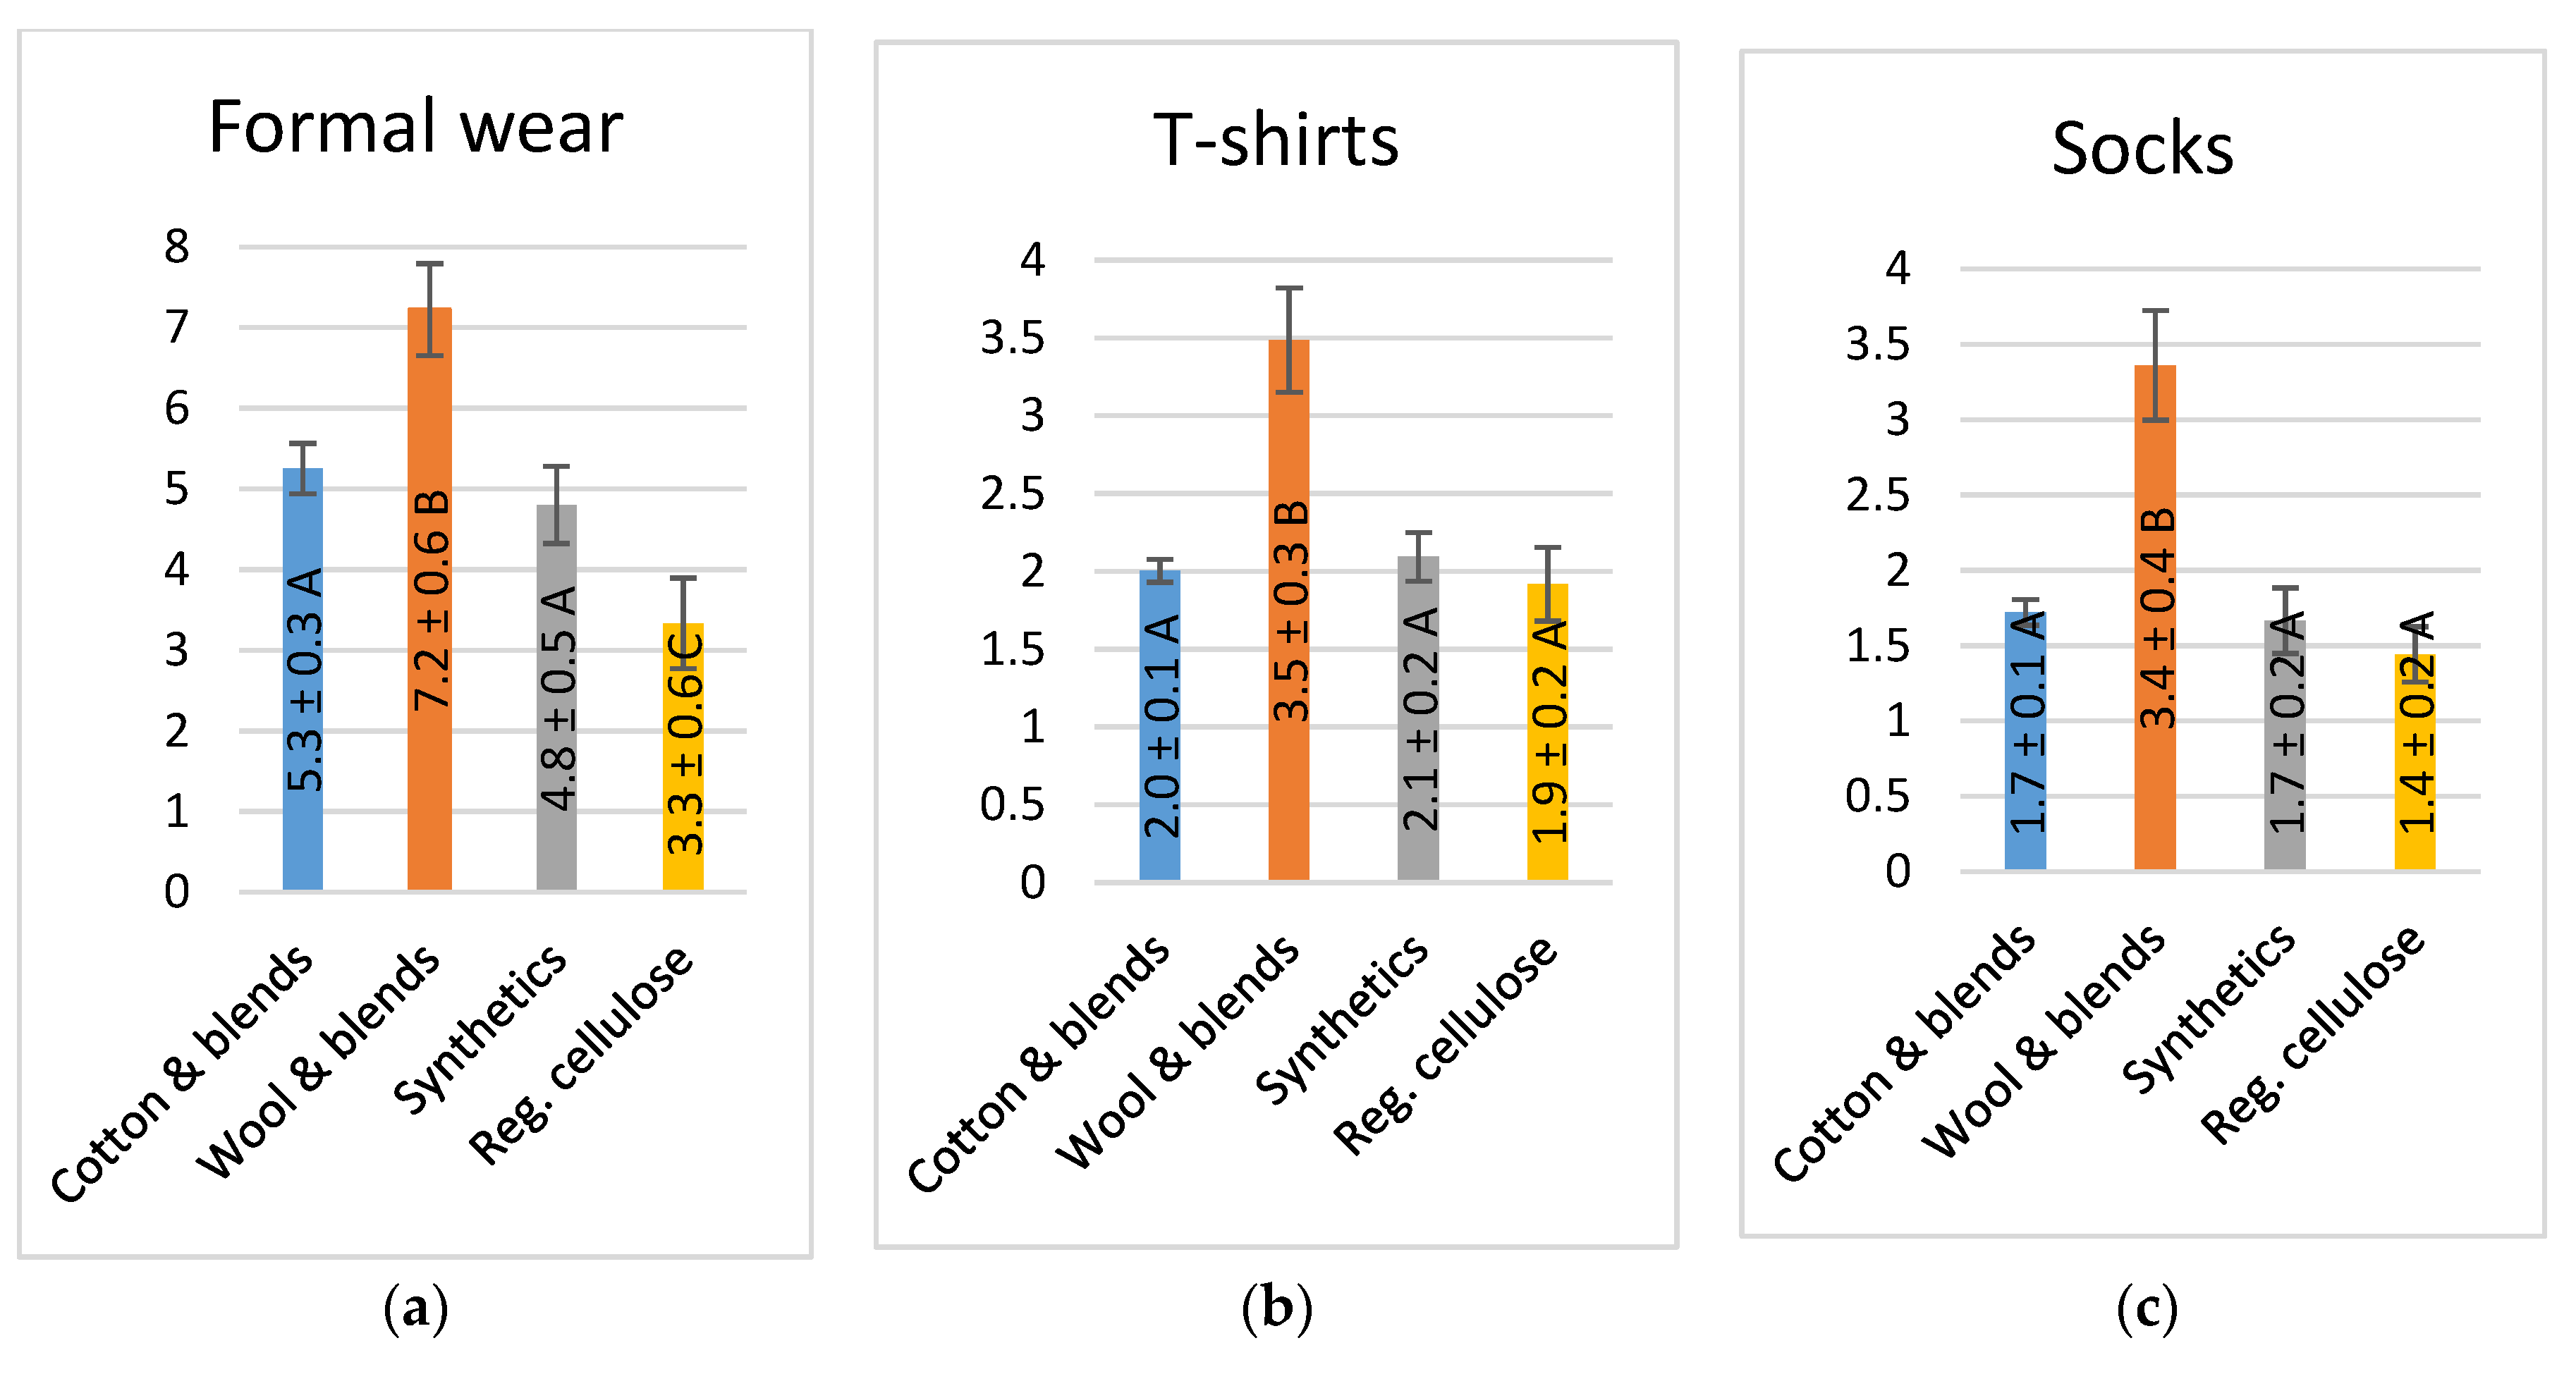
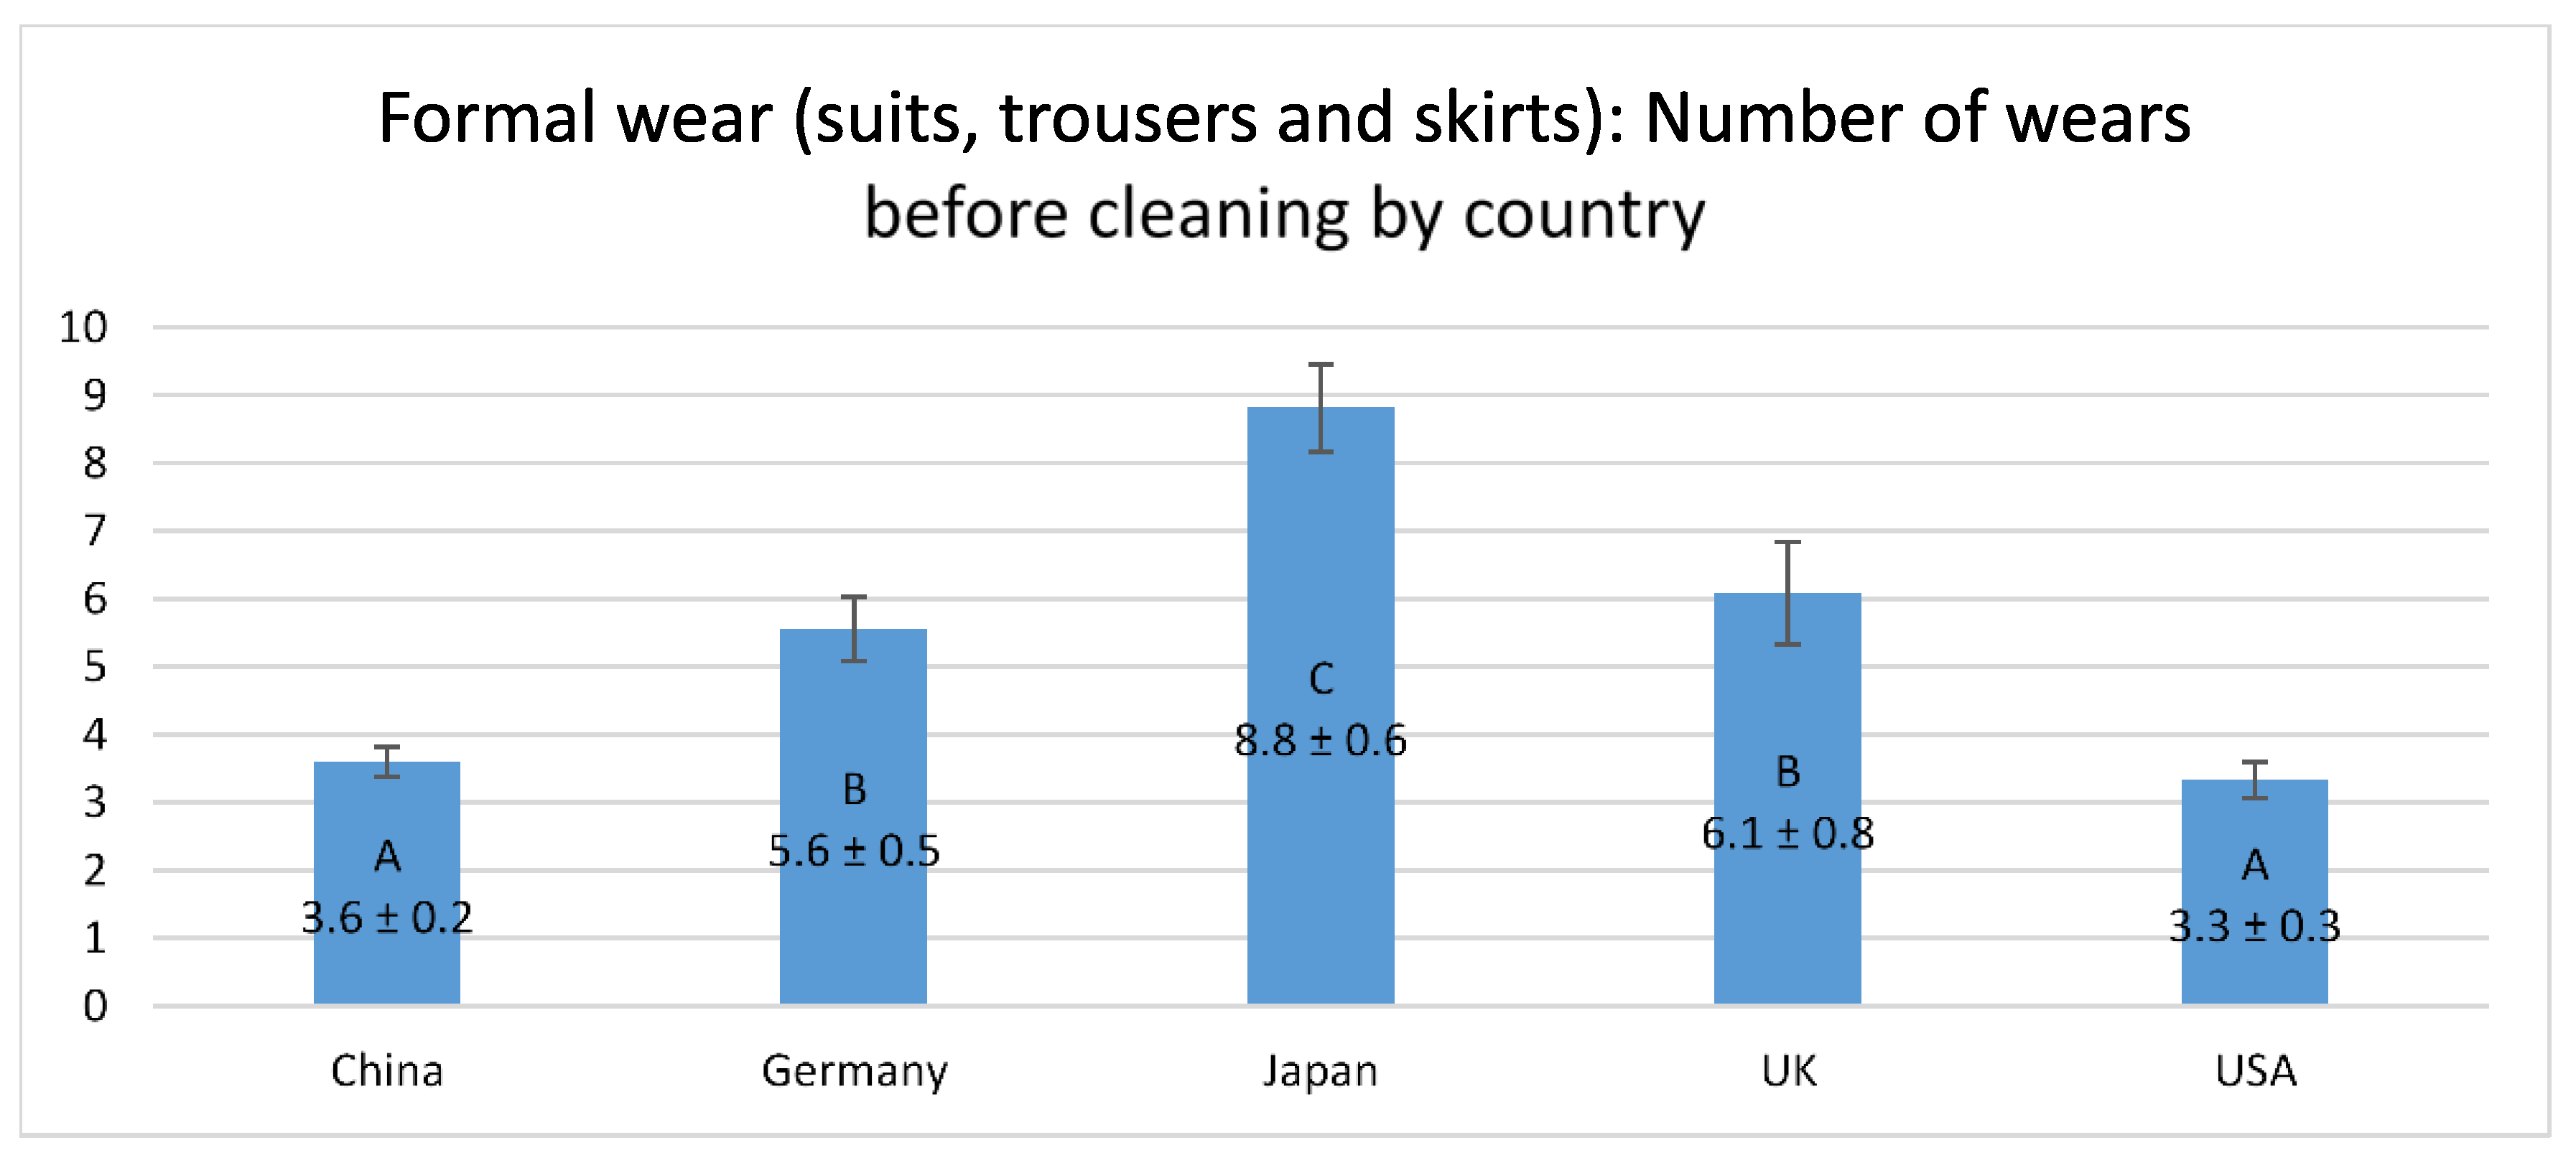
3.2. Clothing Specific Data
Cleaning Frequencies
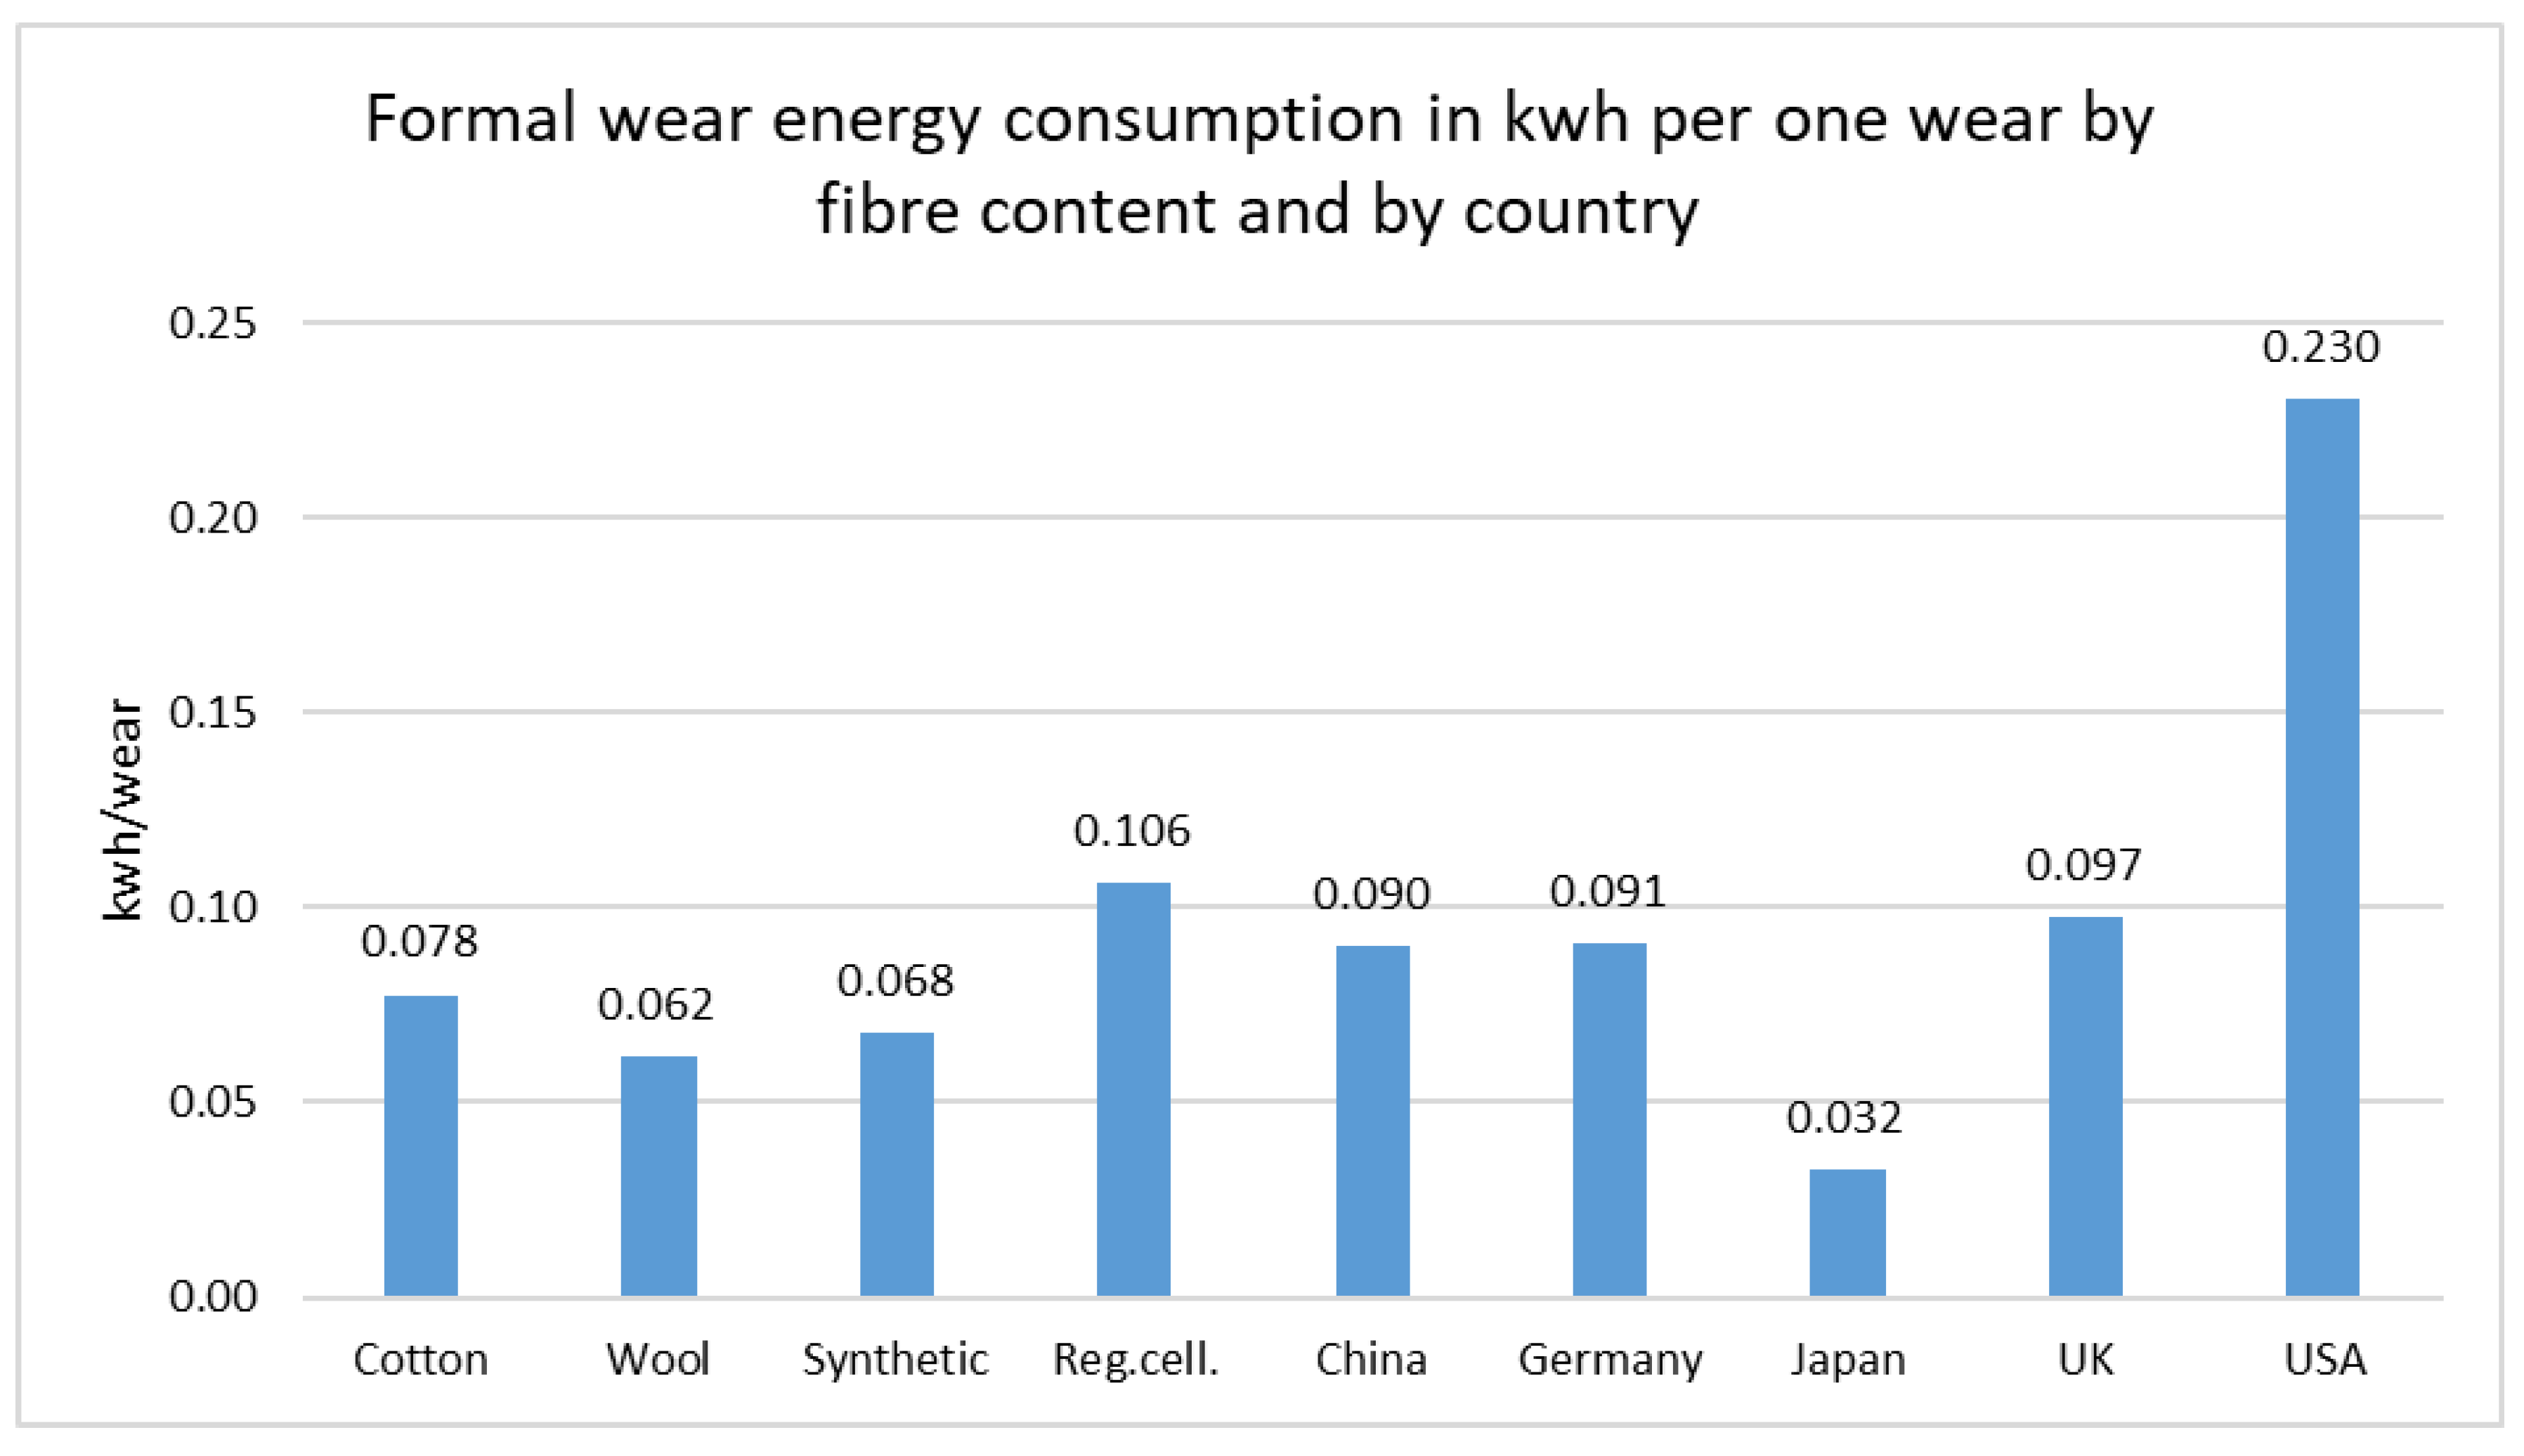
3.3. Environmental Impacts
3.3.1. Energy Use and Related CO2 Emissions
3.3.2. Water Use
3.3.3. Limitations
4. Discussion
5. Conclusions
5.1. Implications
5.2. Future Research Directions
- Regions such as South America and Africa, as well as other types of textiles such as bed linen and sportswear.
- The causes of the big differences in the cleaning methods and frequencies—here, more local qualitative studies will contribute.
- The construction of garments to reduce the environmental impact of cleaning.
- Accounting for microplastics and the potential ecotoxicity of detergents in life cycle assessments.
- How to implement the best practices in laundering as an environmental strategy
Author Contributions
Funding
Acknowledgments
Conflicts of Interest
Appendix A


| Garment Category | Fibre Content | Country | Mean | Median | Std. Deviation | N |
|---|---|---|---|---|---|---|
| Formal wear (suits, trousers and skirts) | Cotton and blends | China | 3.6 | 3.0 | 4.5 | 777 |
| Germany | 5.5 | 3.0 | 7.3 | 525 | ||
| Japan | 9.7 | 5.0 | 13.9 | 565 | ||
| UK | 5.5 | 3.0 | 10.2 | 500 | ||
| USA | 3.0 | 2.0 | 3.8 | 658 | ||
| Total | 5.3 | 3.0 | 8.8 | 3025 | ||
| Wool and blends | China | 4.1 | 3.0 | 3.0 | 269 | |
| Germany | 7.2 | 5.0 | 6.6 | 118 | ||
| Japan | 9.2 | 5.0 | 12.0 | 486 | ||
| UK | 9.2 | 4.0 | 14.5 | 139 | ||
| USA | 5.0 | 3.0 | 5.7 | 169 | ||
| Total | 7.2 | 4.0 | 10.0 | 1181 | ||
| Synthetics | China | 3.5 | 2.0 | 5.5 | 265 | |
| Germany | 4.5 | 3.0 | 3.4 | 79 | ||
| Japan | 6.6 | 4.0 | 8.7 | 289 | ||
| UK | 5.7 | 3.0 | 9.9 | 130 | ||
| USA | 2.5 | 2.0 | 2.8 | 116 | ||
| Total | 4.8 | 3.0 | 7.2 | 879 | ||
| Regenerated cellulose | China | 3.1 | 2.0 | 2.6 | 107 | |
| Germany | 3.8 | 3.0 | 2.0 | 32 | ||
| Japan | 4.1 | 4.5 | 2.8 | 16 | ||
| UK | 3.3 | 1.0 | 8.6 | 32 | ||
| USA | 3.5 | 2.0 | 3.4 | 23 | ||
| Total | 3.3 | 2.0 | 4.1 | 210 | ||
| Total | China | 3.6 | 3.0 | 4.4 | 1418 | |
| Germany | 5.6 | 3.0 | 6.8 | 754 | ||
| Japan | 8.8 | 5.0 | 12.2 | 1356 | ||
| UK | 6.1 | 3.0 | 11.1 | 801 | ||
| USA | 3.3 | 2.0 | 4.1 | 966 | ||
| Total | 5.5 | 3.0 | 8.7 | 5295 | ||
| T-shirts/polo shirts/singlets/tanks | Cotton and blends | China | 2.0 | 1.0 | 2.6 | 924 |
| Germany | 2.1 | 2.0 | 1.4 | 1727 | ||
| Japan | 1.9 | 1.0 | 5.5 | 1398 | ||
| UK | 2.1 | 1.0 | 2.6 | 1232 | ||
| USA | 1.9 | 1.0 | 2.2 | 1645 | ||
| Total | 2.0 | 1.0 | 3.1 | 6926 | ||
| Wool and blends | China | 3.3 | 3.0 | 3.4 | 129 | |
| Germany | 3.2 | 3.0 | 2.7 | 148 | ||
| Japan | 3.5 | 2.0 | 5.8 | 95 | ||
| UK | 3.2 | 3.0 | 2.2 | 67 | ||
| USA | 4.4 | 3.0 | 4.4 | 74 | ||
| Total | 3.5 | 3.0 | 3.9 | 513 | ||
| Synthetics | China | 2.0 | 1.0 | 2.4 | 121 | |
| Germany | 2.2 | 2.0 | 2.2 | 149 | ||
| Japan | 2.0 | 1.0 | 2.2 | 265 | ||
| UK | 2.7 | 2.0 | 2.3 | 107 | ||
| USA | 1.9 | 1.0 | 1.8 | 123 | ||
| Total | 2.1 | 1.0 | 2.2 | 765 | ||
| Regenerated cellulose | China | 1.8 | 1.0 | 1.2 | 65 | |
| Germany | 1.9 | 2.0 | 1.2 | 55 | ||
| Japan | 3.0 | 1.0 | 4.3 | 14 | ||
| UK | 1.7 | 2.0 | 0.7 | 19 | ||
| USA | 1.7 | 1.0 | 1.1 | 27 | ||
| Total | 1.9 | 1.0 | 1.6 | 180 | ||
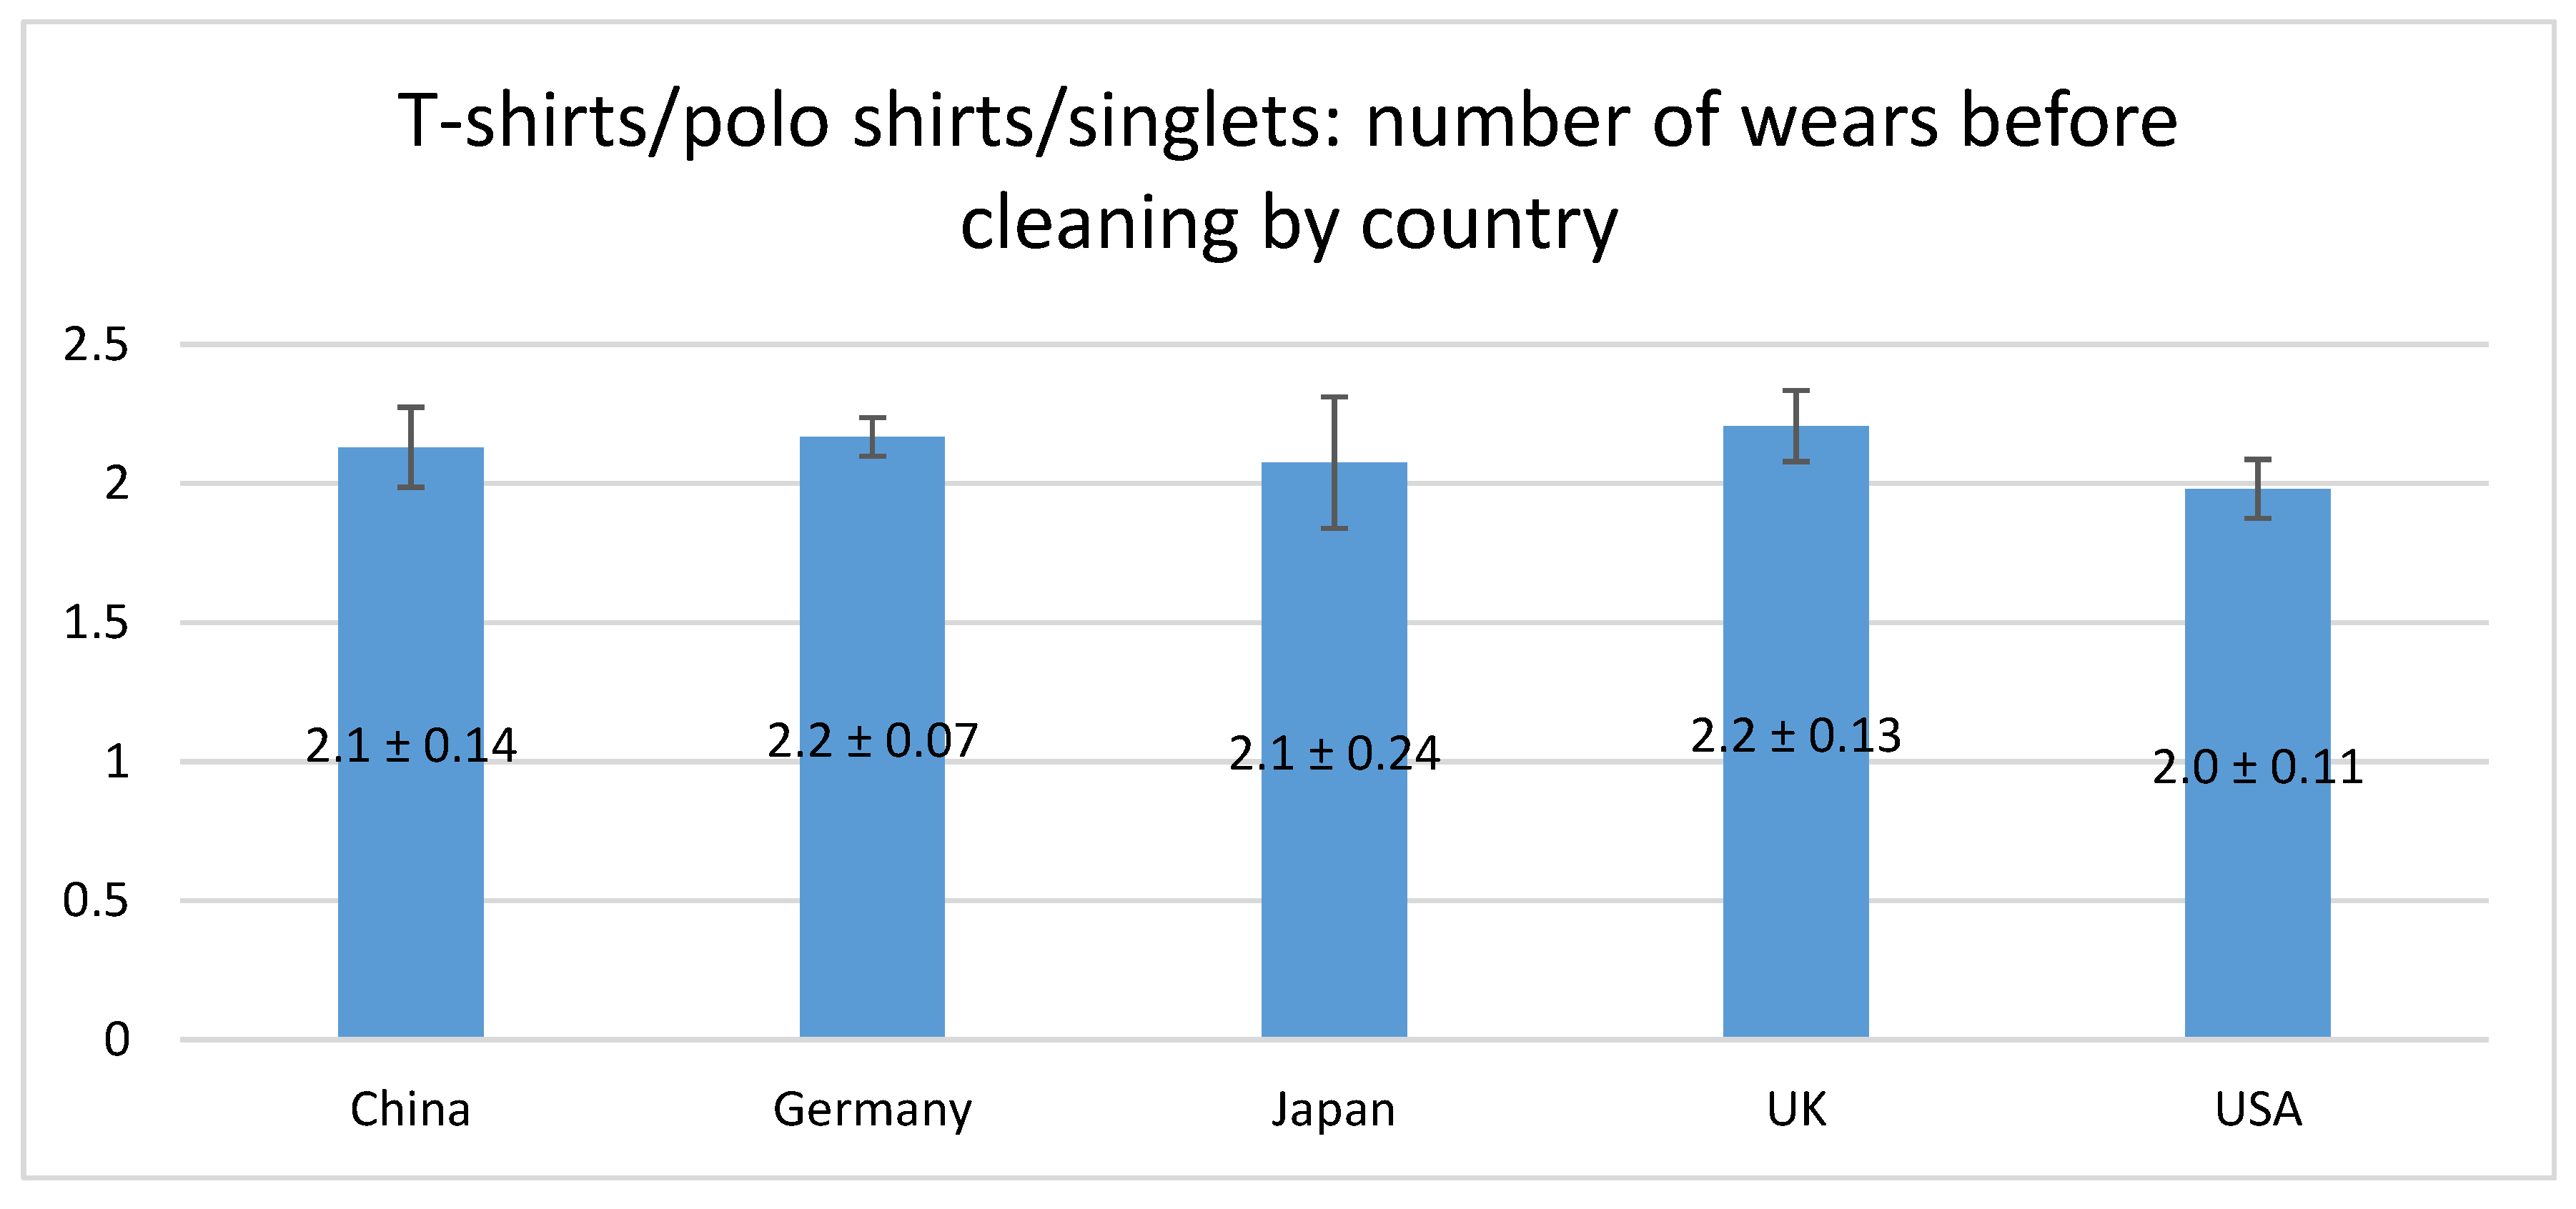
| Total | China | 2.1 | 1.0 | 2.6 | 1239 | |
| Germany | 2.2 | 2.0 | 1.7 | 2079 | ||
| Japan | 2.0 | 1.0 | 5.1 | 1772 | ||
| UK | 2.2 | 2.0 | 2.5 | 1425 | ||
| USA | 2.0 | 1.0 | 2.4 | 1869 | ||
| Total | 2.1 | 1.0 | 3.1 | 8384 | ||
| Pairs of socks/stockings | Cotton and blends | China | 1.9 | 1.0 | 3.9 | 1318 |
| Germany | 1.6 | 1.0 | 2.0 | 1519 | ||
| Japan | 2.0 | 1.0 | 6.6 | 1057 | ||
| UK | 1.5 | 1.0 | 2.1 | 1201 | ||
| USA | 1.6 | 1.0 | 1.3 | 1419 | ||
| Total | 1.7 | 1.0 | 3.5 | 6514 | ||
| Wool and blends | China | 3.1 | 2.0 | 4.7 | 214 | |
| Germany | 3.8 | 2.0 | 5.4 | 197 | ||
| Japan | 3.7 | 1.0 | 8.8 | 168 | ||
| UK | 3.2 | 2.0 | 5.8 | 229 | ||
| USA | 3.0 | 2.0 | 3.3 | 172 | ||
| Total | 3.4 | 2.0 | 5.8 | 980 | ||
| Synthetics | China | 1.6 | 1.0 | 2.4 | 141 | |
| Germany | 2.3 | 1.0 | 5.6 | 159 | ||
| Japan | 1.4 | 1.0 | 3.7 | 371 | ||
| UK | 1.9 | 1.0 | 2.2 | 171 | ||
| USA | 1.5 | 1.0 | 1.1 | 136 | ||
| Total | 1.7 | 1.0 | 3.5 | 978 | ||
| Regenerated cellulose | China | 1.3 | 1.0 | 0.7 | 56 | |
| Germany | 1.9 | 1.0 | 1.6 | 21 | ||
| Japan | 1.4 | 1.0 | 0.9 | 14 | ||
| UK | 1.1 | 1.0 | 0.3 | 14 | ||
| USA | 1.8 | 1.5 | 1.2 | 6 | ||
| Total | 1.4 | 1.0 | 1.0 | 111 | ||
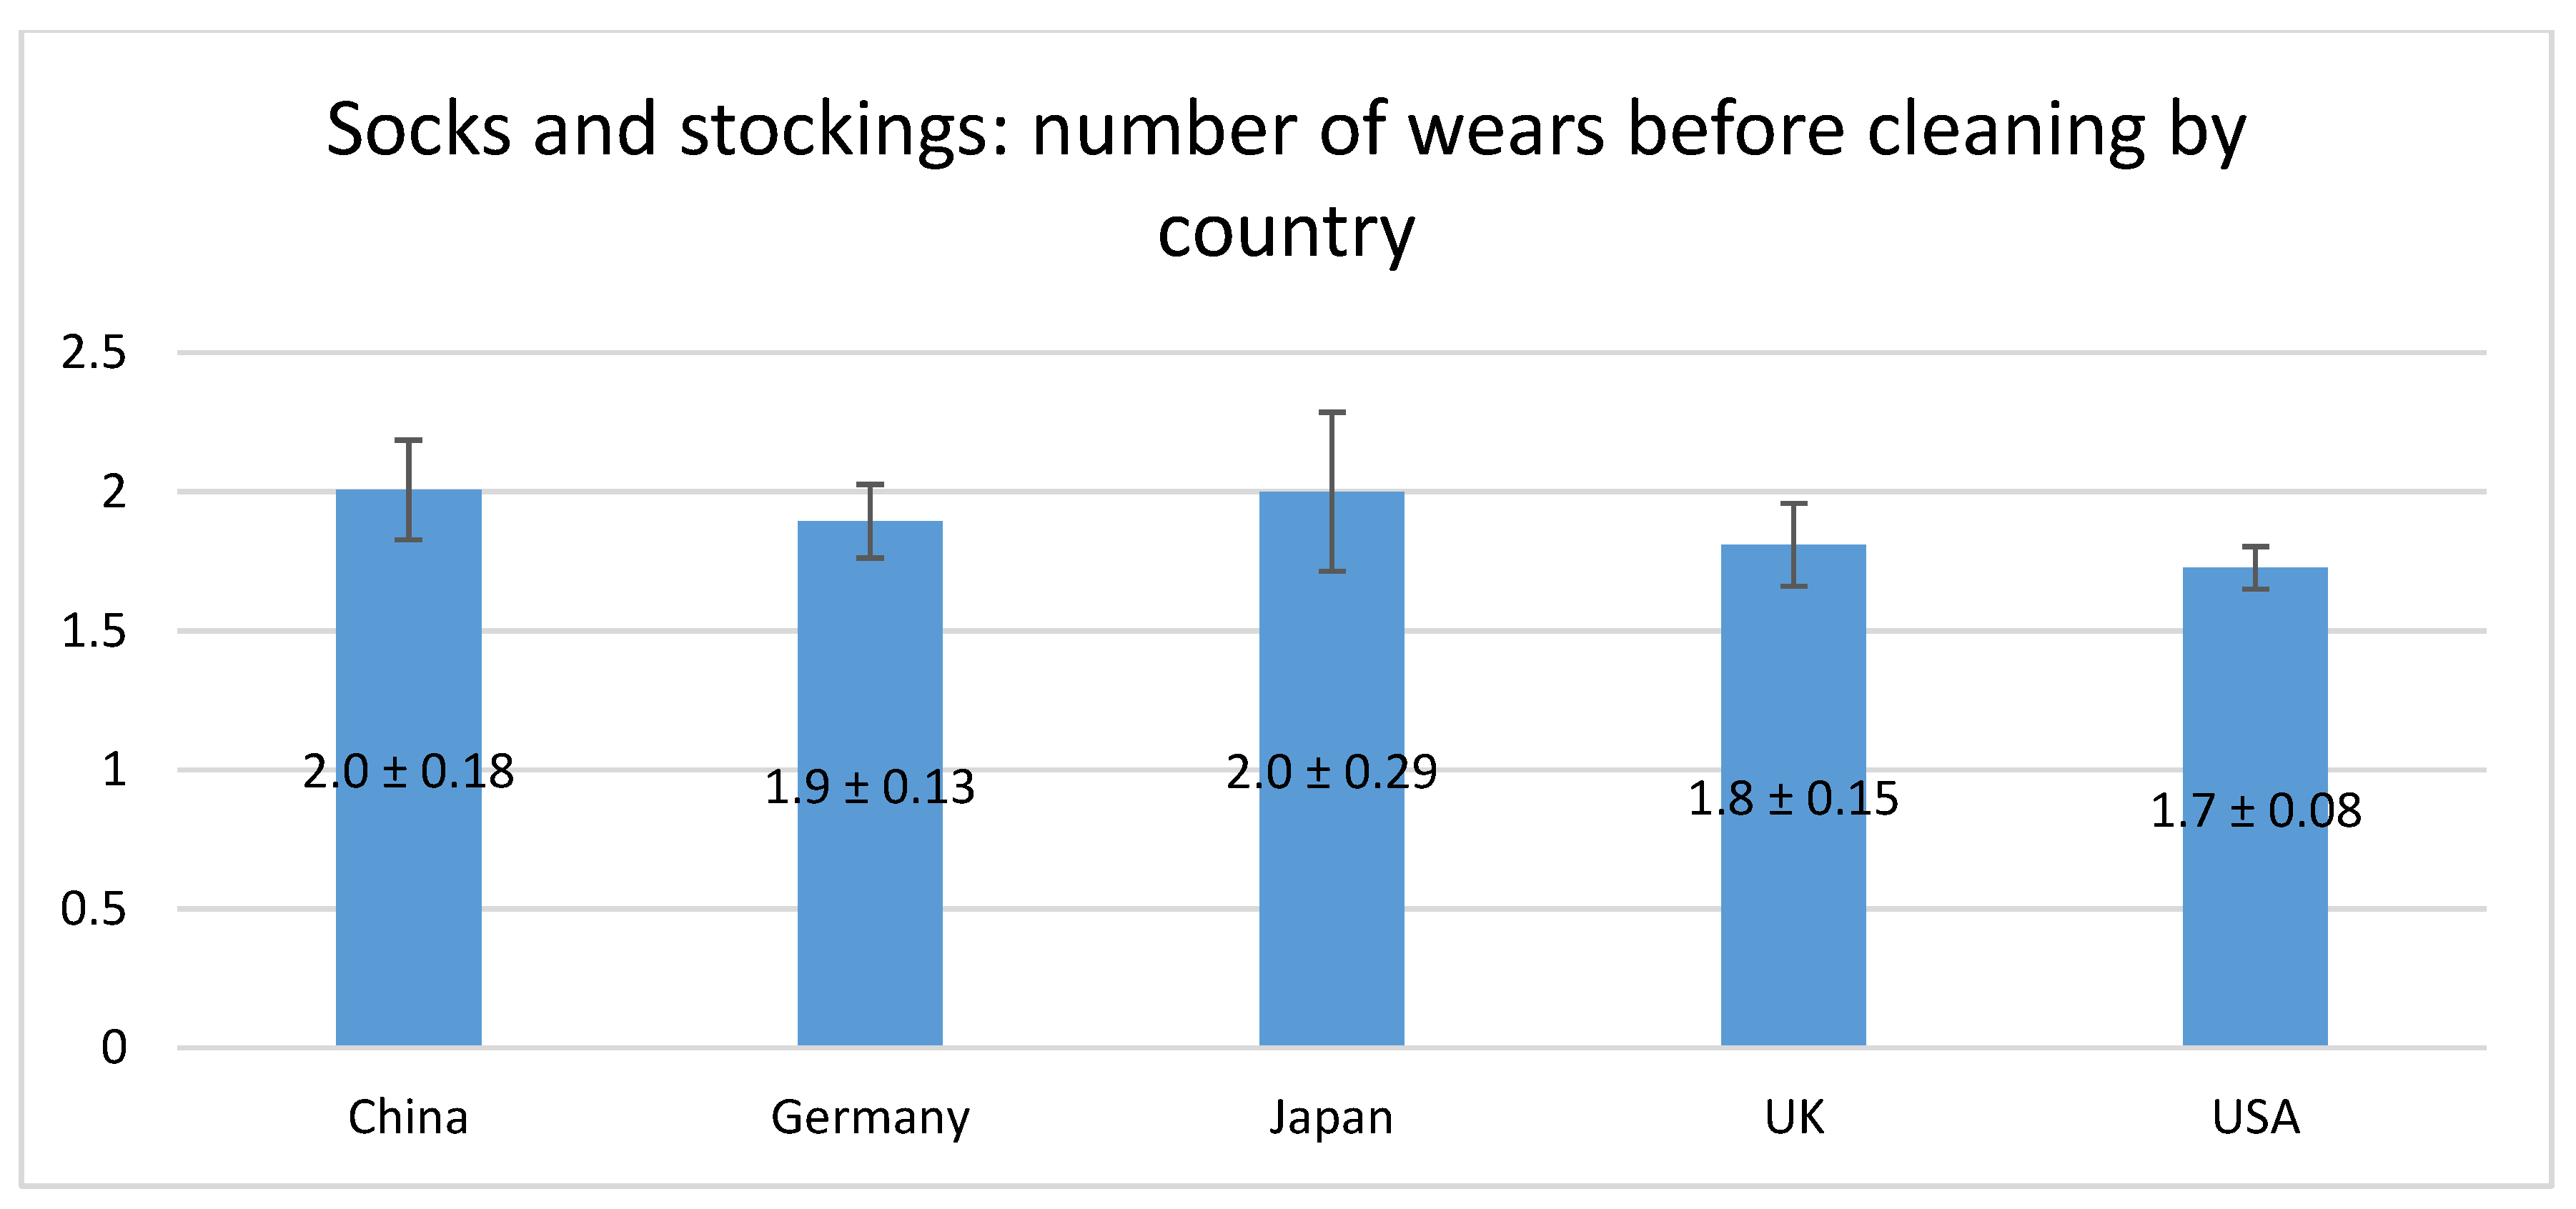
| Total | China | 2.0 | 1.0 | 3.9 | 1729 | |
| Germany | 1.9 | 1.0 | 3.0 | 1896 | ||
| Japan | 2.1 | 1.0 | 6.3 | 1610 | ||
| UK | 1.8 | 1.0 | 3.0 | 1615 | ||
| USA | 1.7 | 1.0 | 1.7 | 1733 | ||
| Total | 1.9 | 1.0 | 3.9 | 8583 |
| Web Sources 1 | Clothing Collected in Textile Waste Project [86] | Average Used in Analysis | |
|---|---|---|---|
| Formal wear | 1.163 | 0.923 | 1.0 |
| T-shirts | 0.218 | 0.186 | 0.2 |
| Socks/stockings | 0.081 | 0.058 | 0.07 |
| Category | Program | Energy kwh/kg Laundry | Water litres/kg Laundry |
|---|---|---|---|
| Cotton | Cotton 30 °C | 0.092 | 10.1 |
| Wool | Wool 30 °C | 0.090 | 19.6 |
| Synth. | Mixed fabrics 30 °C | 0.086 | 13.1 |
| Reg. cell. | Mixed fabrics 30 °C | 0.086 | 13.1 |
| China | Average eco-labelling of machines | 0.088 | 12.8 |
| Germany | Cotton ½ load 40 °C | 0.165 | 13.2 |
| Japan | Cotton 20 °C | 0.051 | 9.0 |
| UK | Cotton ½ load 40 °C | 0.165 | 13.2 |
| US | Average with and without energy label | 0.183 | 9.8 |
| Category | Use Values |
|---|---|
| Energy, PERC kwh/kg | 0.390 |
| Energy, wet cleaning kwh/kg | 0.175 |
| Water in PERC cleaning, litres/kg | 0.007 |
| Water in wet cleaning, litres/kg | 22.91 |
| Category | Use Values |
|---|---|
| Condenser type clothes dryer with water heat exchanger, litres/kg laundry | 10.75 |
| Condenser/combi dryer energy per cycle kwh/kg laundry | 1.112 |
| Vented dryer energy use, kwh/kg laundry | 0.64 |
| Energy use in line-drying, heated room kwh/kg laundry | 0.34 |
| Type of Detergent | Emissions [g CO2-eq/Wash Cycle] |
|---|---|
| Tablets | 170 |
| Powder | 84 |
| Liquid | 90 |
| Capsule | 110 |
| Property | Category | Cotton | Wool | Synth. | Reg. Cell. | CN | DE | JP | UK | US |
|---|---|---|---|---|---|---|---|---|---|---|
| Detergent types in machine wash | Powder | 30% | 25% | 28% | 22% | 31% | 45% | 27% | 31% | 19% |
| Liquid | 59% | 65% | 64% | 71% | 68% | 34% | 71% | 53% | 67% | |
| Tablet/capsule/pods | 10% | 10% | 7% | 6% | 1% | 19% | 2% | 15% | 13% | |
| None | 1% | 0% | 0% | 0% | 1% | 2% | 0% | 0% | 1% | |
| GHG emissions of detergents in machine wash [25] | [g CO2-eq/wash cycle] | 92.9 | 93.7 | 92.0 | 91.9 | 87.9 | 95.4 | 89.4 | 95.5 | 94.6 |
| Detergent types in hand wash | Powder | 22% | 37% | 13% | 16% | 25% | 26% | 10% | 33% | 22% |
| Liquid | 73% | 53% | 79% | 84% | 75% | 53% | 74% | 31% | 65% | |
| Tablet/capsule/pods | 2% | 8% | 2% | 0% | 0% | 0% | 0% | 18% | 0% | |
| None | 3% | 2% | 6% | 0% | 0% | 21% | 16% | 18% | 13% | |
| GHG emissions of detergents in hand wash [25] | [g CO2-eq/wash] | 86.6 | 90.5 | 84.6 | 89.1 | 88.5 | 69.5 | 74.6 | 80.8 | 77.0 |
| Country | gCO2/kWh | Year | Source |
|---|---|---|---|
| China | 623.6 | 2017 | [88] |
| Germany | 469 | 2018 | [88] |
| Japan | 491.6 | 2017 | [88] |
| UK | 277.3 | 2019 | [88] |
| US | 413.2 | 2017 | [87] |
| Global average | 475 | 2018 | [89] |
| Country | Number of Working Days Per Year |
|---|---|
| China | 239 |
| Germany | 230 |
| Japan | 234 |
| UK | 232 |
| USA | 246 |
| Average of the five countries | 236 |
References
- Shove, E. Comfort, Cleanliness and Convenience: The Social Organization of Normality; Berg: Oxford, UK, 2003. [Google Scholar]
- Klepp, I.G. Patched, louse-ridden, tattered: Clean and dirty clothes. Text. J. Cloth Cult. 2007, 5, 254–275. [Google Scholar] [CrossRef]
- Quantis. Measuring Fashion. Environmental Impact of the Global Apparel and Footwear Industries Study; Quantis: Lausanne, Switzerland, 2018. [Google Scholar]
- Lehmann, M.; Arici, G.; Boger, S.; Martinez-Pardo, C.; Krueger, F.; Schneider, M.; Carrière-Pradal, B.; Schou, D. Pulse of the Fashion Industry—2019 Update; Global Fashion Agenda: Copenhagen, Denmark; Boston Consulting Group: Boston, MA, USA; Sustainable Apparel Coalition: San Francisco, CA, USA, 2019. [Google Scholar]
- The Business of Fashion and McKinsey & Company. The State of Fashion 2019; The Business of Fashion: New York, NY, USA; McKinsey & Company: New York, NY, USA, 2019. [Google Scholar]
- Wiedemann, S.G.; Biggs, L.; Nebel, B.; Bauch, K.; Laitala, K.; Klepp, I.G.; Swan, P.G.; Watson, K. Environmental impacts associated with the production, use, and end-of-life of a woollen garment. Int. J. Life Cycle Assess. 2020, 25, 1486–1499. [Google Scholar] [CrossRef]
- Moazzem, S.; Daver, F.; Crossin, E.; Wang, L. Assessing environmental impact of textile supply chain using life cycle assessment methodology. J. Text. Inst. 2018, 109, 1574–1585. [Google Scholar] [CrossRef]
- Muthu, S.S. Handbook of Life Cycle Assessment (LCA) of Textiles and Clothing; Woodhead Publishing and the Textile Insitute: Cambridge, UK, 2015. [Google Scholar]
- Madsen, J.; Hartlin, B.; Perumalpillai, S.; Selby, S.; Aumônier, S. Mapping of Evidence on Sustainable Development Impacts That Occur in Life Cycles of Clothing: A Report to Defra; Environmental Resources Management Ltd: London, UK, 2007. [Google Scholar]
- Allwood, J.M.; Laursen, S.E.; Malvido de Rodríquez, C.; Bocken, N.M.P. Well Dressed? The Present and Future Sustainability of Clothing and Textiles in the United Kingdom; University of Cambridge, Institute for Manufacturing: Cambridge, UK, 2006. [Google Scholar]
- Pakula, C.; Stamminger, R. Electricity and water consumption for laundry washing by washing machine worldwide. Energy Effic. 2010, 3, 365–382. [Google Scholar] [CrossRef]
- Bain, J.; Beton, A.; Schultze, A.; Mudgal, S.; Dowling, M.; Holdway, R.; Owens, J. Reducing the Environmental Impact of Clothes Cleaning: A Research Report completed for Defra; BIO Intelligence Service in Collaboration with Giraffe and Intertek: London, UK, 2009. [Google Scholar]
- IEA. Global Energy & CO2 Status Report. The Latest Trends in Energy and Emissions in 2018; The International Energy Agency: Paris, France, 2019.
- Carbon Trust. International Carbon Flows—Clothing (CTC793); Carbon Trust: London, UK, 2011; p. 17. [Google Scholar]
- EPA. Greenhouse Gas Equivalencies Calculator. Available online: https://www.epa.gov/energy/greenhouse-gas-equivalencies-calculator (accessed on 25 June 2020).
- Gooijer, H.; Stamminger, R. Water and Energy Consumption in Domestic Laundering Worldwide—A Review. Tenside Surfactants Deterg. 2016, 53, 402–409. [Google Scholar] [CrossRef]
- Giagnorio, M.; Amelio, A.; Grüttner, H.; Tiraferri, A. Environmental impacts of detergents and benefits of their recovery in the laundering industry. J. Clean. Prod. 2017, 154, 593–601. [Google Scholar] [CrossRef]
- Golsteijn, L.; Menkveld, R.; King, H.; Schneider, C.; Schowanek, D.; Nissen, S. A compilation of life cycle studies for six household detergent product categories in Europe: The basis for product-specific A.I.S.E. Charter Advanced Sustainability Profiles. Environ. Sci. Eur. 2015, 27, 23. [Google Scholar] [CrossRef]
- Saouter, E.; van Hoof, G.; Feijtel, T.C.J.; Owens, J.W. The effect of compact formulations on the environmental profile of northern European granular laundry detergents—Part II: Life cycle assessment. Int. J. Life Cycle Assess. 2002, 7, 27–38. [Google Scholar] [CrossRef]
- Saouter, E.; van Hoof, G.; Pittinger, C.A.; Feijtel, T.C.J. The effect of compact formulations on the environmental profile of Northern European granular laundry detergents—Part I: Environmental Risk Assessment. Int. J. Life Cycle Assess. 2001, 6, 363–372. [Google Scholar] [CrossRef]
- Greenpeace. Dirty Laundry: Reloaded; Greenpeace: Amsterdam, The Netherlands, 2012; p. 48. [Google Scholar]
- Henry, B.; Laitala, K.; Klepp, I.G. Microfibres from apparel and home textiles: Prospects for including microplastics in environmental sustainability assessment. Sci. Total Environ. 2019, 652, 483–494. [Google Scholar] [CrossRef]
- Schöpel, B.; Stamminger, R. A Comprehensive Literature Study on Microfibres from Washing Machines. Tenside Surfactants Deterg. 2019, 56, 94–104. [Google Scholar] [CrossRef]
- Yasin, S.; Behary, N.; Rovero, G.; Kumar, V. Statistical analysis of use-phase energy consumption of textile products. Int. J. Life Cycle Assess. 2016. [Google Scholar] [CrossRef]
- Shahmohammadi, S.; Steinmann, Z.; Clavreul, J.; Hendrickx, H.; King, H.; Huijbregts, M.A.J. Quantifying drivers of variability in life cycle greenhouse gas emissions of consumer products—A case study on laundry washing in Europe. Int. J. Life Cycle Assess. 2018, 23, 1940–1949. [Google Scholar] [CrossRef]
- Union of Concerned Scientists. Environmental Impacts of Renewable Energy Technologies. Available online: https://www.ucsusa.org/resources/environmental-impacts-renewable-energy-technologies (accessed on 21 October 2019).
- Laitala, K.; Klepp, I.G.; Henry, B. Does Use Matter? Comparison of Environmental Impacts of Clothing Based on Fiber Type. Sustainability 2018, 10, 2524. [Google Scholar] [CrossRef]
- Laitala, K.; Boks, C.; Klepp, I.G. Potential for environmental improvements in laundering. Int. J. Consum. Stud. 2011, 35, 254–264. [Google Scholar] [CrossRef]
- Laitala, K.; Klepp, I.G.; Henry, B. Global laundering practices. Alternatives to machine washing. H&PC Today Househ. Pers. Care Today 2017, 12, 10–16. [Google Scholar]
- Sinsheimer, P.; Grout, C.; Namkoong, A.; Gottlieb, R.; Latif, A. The viability of professional wet cleaning as a pollution prevention alternative to perchloroethylene dry cleaning. J. Air Waste Manag. Assoc. 2007, 57, 172–178. [Google Scholar] [CrossRef]
- Kim, J.; Park, Y.; Yun, C.; Park, C.H. Comparison of environmental and economic impacts caused by the washing machine operation of various regions. Energy Effic. 2015, 8, 905–918. [Google Scholar] [CrossRef]
- Onasch, J. A feasibility and cost comparison of perchloroethylene dry cleaning to professional wet cleaning: Case study of Silver Hanger Cleaners, Bellingham, Massachusetts. J. Clean. Prod. 2011, 19, 477–482. [Google Scholar] [CrossRef]
- TURI. Assessment of Alternatives to Perchloroethylene for the Dry Cleaning Industry; The Toxics Use Reduction Institute (TURI) at the University of Massachusetts Lowell: Lowell, MA, USA, 2012; p. 64. [Google Scholar]
- Schmitz, A.; Stamminger, R. Usage behaviour and related energy consumption of European consumers for washing and drying. Energy Effic. 2014, 7, 937–954. [Google Scholar] [CrossRef]
- Zimmermann, J.P.; Evans, M.; Griggs, J.; King, N.; Harding, L.; Roberts, P.; Evans, C. Household Electricity Survey—A Study of Domestic Electrical Product Usage; Intertek: Milton Keynes, UK, 2012; p. 600. [Google Scholar]
- European Commission. Directive 2009/125/EC of the European Parliament and of the Council of 21 October 2009 Establishing a Framework for the Setting of Ecodesign Requirements for Energy-Related Products; European Parliament and the Council of the European Union: Brussels, Belgium, 2009. [Google Scholar]
- European Commission. Regulation (EU) 2017/1369 of the European Parliament and of the Council of 4 July 2017 Setting a Framework for Energy Labelling and Repealing Directive 2010/30/EU; European Parliament and the Council of the European Union: Brussels, Belgium, 2017. [Google Scholar]
- Energy Star. ENERGY STAR Program Requirements Product Specification for Clothes Washers. Eligibility Criteria Version 8.0; U.S. Environmental Protection Agency: Washington, DC, USA; U.S. Department of Energy: Washington, DC, USA, 2018.
- European Commission. Regulation (EC) No 1907/2006 of the European Parliament and of the Council of 18 December 2006 Concerning the Registration, Evaluation, Authorisation and Restriction of Chemicals (REACH), Establishing a European Chemicals Agency, Amending Directive 1999/45/EC and Repealing Council Regulation (EEC) No 793/93 and Commission Regulation (EC) No 1488/94 as well as Council Directive 76/769/EEC and Commission Directives 91/155/EEC, 93/67/EEC, 93/105/EC and 2000/21/EC; European Parliament and the Council of the European Union: Brussels, Belgium, 2006. [Google Scholar]
- Frank, R. Lautenberg Chemical Safety for the 21st Century Act. In H.R.2576; US Environmental Protection Agency: Washington, DC, USA, 2016. [Google Scholar]
- European Commission. Regulation (EC) No 66/2010 of the European Parliament and of the Council of 25 November 2009 on the EU Ecolabel; European Parliament and the Council of the European Union: Brussels, Belgium, 2010. [Google Scholar]
- Spencer, J.; Lilley, D.; Porter, S. The opportunities that different cultural contexts create for sustainable design: A laundry care example. J. Clean. Prod. 2015, 107, 279–290. [Google Scholar] [CrossRef]
- Spencer, J.; Lilley, D.; Porter, S. The implications of cultural differences in laundry behaviours for design for sustainable behaviour: A case study between the UK, India and Brazil. Int. J. Sustain. Eng. 2015, 8, 196–205. [Google Scholar] [CrossRef][Green Version]
- Laitala, K.; Klepp, I.G.; Boks, C. Changing laundry habits in Norway. Int. J. Consum. Stud. 2012, 36, 228–237. [Google Scholar] [CrossRef]
- Klepp, I.G.; Buck, M.; Laitala, K.; Kjeldsberg, M. What’s the problem? Odor-control and the smell of sweat in sportswear. Fash. Pract. J. Des. Creat. Process. Fash. Ind. 2016, 8, 296–317. [Google Scholar] [CrossRef]
- Laitala, K.; Klepp, I.G. Wool wash: Technical performance and consumer habits. Tenside Surfactants Deterg. 2016, 53, 458–469. [Google Scholar] [CrossRef]
- Laitala, K.; Klepp, I.G.; Henry, B. Use phase of wool apparel: A literature review for improving LCA. In Proceedings of the Product Lifetimes and The Environment—PLATE 2017, Delft, The Netherlands, 9 November 2017; pp. 202–207. [Google Scholar]
- McQueen, R.; Moran, L.J.; Cunningham, C.; Hooper, P.M.; Wakefield, K.A.M. The impact of odour on laundering behaviour: An exploratory study. Int. J. Fash. Des. Technol. Educ. 2019. [Google Scholar] [CrossRef]
- Laing, R.M. Natural fibres in next-to-skin textiles: Current perspectives on human body odour. SN Appl. Sci. 2019, 1, 1329. [Google Scholar] [CrossRef]
- McQueen, R.; Vaezafshar, S. Odor in textiles: A review of evaluation methods, fabric characteristics, and odor control technologies. Text. Res. J. 2019. [Google Scholar] [CrossRef]
- Mukhtar Abdul-Bari, M.; McQueen, R.; Paulina de la Mata, A.; Batcheller, J.C.; Harynuk, J.J. Retention and release of odorants in cotton and polyester fabrics following multiple soil/wash procedures. Text. Res. J. 2020. [Google Scholar] [CrossRef]
- Pugliese, S.; Jespersen, M.F.; Pernov, J.B.; Shenolikar, J.; Nygaard, J.; Nielsen, O.J.; Johnson, M.S. Chemical analysis and origin of the smell of line-dried laundry. Environ. Chem. 2020. [Google Scholar] [CrossRef]
- Kaufmann, J.-C. Dirty Linen: Couples and Their Laundry; Middlesex University Press: London, UK, 1998. [Google Scholar]
- Anderson, B. Laundry, energy and time: Insights from 20 years of time-use diary data in the United Kingdom. Energy Res. Soc. Sci. 2016, 22, 125–136. [Google Scholar] [CrossRef]
- Jack, T. Nobody was dirty: Intervening in inconspicuous consumption of laundry routines. J. Consum. Cult. 2013, 13, 406–421. [Google Scholar] [CrossRef]
- Alborzi, F.; Schmitz, A.; Stamminger, R. Long wash cycle duration as a potential for saving energy in laundry washing. Energy Effic. 2016. [Google Scholar] [CrossRef]
- Ellmer, K.; Fuchs, M.; Bauer, U.; Schneider, T.; Thamsen, P.U.; Morgenthal, T.; Villwock, J.; Hanau, A. Research project Simulation Wäschepflege—Recommendations for improving resource efficiency in the laundry process in households in Germany. J. Clean. Prod. 2015. [Google Scholar] [CrossRef]
- Hustvedt, G.; Ahn, M.; Emmel, J. The adoption of sustainable laundry technologies by US consumers. Int. J. Consum. Stud. 2013, 37, 291–298. [Google Scholar] [CrossRef]
- Hustvedt, G. Review of laundry energy efficiency studies conducted by the US Department of Energy. Int. J. Consum. Stud. 2011, 35, 228–236. [Google Scholar] [CrossRef]
- Golden, J.S.; Subramanian, V.; Irizarri, G.M.A.U.; White, P.; Meier, F. Energy and carbon impact from residential laundry in the United States. J. Integr. Environ. Sci. 2010, 7, 53–73. [Google Scholar] [CrossRef]
- Pakula, C.; Stamminger, R. Comparison of resources used for laundry washing worldwide. In Proceedings of the WFK 44th Int. Detergency Conference, Düsseldorf, Germany, 12–14 May 2009; pp. 68–73. [Google Scholar]
- Paloviita, A.; Järvi, P. Environmental value chain management of laundry detergents in the use phase. Int. J. Consum. Stud. 2008, 32, 607–612. [Google Scholar] [CrossRef]
- Fijan, S.; Fijan, R.; Sostar-Turk, S. Implementing sustainable laundering procedures for textiles in a commercial laundry and thus decreasing wastewater burden. J. Clean. Prod. 2008, 16, 1258–1263. [Google Scholar] [CrossRef]
- European Commission. International Reference Life Cycle Data System (ILCD) Handbook—General Guide for Life Cycle Assessment—Detailed Guidance; European Commission, Joint Research Centre, Institute for Environment and Sustainability, Publications Office of the European Union: Luxemburg, 2010. [Google Scholar]
- European Commission. Legislative Proposal on Substantiating Green Claims—Environmental Performance of Products & Businesses—Substantiating Claims; DG Environment, Unit B1—Sustainable Production, Products and Consumption, European Commission: Brussels, Belgium, 2020. [Google Scholar]
- Pesnel, S.; Payet, J. Product Environmental Footprint Category Rules (PEFCR)—T-Shirts; CYCLECO: Amberieu en Bugey, France, 2019; p. 130. [Google Scholar]
- Van der Velden, N.M.; Patel, M.K.; Vogtländer, J.G. LCA benchmarking study on textiles made of cotton, polyester, nylon, acryl, or elastane. Int. J. Life Cycle Assess. 2014, 19, 331–356. [Google Scholar] [CrossRef]
- Fletcher, K.; Klepp, I.G. Opening Up the Wardrobe: A Methods Book; Novus: Oslo, Norway, 2017; p. 195. [Google Scholar]
- Klepp, I.G.; Bjerck, M. A methodological approach to the materiality of clothing: Wardrobe Studies. Int. J. Soc. Res. Methodol. 2014, 17, 373–386. [Google Scholar] [CrossRef]
- Klepp, I.G.; Laitala, K.; Wiedemann, S. Clothing lifetimes: What should be measured and how. Sustainability 2020, 12, 6219. [Google Scholar] [CrossRef]
- Sferrazza, F. How the Internet Is Empowering China’s Older Generation. Available online: https://www.sixthtone.com/news/1551/how-the-internet-is-empowering-chinas-older-generation (accessed on 19 April 2020).
- NTP. Report on Carcinogens: Trichloroethylene, 14th ed.; US Department of Health and Human Services, Public Health Service: Research Triangle Park, NC, USA, 2016.
- Roetzel, B. Gentleman: The Ultimate Companion to the Elegant Man; Ullmann Publishing: Potsdam, Germany, 2016. [Google Scholar]
- Keoleian, G.A.; Blackler, C.E.; Denbow, R.; Polk, R. Comparative assessment of wet and dry garment cleaning: Part 1. Environmental and human health assessment. J. Clean. Prod. 1997, 5, 279–289. [Google Scholar] [CrossRef]
- Keoleian, G.A.; Blackler, C.E.; Nemsick, K.; Levine, W. Comparative assessment of wet and dry garment cleaning: Part 2. Performance, economic and regulatory assessment. J. Clean. Prod. 1998, 6, 23–36. [Google Scholar] [CrossRef]
- Troynikov, O.; Watson, C.; Jadhav, A.; Nawaz, N.; Kettlewell, R. Towards sustainable and safe apparel cleaning methods: A review. J. Environ. Manag. 2016, 182, 252–264. [Google Scholar] [CrossRef]
- Blackler, C.; Denbow, R.; Levine, W.; Nemsick, K.; Polk, R. A Comparative Analysis of Perc Dry Cleaning and an Alternative Wet Cleaning Process; University of Michigan: Ann Arbor, MI, USA, 1995. [Google Scholar]
- De Falco, F.; Di Pace, E.; Cocca, M.; Avella, M. The contribution of washing processes of synthetic clothes to microplastic pollution. Sci. Rep. 2019, 9, 6633. [Google Scholar] [CrossRef]
- Kelly, M.R.; Lant, N.J.; Kurr, M.; Burgess, J.G. Importance of Water-Volume on the Release of Microplastic Fibers from Laundry. Environ. Sci. Technol. 2019, 53, 11735–11744. [Google Scholar] [CrossRef]
- Zambrano, M.C.; Pawlak, J.J.; Daystar, J.; Ankeny, M.; Cheng, J.J.; Venditti, R.A. Microfibers generated from the laundering of cotton, rayon and polyester based fabrics and their aquatic biodegradation. Mar. Pollut. Bull. 2019, 142, 394–407. [Google Scholar] [CrossRef]
- Boyano, A.; Espinosa, N.; Villanueva, A. Rescaling the energy label for washing machines: An opportunity to bring technology development and consumer behaviour closer together. Energy Effic. 2020, 13, 51–67. [Google Scholar] [CrossRef]
- Steinberger, J.; Friot, D.; Jolliet, O.; Erkman, S. A spatially explicit life cycle inventory of the global textile chain. Int. J. Life Cycle Assess. 2009, 14, 443–455. [Google Scholar] [CrossRef]
- Yamaguchi, Y.; Seii, E.; Itagaki, M.; Nagayama, M. Evaluation of domestic washing in Japan using life cycle assessment (LCA). Int. J. Consum. Stud. 2011, 35, 243–253. [Google Scholar] [CrossRef]
- European Commission. Commission Regulation (EU) No 1015/2010 of 10 November 2010 Implementing Directive 2009/125/EC of the European Parliament and of the Council with Regard to Ecodesign Requirements for Household Washing Machines. Off. J. Eur. Union 2010, 1015/2010, 21–30. [Google Scholar]
- Stamminger, R.; Schmitz, A. Washing Machines in Europe—Detailed Assessment of Consumption and Performance. Tenside Surfactants Deterg. 2016, 53, 70–86. [Google Scholar] [CrossRef]
- Laitala, K. Clothing Consumption—An Interdisciplinary Approach to Design for Environmental Improvement; Norwegian University of Science and Technology: Trondheim, Norway, 2014. [Google Scholar]
- Transparency, C. Brown to Green: The G20 Transition to a Low-Carbon Economy; Climate Transparency, c/o Humboldt-Viadrina Governance Platform: Berlin, Germany, 2018. [Google Scholar]
- Carbon Footprint. Country Specific Electricity Grid Greenhouse Gas Emission Factors; Carbon Footprint: Hampshire, UK, 2019. [Google Scholar]
- IEA. Global Energy & CO2 Status Report 2019; International Energy Agency: Paris, France, 2019.


| Total | China | Germany | Japan | UK | USA | |
|---|---|---|---|---|---|---|
| Number of respondents | N = 1111 | 230 | 224 | 224 | 213 | 220 |
| Gender distribution | ||||||
| Men | 50.5% | 54% | 51% | 51% | 47% | 49% |
| Women | 49.5% | 46% | 49% | 49% | 53% | 51% |
| Age groups | ||||||
| 18–29 years | 25% | 41% | 19% | 19% | 22% | 21% |
| 30–49 years | 47% | 49% | 45% | 50% | 52% | 44% |
| 50–64 years | 28% | 10% | 36% | 31% | 26% | 35% |
| Garment data | ||||||
| Total number of registered garments | 53,461 | 10,595 | 11,705 | 12,022 | 9384 | 9755 |
| Formal wear (suits, trousers and skirts) | 6080 | 1495 | 897 | 1660 | 958 | 1070 |
| T-shirts/polo shirts/singlets/tanks | 9441 | 1326 | 2346 | 2083 | 1624 | 2062 |
| Pairs of socks/stockings | 9917 | 1814 | 2177 | 2024 | 1927 | 1975 |
| China | Germany | Japan | UK | USA | Total | |
|---|---|---|---|---|---|---|
| Number of informants | 29 | 34 | 25 | 30 | 26 | 144 |
| Number of registered laundry activities | 715 | 613 | 827 | 604 | 494 | 3253 |
| Average number of registered activities per household | 24.7 | 18.0 | 33.1 | 20.1 | 19.0 | 22.6 |
| Gender distribution | ||||||
| Men | 48% | 47% | 40% | 47% | 35% | 44% |
| Women | 52% | 53% | 60% | 53% | 65% | 56% |
| Age group | ||||||
| 18–29 years | 28% | 6% | 12% | 10% | 8% | 13% |
| 30–49 years | 72% | 38% | 60% | 57% | 50% | 55% |
| 50–64 years | 0% | 56% | 28% | 33% | 42% | 33% |
| Average household size in number of persons | 4.0 | 2.2 | 3.0 | 3.2 | 2.9 | 3.1 |
| China | Germany | Japan | UK | USA | Total | ||
| Top-loading washing machine | Own | 28% | 18% | 64% | 8% | 65% | 46% |
| Use | 25% | 16% | 63% | 6% | 60% | 43% | |
| Front-loading washing machine | Own | 35% | 71% | 12% | 69% | 23% | 33% |
| Use | 29% | 62% | 11% | 64% | 17% | 28% | |
| Combination washer–dryer | Own | 29% | 12% | 21% | 18% | 5% | 15% |
| Use | 27% | 6% | 20% | 16% | 3% | 12% | |
| Twin tub washing machine | Own | 13% | 5% | 4% | 2% | 6% | 7% |
| Use | 11% | 2% | 3% | 1% | 3% | 4% | |
| At-home dry cleaning | Own | 10% | 3% | 2% | 5% | 4% | 5% |
| Use | 8% | 1% | 2% | 2% | 2% | 3% | |
| Shared washing machine (laundromat) | Use | 6% | 8% | 10% | 8% | 13% | 10% |
| Hand wash some laundry | Use | 96% | 55% | 65% | 52% | 54% | 64% |
| Tumble dryer | Own | 14% | 27% | 6% | 27% | 60% | 35% |
| Use | 8% | 24% | 5% | 21% | 54% | 30% | |
| Shared dryer (laundromat) | Use | 7% | 5% | 10% | 4% | 10% | 8% |
| Line drying outdoors | Own | 52% | 25% | 39% | 32% | 13% | 28% |
| Use | 51% | 20% | 38% | 27% | 10% | 26% | |
| Line drying indoors | Own | 56% | 40% | 35% | 39% | 21% | 34% |
| Use | 53% | 37% | 34% | 38% | 19% | 32% |
| China | Germany | Japan | UK | USA |
|---|---|---|---|---|
 |  |  |  |  |
 |  |  |  | |
 |
| China | Germany | Japan | UK | USA | Total | |
|---|---|---|---|---|---|---|
| Cleaning activities N | 444 | 330 | 494 | 359 | 275 | 1902 |
| Machine Wash | 40% | 81% | 71% | 83% | 74% | 68% |
| Hand Wash | 37% | 11% | 21% | 10% | 13% | 20% |
| Dry cleaning | 23% | 8% | 8% | 7% | 12% | 12% |
| Drying activities N | 271 | 283 | 333 | 245 | 219 | 1351 |
| Dried Clothes in a Tumble Dryer | 26% | 26% | 8% | 42% | 73% | 32% |
| Dried clothes on a line: | ||||||
| Outdoors | 39% | 1% | 56% | 21% | 1% | 26% |
| Indoors in a non-heated room | 25% | 14% | 18% | 7% | 2% | 14% |
| Indoors in a heated room | 10% | 57% | 17% | 30% | 21% | 27% |
| Washing Machine Details | China | Germany | Japan | UK | USA | Total |
|---|---|---|---|---|---|---|
| Maximum capacity of washing machine (mean kg), diary data | 7.7 | 6.5 | 7.2 | 6.7 | (7.6) * | 7.2 |
| Average Maximum Spinning Speed of Washing Machine (rpm), diary data | 929 | 1365 | (456) * | 1266 | (731) * | 1069 |
| Average age of top-loading washing machined, survey data | 3.1 | 5.5 | 6.8 | 2.1 | 5.5 | 5.5 |
| Average age of front-loading washing machined, survey data | 3.1 | 5.2 | 4.9 | 4.6 | 5.0 | 4.6 |
| Average age of combination washer–dryer, survey data | 2.1 | 2.9 | 4.4 | 3.7 | 2.6 | 3.1 |
| Average age of twin-tub washing machine, survey data | 2.8 | - | 9.4 | - | 3.6 | 4.2 |
| Average Age of Washing Machine (Years), diary data | 3.1 | 4.9 | 9.1 | 4.5 | 6.0 | 5.4 |
| Average Temperature (Celsius), diary data | 31.1 | 42.9 | 20.2 | 42.3 | 25.5 | 33.5 |
| Median Temperature (Celsius), diary data | 35 | 40 | 15 | 40 | 22 | 38 |
| Pre-wash used | 20% | 5% | 4% | 4% | 6% | 7% |
| Extra rinse/wash/spin | 26% | 7% | 1% | 6% | 6% | 8% |
| Time Taken to complete cycle–average minutes | 55.5 | 82.7 | 40.8 | 81.2 | 36.0 | 59.7 |
| Time Taken to complete cycle–Median minutes | 45 | 60 | 35 | 60 | 31 | 45 |
| Average Spin Speed (rpm) | 955.1 | 1152.1 | 474.0 | 1117.0 | 585.3 | 932.7 |
| Median Spin Speed (rpm) | 800 | 1200 | 90 | 1200 | 615 | 1000 |
| Full load | 22% | 68% | 56% | 67% | 64% | 58% |
| Half load | 57% | 25% | 34% | 28% | 29% | 33% |
| A few small items | 21% | 7% | 10% | 5% | 6% | 9% |
| Average filling grade | 55% | 82% | 75% | 82% | 80% | 76% |
| Hand Wash Details | China | Germany | Japan | UK | USA | Total |
|---|---|---|---|---|---|---|
| Average Temperature (Celsius) | 30.4 | 31.6 | 31.8 | 37.4 | 31.5 | 30.4 |
| Rinse water temp.—hot | 5% | 4% | 0% | 0% | 9% | 4% |
| Rinse water temp.—warm | 25% | 32% | 31% | 22% | 19% | 27% |
| Rinse water temp.—lukewarm | 34% | 52% | 20% | 44% | 16% | 30% |
| Rinse water temp.—cold | 36% | 12% | 49% | 33% | 56% | 39% |
| Average water use Litres/cycle | 16.3 | 14.2 | 7.0 | 5.2 | 7.7 | 12.4 |
| Water use litres/kg laundry | 8.15 | 7.1 | 3.5 | 2.6 | 3.85 | 6.2 |
| Energy use kwh/kg laundry * | 0.189 | 0.165 | 0.081 | 0.091 | 0.089 | 0.144 |
| Dry Cleaning Details | China | Germany | Japan | UK | US | Total |
|---|---|---|---|---|---|---|
| N | 98 | 15 | 36 | 20 | 29 | 198 |
| Perchloroethylene (a.k.a. PERC or PCE) | 28% | 7% | 11% | 10% | 7% | 18% |
| Trichloroethylene (a.k.a. TCE) | 16% | 0% | 8% | 15% | 3% | 12% |
| Professional Wet Cleaning | 14% | 7% | 3% | 20% | 7% | 11% |
| D5 (a.k.a. ‘liquid silicone’ e.g., GreenEarth) | 4% | 0% | 0% | 10% | 0% | 3% |
| Hydrocarbons | 1% | 0% | 3% | 15% | 0% | 3% |
| Other | 1% | 7% | 8% | 5% | 14% | 5% |
| Don’t know | 39% | 80% | 72% | 40% | 79% | 54% |
| Tumble Dry Details | China | Germany | Japan | UK | USA | Total |
|---|---|---|---|---|---|---|
| Average Maximum Capacity of Tumble Dryer (kg) | 6.5 | 6.8 | 6.7 | 6.1 | 7.6 | 6.8 |
| Average Age of Tumble Dryer (Years) | 1.8 | 7.4 | 6.3 | 4.8 | 6.6 | 5.6 |
| Vented type | 60% | 5% | 20% | 25% | 91% | 45% |
| Condenser/washer–dryer | 40% | 95% | 80% | 75% | 9% | 55% |
| Average Time minutes | 26.4 | 108.9 | 44.0 | 84.4 | 44.3 | 61.8 |
| Median Time minutes | 10 | 115 | 30 | 60 | 41 | 45 |
| Full load | 10% | 38% | 12% | 52% | 58% | 45% |
| Half load | 54% | 55% | 41% | 45% | 37% | 44% |
| A few small items | 35% | 7% | 47% | 3% | 5% | 11% |
| Garment Category | Fibre Content | Cleaning Activities | Drying Activities | ||||||
|---|---|---|---|---|---|---|---|---|---|
| Machine Wash | Hand-Wash | Dry Clean | Clothes Dryer | Line Dried Outdoors | Line Dried in Non-Heated Room | Line Dried in Heated Room | N | ||
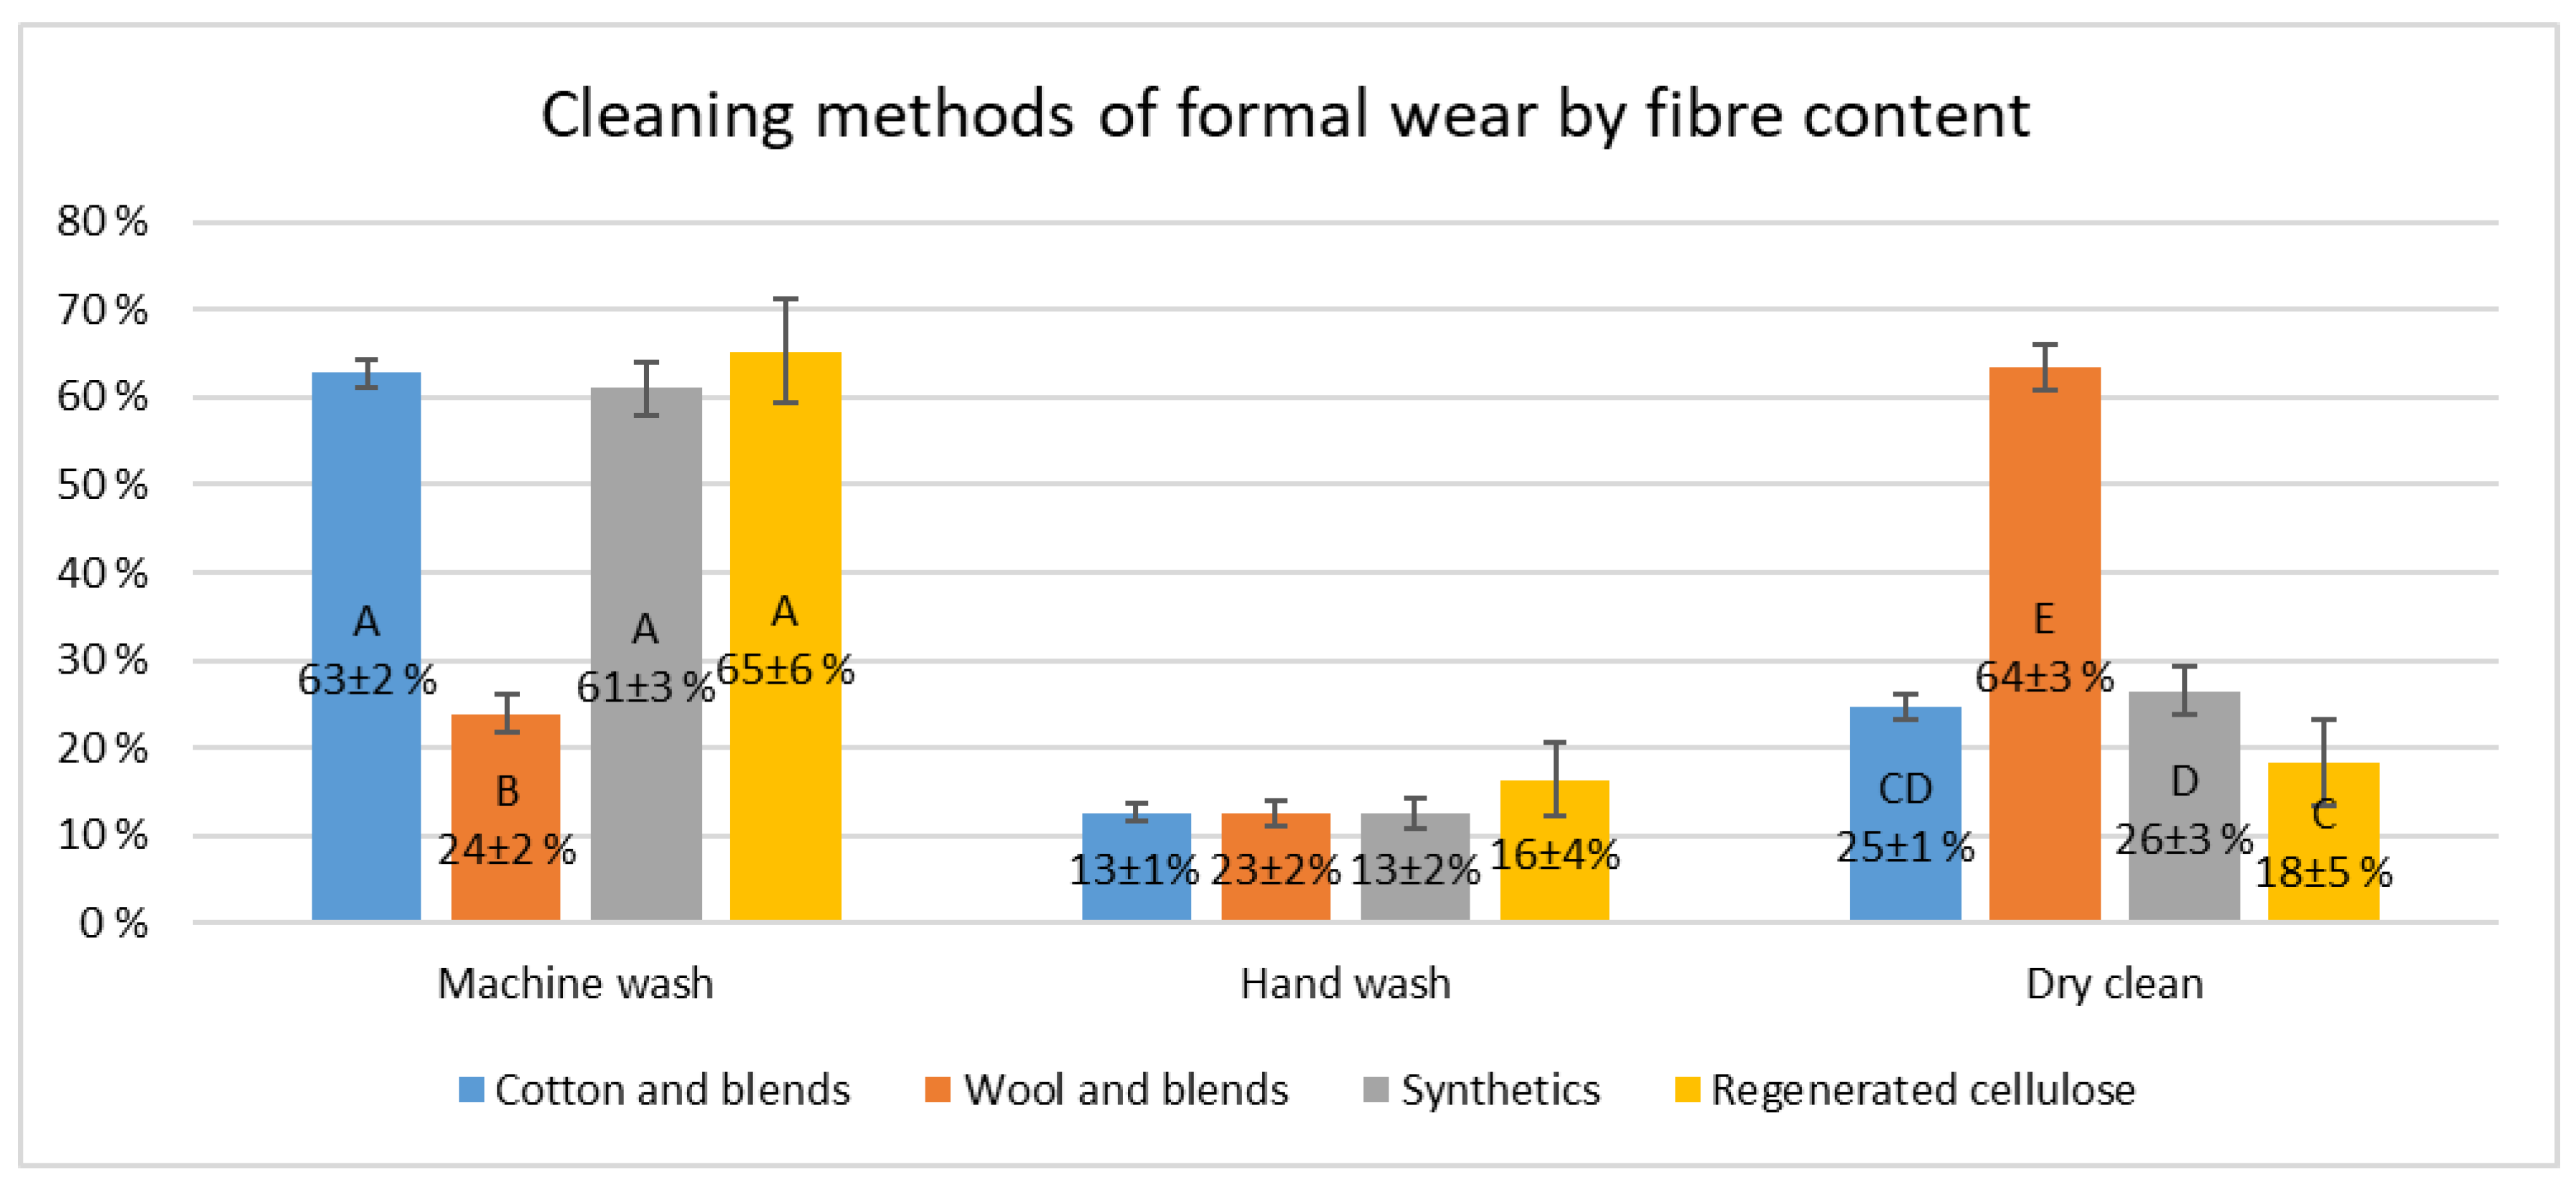
| Formal wear | Cotton and blends | 79% | 5% | 16% | 23% | 29% | 20% | 27% | 405 |
| Wool and blends | 44% | 5% | 51% | 19% | 23% | 21% | 37% | 159 | |
| Synthetics | 85% | 3% | 12% | 12% | 40% | 23% | 25% | 259 | |
| Reg. cellulose | 42% | 0% | 58% | 17% | 19% | 40% | 25% | 96 | |
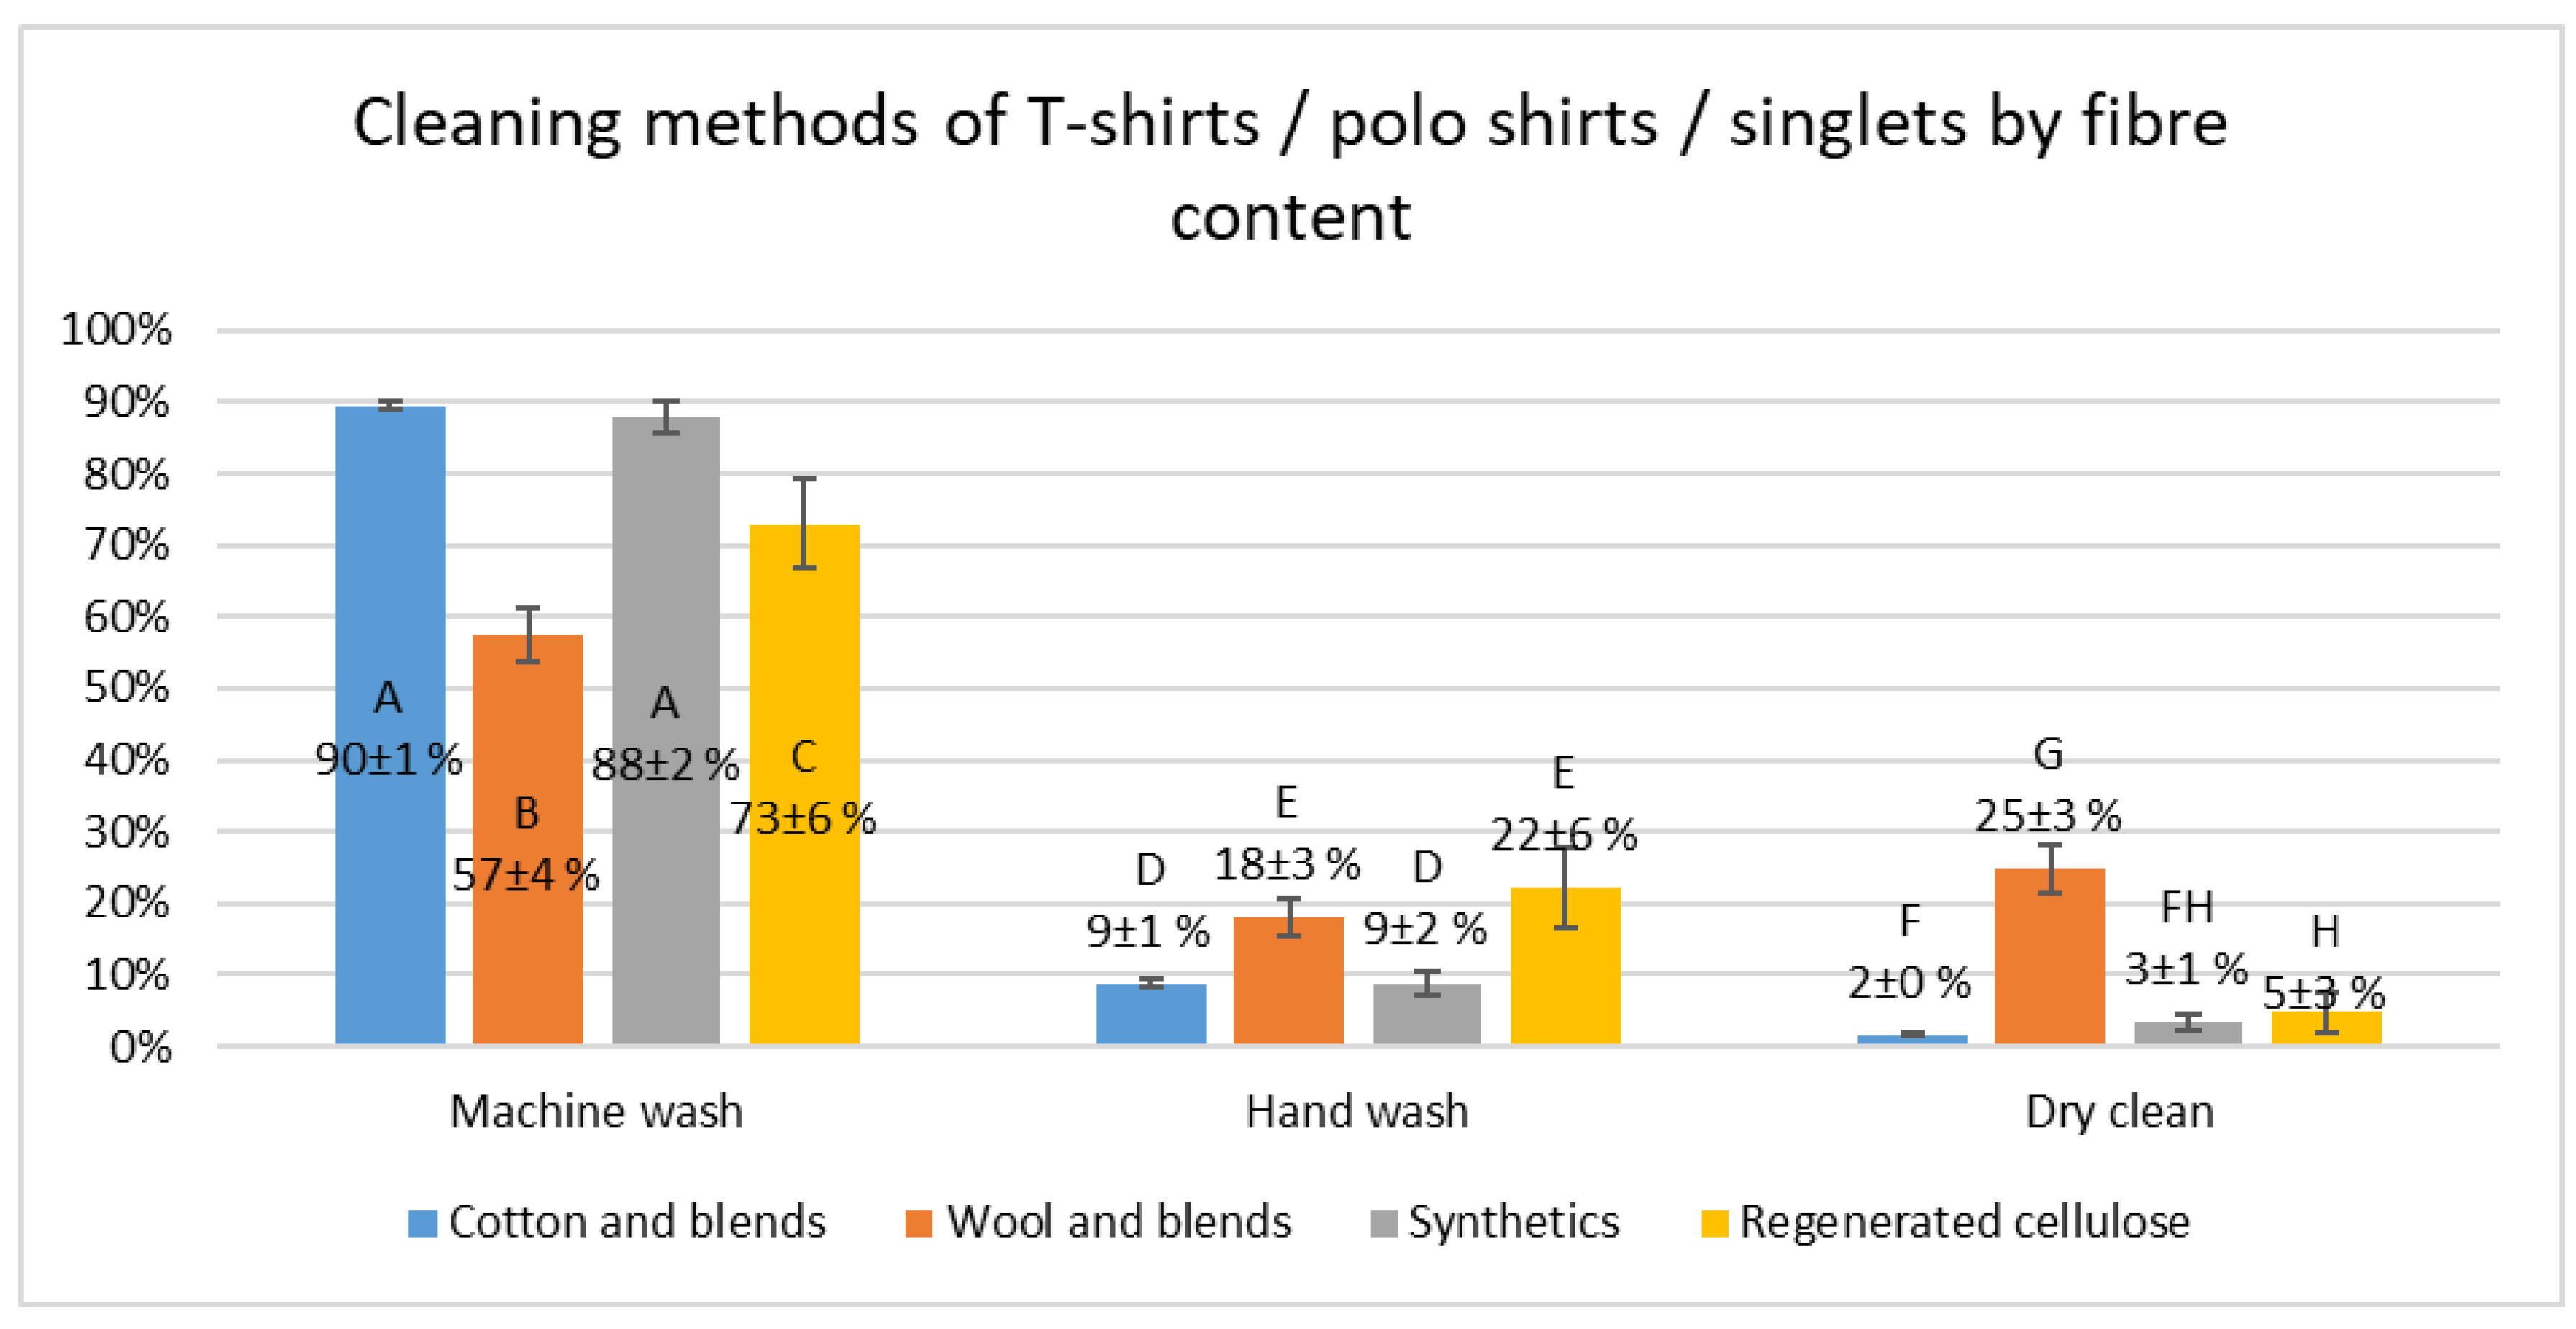
| T-shirts | Cotton and blends | 97% | 3% | 0% | 26% | 31% | 13% | 30% | 1093 |
| Wool and blends | 93% | 3% | 3% | 18% | 18% | 21% | 42% | 168 | |
| Synthetics | 99% | 1% | 0% | 22% | 38% | 17% | 24% | 638 | |
| Reg. cellulose | 95% | 3% | 2% | 26% | 27% | 26% | 21% | 249 | |
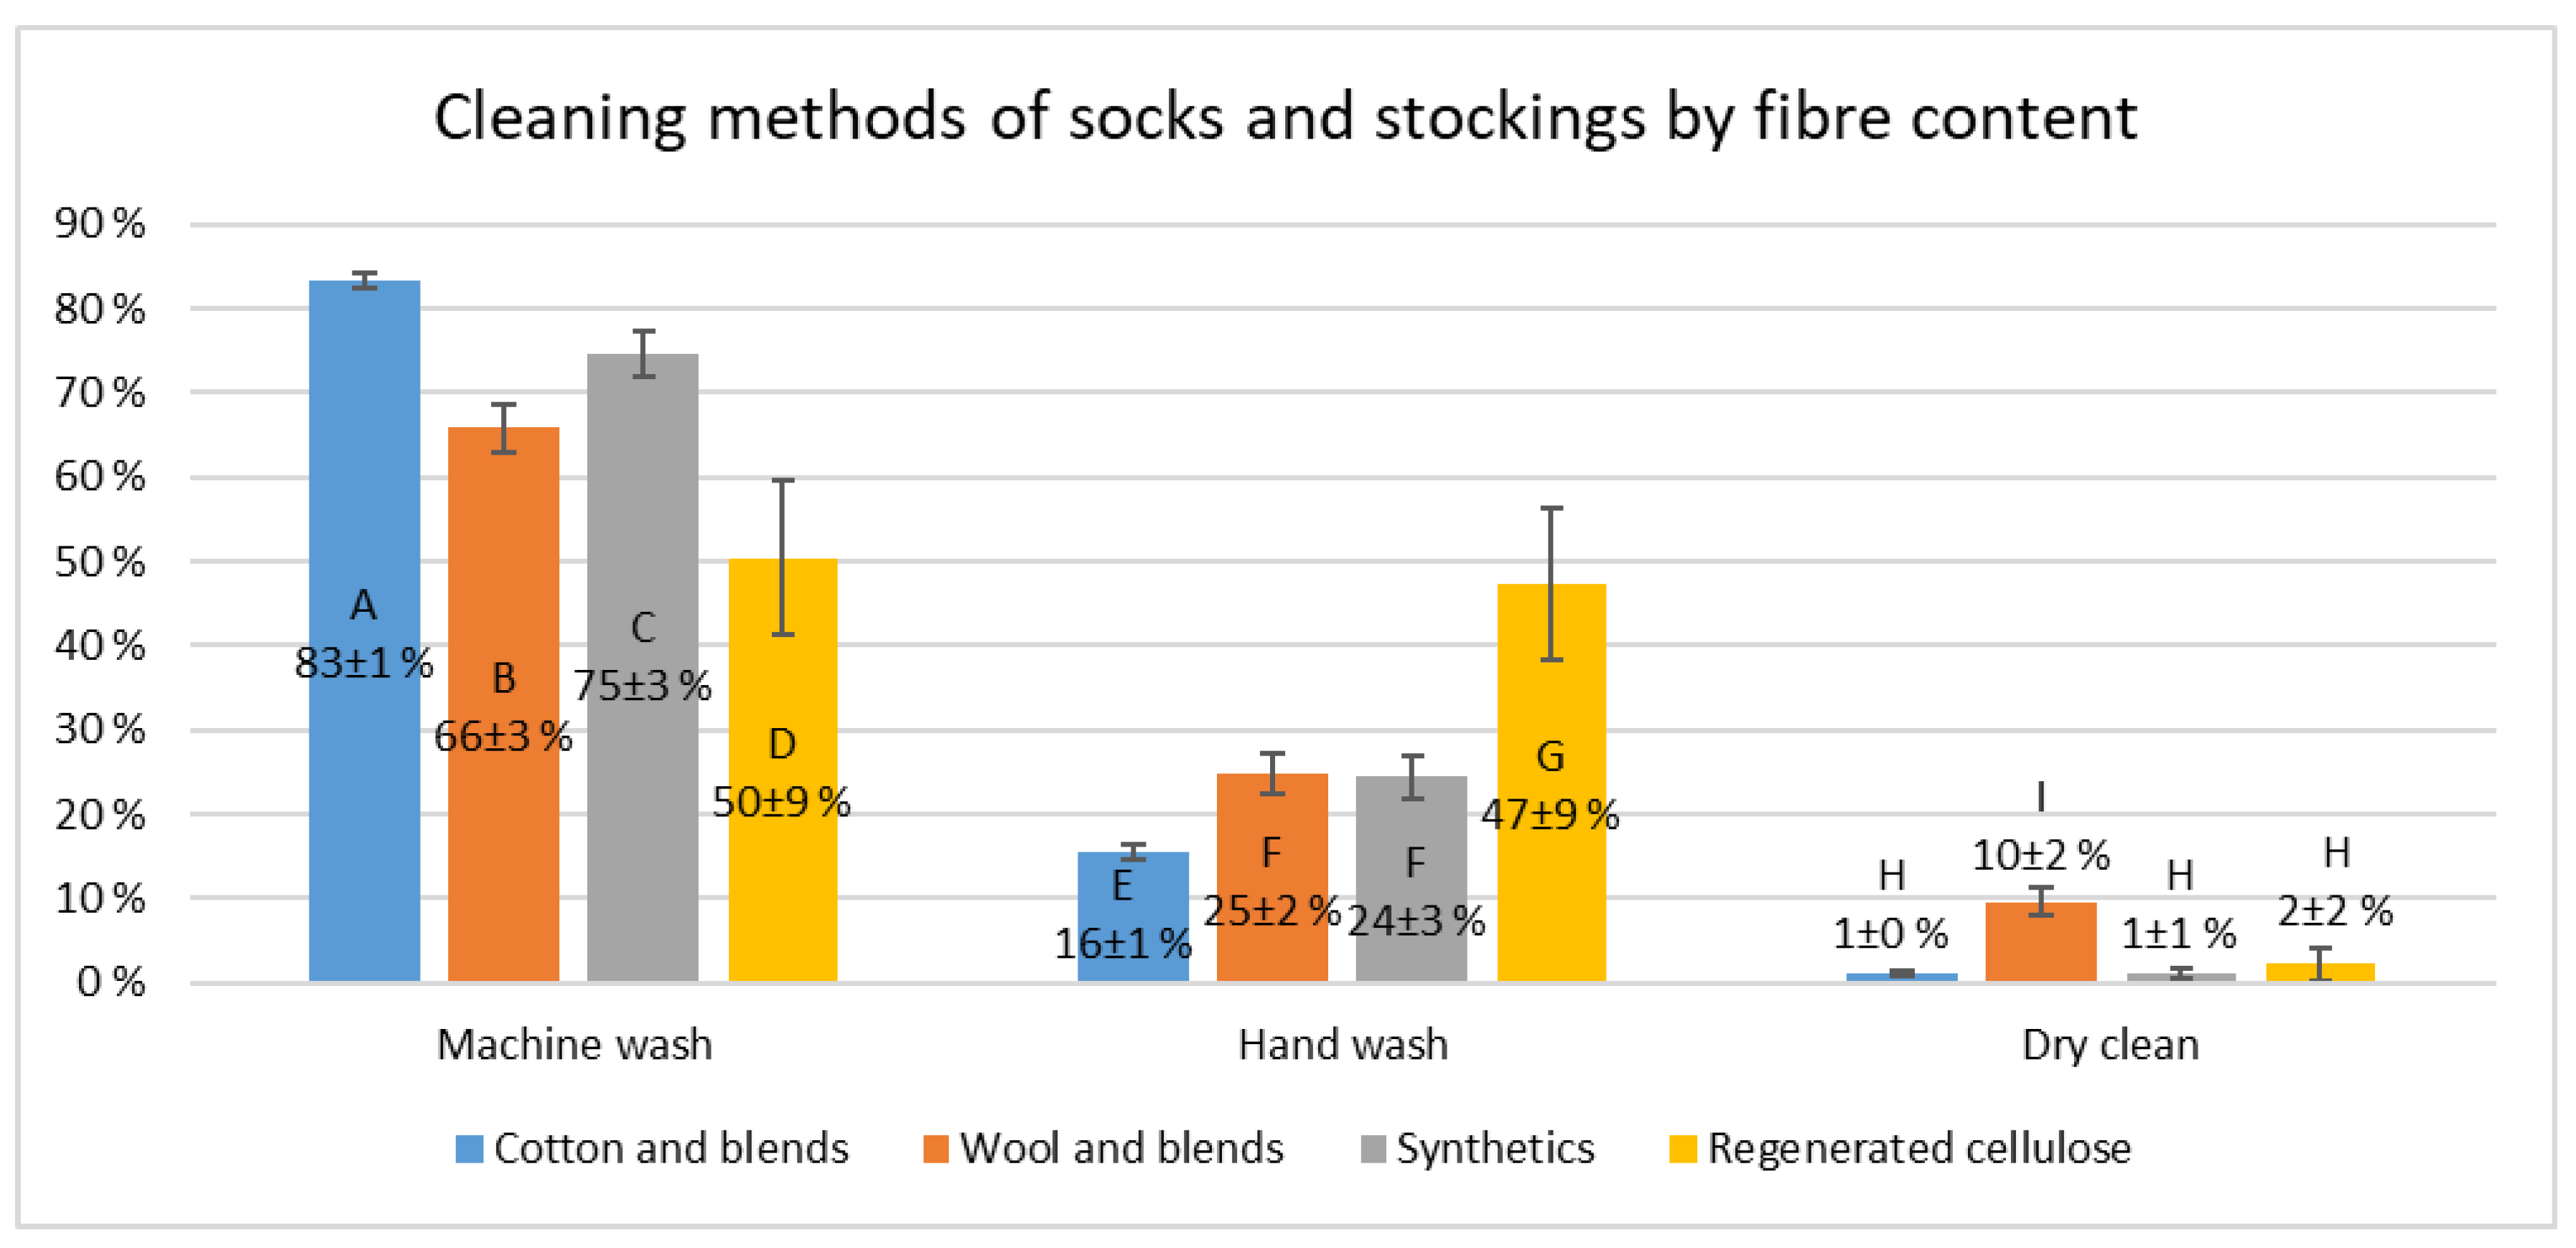
| Socks | Cotton and blends | 94% | 6% | 0% | 21% | 34% | 17% | 28% | 1245 |
| Wool and blends | 93% | 7% | 0% | 11% | 23% | 24% | 42% | 186 | |
| Synthetics | 98% | 2% | 0% | 16% | 41% | 19% | 24% | 406 | |
| Reg. cellulose | 96% | 4% | 0% | 15% | 25% | 32% | 28% | 297 | |
| Garment Category | Country | Machine Wash | Hand Wash | Dry Clean |
|---|---|---|---|---|
| Formal wear | China | 53 ± 2% A | 23 ± 2% E | 24 ± 2% H |
| Germany | 68 ± 3% B | 6 ± 1% F | 26 ± 3% H | |
| Japan | 32 ± 2% C | 9 ± 1% F | 59 ± 2% I | |
| UK | 70 ± 3% B | 7 ± 2% F | 23 ± 3% H | |
| USA | 60 ± 3% D | 14 ± 2% G | 26 ± 3% H | |
| Total ANOVA | 54 ± 1% F(4, 5447) = 135,20, p < 0.001 | 13 ± 1% F(4, 5447) = 72.53, p < 0.001 | 33± 1% F(4, 5447) = 170.28, p < 0.001 | |
| T-shirts | China | 56 ± 2% A | 37 ± 2% D | 7 ± 1% G |
| Germany | 94 ± 1% B | 4 ± 1% E | 2 ± 1% H | |
| Japan | 93 ± 1% B | 4 ± 1% E | 3 ± 1% H | |
| UK | 92 ± 1% B | 5 ± 1% E | 3 ± 1% H | |
| USA | 88 ± 1% C | 8 ± 1% F | 4 ± 1% H | |
| Total ANOVA | 87 ± 1% F(4, 8616) = 437.65, p < 0.001 | 10 ± 1% F(4, 8616) = 469.46, p < 0.001 | 3 ± 0.4% F(4, 8616) = 18.89, p < 0.001 | |
| Socks | China | 38 ± 2% A | 60 ± 2% D | 2 ± 1% GH |
| Germany | 91 ± 1% B | 7 ± 1% EF | 2 ± 1% G | |
| Japan | 91 ± 1% B | 7 ± 1% EF | 2 ± 1% G | |
| UK | 93 ± 1% B | 6 ± 1% E | 1 ± 1% G | |
| USA | 88 ± 1% C | 9 ± 1% F | 3 ± 1% H | |
| Total ANOVA | 80 ± 1% F(4, 8984) = 973.69, p < 0.001 | 18 ± 1% F(4, 8984)=1111.09, p < 0.001 | 2 ± 0.3% F(4, 8984) = 4.44, p < 0.005 |
| Garment Category | Country | Cleaning Activities | Drying Activities | |||||
|---|---|---|---|---|---|---|---|---|
| Machine Wash | Hand-Wash | Dry Clean | Clothes Dryer | Line Dried Outdoors | Line Dried in Non-Heated Room | Line Dried in Heated Room | ||
| Formal wear | China | 49% | 9% | 42% | 17% | 26% | 46% | 11% |
| Germany | 67% | 0% | 33% | 7% | 7% | 0% | 86% | |
| Japan | 77% | 4% | 19% | 2% | 56% | 17% | 26% | |
| UK | 76% | 8% | 16% | 36% | 24% | 10% | 30% | |
| US | 49% | 0% | 51% | 100% | 0% | 0% | 0% | |
| Total | 64% | 6% | 30% | 24% | 31% | 20% | 26% | |
| T-shirts | China | 78% | 22% | 0% | 14% | 46% | 16% | 24% |
| Germany | 99% | 1% | 0% | 14% | 2% | 21% | 63% | |
| Japan | 99% | 1% | 0% | 3% | 65% | 16% | 16% | |
| UK | 95% | 1% | 3% | 44% | 21% | 4% | 31% | |
| US | 97% | 3% | 0% | 85% | 0% | 1% | 14% | |
| Total | 96% | 3% | 1% | 26% | 32% | 13% | 30% | |
| Socks | China | 59% | 41% | 0% | 7% | 35% | 47% | 12% |
| Germany | 98% | 2% | 0% | 17% | 1% | 15% | 67% | |
| Japan | 97% | 3% | 0% | 2% | 61% | 18% | 20% | |
| UK | 97% | 2% | 1% | 46% | 14% | 7% | 33% | |
| US | 92% | 8% | 0% | 89% | 0% | 0% | 11% | |
| Total | 92% | 8% | 0% | 21% | 34% | 17% | 28% | |
© 2020 by the authors. Licensee MDPI, Basel, Switzerland. This article is an open access article distributed under the terms and conditions of the Creative Commons Attribution (CC BY) license (http://creativecommons.org/licenses/by/4.0/).
Share and Cite
Laitala, K.; Klepp, I.G.; Kettlewell, R.; Wiedemann, S. Laundry Care Regimes: Do the Practices of Keeping Clothes Clean Have Different Environmental Impacts Based on the Fibre Content? Sustainability 2020, 12, 7537. https://doi.org/10.3390/su12187537
Laitala K, Klepp IG, Kettlewell R, Wiedemann S. Laundry Care Regimes: Do the Practices of Keeping Clothes Clean Have Different Environmental Impacts Based on the Fibre Content? Sustainability. 2020; 12(18):7537. https://doi.org/10.3390/su12187537
Chicago/Turabian StyleLaitala, Kirsi, Ingun Grimstad Klepp, Roy Kettlewell, and Stephen Wiedemann. 2020. "Laundry Care Regimes: Do the Practices of Keeping Clothes Clean Have Different Environmental Impacts Based on the Fibre Content?" Sustainability 12, no. 18: 7537. https://doi.org/10.3390/su12187537
APA StyleLaitala, K., Klepp, I. G., Kettlewell, R., & Wiedemann, S. (2020). Laundry Care Regimes: Do the Practices of Keeping Clothes Clean Have Different Environmental Impacts Based on the Fibre Content? Sustainability, 12(18), 7537. https://doi.org/10.3390/su12187537