Hybrid Wind–PV Frequency Control Strategy under Variable Weather Conditions in Isolated Power Systems
Abstract
:1. Introduction
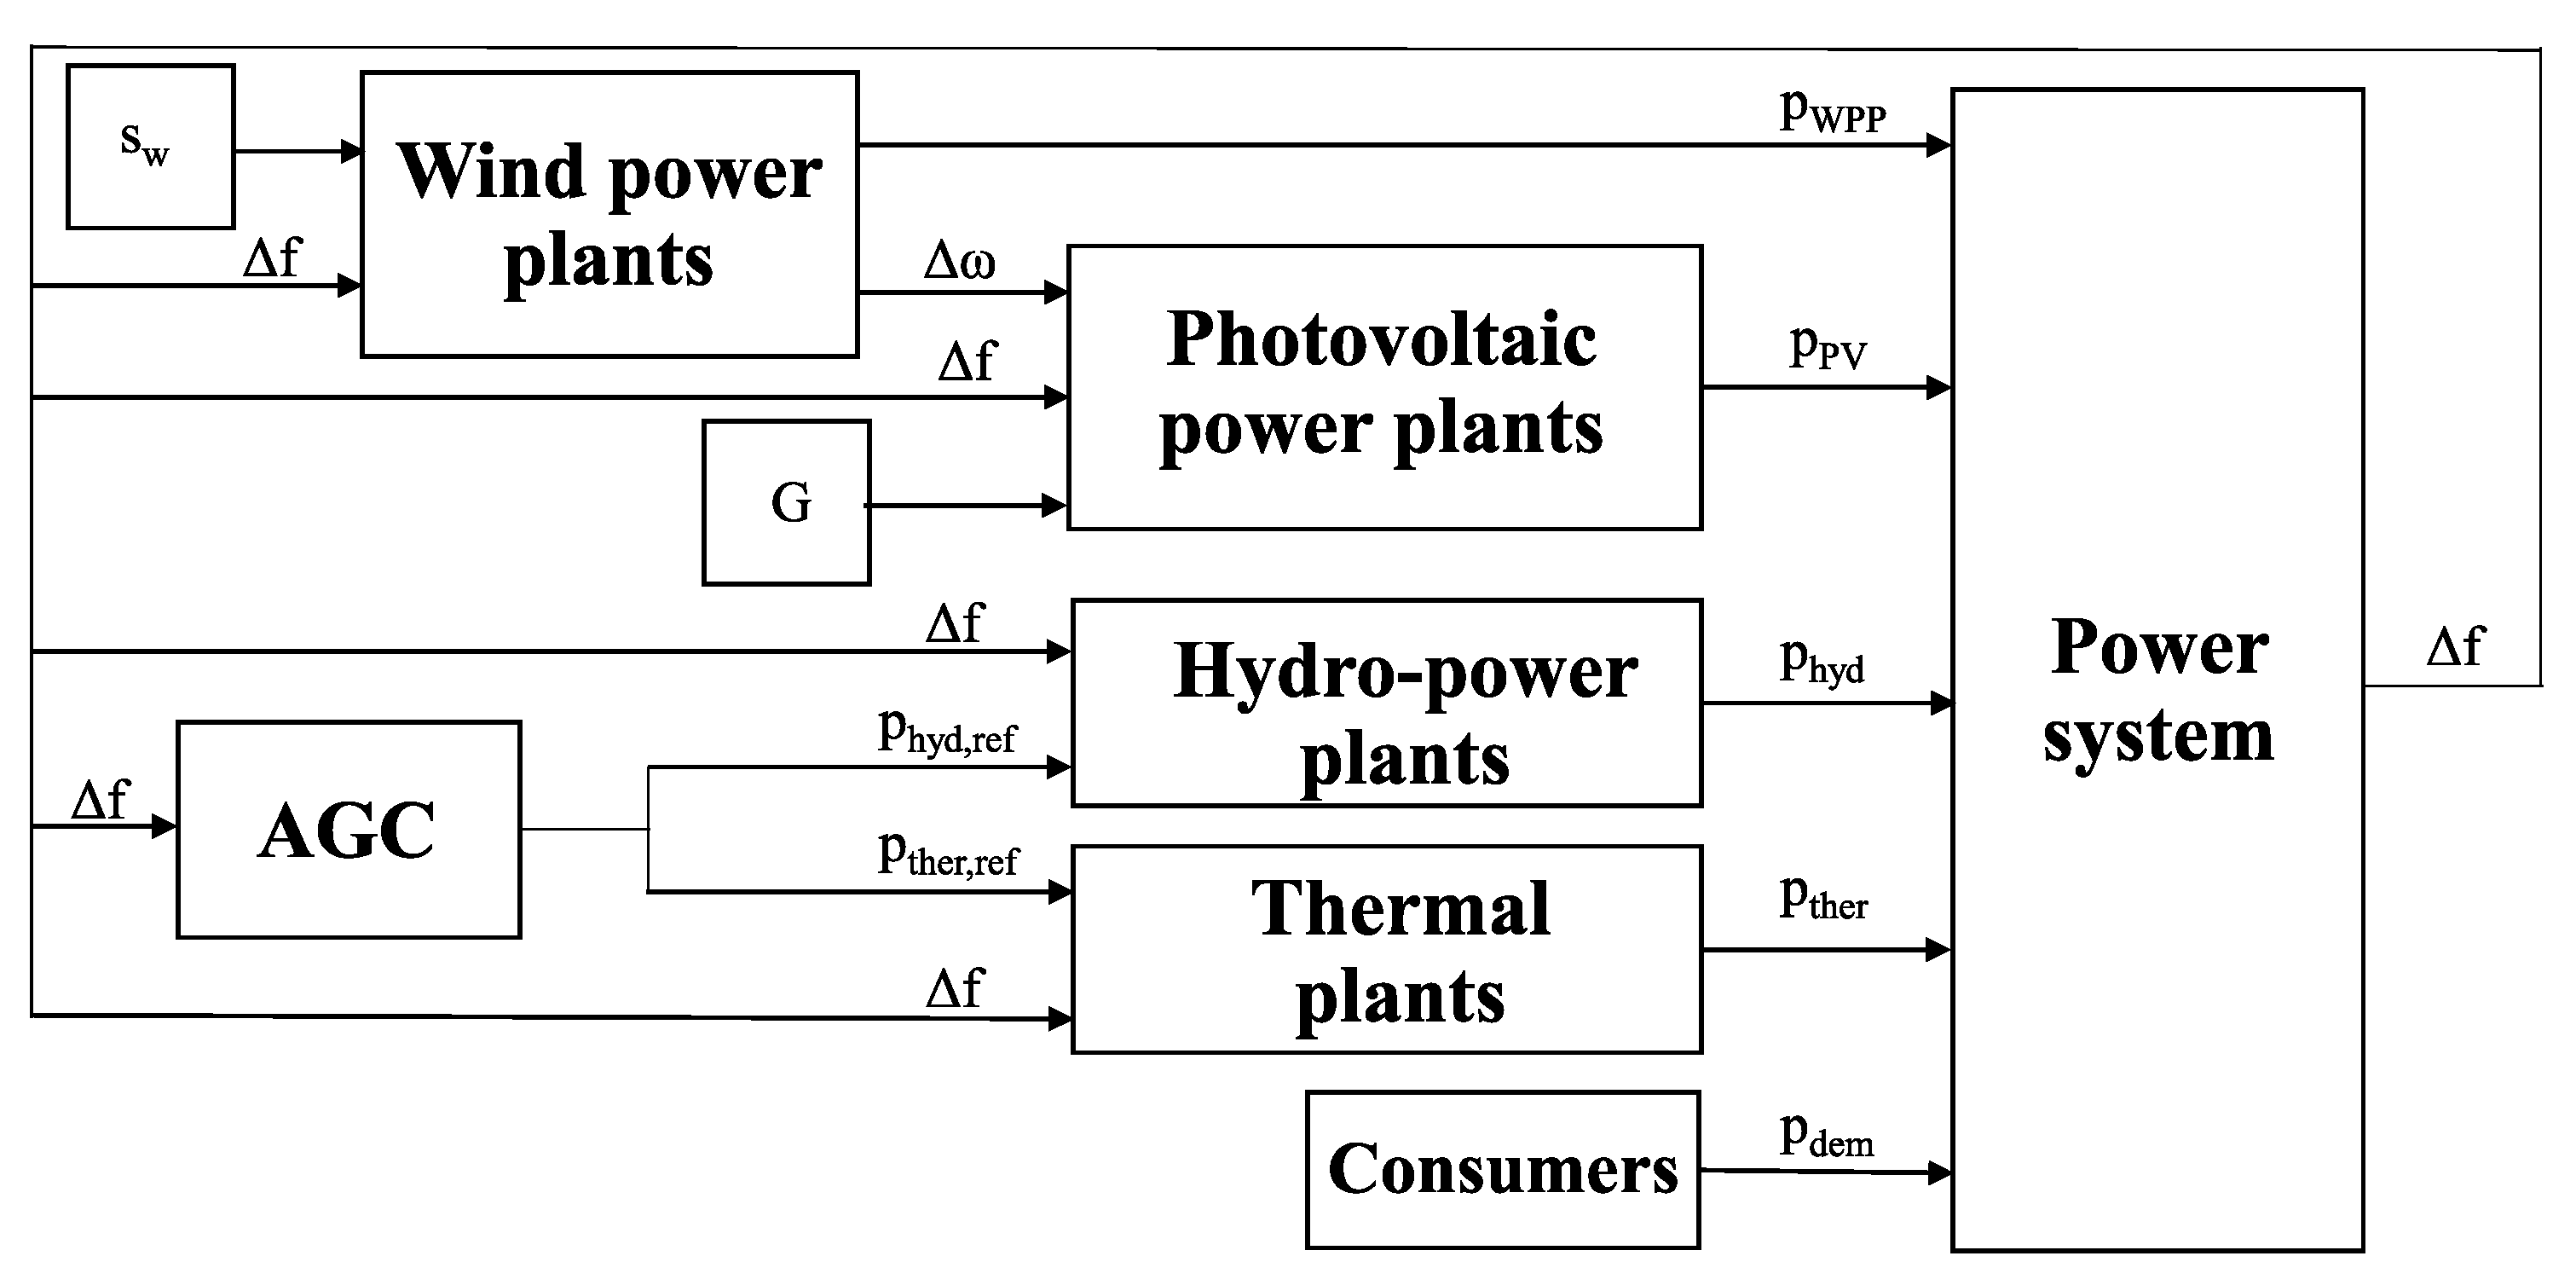
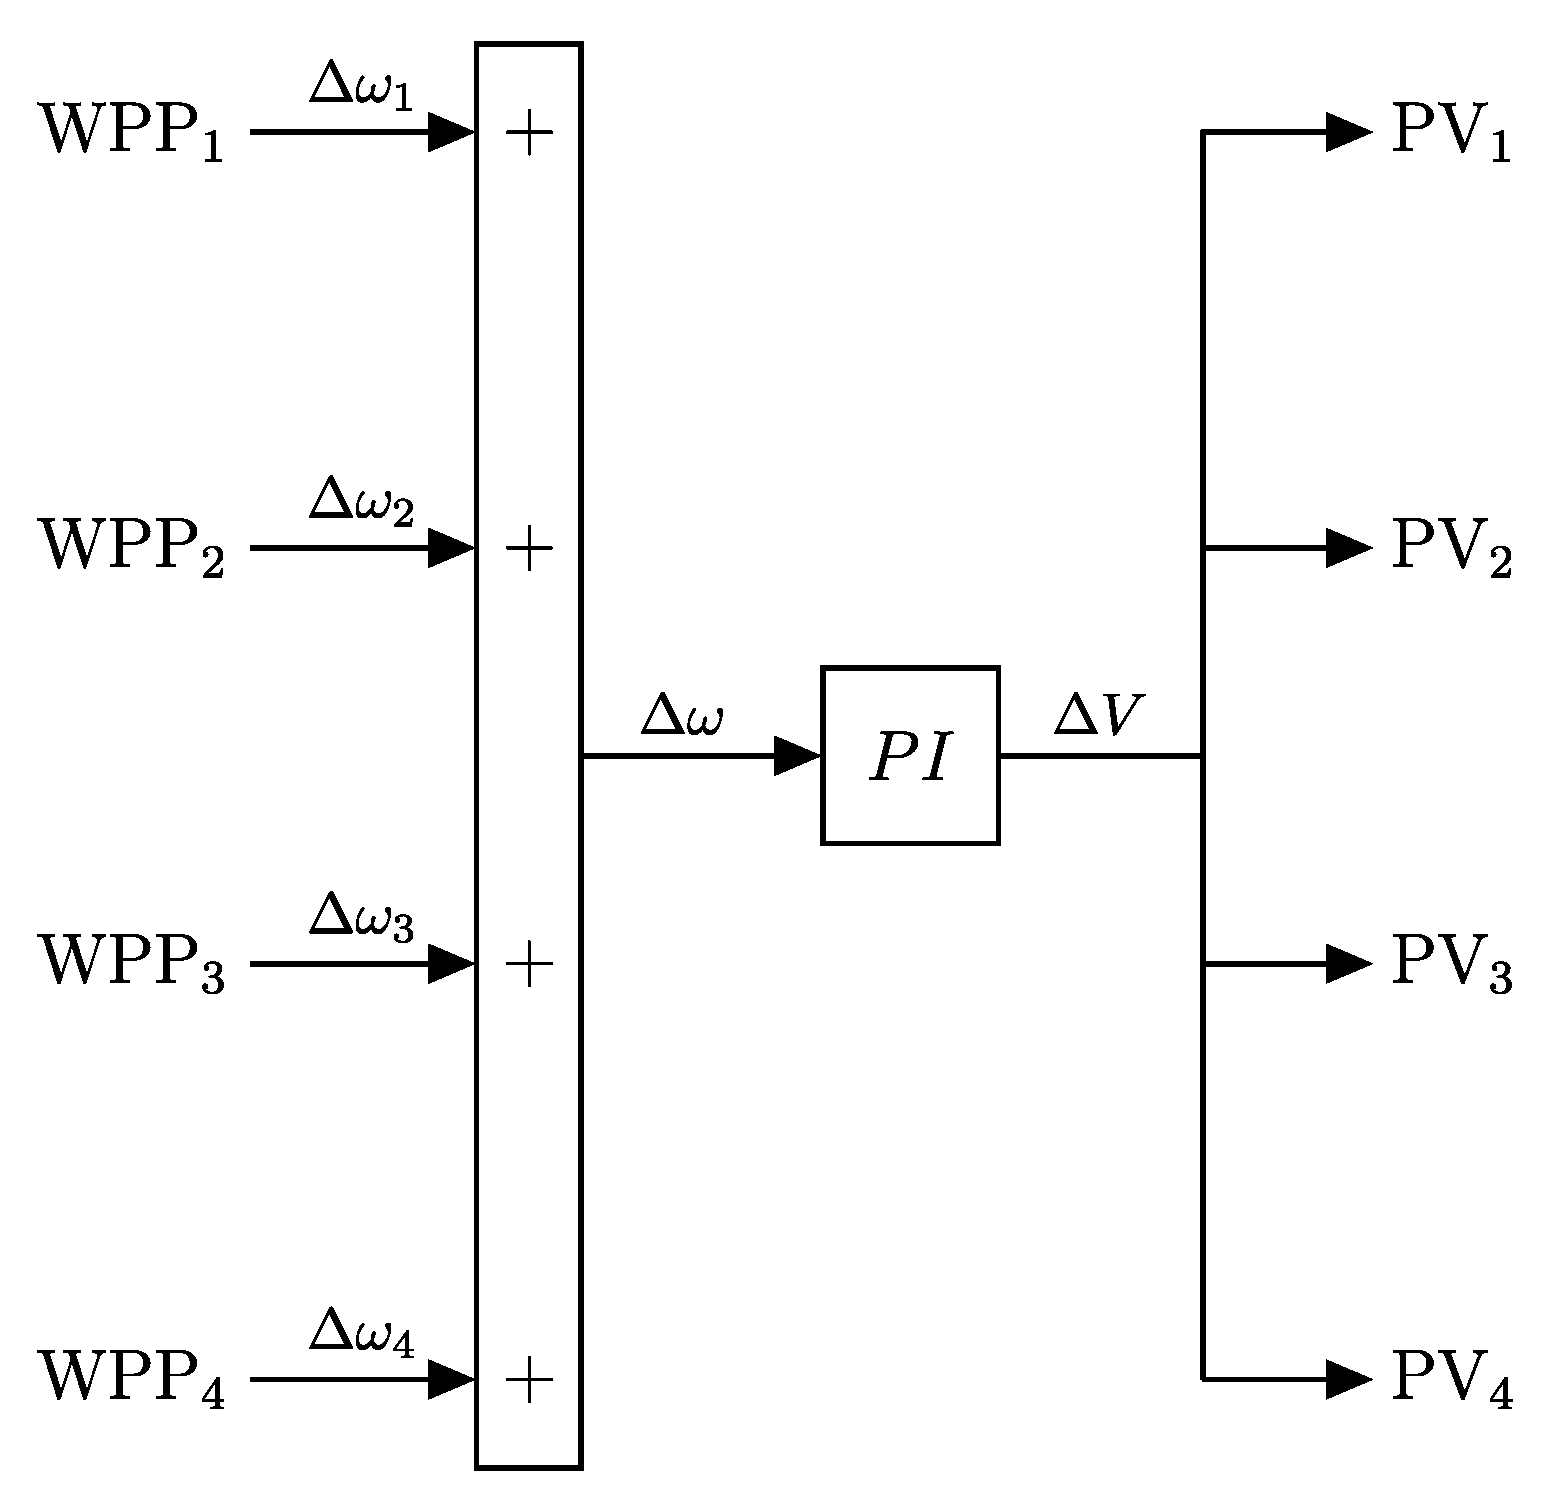
- A new hybrid wind–PV frequency control strategy is proposed. VSWTs include the hidden-inertia emulation technique, whereas PV power plants use the de-loading approach. The novelty of the hybrid control is that the PV frequency controller receives the VSWTs’ rotational speed deviation as an input instead of the grid frequency deviation.
- The proposed controller is tested on an isolated power system consisting of thermal, hydro-power, VSWT, and PV power plants under six different scenarios. Frequency deviations are the result of the variability of both wind speed and solar irradiation, synthetically estimated (wind speed) and based on real measured values (solar irradiation).
- The frequency response is compared to three different frequency strategies: conventional power plants; conventional power plants and wind power plants; and conventional power plants, wind power plants, and PV power plants with frequency deviation as input. Minor frequency oscillations were obtained with the hybrid wind–PV frequency strategy in terms of minimum and maximum frequency deviations and mean squared error (MSE) of frequency, as well as in terms of minimum and maximum rotational speed of the VSWTs and MSE of their rotational speed deviation.
2. Proposed System Modeling
2.1. Power System and System Inertia
2.2. Conventional Power Plants
2.3. Wind Power Plants
2.4. PV Power Plant
3. Methodology
3.1. Frequency Control in Conventional Power Plants
3.2. VSWT Frequency Control Strategy
3.3. PV Frequency Control Strategy
3.3.1. Conventional De-Loaded PV Frequency Control Strategy
3.3.2. Hybrid Wind–PV Frequency Control
4. Results
4.1. Scenarios under Consideration
4.2. Simulation Results
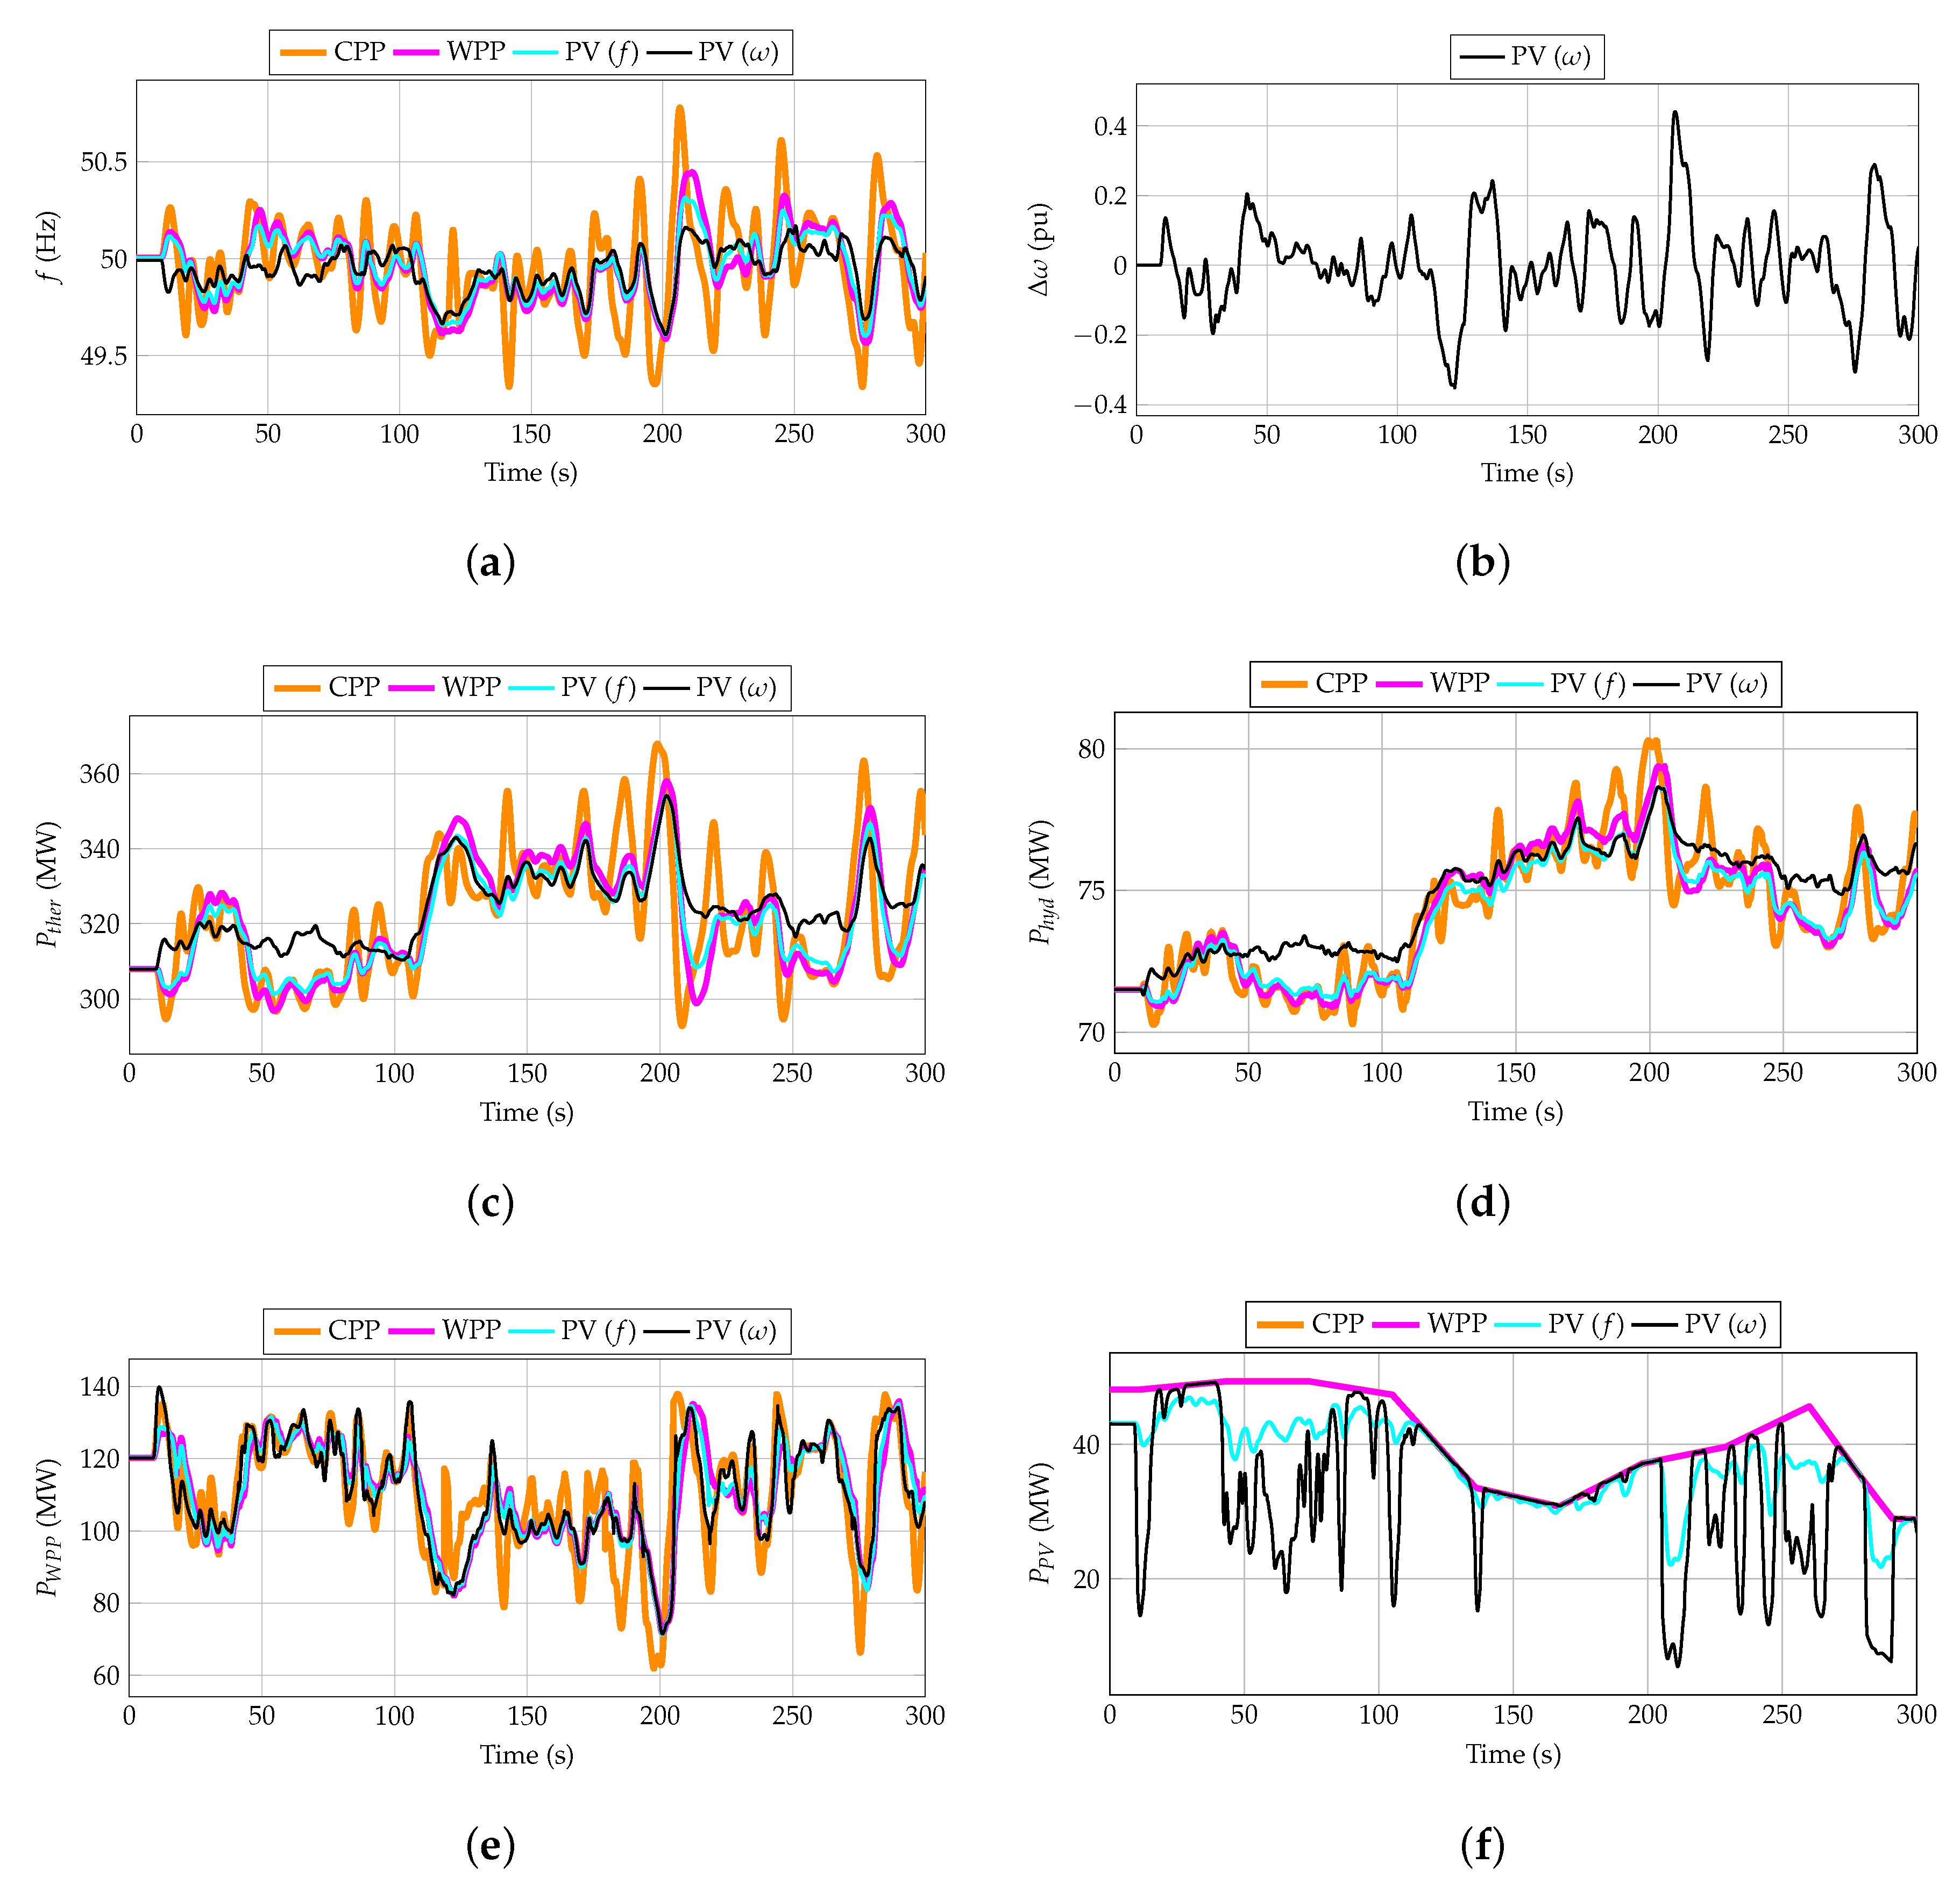
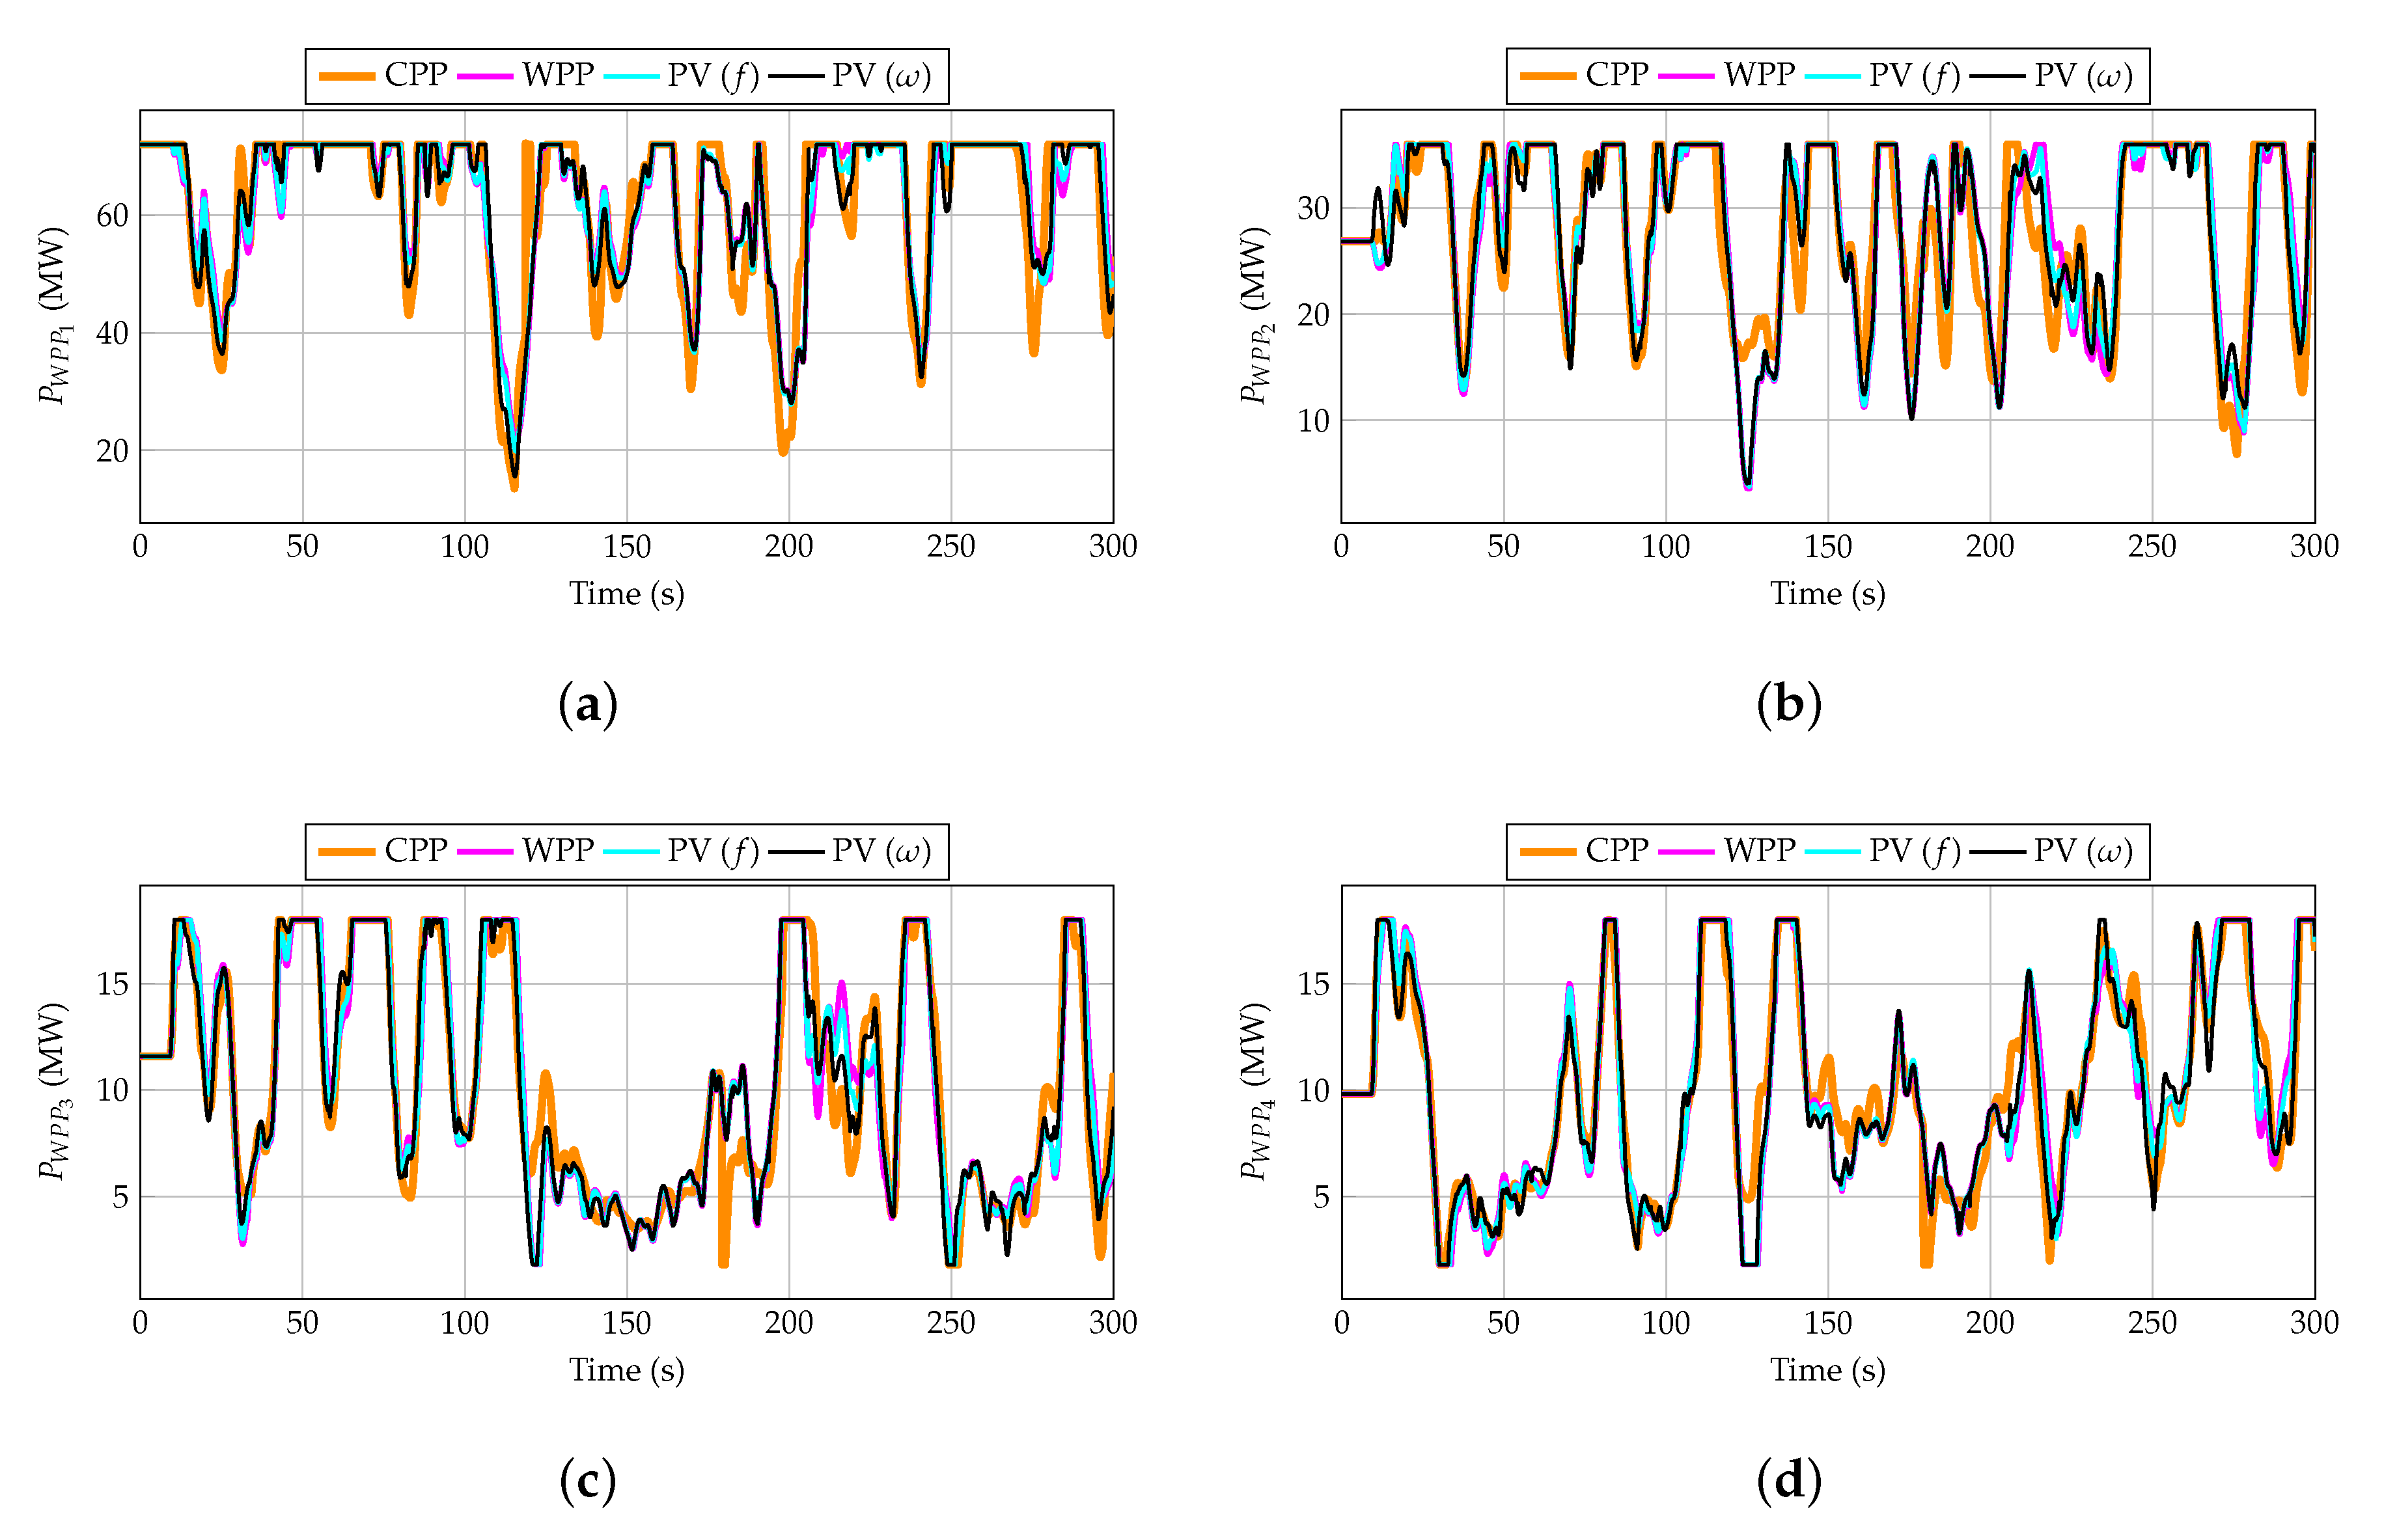
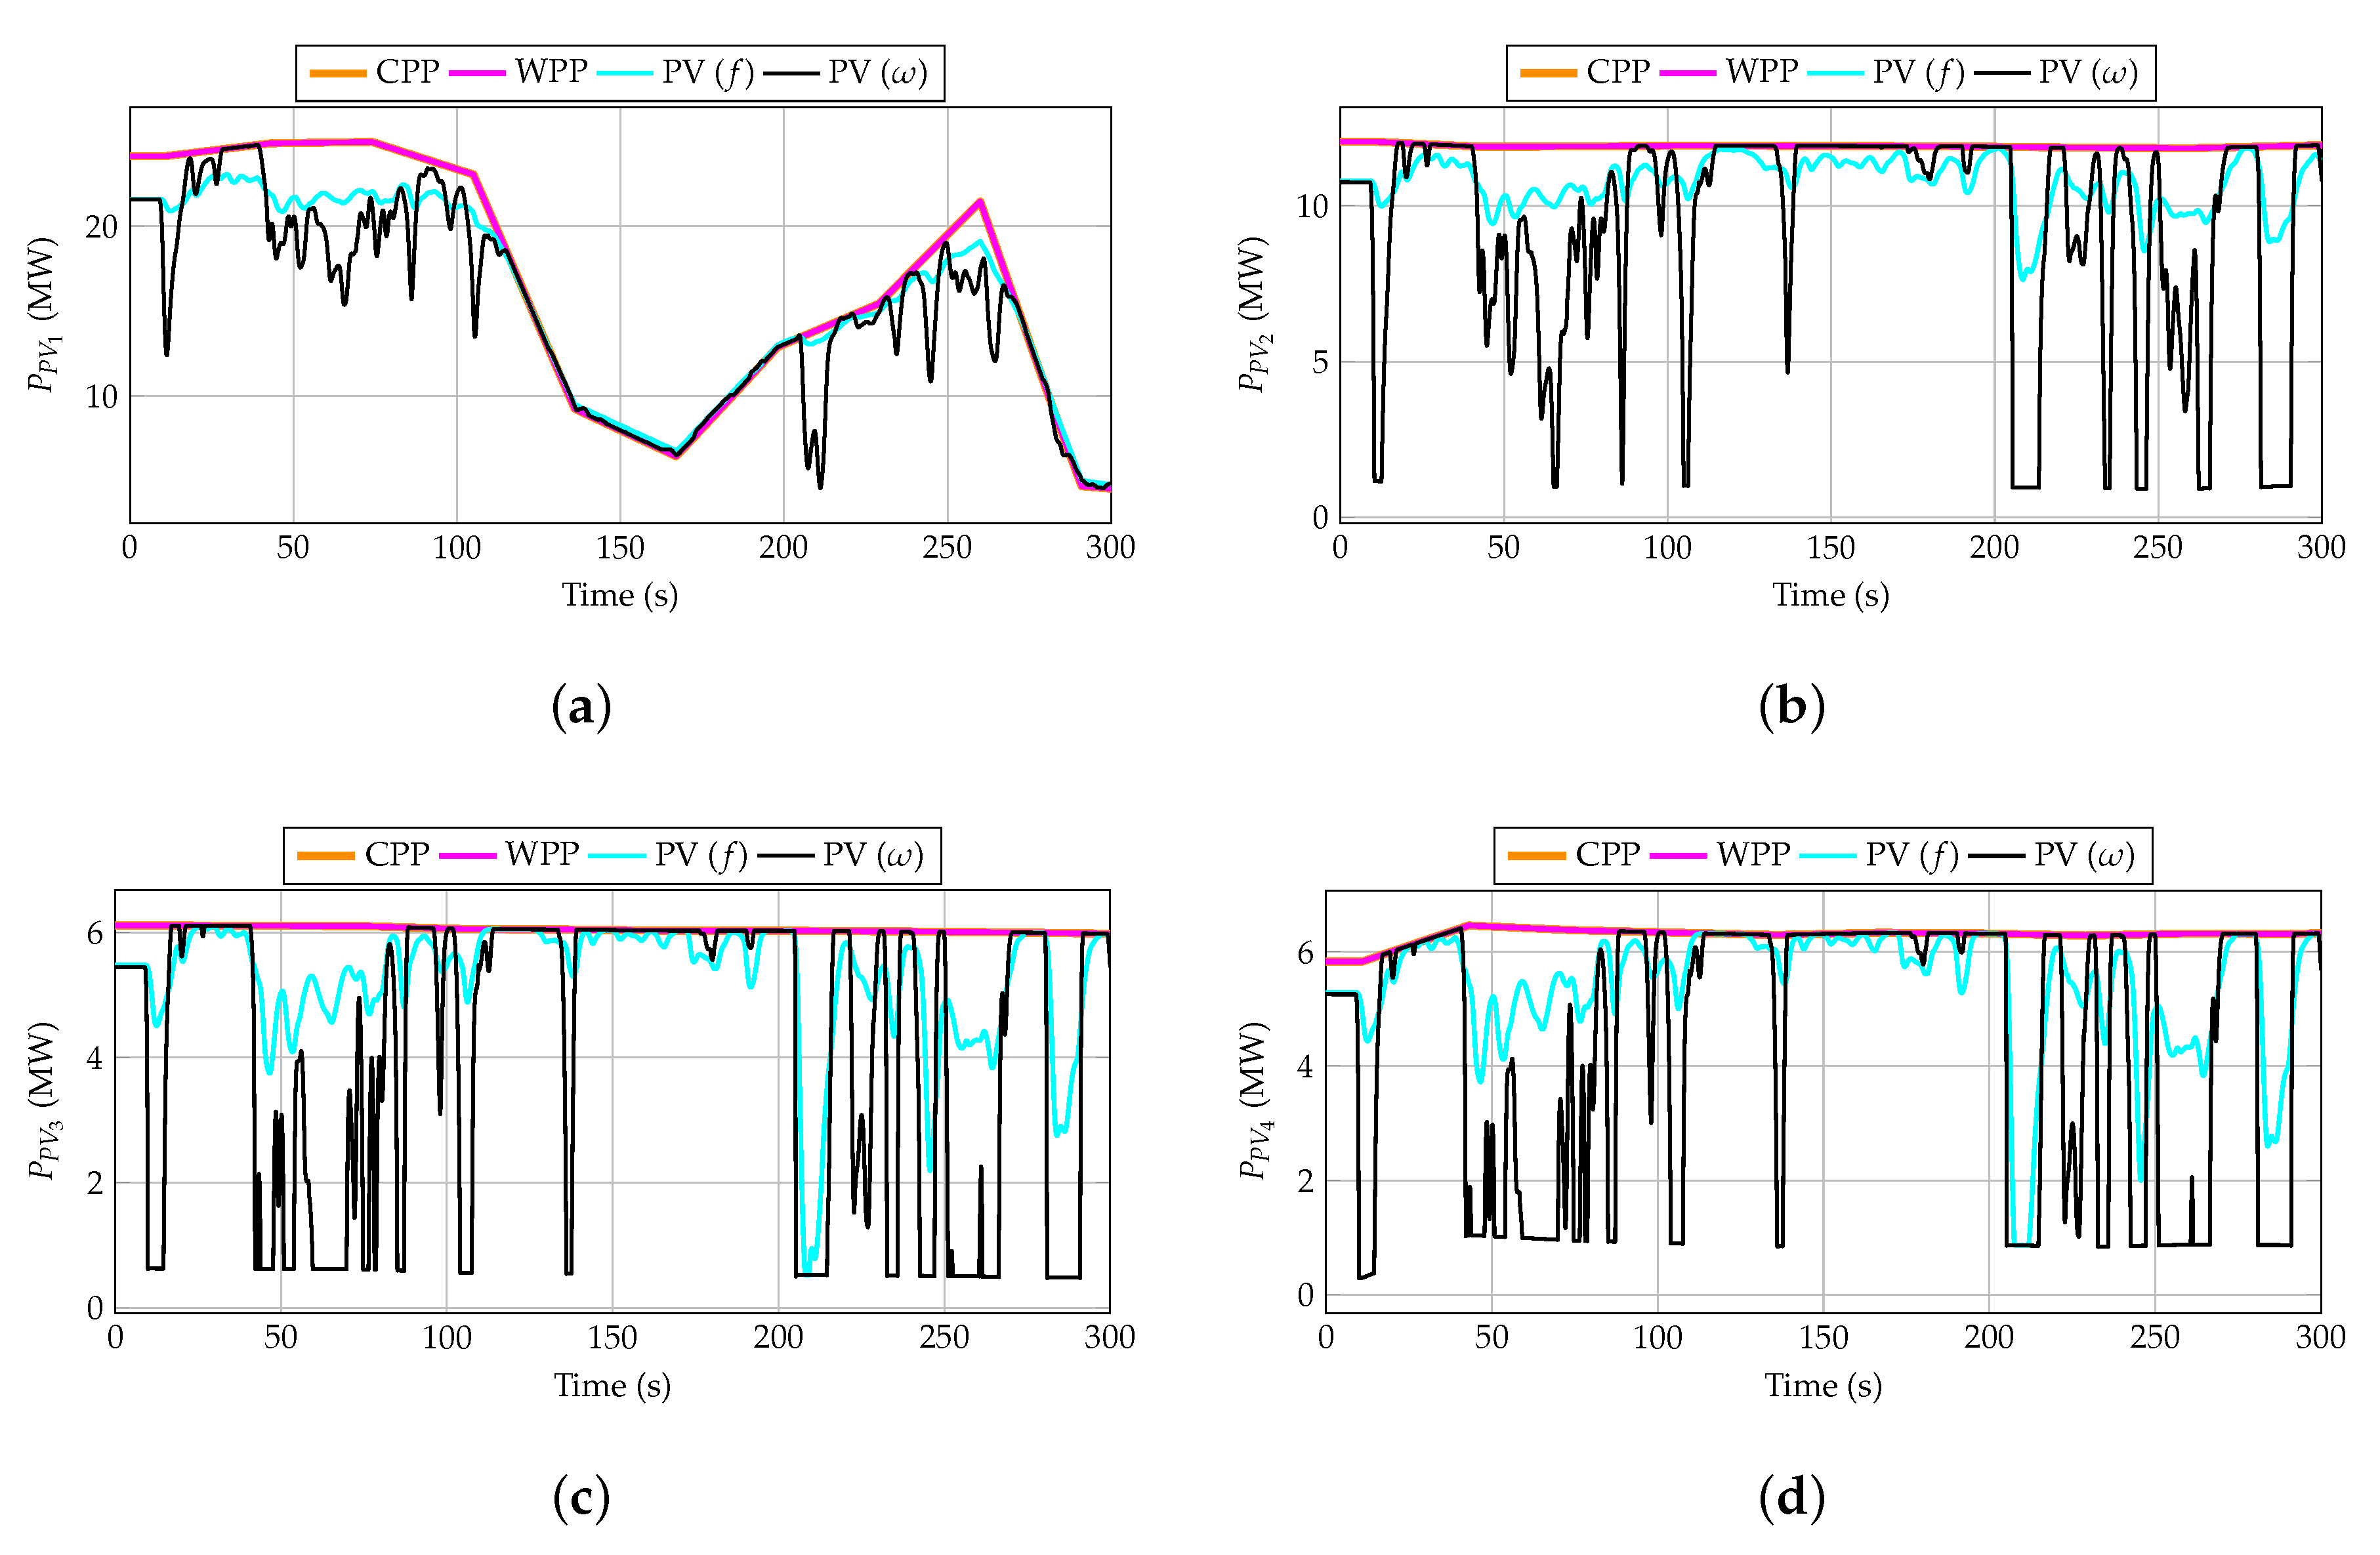
- Frequency control is only provided by conventional power plants (referred to as CPP).
- Frequency control is provided by conventional power plants and WPPs with a hidden-inertia emulation technique (referred to as WPP).
- Frequency control is provided by conventional power plants, WPPs with a hidden-inertia emulation technique, and PV power plants with 10% de-loading and a P controller with as input (referred to as PV (f)).
- Frequency control is provided by conventional power plants, WPPs with a hidden-inertia emulation technique, and PV power plants with 10% de-loading and a controller with of the VSWTs as input (referred to as PV (ω)), which is the hybrid wind–PV frequency strategy proposed in this paper.
- A reduction of the MSE between 75% and 95% is obtained when the proposed hybrid wind–PV frequency strategy is used, in contrast to the CPP approach.
- A reduction of the MSE between 50% and 65% is obtained when the proposed hybrid wind–PV frequency strategy is used, in contrast to the WPP approach.
- A reduction of the MSE between 20% and 35% is obtained when the proposed hybrid wind–PV frequency strategy is used, in contrast to the PV(f) approach.
- Considering the CPP and WPP strategies, the PV power plants work on their MPP and, subsequently, their generated energy is the maximum among the four strategies (and the same for both cases).
- Considering the PV(f) strategy, the PV power plants are de-loaded by 10%. A reduction between 10% and 20% of the PV-generated energy is then obtained in comparison to the CPP and WPP strategies.
- A reduction between 20% and 30% of the PV-generated energy is obtained by using the proposed hybrid wind–PV control compared to the CPP and WPP strategies.
- Comparing the CPP and WPP strategies, the use of VSWTs for frequency control reduces the MSE of thermal power plants by between 14%–20%, with a reduction between 12%–24% for hydro-power plants.
- Comparing the CPP and PV(f) strategies, including a conventional de-loading frequency control strategy for PV power plants reduces the MSE of thermal power plants by between 35%–46%, with a reduction between 31%–51% for hydro-power plants.
- Comparing the CPP and PV() strategies, using the hybrid wind–PV control approach reduces the MSE of thermal power plants between 24%–30%, with a reduction between 5%–35% for hydro-power plants. Moreover, there are some cases in which the MSE of the hydro-power plant is slightly increased.
- The CPP strategy has the smallest variations of rotational speeds. This is due to the fact that such rotational speed variations are only the result of wind speed changes.
- The WPP strategy has the largest variations of rotational speed values. In fact, both the minimum/maximum values of are obtained with this technique, even though they are small variations of around 5%–10%. Consequently, the maximum MSE is obtained with the WPP strategy. In some cases, the MSE result is three times higher than the value obtained with the CPP approach. Naturally, the speed deviations with this strategy are the result of both the wind speed changes and the hidden-inertia frequency control approach.
- The PV(f) technique slightly improves the minimum/maximum rotational speed values and the MSE (if comparing to the WPP strategy). However, these values are still worse than with the CPP approach.
- The PV() strategy reduces the minimum and maximum values of the rotational speed even more, and, consequently, reduces the MSE (if comparing to the WPP and PV(f) strategies). In fact, there are some cases in which the MSE is quite similar for both the CPP and PV() techniques.
4.3. Limitations and Further Work
- Thermal units are supposed to work at the same operating point, considering a single equivalent turbine. In addition, only one thermal power plant technology is assumed (reheat thermal). Hydro-power plants are modeled analogously (including only one kind of hydro turbine). Finally, each wind power plant is modeled as one equivalent VSWT.
- The initial assigned power (generation programming) of each one of the generation units was not obtained with technical–economic criteria (unit commitment), nor were their PFC reserves and secondary control action. Once each generation unit is individually modeled, it is reasonable to assign an initial power to each unit according to both technical and economic criteria.
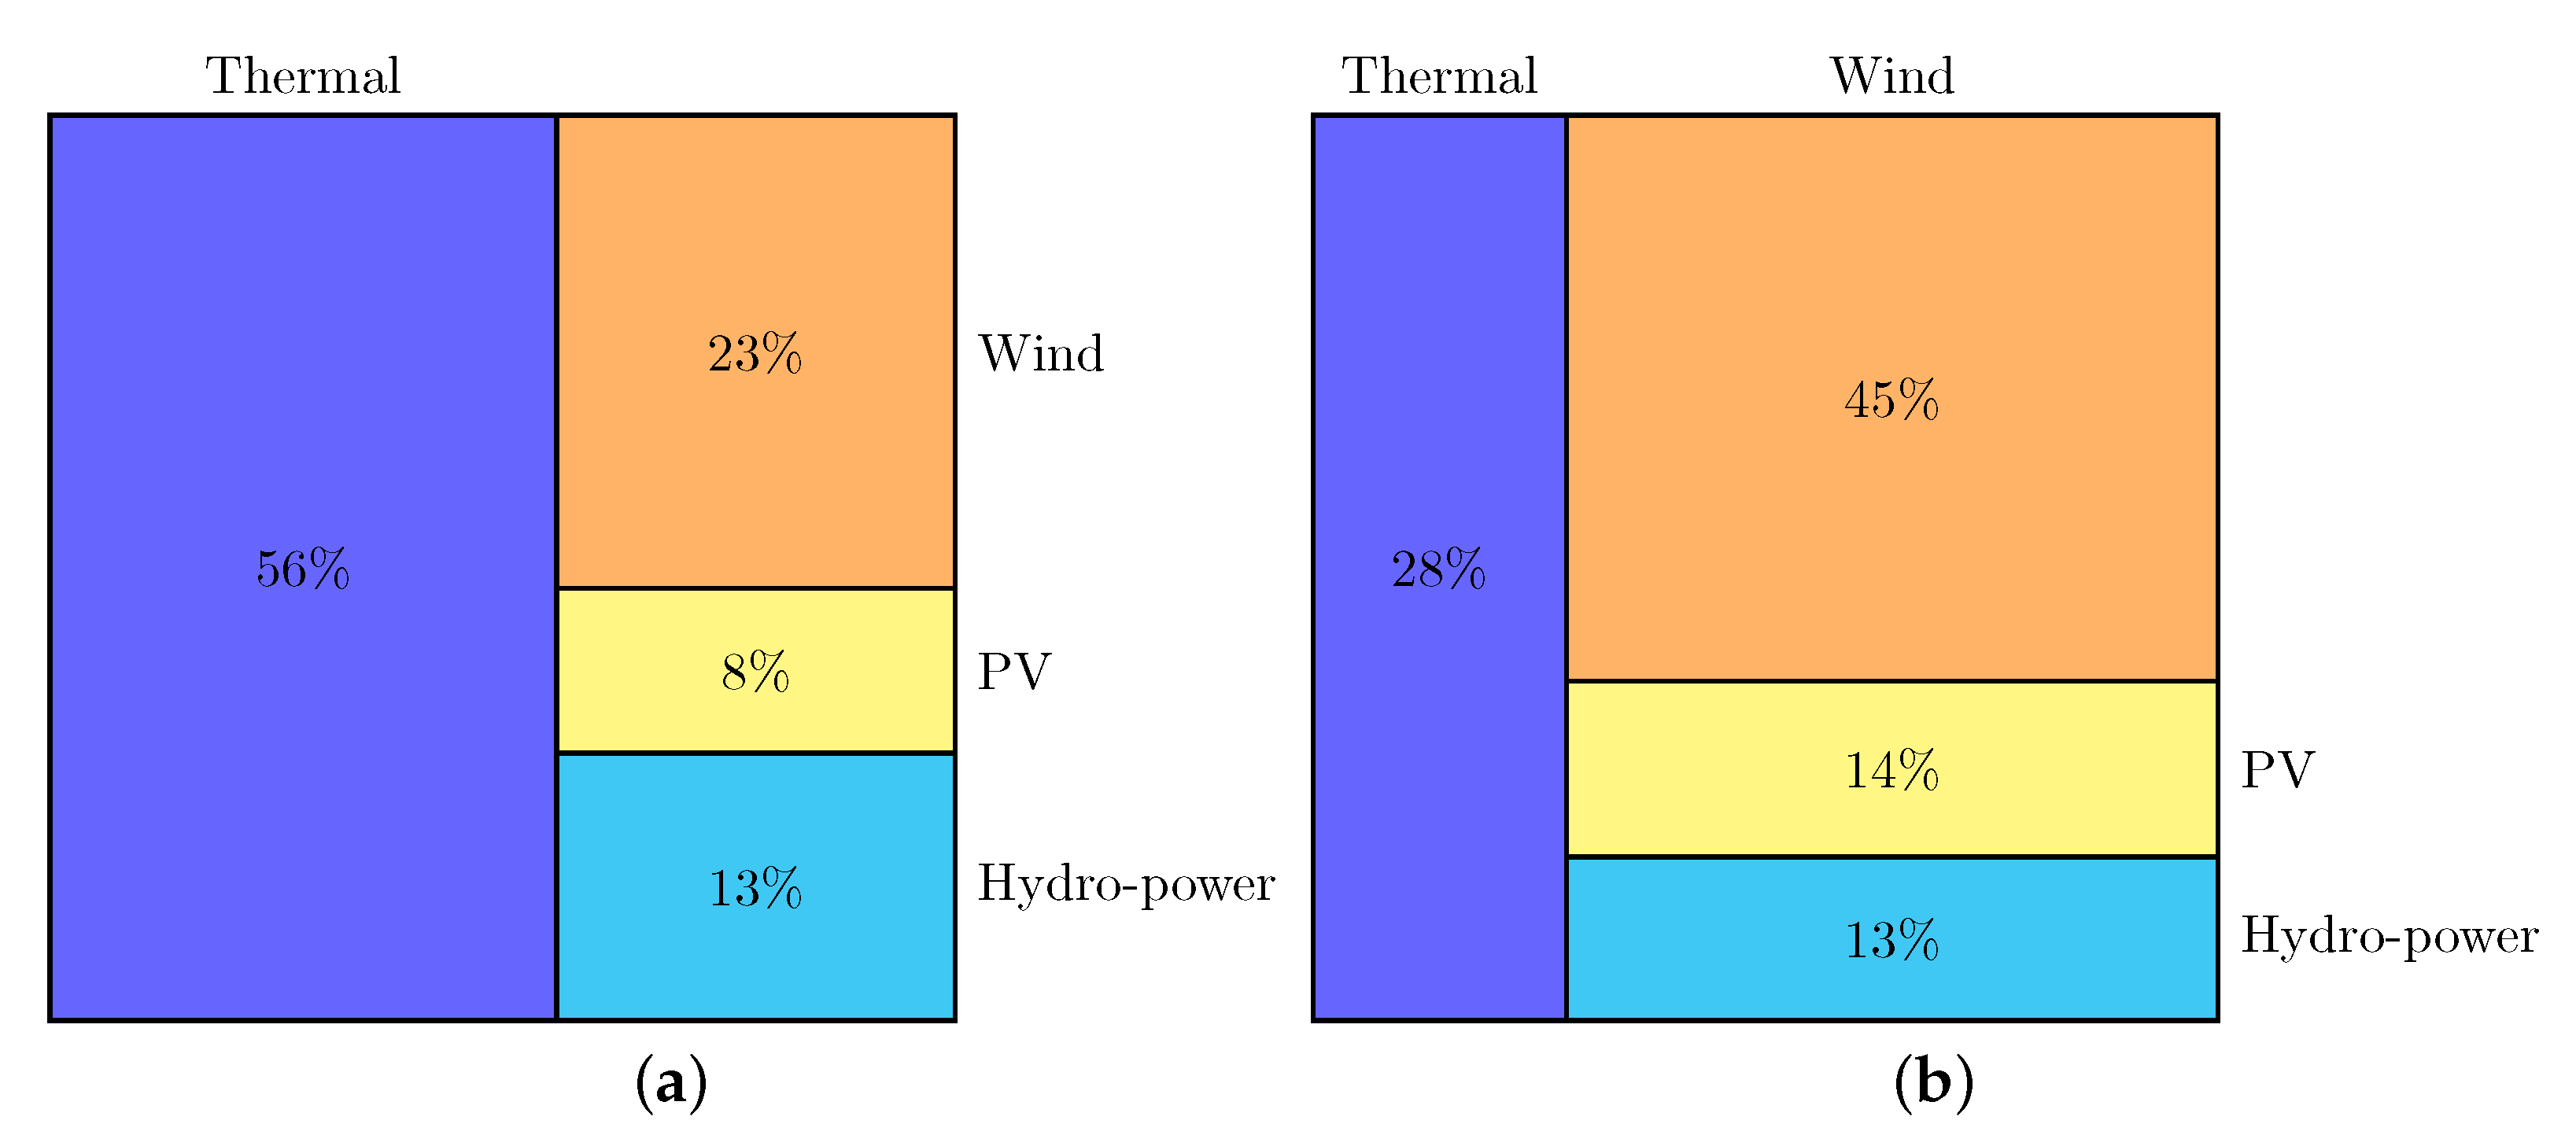
- To obtain each vRES penetration level, the ENTSO-E recommendations for interconnected power systems were followed by the authors. However, isolated power systems can have different vRES integration levels. However, this hypothesis is assumed to give generality to the present study.
- As described in Section 2, power line dynamics are neglected, as well as the communication lines between the wind and PV power plants for the proposed hybrid wind–PV controller set-up.
5. Conclusions
Author Contributions
Funding
Conflicts of Interest
Abbreviations
| Correction factor depending on the cell’s temperature | |
| Rotational speed deviation of VSWT | |
| Frequency deviation | |
| Power imbalance | |
| Total secondary regulation effort | |
| Additional voltage for PV frequency control | |
| f | Grid frequency |
| Boltzmann’s constant | |
| Short-circuit current temperature coefficient | |
| p | Active power (pu) |
| q | Electron charge |
| Wind speed | |
| A | Diode ideality factor |
| Consumer loads’ sensitivity to frequency deviations | |
| Band-gap energy | |
| G | Sun irradiation |
| H | Inertia constant |
| I | Current |
| Photo-current | |
| Reverse saturation current at | |
| Reverse saturation current | |
| Short-circuit current | |
| Participation factor on AGC | |
| Number of PV strings in parallel | |
| Number of PV cells in series | |
| P | Active power (MW) |
| R | Droop characteristic |
| Base power | |
| T | Temperature |
| Temperature of the PV cell | |
| V | Voltage |
| De-load (subscript) | |
| Power demand (subscript) | |
| Hydro-power (subscript) | |
| Photovoltaic (subscript) | |
| Thermal (subscript) | |
| Maximum power point (subscript) | |
| Standard test conditions (subscript) | |
| Wind (subscript) | |
| vRES | Variable renewable energy source |
| AGC | Automatic generation control |
| CPP | Conventional power plant |
| DSO | Distribution system operator |
| ENTSO-E | European Network of Transmission System Operators for Electricity |
| MPP | Maximum power point |
| MSE | Mean squared error |
| PFC | Primary frequency control |
| PV | Photovoltaic |
| STC | Standard test conditions |
| TSO | Transmission system operator |
| VSWT | Variable-speed wind turbine |
| WPP | Wind power plant |
References
- Aquila, G.; de Oliveira Pamplona, E.; de Queiroz, A.R.; Junior, P.R.; Fonseca, M.N. An overview of incentive policies for the expansion of renewable energy generation in electricity power systems and the Brazilian experience. Renew. Sustain. Energy Rev. 2017, 70, 1090–1098. [Google Scholar] [CrossRef]
- Bjelic, I.B.; Ciric, R.M. Optimal distributed generation planning at a local level—A review of Serbian renewable energy development. Renew. Sustain. Energy Rev. 2014, 39, 79–86. [Google Scholar] [CrossRef]
- Zappa, W.; Van Den Broek, M. Analysing the potential of integrating wind and solar power in Europe using spatial optimisation under various scenarios. Renew. Sustain. Energy Rev. 2018, 94, 1192–1216. [Google Scholar] [CrossRef]
- Fernández-Guillamón, A.; Das, K.; Cutululis, N.A.; Molina-García, Á. Offshore wind power integration into future power systems: Overview and trends. J. Mar. Sci. Eng. 2019, 7, 399. [Google Scholar] [CrossRef] [Green Version]
- Beaudin, M.; Zareipour, H.; Schellenberglabe, A.; Rosehart, W. Energy storage for mitigating the variability of renewable electricity sources: An updated review. Energy Sustain. Dev. 2010, 14, 302–314. [Google Scholar] [CrossRef]
- Ulbig, A.; Borsche, T.S.; Andersson, G. Impact of low rotational inertia on power system stability and operation. IFAC Proc. Vol. 2014, 47, 7290–7297. [Google Scholar] [CrossRef] [Green Version]
- Bouffard, F.; Ortega-Vazquez, M. The value of operational flexibility in power systems with significant wind power generation. In Proceedings of the 2011 IEEE Power and Energy Society General Meeting, Detroit, MI, USA, 24–28 July 2011; pp. 1–5. [Google Scholar]
- Schaber, K.; Steinke, F.; Mühlich, P.; Hamacher, T. Parametric study of variable renewable energy integration in Europe: Advantages and costs of transmission grid extensions. Energy Policy 2012, 42, 498–508. [Google Scholar] [CrossRef] [Green Version]
- Osorio, S.; van Ackere, A. From nuclear phase-out to renewable energies in the Swiss electricity market. Energy Policy 2016, 93, 8–22. [Google Scholar] [CrossRef] [Green Version]
- Van Stiphout, A.; Poncelet, K.; De Vos, K.; Deconinck, G. The impact of operating reserves in generation expansion planning with high shares of renewable energy sources. In Proceedings of the IAEE European Energy Conference, Sustainable Energy Policy and Strategies for Europe, Rome, Italy, 28–31 October 2014; pp. 1–15. [Google Scholar]
- Rakhshani, E.; Rodriguez, P. Active power and frequency control considering large-scale RES. In Large Scale Renewable Power Generation; Springer: Berlin/Heidelberg, Germany, 2014; pp. 233–271. [Google Scholar]
- Fernández-Guillamón, A.; Gómez-Lázaro, E.; Muljadi, E.; Molina-Garcia, Á. A Review of Virtual Inertia Techniques for Renewable Energy-Based Generators. In Power Systems; IntechOpen: London, UK, 2020. [Google Scholar]
- Serban, I.; Teodorescu, R.; Marinescu, C. Energy storage systems impact on the short-term frequency stability of distributed autonomous microgrids, an analysis using aggregate models. IET Renew. Power Gener. 2013, 7, 531–539. [Google Scholar] [CrossRef]
- Adrees, A.; Milanovic, J.V. Study of frequency response in power system with renewable generation and energy storage. In Proceedings of the 2016 Power Systems Computation Conference (PSCC), Genoa, Italy, 20–24 June 2016; pp. 1–7. [Google Scholar]
- Hosseinipour, A.; Hojabri, H. Virtual inertia control of PV systems for dynamic performance and damping enhancement of DC microgrids with constant power loads. IET Renew. Power Gener. 2017, 12, 430–438. [Google Scholar] [CrossRef]
- Fernández-Guillamón, A.; Gómez-Lázaro, E.; Muljadi, E.; Molina-García, Á. Power systems with high renewable energy sources: A review of inertia and frequency control strategies over time. Renew. Sustain. Energy Rev. 2019, 115, 109369. [Google Scholar] [CrossRef] [Green Version]
- Alatrash, H.; Mensah, A.; Mark, E.; Haddad, G.; Enslin, J. Generator emulation controls for photovoltaic inverters. IEEE Trans. Smart Grid 2012, 3, 996–1011. [Google Scholar] [CrossRef]
- Zhang, X.; Chen, Y.; Wang, Y.; Zha, X.; Yue, S.; Cheng, X.; Gao, L. Deloading power coordinated distribution method for frequency regulation by wind farms considering wind speed differences. IEEE Access 2019, 7, 122573–122582. [Google Scholar] [CrossRef]
- Fang, X.; Krishnan, V.; Hodge, B.M. Strategic offering for wind power producers considering energy and flexible ramping products. Energies 2018, 11, 1239. [Google Scholar] [CrossRef] [Green Version]
- Yingcheng, X.; Nengling, T. Review of contribution to frequency control through variable speed wind turbine. Renew. Energy 2011, 36, 1671–1677. [Google Scholar] [CrossRef]
- Fernández-Guillamón, A.; Vigueras-Rodríguez, A.; Molina-García, Á. Analysis of power system inertia estimation in high wind power plant integration scenarios. IET Renew. Power Gener. 2019, 13, 2807–2816. [Google Scholar] [CrossRef]
- Martínez-Lucas, G.; Sarasúa, J.I.; Sánchez-Fernández, J.Á. Eigen analysis of wind–hydro joint frequency regulation in an isolated power system. Int. J. Electr. Power Energy Syst. 2018, 103, 511–524. [Google Scholar] [CrossRef]
- Martínez-Lucas, G.; Sarasúa, J.I.; Sánchez-Fernández, J.Á. Frequency regulation of a hybrid wind–hydro power plant in an isolated power system. Energies 2018, 11, 239. [Google Scholar] [CrossRef] [Green Version]
- Ullah, N.R.; Thiringer, T.; Karlsson, D. Temporary primary frequency control support by variable speed wind turbines—Potential and applications. IEEE Trans. Power Syst. 2008, 23, 601–612. [Google Scholar] [CrossRef]
- Pandey, S.K.; Mohanty, S.R.; Kishor, N. A literature survey on load–frequency control for conventional and distribution generation power systems. Renew. Sustain. Energy Rev. 2013, 25, 318–334. [Google Scholar] [CrossRef]
- Fernández-Guillamón, A.; Molina-García, A.; Vigueras-Rodríguez, A.; GÓmez-Lázaro, E. Frequency Response and Inertia Analysis in Power Systems with High Wind Energy Integration. In Proceedings of the 2019 International Conference on Clean Electrical Power (ICCEP), Otranto, Italy, 2–4 July 2019; pp. 388–393. [Google Scholar]
- Li, X.; Li, Y.; Han, X.; Hui, D. Application of fuzzy wavelet transform to smooth wind/PV hybrid power system output with battery energy storage system. Energy Procedia 2011, 12, 994–1001. [Google Scholar] [CrossRef] [Green Version]
- Nayeripour, M.; Hoseintabar, M.; Niknam, T. Frequency deviation control by coordination control of FC and double-layer capacitor in an autonomous hybrid renewable energy power generation system. Renew. Energy 2011, 36, 1741–1746. [Google Scholar] [CrossRef]
- Li, X.; Hui, D.; Lai, X. Battery energy storage station (BESS)-based smoothing control of photovoltaic (PV) and wind power generation fluctuations. IEEE Trans. Sustain. Energy 2013, 4, 464–473. [Google Scholar] [CrossRef]
- Ma, Y.; Yang, P.; Wang, Y.; Zhou, S.; He, P. Frequency control of islanded microgrid based on wind-PV-diesel-battery hybrid energy sources. In Proceedings of the 2014 17th International Conference on Electrical Machines and Systems (ICEMS), Hangzhou, China, 22–25 October 2014; pp. 290–294. [Google Scholar]
- Gatta, F.M.; Geri, A.; Lamedica, R.; Lauria, S.; Maccioni, M.; Palone, F.; Rebolini, M.; Ruvio, A. Application of a LiFePO4 battery energy storage system to primary frequency control: Simulations and experimental results. Energies 2016, 9, 887. [Google Scholar] [CrossRef] [Green Version]
- Krishnan, M.S.; Ramkumar, M.S.; Amudha, A. Frequency Deviation Control In Hybrid Renewable Energy System Using Fc-Uc. Int. J. Control Theory Appl. 2017, 10, 333–344. [Google Scholar]
- Salama, H.S.; Aly, M.M.; Vokony, I. Voltage/Frequency control of isolated unbalanced radial distribution system fed from intermittent wind/PV power using fuzzy logic controlled-SMES. In Proceedings of the 2019 International Conference on Innovative Trends in Computer Engineering (ITCE), Hangzhou, China, 22–25 October 2019; pp. 414–419. [Google Scholar]
- Das, S.; Akella, A. A fuzzy logic-based frequency control scheme for an isolated AC coupled PV-wind-battery hybrid system. Int. J. Model. Simul. 2020, 40, 308–320. [Google Scholar] [CrossRef]
- Marchese, K.; Pourmousavi, S.; Nehrir, M. The application of demand response for frequency regulation in an islanded microgrid with high penetration of renewable generation. In Proceedings of the 2013 North American Power Symposium (NAPS), Manhattan, KS, USA, 22–24 September 2013; pp. 1–6. [Google Scholar]
- Vahedipour-Dahraie, M.; Rashidizaheh-Kermani, H.; Najafi, H.R.; Anvari-Moghaddam, A.; Guerrero, J.M. Coordination of EVs participation for load frequency control in isolated microgrids. Appl. Sci. 2017, 7, 539. [Google Scholar] [CrossRef] [Green Version]
- Almi, M.; Arrouf, M.; Belmili, H.; Boulouma, S.; Bendib, B. Energy management of wind/PV and battery hybrid system. Int. J. New Comput. Archit. Appl. (IJNCAA) 2014, 4, 30–38. [Google Scholar] [CrossRef]
- Liu, Y.; You, S.; Liu, Y. Study of wind and PV frequency control in US power grids—EI and TI case studies. IEEE Power Energy Technol. Syst. J. 2017, 4, 65–73. [Google Scholar] [CrossRef]
- Vattigunta, R.R.; Rather, Z.H.; Gokaraju, R. Fast frequency support from hybrid solar PV and wind power plant. In Proceedings of the 2018 IEEE International Conference on Power Electronics, Drives and Energy Systems (PEDES), Chennai, India, 18–21 December 2018; pp. 1–6. [Google Scholar]
- Zarina, P.; Mishra, S.; Sekhar, P. Deriving inertial response from a non-inertial PV system for frequency regulation. In Proceedings of the 2012 IEEE International Conference on Power Electronics, Drives and Energy Systems (PEDES), Bengaluru, India, 16–19 December 2012; pp. 1–5. [Google Scholar]
- Zarina, P.; Mishra, S.; Sekhar, P. Photovoltaic system based transient mitigation and frequency regulation. In Proceedings of the 2012 Annual IEEE India Conference (INDICON), Kochi, India, 7–9 December 2012; pp. 1245–1249. [Google Scholar]
- Mishra, S.; Zarina, P.; Sekhar, P. A novel controller for frequency regulation in a hybrid system with high PV penetration. In Proceedings of the 2013 IEEE Power & Energy Society General Meeting, Vancouver, BC, Canada, 21–25 July 2013; pp. 1–5. [Google Scholar]
- Rahmann, C.; Castillo, A. Fast frequency response capability of photovoltaic power plants: The necessity of new grid requirements and definitions. Energies 2014, 7, 6306–6322. [Google Scholar] [CrossRef]
- Jietan, Z.; Linan, Q.; Pestana, R.; Fengkui, L.; Libin, Y. Dynamic frequency support by photovoltaic generation with “synthetic” inertia and frequency droop control. In Proceedings of the 2017 IEEE Conference on Energy Internet and Energy System Integration (EI2), Beijing, China, 26–28 November 2017; pp. 1–6. [Google Scholar]
- Jibji-Bukar, F.; Anaya-Lara, O. Frequency support from photovoltaic power plants using offline maximum power point tracking and variable droop control. IET Renew. Power Gener. 2019, 13, 2278–2286. [Google Scholar] [CrossRef] [Green Version]
- Li, Q.; Baran, M.E. A Novel Frequency Support Control Method for PV Plants using Tracking LQR. IEEE Trans. Sustain. Energy 2019. [Google Scholar] [CrossRef]
- Wilches-Bernal, F.; Chow, J.H.; Sanchez-Gasca, J.J. A fundamental study of applying wind turbines for power system frequency control. IEEE Trans. Power Syst. 2016, 31, 1496–1505. [Google Scholar] [CrossRef]
- Wang, Y.; Delille, G.; Bayem, H.; Guillaud, X.; Francois, B. High wind power penetration in isolated power systems—Assessment of wind inertial and primary frequency responses. IEEE Trans. Power Syst. 2013, 28, 2412–2420. [Google Scholar] [CrossRef]
- You, R.; Barahona, B.; Chai, J.; Cutululis, N.A. Frequency support capability of variable speed wind turbine based on electromagnetic coupler. Renew. Energy 2015, 74, 681–688. [Google Scholar] [CrossRef]
- Hafiz, F.; Abdennour, A. An adaptive neuro-fuzzy inertia controller for variable-speed wind turbines. Renew. Energy 2016, 92, 136–146. [Google Scholar] [CrossRef]
- Magnus, D.; Pfitscher, L.; Scharlau, C. A Synergy Analysis of Synthetic Inertia and Speed Controllers on Variable Speed Wind Turbines. In Proceedings of the 2019 IEEE PES Innovative Smart Grid Technologies Conference-Latin America (ISGT Latin America), Gramado, Brazil, 15–18 September 2019; pp. 1–6. [Google Scholar]
- Hafiz, F.; Abdennour, A. Optimal use of kinetic energy for the inertial support from variable speed wind turbines. Renew. Energy 2015, 80, 629–643. [Google Scholar] [CrossRef]
- Kang, M.; Kim, K.; Muljadi, E.; Park, J.; Kang, Y.C. Frequency Control Support of a Doubly-Fed Induction Generator Based on the Torque Limit. IEEE Trans. Power Syst. 2016, 31, 4575–4583. [Google Scholar] [CrossRef]
- Fernández-Guillamón, A.; Villena-Lapaz, J.; Vigueras-Rodríguez, A.; García-Sánchez, T.; Molina-García, Á. An Adaptive Frequency Strategy for Variable Speed Wind Turbines: Application to High Wind Integration Into Power Systems. Energies 2018, 11, 1436. [Google Scholar] [CrossRef] [Green Version]
- Fernández Guillamón, A. Análisis y Simulación de Estrategias Agregadas de Control de Frecuencia Entre Grandes Parques Eólicos y Aprovechamientos Hidroeléctricos. 2017. Available online: https://repositorio.upct.es/handle/10317/6222 (accessed on 10 July 2020).
- Mansoor, S.; Jones, D.; Bradley, D.A.; Aris, F.; Jones, G. Reproducing oscillatory behaviour of a hydroelectric power station by computer simulation. Control Eng. Pract. 2000, 8, 1261–1272. [Google Scholar] [CrossRef]
- O’Sullivan, J.; Rogers, A.; Flynn, D.; Smith, P.; Mullane, A.; O’Malley, M. Studying the maximum instantaneous non-synchronous generation in an island system—Frequency stability challenges in Ireland. IEEE Trans. Power Syst. 2014, 29, 2943–2951. [Google Scholar] [CrossRef] [Green Version]
- Sarasúa, J.I.; Martínez-Lucas, G.; Lafoz, M. Analysis of alternative frequency control schemes for increasing renewable energy penetration in El Hierro Island power system. Int. J. Electr. Power Energy Syst. 2019, 113, 807–823. [Google Scholar] [CrossRef]
- Fernández-Guillamón, A.; Vigueras-Rodríguez, A.; Gómez-Lázaro, E.; Molina-García, Á. Fast power reserve emulation strategy for VSWT supporting frequency control in multi-area power systems. Energies 2018, 11, 2775. [Google Scholar] [CrossRef] [Green Version]
- Kundur, P.; Balu, N.J.; Lauby, M.G. Power System Stability and Control; McGraw-Hill: New York, NY, USA, 1994; Volume 7. [Google Scholar]
- Pöller, M.; Achilles, S. Aggregated wind park models for analyzing power system dynamics. In Proceedings of the 4th International Workshop on Large-Scale Integration of Wind Power and Transmission Networks for Offshore Wind Farms, Billund, Denmark, 20–21 October 2003. [Google Scholar]
- Clark, K.; Miller, N.W.; Sanchez-Gasca, J.J. Modeling of GE wind turbine-generators for grid studies. GE Energy 2010, 4, 0885–8950. [Google Scholar]
- Zhao, S.; Nair, N.K. Assessment of wind farm models from a transmission system operator perspective using field measurements. IET Renew. Power Gener. 2011, 5, 455–464. [Google Scholar] [CrossRef]
- Fortmann, J. Modeling of Wind Turbines With Doubly Fed Generator System; Springer: Berlin/Heidelberg, Germany, 2014. [Google Scholar]
- Zarina, P.; Mishra, S.; Sekhar, P. Exploring frequency control capability of a PV system in a hybrid PV-rotating machine-without storage system. Int. J. Electr. Power Energy Syst. 2014, 60, 258–267. [Google Scholar] [CrossRef]
- Sekhar, P.; Mishra, S. Storage free smart energy management for frequency control in a diesel-PV-fuel cell-based hybrid AC microgrid. IEEE Trans. Neural Netw. Learn. Syst. 2015, 27, 1657–1671. [Google Scholar] [CrossRef]
- Martínez-Lucas, G.; Sarasúa, J.I.; Sánchez-Fernández, J.Á.; Wilhelmi, J.R. Power-frequency control of hydropower plants with long penstocks in isolated systems with wind generation. Renew. Energy 2015, 83, 245–255. [Google Scholar] [CrossRef] [Green Version]
- Mancarella, P.; Chicco, G.; Capuder, T. Arbitrage opportunities for distributed multi-energy systems in providing power system ancillary services. Energy 2018, 161, 381–395. [Google Scholar] [CrossRef]
- ENTSO-E. Electricity Balancing in Europe. Available online: https://docstore.entsoe.eu/ (accessed on 15 July 2020).
- Díaz-González, F.; Hau, M.; Sumper, A.; Gomis-Bellmunt, O. Participation of wind power plants in system frequency control: Review of grid code requirements and control methods. Renew. Sustain. Energy Rev. 2014, 34, 551–564. [Google Scholar] [CrossRef]
- Ersdal, A.M.; Imsland, L.; Uhlen, K. Model predictive load-frequency control. IEEE Trans. Power Syst. 2015, 31, 777–785. [Google Scholar] [CrossRef] [Green Version]
- ENTSO-E. ENTSO-E Network Code for Requirements for Grid Connection Applicable to all Generators. June 2011. Available online: https://consultations.entsoe.eu/ (accessed on 20 July 2020).
- Guo, F.; Wen, C.; Mao, J.; Song, Y.D. Distributed secondary voltage and frequency restoration control of droop-controlled inverter-based microgrids. IEEE Trans. Ind. Electron. 2014, 62, 4355–4364. [Google Scholar] [CrossRef]
- Zhao, C.; Mallada, E.; Low, S.H. Distributed generator and load-side secondary frequency control in power networks. In Proceedings of the 2015 49th Annual Conference on Information Sciences and Systems (CISS), Baltimore, MD, USA, 18–20 March 2015; pp. 1–6. [Google Scholar]
- Zhao, C.; Mallada, E.; Low, S.; Bialek, J. A unified framework for frequency control and congestion management. In Proceedings of the 2016 Power Systems Computation Conference (PSCC), Genoa, Italy, 20–24 June 2016; pp. 1–7. [Google Scholar]
- UCTE (Union for the Co-ordination of Transmission of Electricity). Operation Handbook. 2004. Available online: https://www.entsoe.eu/publications/system-operations-reports/operation-handbook (accessed on 17 July 2020).
- Wood, A.J.; Wollenberg, B.F.; Sheblé, G.B. Power Generation, Operation, and Control; John Wiley & Sons: Hoboken, NJ, USA, 2013. [Google Scholar]
- ENTSO-E. TYNDP 2020—Scenario Report. 2020. Available online: https://www.entsos-tyndp2020-scenarios.eu/wp-content/uploads/2020/06/TYNDP_2020_Joint_ScenarioReport_final.pdf (accessed on 1 July 2020).
- Fernández-Guillamón, A.; Sarasúa, J.I.; Chazarra, M.; Vigueras-Rodríguez, A.; Fernández-Muñoz, D.; Molina-García, A. Frequency control analysis based on unit commitment schemes with high wind power integration: A Spanish isolated power system case study. Int. J. Electr. Power Energy Syst. 2020, 121, 106044. [Google Scholar] [CrossRef]
- ENMAX. Available online: https://www.enmax.com/generation-wires/real-time-system-demand (accessed on 6 July 2020).
- ERGON. Available online: www.ergon.com.au/network/manage-your-energy/home-energy-tips/peak-demand-at-home/network-demand (accessed on 6 July 2020).
- RTE. Available online: https://www.rte-france.com/en/eco2mix/eco2mix-consommation-en (accessed on 6 July 2020).
- REE. Available online: https://demanda.ree.es/visiona/peninsula/demanda/tablas/2020-07-04/1 (accessed on 6 July 2020).
- IESO. Available online: http://www.ieso.ca/power-data (accessed on 6 July 2020).
- CAISO. Available online: http://www.caiso.com/TodaysOutlook/Pages/default.aspx (accessed on 6 July 2020).
- TEPCO. Available online: https://www4.tepco.co.jp/en/forecast/html/index-e.html (accessed on 6 July 2020).
- TRANSPOWER. Available online: https://www.transpower.co.nz/power-system-live-data (accessed on 6 July 2020).
- Martínez-Lucas, G.; Sarasúa, J.I.; Pérez-Díaz, J.I.; Martínez, S.; Ochoa, D. Analysis of the Implementation of the Primary and/or Inertial Frequency Control in Variable Speed Wind Turbines in an Isolated Power System with High Renewable Penetration. Case Study: El Hierro Power System. Electronics 2020, 9, 901. [Google Scholar] [CrossRef]
- ENTSO-E. Frequency Stability Evaluation Criteria for the Synchronous Zone of Continental Europe; ENTSO-E: Brussels, Belgium, 2016. [Google Scholar]







| Ref. | Type of Control | PV Integration (%) | (%) | Year |
|---|---|---|---|---|
| [40] | De-loading | 9 | 5 | 2012 |
| [41] | De-loading | 9 | 5 | 2012 |
| [42] | De-loading | 16 | – | 2013 |
| [43] | De-loading | 22 | 8.1 | 2014 |
| [44] | De-loading | 23–48 | 50 | 2017 |
| [45] | De-loading | 10–20–30 | 10 | 2019 |
| [46] | De-loading | 10 | 10 | 2019 |
| Ref. | Type of Control | VSWT Integration (%) | (%) | Year |
|---|---|---|---|---|
| [47] | De-loading (pitch) | — | — | 2016 |
| [48] | Droop | 11, 29.5 | 15 | 2013 |
| [49] | Hidden-inertia emulation | 20 | 8.3 | 2015 |
| [50] | Hidden-inertia emulation | — | 10 | 2016 |
| [51] | Hidden-inertia emulation | — | 10 | 2019 |
| [52] | Fast power reserve | 20 | 10 | 2015 |
| [53] | Fast power reserve | 16.7–33 | 16.7 | 2016 |
| [54] | Fast power reserve | 5–45 | 2.5–10 | 2018 |
| TSO | Location | Time (min) | Website |
|---|---|---|---|
| ENMAX | Canada | 15 | [80] |
| ERGON | Australia | 15 | [81] |
| RTE | France | 15 | [82] |
| REE | Spain | 10 | [83] |
| IESO | Canada | 5 | [84] |
| CAISO | California | 5 | [85] |
| TEPCO | Japan | 5 | [86] |
| TRANSPOWER | New Zealand | 5 | [87] |
| Scenario | Load (MW) | 250 | 400 | 550 | |||
|---|---|---|---|---|---|---|---|
| Year | 2025 | 2040 | 2025 | 2040 | 2025 | 2040 | |
| (Hz) | CPP | 49.28 | 44.89 | 49.31 | 46.24 | 49.34 | 45.74 |
| WPP | 49.54 | 48.49 | 49.55 | 48.59 | 49.57 | 48.63 | |
| PV (f) | 49.58 | 48.88 | 49.61 | 48.85 | 49.60 | 49.00 | |
| PV () | 49.58 | 48.94 | 49.61 | 48.87 | 49.61 | 49.20 | |
| (Hz) | CPP | 50.85 | 54.30 | 50.84 | 54.16 | 50.78 | 54.08 |
| WPP | 50.47 | 50.74 | 50.47 | 50.71 | 50.45 | 50.72 | |
| PV (f) | 50.26 | 50.41 | 50.29 | 50.48 | 50.32 | 50.48 | |
| PV () | 50.23 | 50.25 | 50.18 | 50.23 | 50.17 | 50.54 | |
| (Hz) | CPP | 0.072 | 1.481 | 0.069 | 1.123 | 0.063 | 1.154 |
| WPP | 0.035 | 0.243 | 0.034 | 0.216 | 0.032 | 0.203 | |
| PV (f) | 0.019 | 0.108 | 0.021 | 0.111 | 0.023 | 0.104 | |
| PV () | 0.015 | 0.087 | 0.014 | 0.082 | 0.015 | 0.085 | |
| (MWh) | CPP | 1.536 | 2.878 | 2.636 | 4.645 | 3.424 | 5.955 |
| WPP | 1.536 | 2.878 | 2.636 | 4.645 | 3.424 | 5.955 | |
| PV (f) | 1.269 | 2.391 | 2.251 | 3.930 | 3.096 | 5.010 | |
| PV () | 1.072 | 2.186 | 1.962 | 3.610 | 2.740 | 4.091 | |
| (MW) | CPP | 105.4 | 198.7 | 258.1 | 515.6 | 442.0 | 932.0 |
| WPP | 83.40 | 171.8 | 206.3 | 442.2 | 370.9 | 795.8 | |
| PV (f) | 56.98 | 128.2 | 143.9 | 320.5 | 290.7 | 555.3 | |
| PV () | 73.62 | 150.3 | 170.5 | 359.4 | 328.7 | 773.7 | |
| (MW) | CPP | 2.931 | 41.51 | 7.272 | 97.38 | 12.51 | 177.1 |
| WPP | 2.579 | 31.51 | 6.426 | 74.60 | 11.69 | 130.8 | |
| PV (f) | 2.029 | 20.28 | 4.939 | 49.68 | 9.798 | 81.92 | |
| PV () | 3.021 | 26.07 | 7.021 | 61.54 | 13.19 | 127.3 | |
| Scenario | Load (MW) | 250 | 400 | 550 | |||
|---|---|---|---|---|---|---|---|
| Year | 2025 | 2040 | 2025 | 2040 | 2025 | 2040 | |
| (pu) | CPP | 1.067 | 1.067 | 1.067 | 1.067 | 1.067 | 1.067 |
| WPP | 1.000 | 0.971 | 1.003 | 0.983 | 1.005 | 0.976 | |
| PV (f) | 1.024 | 1.000 | 1.019 | 1.001 | 1.016 | 0.995 | |
| PV () | 1.030 | 1.000 | 1.033 | 1.026 | 1.030 | 0.995 | |
| (pu) | CPP | 1.359 | 1.359 | 1.359 | 1.359 | 1.359 | 1.359 |
| WPP | 1.394 | 1.405 | 1.391 | 1.409 | 1.389 | 1.408 | |
| PV (f) | 1.381 | 1.399 | 1.385 | 1.405 | 1.385 | 1.403 | |
| PV () | 1.372 | 1.370 | 1.377 | 1.376 | 1.379 | 1.403 | |
| , (pu) | CPP | 3.631 | 2.649 | 2.649 | 2.649 | 2.479 | 2.649 |
| WPP | 4.406 | 6.485 | 4.081 | 5.582 | 4.098 | 5.966 | |
| PV (f) | 3.738 | 4.956 | 3.613 | 4.517 | 3.770 | 4.892 | |
| PV () | 3.631 | 4.551 | 3.497 | 3.985 | 3.589 | 5.075 | |
| Scenario | Load (MW) | 250 | 400 | 550 | |||
|---|---|---|---|---|---|---|---|
| Year | 2025 | 2040 | 2025 | 2040 | 2025 | 2040 | |
| (pu) | CPP | 1.052 | 1.052 | 1.052 | 1.052 | 1.038 | 1.052 |
| WPP | 1.011 | 0.885 | 1.014 | 0.945 | 1.015 | 0.919 | |
| PV (f) | 1.037 | 0.906 | 1.032 | 0.966 | 1.027 | 0.938 | |
| PV () | 1.043 | 0.891 | 1.041 | 0.945 | 1.040 | 0.926 | |
| (pu) | CPP | 1.327 | 1.327 | 1.327 | 1.327 | 1.327 | 1.327 |
| WPP | 1.407 | 1.385 | 1.406 | 1.389 | 1.404 | 1.389 | |
| PV (f) | 1.393 | 1.393 | 1.396 | 1.390 | 1.399 | 1.391 | |
| PV () | 1.348 | 1.373 | 1.355 | 1.376 | 1.360 | 1.403 | |
| , (pu) | CPP | 3.037 | 3.037 | 3.037 | 3.037 | 3.517 | 3.037 |
| WPP | 5.455 | 9.638 | 5.470 | 8.692 | 5.268 | 8.902 | |
| PV (f) | 4.485 | 7.363 | 4.663 | 7.191 | 4.718 | 7.317 | |
| PV () | 3.765 | 6.432 | 3.948 | 6.138 | 4.031 | 7.117 | |
| Scenario | Load (MW) | 250 | 400 | 550 | |||
|---|---|---|---|---|---|---|---|
| Year | 2025 | 2040 | 2025 | 2040 | 2025 | 2040 | |
| (pu) | CPP | 0.917 | 0.917 | 0.917 | 0.917 | 0.766 | 0.917 |
| WPP | 0.915 | 0.885 | 0.912 | 0.894 | 0.914 | 0.891 | |
| PV (f) | 0.917 | 0.902 | 0.914 | 0.917 | 0.915 | 0.912 | |
| PV () | 0.922 | 0.917 | 0.919 | 0.925 | 0.919 | 0.916 | |
| (pu) | CPP | 1.345 | 1.345 | 1.345 | 1.345 | 1.366 | 1.345 |
| WPP | 1.410 | 1.410 | 1.408 | 1.413 | 1.406 | 1.412 | |
| PV (f) | 1.386 | 1.414 | 1.390 | 1.410 | 1.395 | 1.414 | |
| PV () | 1.352 | 1.383 | 1.367 | 1.380 | 1.369 | 1.401 | |
| , (pu) | CPP | 11.778 | 11.778 | 11.778 | 11.778 | 24.351 | 11.778 |
| WPP | 13.636 | 15.890 | 13.653 | 15.304 | 13.572 | 15.314 | |
| PV (f) | 12.912 | 14.462 | 13.120 | 14.287 | 13.230 | 14.492 | |
| PV () | 11.394 | 12.575 | 11.650 | 12.774 | 11.803 | 13.708 | |
| Scenario | Load (MW) | 250 | 400 | 550 | |||
|---|---|---|---|---|---|---|---|
| Year | 2025 | 2040 | 2025 | 2040 | 2025 | 2040 | |
| (pu) | CPP | 0.925 | 0.925 | 0.925 | 0.925 | 0.925 | 0.925 |
| WPP | 0.946 | 0.817 | 0.947 | 0.865 | 0.945 | 0.848 | |
| PV (f) | 0.933 | 0.847 | 0.936 | 0.871 | 0.938 | 0.874 | |
| PV () | 0.924 | 0.866 | 0.925 | 0.879 | 0.926 | 0.895 | |
| (pu) | CPP | 1.332 | 1.332 | 1.332 | 1.332 | 1.323 | 1.332 |
| WPP | 1.376 | 1.455 | 1.377 | 1.431 | 1.373 | 1.443 | |
| PV (f) | 1.366 | 1.438 | 1.370 | 1.437 | 1.368 | 1.433 | |
| PV () | 1.356 | 1.440 | 1.361 | 1.436 | 1.361 | 1.427 | |
| , (pu) | CPP | 8.601 | 8.601 | 8.601 | 8.601 | 11.235 | 8.601 |
| WPP | 9.380 | 13.266 | 9.593 | 12.791 | 9.485 | 12.584 | |
| PV (f) | 9.113 | 11.317 | 9.300 | 11.347 | 9.276 | 11.096 | |
| PV () | 8.820 | 10.696 | 8.846 | 10.446 | 8.854 | 11.237 | |
© 2020 by the authors. Licensee MDPI, Basel, Switzerland. This article is an open access article distributed under the terms and conditions of the Creative Commons Attribution (CC BY) license (http://creativecommons.org/licenses/by/4.0/).
Share and Cite
Fernández-Guillamón, A.; Martínez-Lucas, G.; Molina-García, Á.; Sarasua, J.-I. Hybrid Wind–PV Frequency Control Strategy under Variable Weather Conditions in Isolated Power Systems. Sustainability 2020, 12, 7750. https://doi.org/10.3390/su12187750
Fernández-Guillamón A, Martínez-Lucas G, Molina-García Á, Sarasua J-I. Hybrid Wind–PV Frequency Control Strategy under Variable Weather Conditions in Isolated Power Systems. Sustainability. 2020; 12(18):7750. https://doi.org/10.3390/su12187750
Chicago/Turabian StyleFernández-Guillamón, Ana, Guillermo Martínez-Lucas, Ángel Molina-García, and Jose-Ignacio Sarasua. 2020. "Hybrid Wind–PV Frequency Control Strategy under Variable Weather Conditions in Isolated Power Systems" Sustainability 12, no. 18: 7750. https://doi.org/10.3390/su12187750
APA StyleFernández-Guillamón, A., Martínez-Lucas, G., Molina-García, Á., & Sarasua, J.-I. (2020). Hybrid Wind–PV Frequency Control Strategy under Variable Weather Conditions in Isolated Power Systems. Sustainability, 12(18), 7750. https://doi.org/10.3390/su12187750


