Article

Research on the Transmission Ability of China’s Thermal Coal Price Information Based on Directed Limited Penetrable Interdependent Network

1
Energy Development and Environmental Protection Strategy Research Center, Jiangsu University, Zhenjiang 212013, China
2
Energy Interdependence Behavior and Strategy Research Center, School of Mathematical Sciences, Nanjing Normal University, Nanjing 210046, China
3
School of Mathematical Science, Taizhou Institute of Sci. & Tech., NUST, Taizhou 225300, China
*
Author to whom correspondence should be addressed.
Sustainability 2020, 12(18), 7815; https://doi.org/10.3390/su12187815
Submission received: 11 August 2020 / Revised: 7 September 2020 / Accepted: 16 September 2020 / Published: 22 September 2020

Abstract

:
According to the criterion of the visibility graph and the irreversibility of the time series, this paper proposes a new perspective to construct the directed limited penetrable interdependent network (DLPIN) for thermal coal between the opening and closing price series after the Johansen cointegration test. The results of the statistical research and cointegration analysis show that there is a cointegration relationship between the opening and the closing price series, and the relationship between them does not follow a normal distribution. By analyzing the topological characteristic of the DLPIN, the results indicate that there is an obvious "community structure" and scale-free features, which show that there are groups and differences among the thermal coal price, and most of them have a weak transmission ability of the thermal coal price information; only a few of them have a strong transmission ability. The differences of the in-degree and out-degree show that some thermal coal prices have a weak influence on the other prices but are strongly affected by the other prices. In addition, most of the thermal coal prices are far away from the infectious source of the price information; only a few are close to the infectious source of the price information to a certain extent. Obviously, the influence of the thermal coal price has a certain range, which is closely related in a short distance. Furthermore, these results can reveal the internal laws of the main price fluctuation and information transmission for the thermal coal, and some references can be provided to reduce risk investment and improve capital return for the related investors.

1. Introduction

Thermal coal refers to the coal that is used as the raw material of power in the way of combustion, which is the core strategic resource of coal resources and occupies the main position in China. According to the BP Statistical Review of World Energy 2019 (68th edition), China remains the world’s largest energy consumer and has been the main source of the global energy growth for 18 consecutive years, accounting for 24% of the global energy consumption and 34% of the global energy consumption growth, and coal consumption increased by 1.4%, twice the average growth rate in the past decade. Although the coal is still the main fuel of the energy consumption in China, the share of coal in China’s primary energy structure has dropped from 72% ten years ago and 60% in 2017 to 58% in 2018 with the continuous improvement of the energy structure, which hit a record low. Meanwhile, driven by the huge domestic energy demand, the supply of coal continued to rise (+4.7%) since the supply side reform in 2016, and China expanded its coal import scale for the second consecutive year. Obviously, Chinese coal prices are affected not only by their own prices, but also by the international coal prices, which increased the uncertainty of coal price change and the investment risk of coal industry. The thermal coal price fluctuation can not only accurately reflect the change of coal price [1], but also affect the economic development [2,3,4] and the ecological environment [5]. With the separation of the supply and demand in space, China’s power producers may increase the proportion of imported thermal coal if the cost of the domestic transportation is too high, and then the increase of China’s imported thermal coal may cause significant changes in the global cost coal market. Therefore, the study on thermal coal price is of great significance to understand the trend of coal price change, alleviate the contradiction between the supply and demand, guarantee the power production system, protect the environment, and promote economic development [6].
Primary energy plays an important role in the global energy market. As a major source of primary energy, coal has been widely used and consumed due to its abundant reserve, and plays an important role in the global energy field and the growth of international trade. The global thermal coal market has already developed [7], and many scholars consider the international coal market to be well-integrated [8,9,10,11,12]. Yang et al. [13] analyzed China’s coal price disturbances from the observations, explanations, and implications. Batten et al. [14] used a variety of measures to examine the degree of integration for the global steam coal market. Zaklan et al. [15] conducted a comprehensive multi-co-integration analysis on the export, transportation, and import prices in the value chain of thermal coal, and investigated whether the logistics entered the coal price dynamics through the transportation cost. Matyjaszek et al. [16] forecasted the coal prices by considering the full time series and the transgenic time series. Papież and Śmiech [17] analyzed the correlation between the average price return rate and the volatility spillover by discussing the integration of the thermal coal market, then they evaluated the dynamics of the integration process of the international thermal coal price, and investigated the changes in the roles of particular coal prices in this market based on the change of the supply and demand structure [18]. From the perspective of market forces, Cui and Wei [1] studied the phenomenon of thermal coal price distortion by the means of the empirical cointegration analysis and economic theoretical modeling. In recent years, the coal price has a great fluctuation, which leads to the uncertainty of the coal purchase decision. Considering the risk brought by the fluctuation of coal price and reducing the cost and management risk, Huang and Wu [19] employed the scenario analysis method to simulate the change rule of the factors affecting coal procurement, and established the model of the thermal coal procurement. Śmiech et al. [20] analyzed the relationship between the prices of the thermal coal in the Atlantic and Pacific Basin in detail, which showed that there was no instantaneous causal relationship between the two importing regions of Asia and Europe, and the Pacific Basin played a leading role in determining the thermal coal price. Moreover, other research results have emerged in the analysis and prediction of coal prices [21,22,23].
A large number of fossil fuels are adopted with the economic development and the strong growth of global energy demand, which led to the increase of the greenhouse gas emissions in the atmosphere. The related research results have also been widely reported. Haftendorn et al. [24] used the coal mod-world model of the global thermal coal market to evaluate the possible interaction between the climate policy and global thermal coal market, which indicated that the market regulation effects of coal market had a significant positive and negative impact on the effectiveness of the climate policy. In addition, 50% of the total anthropogenic mercury emission in China is one of the largest sources of mercury emission in China. Wang and Luo [25] studied the mercury emissions from the combustion of thermal coal and household coal in China, and found that the atmospheric mercury emissions account for about one-half of the total atmospheric mercury emissions from the combustion of the thermal coal, household coal, and coal gangue. Based on the economic impact of the efforts made by Kyoto Protocol and the European Union Emissions Trading System to mitigate the climate change, Schernikau [26] analyzed the recent trend of the thermal coal market, and qualitatively discussed the global thermal coal trading market with the help of a non-linear model. Li [27] investigated the evolution of international thermal coal trade, the nature of the coal trade contracts, and the pricing mechanism of the two major coal trade areas in the Atlantic and Asia Pacific, and discussed the historical development and future development direction of the market.
With the sustainable development of economy, the application of complex network appears in almost every aspect of science and technology. The interdisciplinary field of network science has attracted great attention in recent years. Although most results in this field were obtained by analyzing isolated networks, many real-world networks actually interacted with and depended on other networks [28,29]. Based on the criterion of the visibility graph and the irreversibility of the time series, this paper presents a new perspective to construct the network between different time series, which means that it is a new attempt to construct multi-layer network among the multiple time series. According to these, the directed limited penetrable interdependent network (DLPIN) is constructed for thermal coal between the opening price and closing price, and we analyze the importance, the value and potential value of the nodes, and the transmission ability of the thermal coal price information by the means of the degree (including the in-degree and out-degree), the betweenness centrality, the closeness centrality, the eigenvector centrality, and the authority and the hub of the nodes in the DLPIN. Meanwhile, we explore the closeness of the relationship between the node and its adjacent nodes based on the clustering coefficient. This paper aims to explore the following topics:
In regards the different time series, how can the interdependent network of the thermal coal price information be constructed?
Can it more effectively excavate the influence of the thermal coal price fluctuation by constructing the interdependent network at different times?
What are the rules and mechanisms of the transmission ability for the thermal coal price information at different times?
What are the relationships among the thermal coal prices, and what is the influence of the early price on the later price?
This paper constructs the DLPIN of the thermal coal price fluctuation by the criterion of the visibility graph and the irreversibility of the time series. The structure of this paper is as follows: Section 2 explains the processing data and constructing network, which introduces the source of the data, processing methods, and the rules of the constructing network. Section 3 analyzes the DLPIN of the thermal coal price information. In Section 4, the conclusions and implications are given.

2. Analyzing Data and Constructing Network

2.1. The Source, Stationarity Tests, and Processing About the Data

2.1.1. The Source and Basic Statistical Analysis of the Data

In this paper, the opening and closing prices (from 26 September 2013 to 1 July 2019) of main thermal coal futures in Zhengzhou Commodity Exchange are selected as the research data, and the fluctuation trends are shown in Figure 1a,b.
According to Figure 1, it can be found that the maximum and minimum opening prices of the thermal coal are 690.4 (the date: 18 December 2017) and 282.6 (the date: 25 November 2015), while the maximum and minimum closing prices are 695.6 (the date: 18 December 2017) and 283.2 (the date: 24 November 2015), respectively. In addition, the opening and closing prices of the thermal coal are consistent in the fluctuation behavior, that is, the fluctuation trend of the opening price series (OPS) and closing price series (CPS) has a high similarity. However, some features can be obtained based on the statistical analysis of the data, and the basic statistical characteristics of the thermal coal price in different times are given, as shown in Table 1.
The closing price has a higher maximum, minimum, and mean, and a relativity high standard deviation, which indicates that the CPS has a large fluctuation. The opening and closing prices are all negatively skewed, which shows that the price data on the left side of the average value is less than that on the right side, the intuitive performance is that the tail on the left side is longer than that on the right side, because there are a few variables whose values are very small, which makes the left tail of the curve drag very long. In addition, the opening and closing price distributions peak at a level lower than the normal distribution (whose peak is 3). According to the Jarquee-Bera test, the abnormal distribution of the opening and closing price is confirmed by the statistics.
To explore the relationship of the thermal coal price in China, a cointegration analysis between the OPS and the CPS is carried out. Cointegration test requires the order of the OPS and CPS to be consistent. Therefore, the stationarity tests (including Augmented Dickey-Fuller (ADF), Phillips-Perron (PP), Kwiatkowski–Phillips–Schmidt–Shin (KPSS)), and Elliott-Rothenberg-Stock Point-optimal (ERS)) are carried out on the OPS and CPS before performing cointegration test, as shown in Table 2.
To investigate the order of integration of the OPS and CPS, we have carried out some stationarity tests on them, and the test results are shown in Table 2, which indicate that, in general, they are integrated at order one (I(1)); this means that their first differenced series are stationary. Therefore, the results suggest that the OPS and CPS meet the preliminary condition for carried out cointegration test.
After the order of integration among the test OPS and CPS was determined by the stationarity test, we carried out the Johansen [30] cointegration test to investigate the nexus between the OPS and CPS, which is carried out based on the following vector error correction model of order μ :
Ψ t = α β   Ψ t 1 + i = 1 μ 1 Φ i Δ Ψ t i + η 0 + δ t , t = 1 , 2 , , T ,
where, Ψ t is an m-dimensional column vector of test variables, α and β are m × r matrices with r cointegrating ranks, η 0 is a constant vector, δ t i . i . d . N m ( 0 , Ω ) , and T is the number of observations. Gi and W are m × m fixed matrices. Denoting Π = α β , the Johansen cointegration test identifies cointegration relationships by the rank of the Π matrix. In our study, we focus on the bivariate cointegration test, so when the rank of Π is one, it implies that the variables are cointegrated. The rank is identified by the following trace and maximum eigenvalue test statistics:
λ T r a c e ( r ) = T i = r + 1 n l n ( 1 λ ^ r + 1 ) ,
λ M a x ( r , r + 1 ) = T l n ( 1 λ ^ r + 1 ) ,
where, λ ^ i denotes the estimated values of eigenvalues. The lag order of the Johansen cointegration model is determined by the Schwarz information criterion, which are shown in Table 3.
Table 3 illustrates the results of the Johansen cointegration test, which indicates that there is a cointegration between the OPS and CPS. It can be seen that the cointegration relationship between the OPS and CPS can be obtained by the econometrics, which is also the basis for us to establish an interdependent network between them. In addition, the relationships between the OPS and the CPS can be further analyzed by the Bierens-Martins test and Gregory-Hansen test, but these are not the subject to be studied in the text. On these foundations, the fluctuation state of the OPS and CPS will be explored by constructing the DLPINs based on the network science.

2.1.2. The Processing of the Data

In order to clarify the corresponding relationship between the network nodes and the price time series, the price time series are numbered, that is, the corresponding number of the opening price time series is 1–1405 from 26 September 2013 to 1 July 2019, and the corresponding number of the closing price time series is 1406–2810 from 26 September 2013 to 1 July 2019, which is the name of the corresponding nodes. According to the Equation (4), the OPS and CPS are standardized, the value of which is from 0.2 to 0.9.
X i = 0.2 + x i m i n ( x i ) M a x x ( x i ) m i n ( x i ) × ( 0.9 0.2 ) ,
where, x i represents the price series of the thermal coal, X i represents the standardized price series.
Therefore, the corresponding relationship between the standardized price series and the number series is obtained, as shown in Table 4.

2.2. The Constructing Network

2.2.1. The Definition of the Network Node

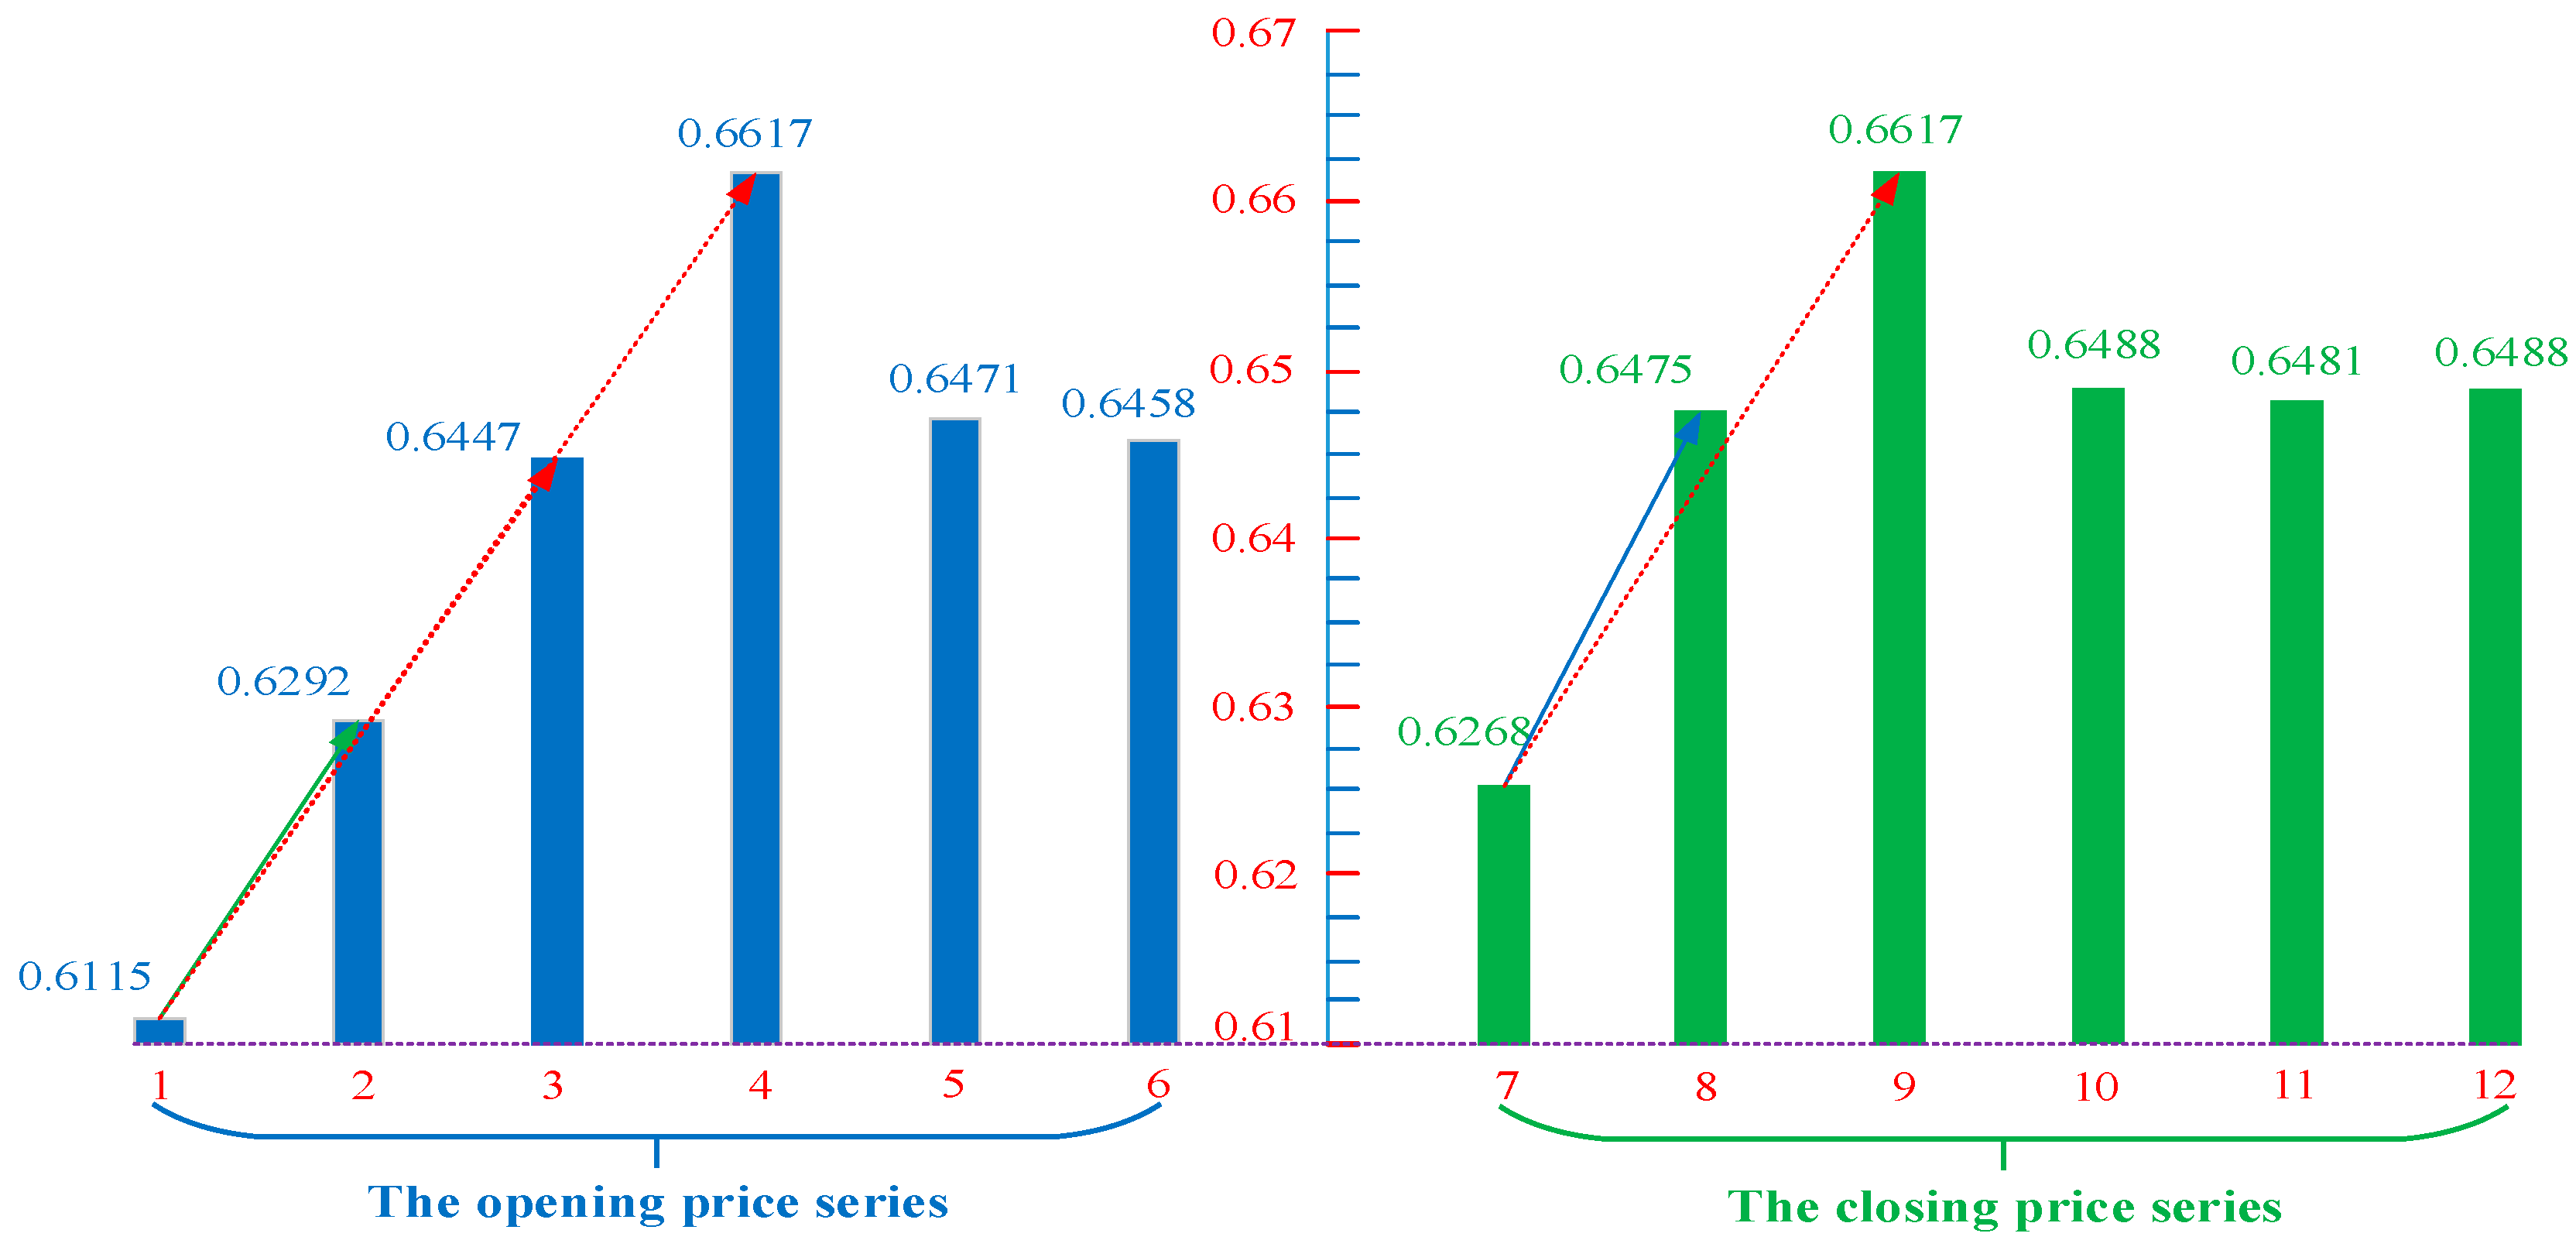
According to the corresponding relationship between the price series (which is standardized and shown in X i ) and the number series, a network with 2810 nodes obtained, where nodes 1–1405 are the corresponding nodes of the opening price series (OPS) for the thermal coal in the network, nodes 1406–2810 are the corresponding nodes of the closing price series (CPS) for the thermal coal, then the number series are the node names of the network, as shown in Figure 2.

2.2.2. The Rules of the Constructing Network

In the interdependent network, the edge connecting the internal nodes of the sub-network is called the internal connection edge, and the connection edge generated between the subnetworks is called the external connection edge, which together constitute the backbone structure of the interdependent network.
The criterion of the DLPIN is as follows: As for the time series X = { X i } , i = 1 , 2 , , n , and N is the distance of the limited penetrable visibility, if the data points ( t a , X a ) and ( t b , X b ) separated by m data points are visible in the discrete time series ( X ) , then there are k data points between the two data points, which satisfy Equation (5):
{ X a X i t i t a < X a X b t b t a , t a < t i < t b ,
and other m k data points ( t j , X j ) satisfy Equation (6):
{ X a X j t j t a < X a X b t b t a , t a < t j < t b ,
where, b = a + m , m > 0 , N 0 .
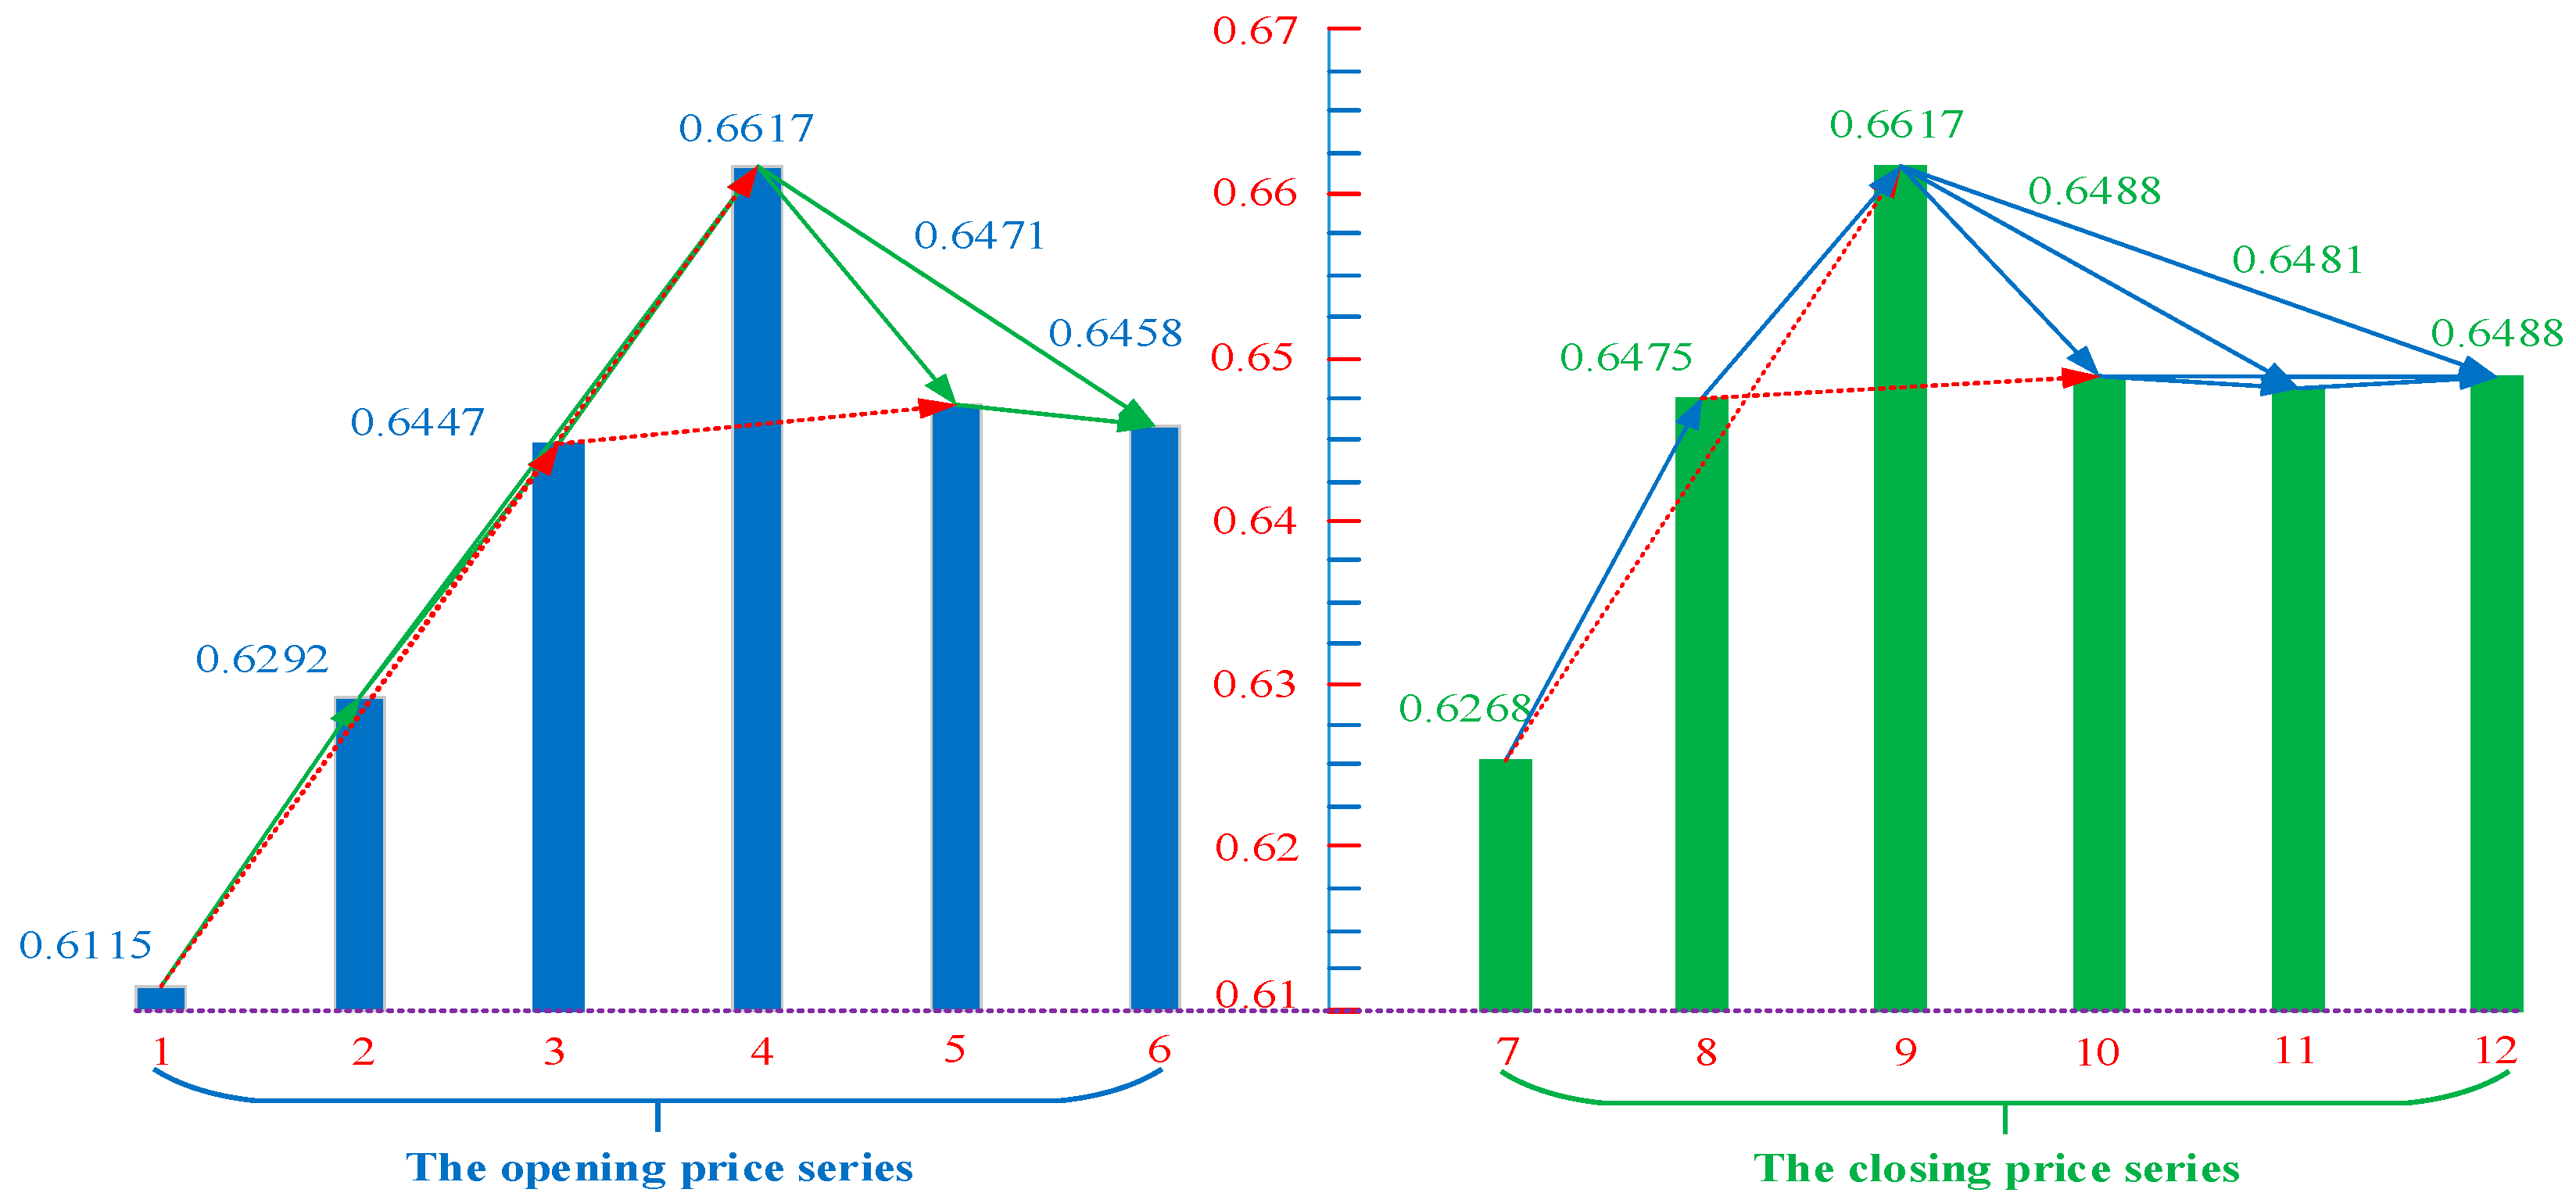
According to Equations (5) and (6) based on the criteria of the directed limited penetrable visibility graph [31,32] and the irreversibility of the time series, the DLPIN of the opening and closing price for thermal coal is constructed in this paper, and the rule of the network construction is different between the same price series and different price series, whose specific algorithm is shown in the Algorithm 1. (In order to show their rules and differences, the first six data in the OPS and CPS are taken as an example.)
Algorhitm 1. Construction process the edge between the node (ti, Xi) and (ti+j, Xi+j), 1 i < i + j n
1: As for the adjacent nodes:
2: for i = 1:n − 1
3: [(ti, Xi), (ti+1, Xi+1)] = 1
4: end
5: As for the non-adjacent nodes, when N = 0:
6: for i = 1:n − 1% Note: The adjacent nodes are visible
7: [(ti, Xi), (ti+1, Xi+1)] = 1;
8: for j = 2:ni
9: X1 = [Xi+jXi]/j;
10: N = 0;
11: for u = 1:j − 1% Note: Whether the node blocks the their visibility (ti, Xi) and (ti+j, Xi+j).
12: X2 = [Xi+uXi]/u;
13: if (X2 > X1) % Note: Blocked
14: N = N + 1;
15: [(ti, Xi), (ti+j Xi+j] = 0;
16: elseif N > 1
17: break;
18: end
19: end
20: if (N = 0) % Note: The node (ti, Xi) and (ti+j, Xi+j) are not blocked.
21: [(ti, Xi), (ti+j Xi+j] = 1;
22: elseif (N > = 1)
23: [(ti, Xi), (ti+j Xi+j] = 0;
24: end
25: end
26: end
27: As for the non-adjacent nodes, and when N = 1:
28: for i = 1:n − 1% Note: The adjacent nodes are visible.
29: [(ti, Xi), (ti+1, Xi+1)] = 1;
30: for j = 2:ni
31: X1 = [Xi+jXi]/j;
32: N = 0;
33: for u = 1:j − 1% Note: Whether the node blocks the their visibility (ti, Xi) and (ti+j, Xi+j).
34: X2 = [Xi+uXi]/u;
35: if (X2 > X1) % Note: Blocked
36: N = N + 1;
37: [(ti, Xi), (ti+j Xi+j] = 1;
38: elseif N > = 2
39: break;
40: end
41: end
42: if (N == 0) % Note: The node (ti, Xi) and (ti+j, Xi+j) are not blocked.
43: [(ti, Xi), (ti+j Xi+j] = 1;
44: elseif (N == 1)
45: [(ti, Xi), (ti+j Xi+j] = 1;
46: end
47: end
48: end
(1) Constructing the network with the same price series
According to the directed limited penetrable visibility algorithm, the networks of the OPS and CPS are constructed, and the limited visibility distance is N = 1 .
According to the irreversibility of the time series (that is, the early price can affect the later price, but the later price cannot affect the earlier price), the node ( N 1 ) of the OPS is selected to carry out directed limited penetrable criterion for the later nodes N 2 , N 3 , , N 6 , respectively. Then the node ( N 1 ) and the nodes N 2 , N 3 , N 4 generate the connected edge, and the direction is from the node ( N 1 ) to the nodes N 2 , N 3 , N 4 , as shown in Figure 3.
Each of the remaining nodes is carried out in this process for the OPS. Similarly, the CPS are treated the same way. According to this progress, the directed limited penetrable visibility graph of the OPS and CPS can be given, as shown in Figure 4.
Here, the solid line represents the connected edge which is not blocked, and the dotted line represents the connected edge which is blocked once, that is, N = 1 .
(2) Network construction between the OPS and CPS
The correlation is relatively weak between the different price series, which reduces the tightness between the OPS and CPS. Therefore, the network is constructed based on the directed non-penetrable algorithm, where the distance is N = 0 . Due to the difference in the opening and closing price time of the day, there are differences in the connection of the directed edges among different price series. For the difference, the algorithm is carried out in the following two situations.
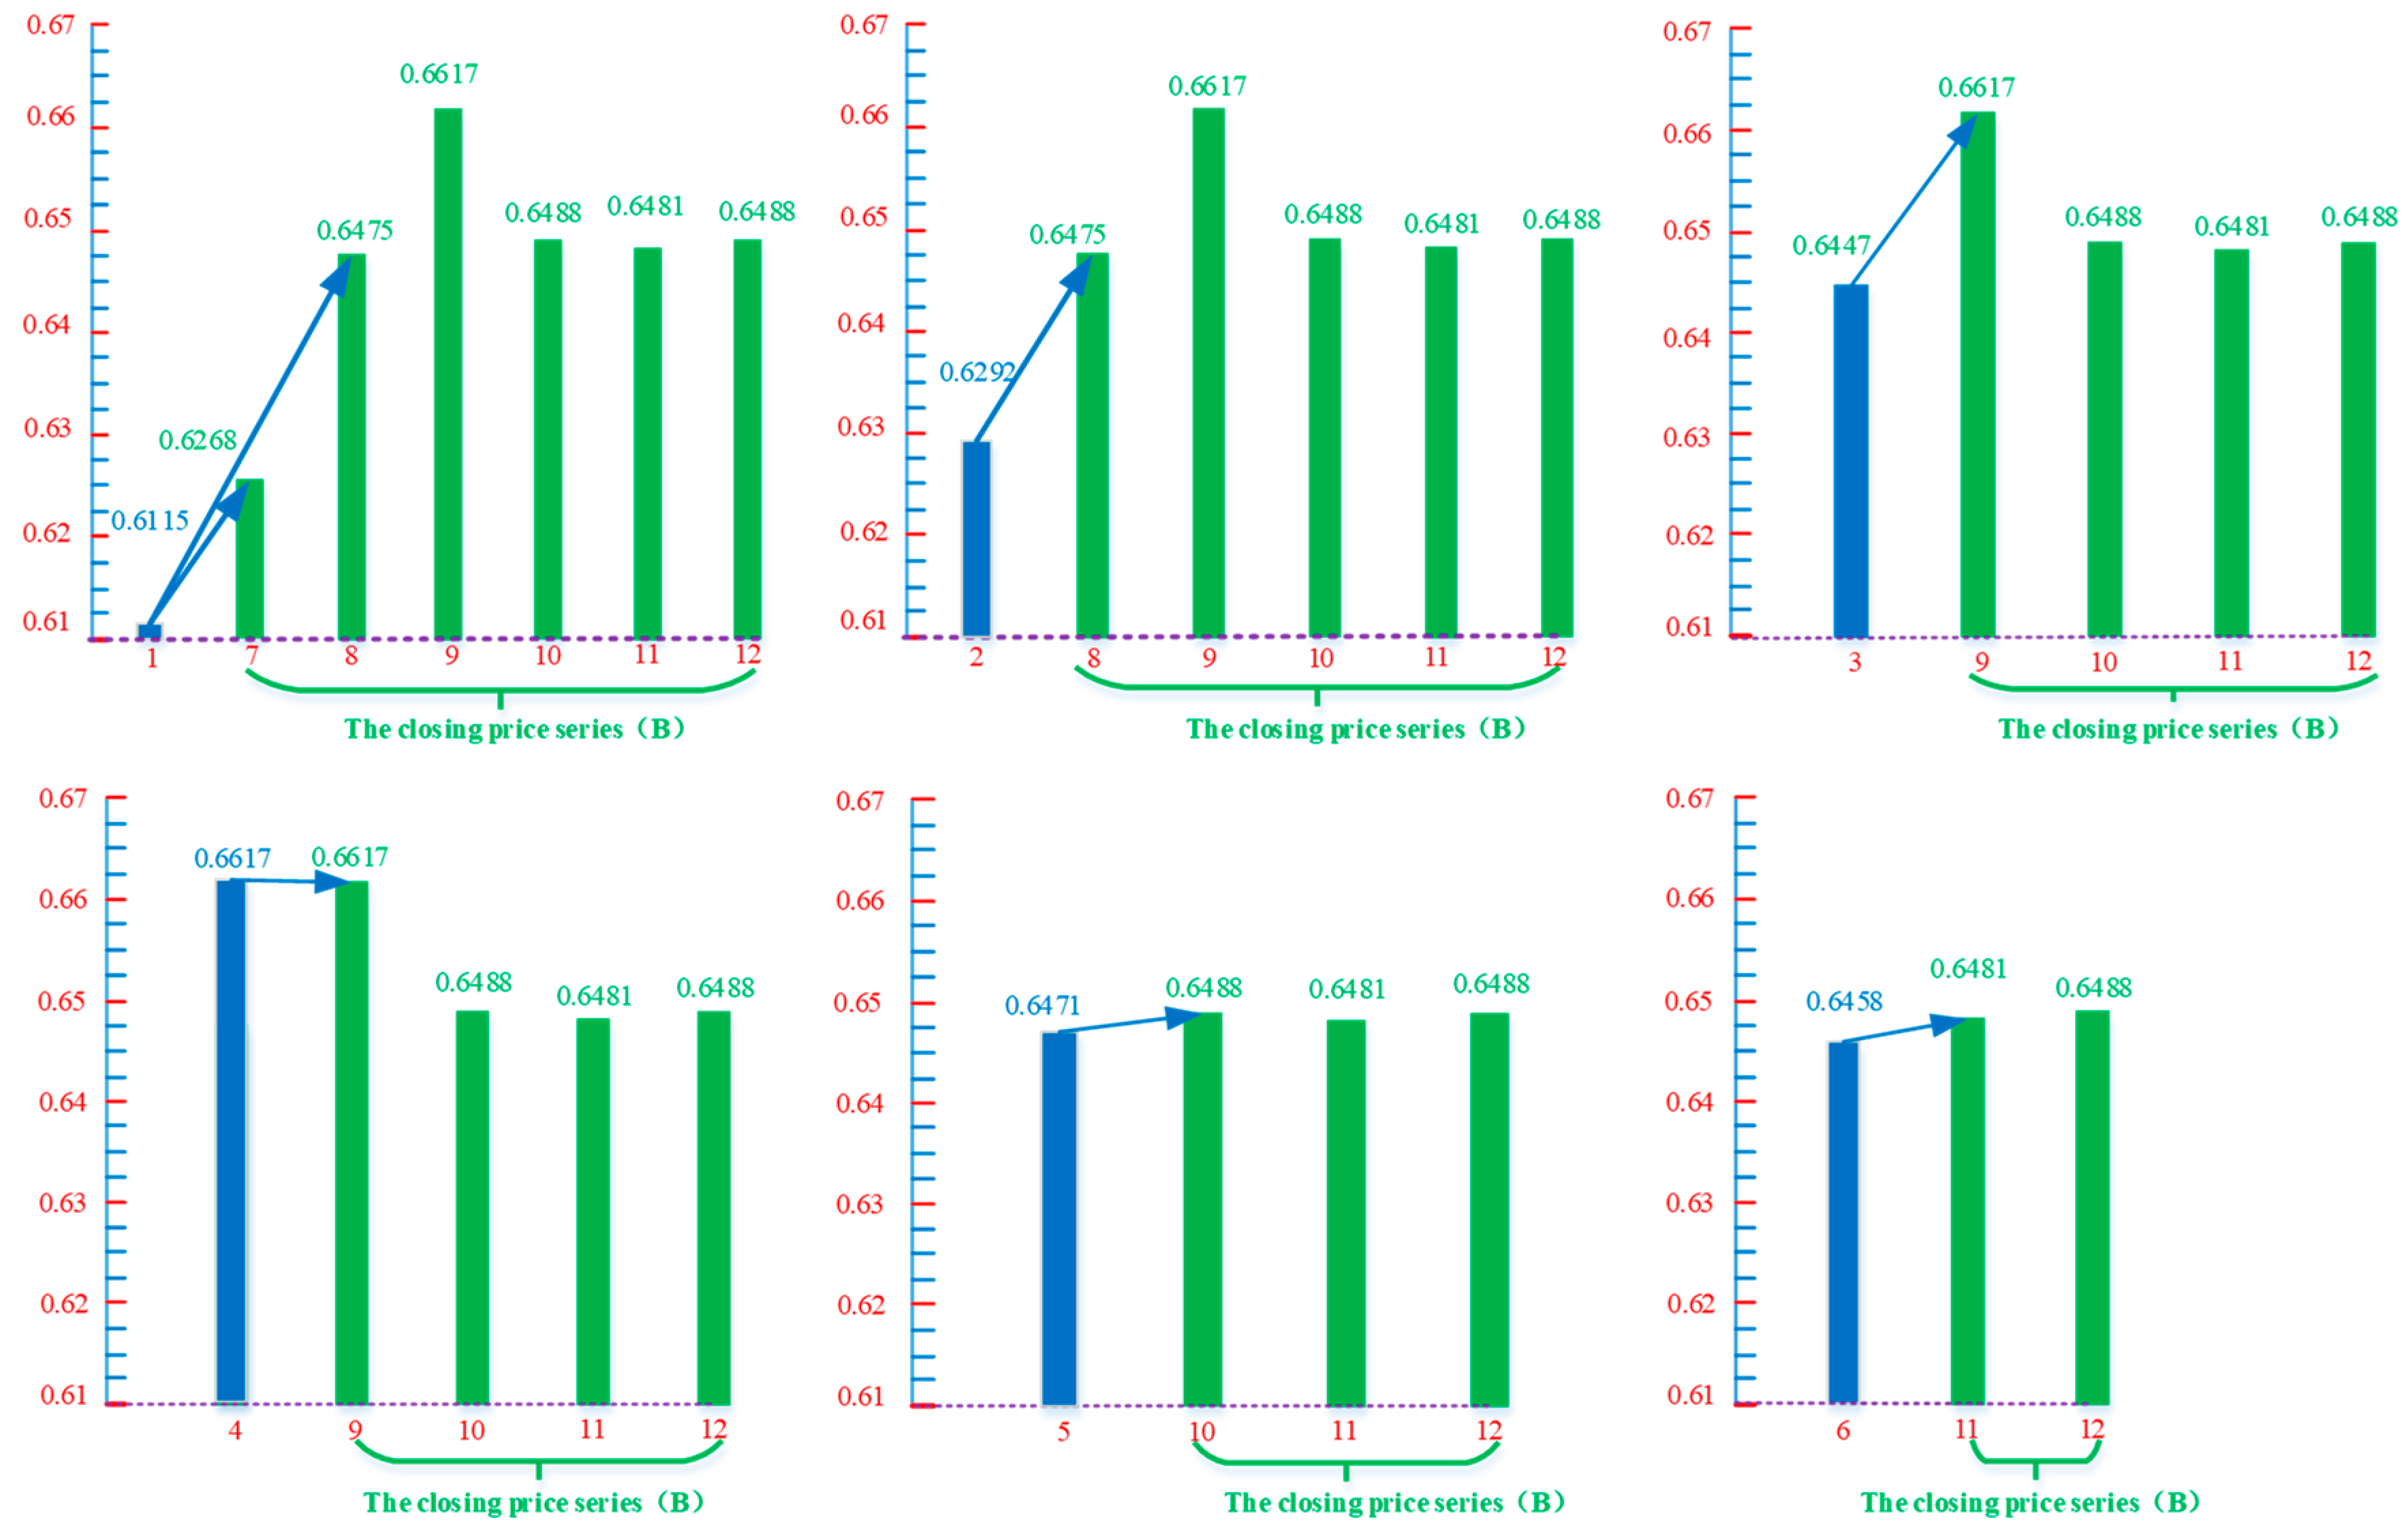
(a) According to the OPS and CPS, it can be found that the OPS of the day can affect the CPS of the day and after. Therefore, the node ( N 1 ) of the OPS conducts directed non-penetrable algorithm to the nodes ( N 7 , N 8 , , N 12 ) of the CPS, respectively.
According to these, there is a directed connection between the node ( N 1 ) and the nodes ( N 7 , N 8 ) from the node ( N 1 ) to the nodes ( N 7 , N 8 ) . This follows that the node ( N i , 1 i 6 ) of the OPS conducts directed non-penetrable algorithm to the nodes ( N i + 6 , N i + 1 + 6 , , N 12 ) of the CPS (as shown in Figure 5), respectively.
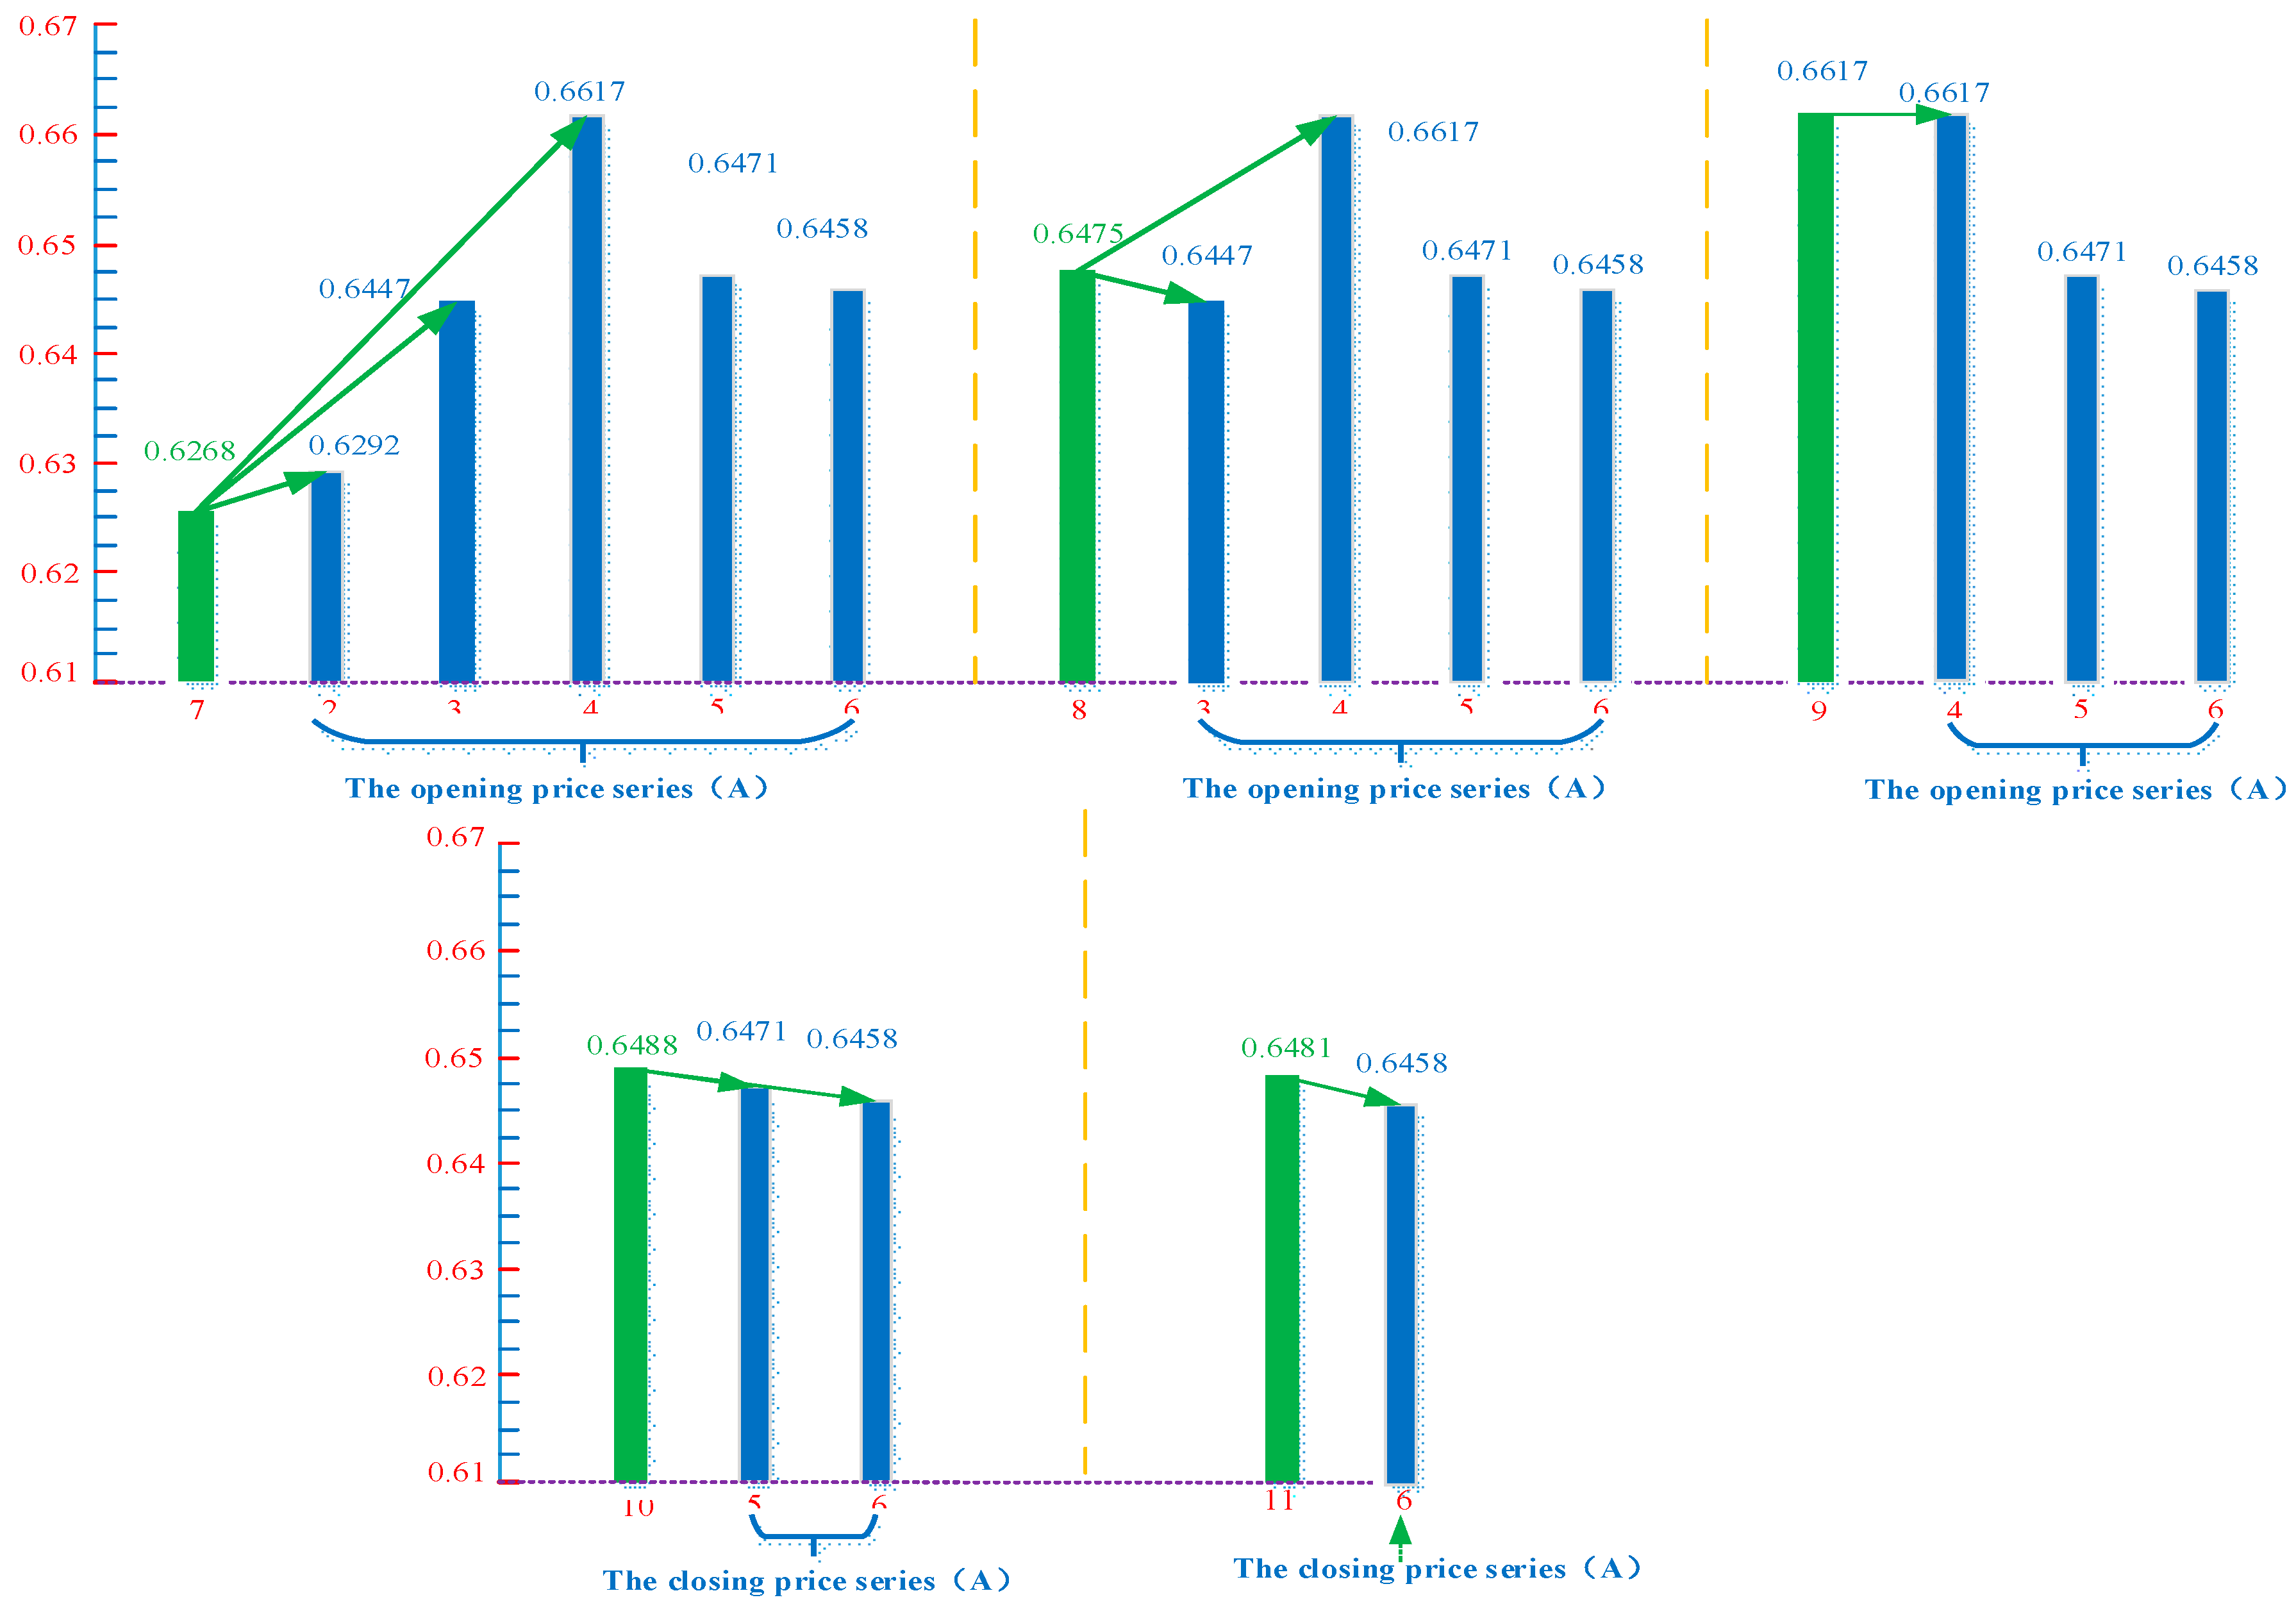
(b) According to the OPS and CPS, it can be found that the CPS of the day can just affect the OPS of the next day and after. Therefore, the node ( N 7 ) of the CPS conducts directed non-penetrable algorithm to the nodes ( N 2 , N 3 , , N 6 ) of the OPS, respectively. Then there is a directed connection between the node ( N 7 ) and the nodes ( N 2 , N 3 , N 4 ) from the node ( N 7 ) to the nodes ( N 2 , N 3 , N 4 ) . And so on, the node ( N i , 7 i 11 ) of the OPS conducts directed non-penetrable algorithm to the nodes ( N i 5 , N i 4 , , N 6 ) of the CPS, respectively, as shown in Figure 6.
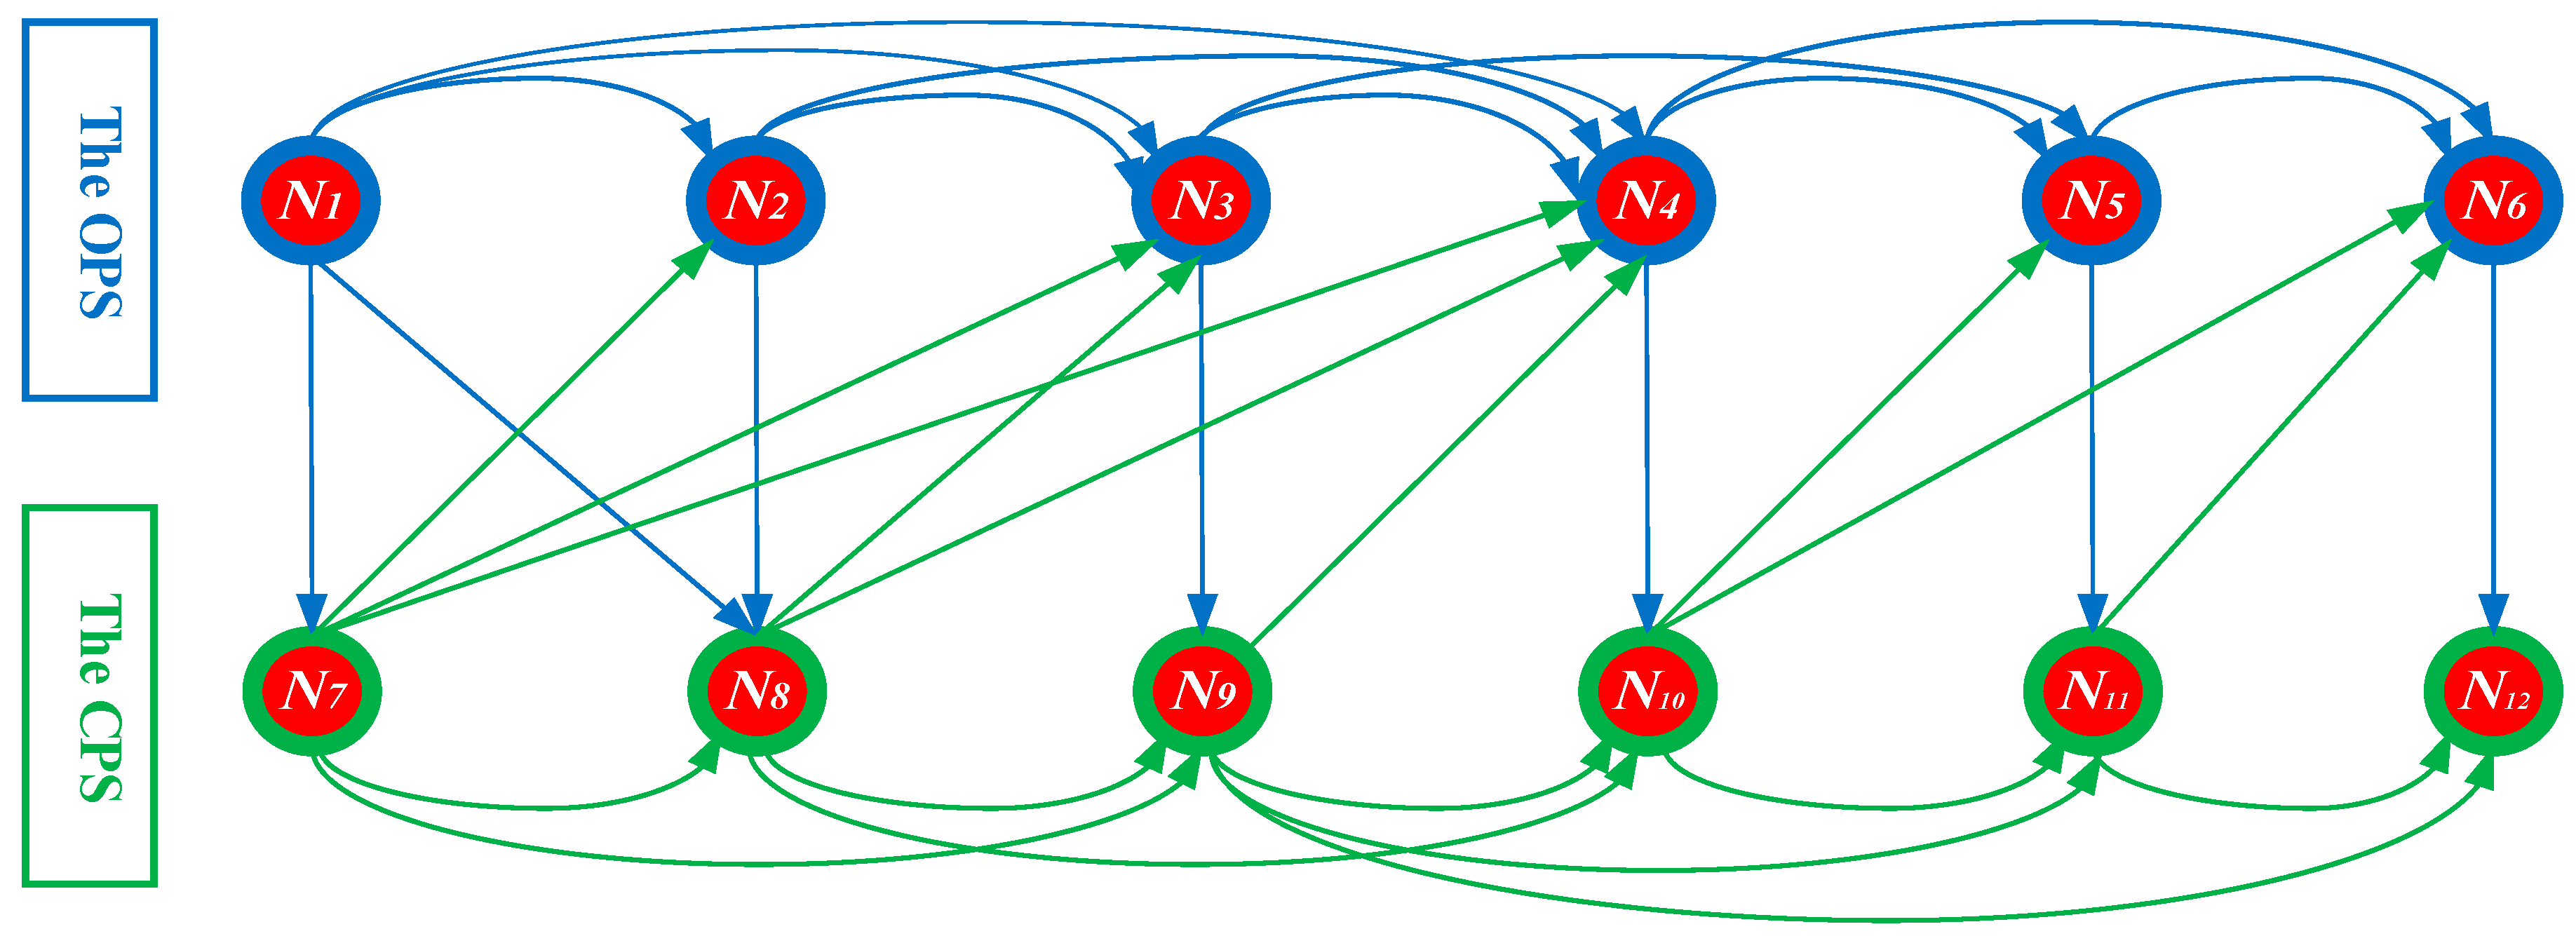
According to the above rules of constructing the network, the directed interdependent network of the OPS and CPS for the thermal coal can be given, as shown in Figure 7.
As shown in Figure 7, there are internal connections ( N 1 N 2 , N 1 N 3 , N 1 N 4 , ) and ( N 7 N 8 , N 7 N 9 , N 8 N 9 , ) within the network of the OPS and CPS, and the external connections ( N 1 N 7 , N 1 N 8 , N 2 N 8 , ) , which form the edge of the directed interdependent network together. In order to highlight the difference between the strong penetration within the same price series and the weak penetration between different price series, the visibility distance ( N = 0   o r   N = 1 ) of different penetration is set when connecting the network in this paper, which better preserves the internal associated compactness of the same price series and the associated sparsity between different price series, and is useful for fully mining price fluctuation information of the thermal coal.

2.3. The Statistical Characteristics of the DLPIN

According to the progress of constructing the network in Section 2.2, the DLPIN of the OPS and CPS is constructed. As for the network, the calculation of the average degree, the average path length, and the diameter are simple, but the density [33] (as shown in Equation (7)) and the modularity [34] (as shown in Equation (8)) are complex, a detailed description of which is given.
As for the directed network, which has N nodes, the maximum number of edges that may exist in the network is 2 C N 2 = N ( N 1 ) , the actual number of the connected edges in the network is L , then the following Equation (7) for the density can be given:
D ( G ) = L N ( N 1 ) .
Which can be used to describe the evolutionary trend of the connected edges among the nodes in the network. The range of the density is [ 0 , 1 ] : when the network is fully connected, D ( G ) = 1 ; When there is no edge connection in the network, D ( G ) = 0 .
As for a given directed network, the adjacency matrix of which is A = ( a i j ) , and the number of elements that are not 0 is M , that is, the directed network has M edges, then the following Equation (8) for the modularity can be given:
Q = 1 M i j ( a i j k i o u t k j i n M ) φ ( v i , v j ) ,
where, k i i n and k i o u t indicate the in-degree and out-degree of node i , respectively. Meanwhile, v i and v j mean the affiliated community of the nodes i and j in the network, respectively. The modularity is used to measure the possibility of a specific cluster in the network, that is, the clustering intensity in the network, and the range of which is [ 0 , 1 ] .
According to Equations (7) and (8), the statistical characteristics of the network can be obtained, as shown in Table 5.
According to Table 5, the total connection rate and average connection rate of the nodes in the DLPIN are 0.0645 and 0.000178, respectively. The result shows that there is a sparse connected relationship among the nodes, and the size of the density also reflects this point. Meanwhile, the difference between the total connection rate and the average connection rate is large, which indicates that there are a few nodes with high connection rate, but a large number of nodes with a low connection rate in the DLPIN. In addition, we divide the community of the DLPIN based on the modularity, and use the same color to show the distinction. The size of the nodes represents the size of its degree, the same color nodes indicate that they belong to the same community, and the division result is shown in Figure 8.
According to Figure 8, the community structure divided by this method is clear and strong, showing good division quality, and 13 different communities are divided, which reflects the node concentration, rather than the random distribution among all modules. In addition, the number of the nodes in each community is different, that is, the possibility that each node belongs to a certain community is different, which shows that thermal coal price is similar in the whole, but different in the local part. Therefore, the community of the network is divided to determine whether the node belongs to a community based on the modularity, which is conducive to the study on the “mass generation” of the nodes in the network.

3. Analysis of the DLPIN

In order to mine the transmission ability of the thermal coal price information, the topological features of the DLPIN are analyzed based on the degree, centrality, clustering coefficient, and authority and the hub of the nodes, which is helpful to identify the important nodes and to quantitatively analyze their role in the DLPIN.

3.1. The In-Degree, Out-Degree, and Degree Distribution of the Nodes for DLPIN

According to the above constructing rules for the network, each node of the DLPIN corresponds to the OPS and CPS, that is, the OPS corresponds to the number of each node from 1 to 1410, and the CPS corresponds to the number of each node from 1411 to 2810, which corresponds to the time from 26 September 2013 to 1 July 2019. Based on this, the in-degree, out-degree, and degree distribution of the nodes of the DLPIN are given, as shown in Figure 9.
Here, the in-degree indicates the influence of the early nodes to it (that is, the influence of the early price to the price), the out-degree indicates the influence of the node to the later nodes (that is, the influence of this price to the later price), and the degree means the importance of the node in the DLPIN.
According to Figure 8, the maximal in-degree is 574 ( N 710 , the date: 26 October 2016), the maximal out-degree is 226 ( N 301 , the date: 19 December 2014), and the maximal degree is 723 ( N 759 , the date: 8 November 2016), but the node with the largest degree is neither the node with the largest out-degree nor the node with the largest in-degree. However, the change trend of the degree (where the degree is the sum of the in-degree and out-degree) under time characteristics is similar to the in-degree. In the DLPIN, it can be seen that the in-degree of the nodes is greater than the out-degree, and the in-degree and degree change of the nodes is consistent under the temporal distribution, which indicates that the in-degree of the nodes has a greater contribution rate to the degree of the nodes. Meanwhile, the early nodes have a larger out-degree and a lower in-degree, which is because the early nodes are more likely to be connected to their later nodes, while the later nodes are less likely to be connected to their later nodes, that is, this is due to the irreversibility of the price effect mechanism. Therefore, the results show that the DLPIN not only presents the connection relationship between the OPS and CPS, but also inherits the connection relationship within the OPS and CPS, thereby enhances the tightness of the connection and improves the transmission ability of the thermal coal price fluctuation information.
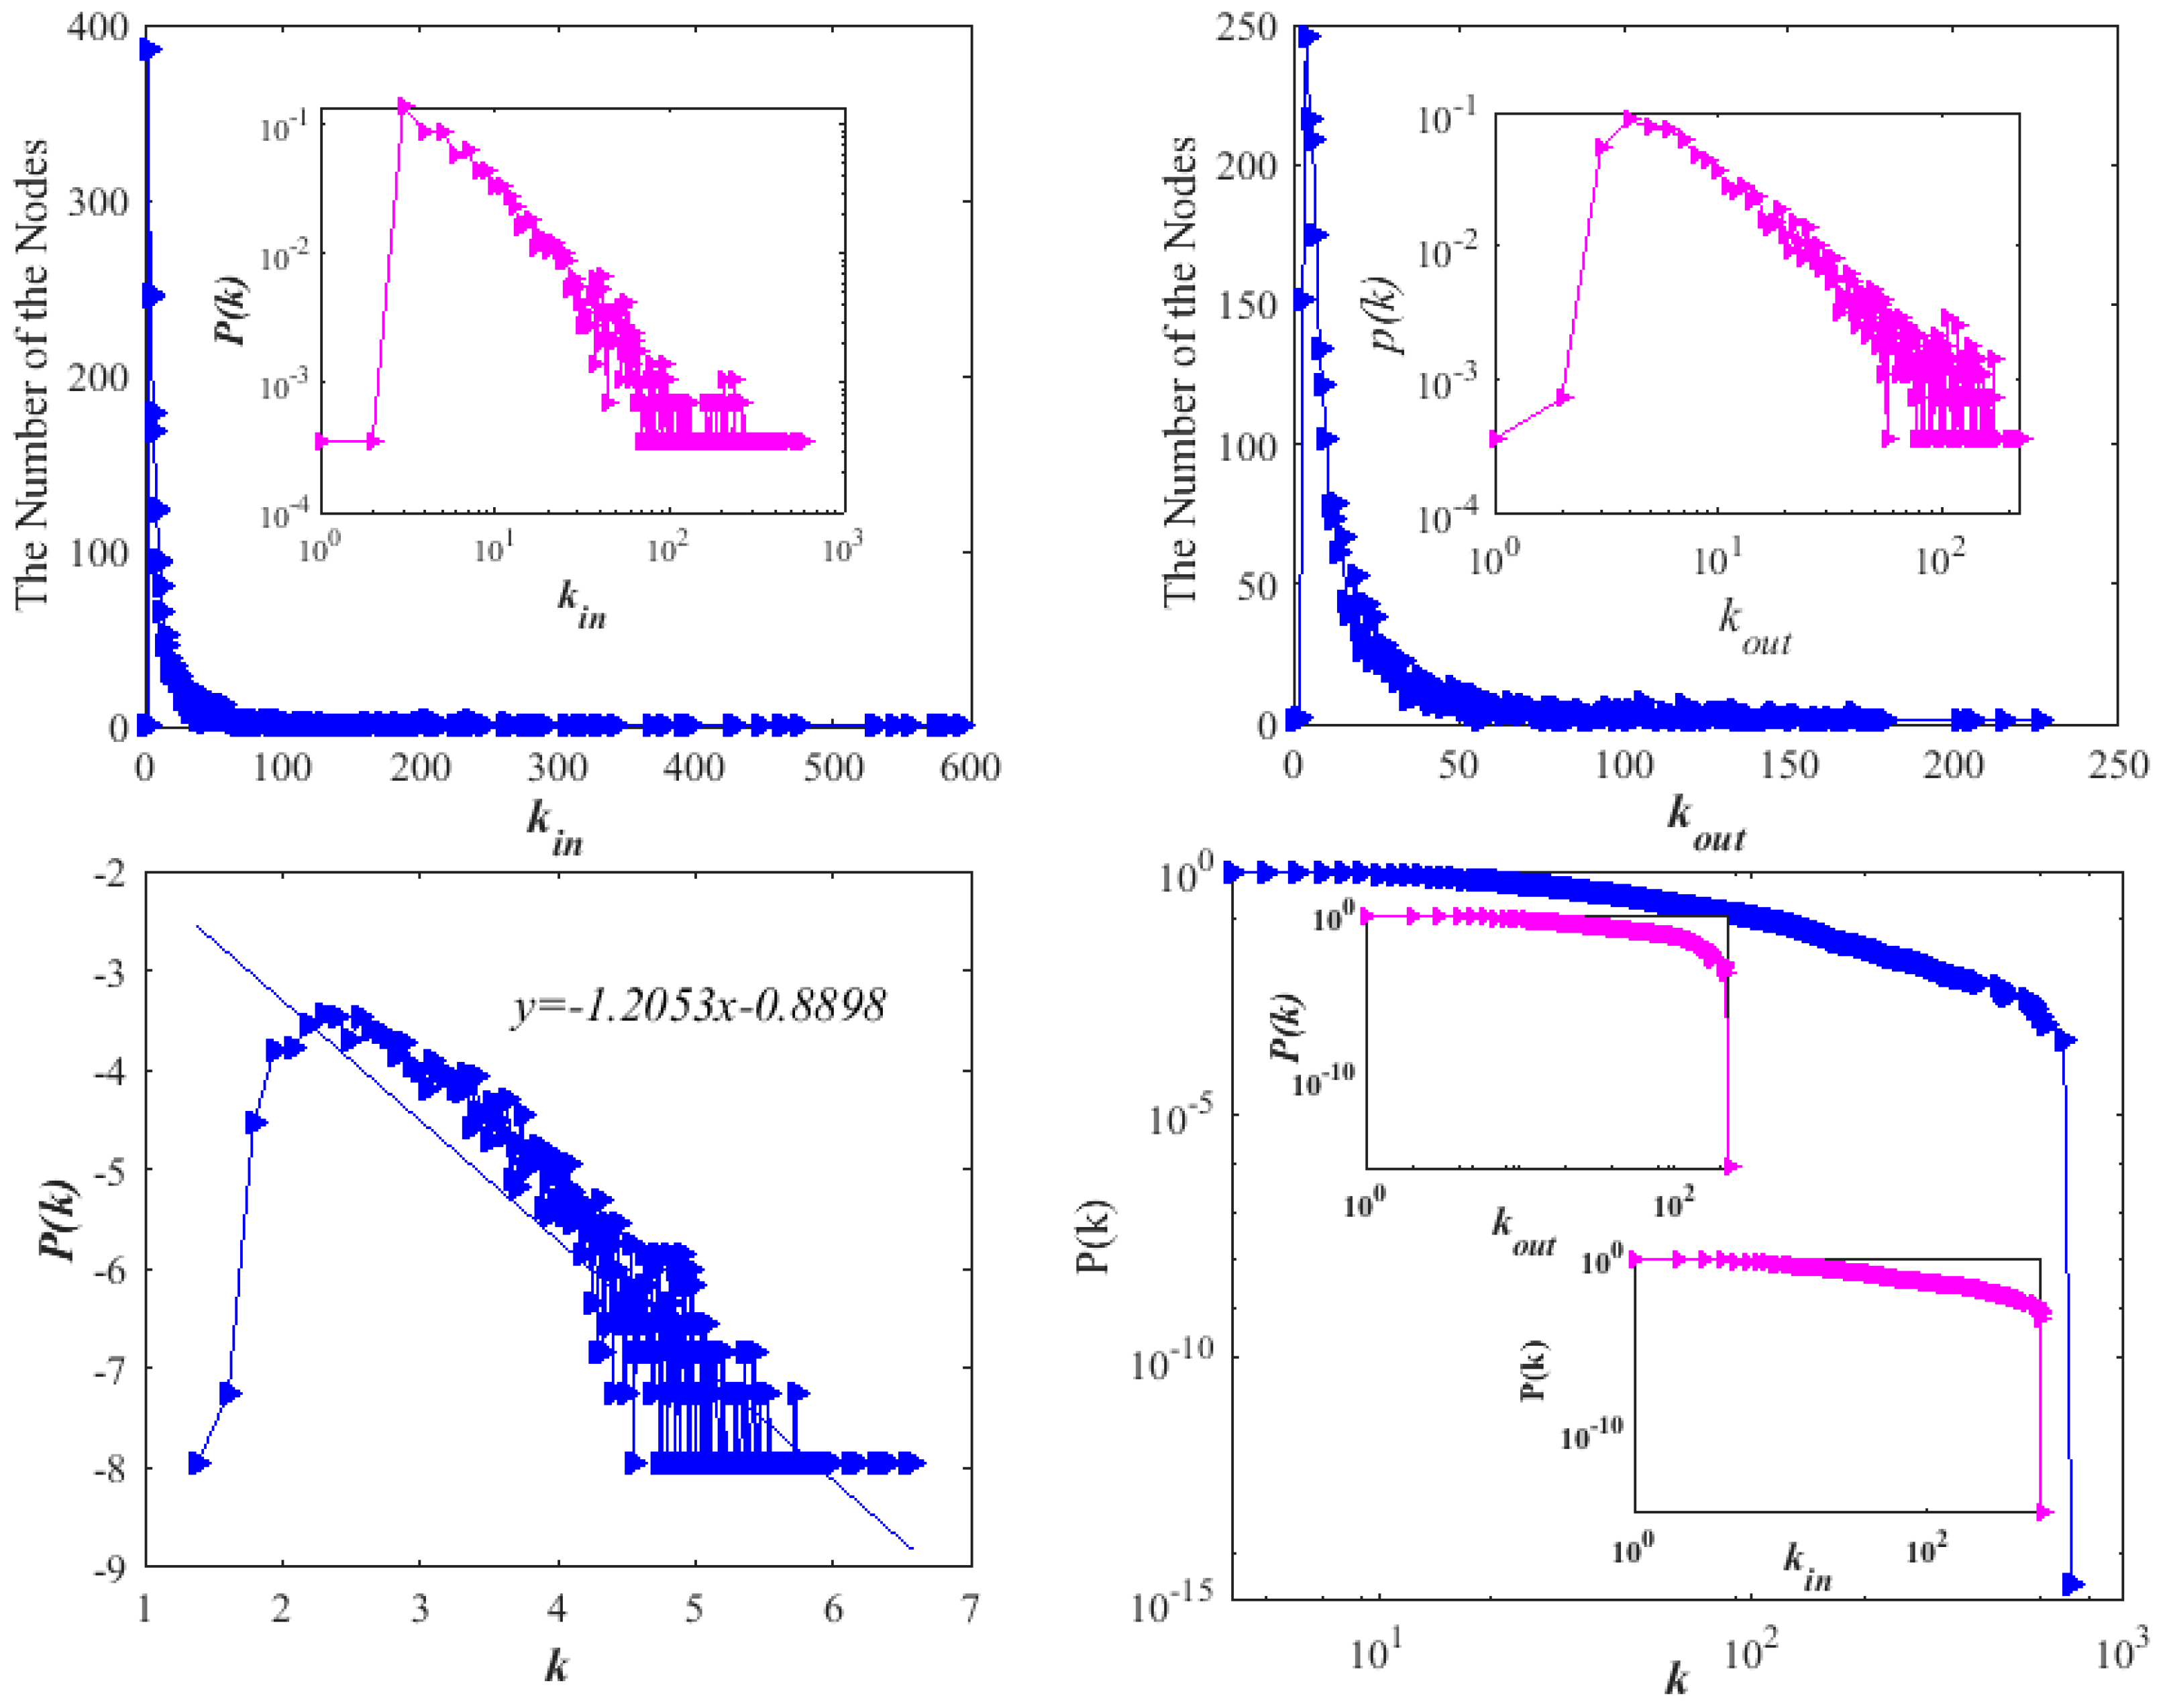
In order to further explore the in-degree, out-degree degree, and their corresponding distributions for the nodes in the DLPIN, the double logarithmic distribution and cumulative degree distribution are given, as shown in Figure 10.
Figure 10 shows that there is most of the nodes with a smaller in-degree, out-degree, and degree, that is, most nodes in the DLPIN are only connected with few nodes. However, the number of the nodes with a larger degree is fewer, that is, there are few nodes connected with many nodes, presenting long tail distribution, which has an obvious scale-free feature. The result shows that there is a weak influence relationship among the most nodes, and only a few nodes have strong influence. According to the construction rules of the DLPIN, the key node (i.e., the node with a larger degree) plays an important role in the connectivity, whose existence makes the scale-free network have a strong ability to bear the impact of the emergencies, but it is fragile in the face of the collaborative attacks.
The double logarithmic curve of the node degree in the DLPIN is regressed based on the least square method; the regression equation is y = 1.2053 0.8988 , and the correlation coefficient of the trend line is 0.7299, which shows that the degree of the nodes is power-law distribution, and the power-law index is 1.2053. It can be seen that the fitting effect is good, but it does not belong to the common scale-free network power-law index range ( 0 , 3 ] Therefore, the DLPIN of the thermal coal price fluctuation is a kind of special network with a unique and complex static evolutionary feature, and a deep analysis will be in the next.

3.2. The Centrality of the Nodes for DLPIN

In general, the greater the degree of the node, the more important the node is, but it is a little one-sided to measure the importance of the nodes only from the degree of the nodes. Identifying the key nodes and analyzing their important role are the focus of the research for the network. Therefore, this section makes the quantitative research on the centrality of the nodes to mine the important nodes from different angles based on the shortest path method, then the value and potential value of the nodes are analyzed in the DLPIN. Some concepts and equations are given to understand this paper.
  • Betweenness Centrality (BC)
    The BC [35] means the ratio of the shortest path through a point, and is one of the criteria to measure the centrality of network graph based on the shortest path, the calculation of which is shown in Equation (9):
    B C i = s i t n s t i g s t ,
    where, g s t indicates the number of the shortest path from the node s to t , n s t i is the number of the shortest path about the node i passed by the g s t edges of the shortest path from the node s to t .
  • Closeness Centrality (C-C)
    The C-C [36] means the sum of the distances from a point to all other points. The smaller the sum, the shorter the path from this point to all other points, and the closer the point is to all other points, the calculation of which is shown in Equation (10):
    C C i = N j = 1 N d i j ,
    where, d i j is the distance from the node i to j , N is the number of the total nodes.
  • Eigenvector Centrality (EC)
    The EC [37] is different from that of degree centrality. A node with a high degree centrality has many connections but the EC of the nodes is not necessarily high, because all the connecters may have low EC. Similarly, a node with a high EC is not necessarily a node with a high degree centrality, which is because it has few but very important connecters and can also have high EC, the calculation of which is shown in Equation (11):
    E C i = c j = 1 N a i j x j ,
    where, x j is the of the value of importance measure for the node i , c is a proportional constant, and a i j is the element of the adjacency matrix A = ( a i j ) .

3.2.1. The BC of the Nodes for DLPIN

In the network, whichever node is the busiest, that is, whichever node bears the strongest connectivity role, is the node that is in a more important position in the network. However, the BC is defined as the percentage of the number of the shortest paths passed through the nodes to the number of all shortest paths in the network, which mainly studies the influence of nodes on information flow. According to Equation (9), the B C i of the node i can be calculated, the distribution characteristics of which are shown in Figure 11.
According to the construction rules of the DLPIN, the connectivity of the network refers to the ability of the node to receive and transmit the thermal coal price fluctuation information, that is, the stronger the ability is, the bigger the BC is, which can measure the fluctuation state of the thermal coal price information. According to Figure 11, a few nodes with a large degree have a strong connectivity, while some nodes with a large degree have weak connectivity, even worse than those nodes with a small degree, which may be caused by the huge difference between the in-degree and out-degree (as shown in Table 6, the in-degree of the nodes is large, but the out-degree of the nodes is small, or the in-degree is large, and the out-degree is small). This result indicates that some nodes in the DLPIN have a weak ability to transmit the information for the thermal coal price, that is, they cannot transmit the received information completely, which leads to the loss of the price fluctuation information. By analyzing the nodes that lost much information, we can explore the hidden information to carry out strategic management on the possible trend of price change in the next period.
Therefore, the importance of the node in its related shortest path can be investigated by the means of analyzing the BC, the node containing important information in the DLPIN can be identified, but whose disadvantage is that it cannot be used as a judgment basis to measure the importance of the node in all paths. In order to resolve the problem and reflect the global structure in all paths, the next section will analyze the closeness centrality and distribution characteristics of the nodes to reveal the whole characteristics of the DLPIN, which are dependent on the thermal coal price fluctuation.

3.2.2. The C-C of the Nodes for DLPIN

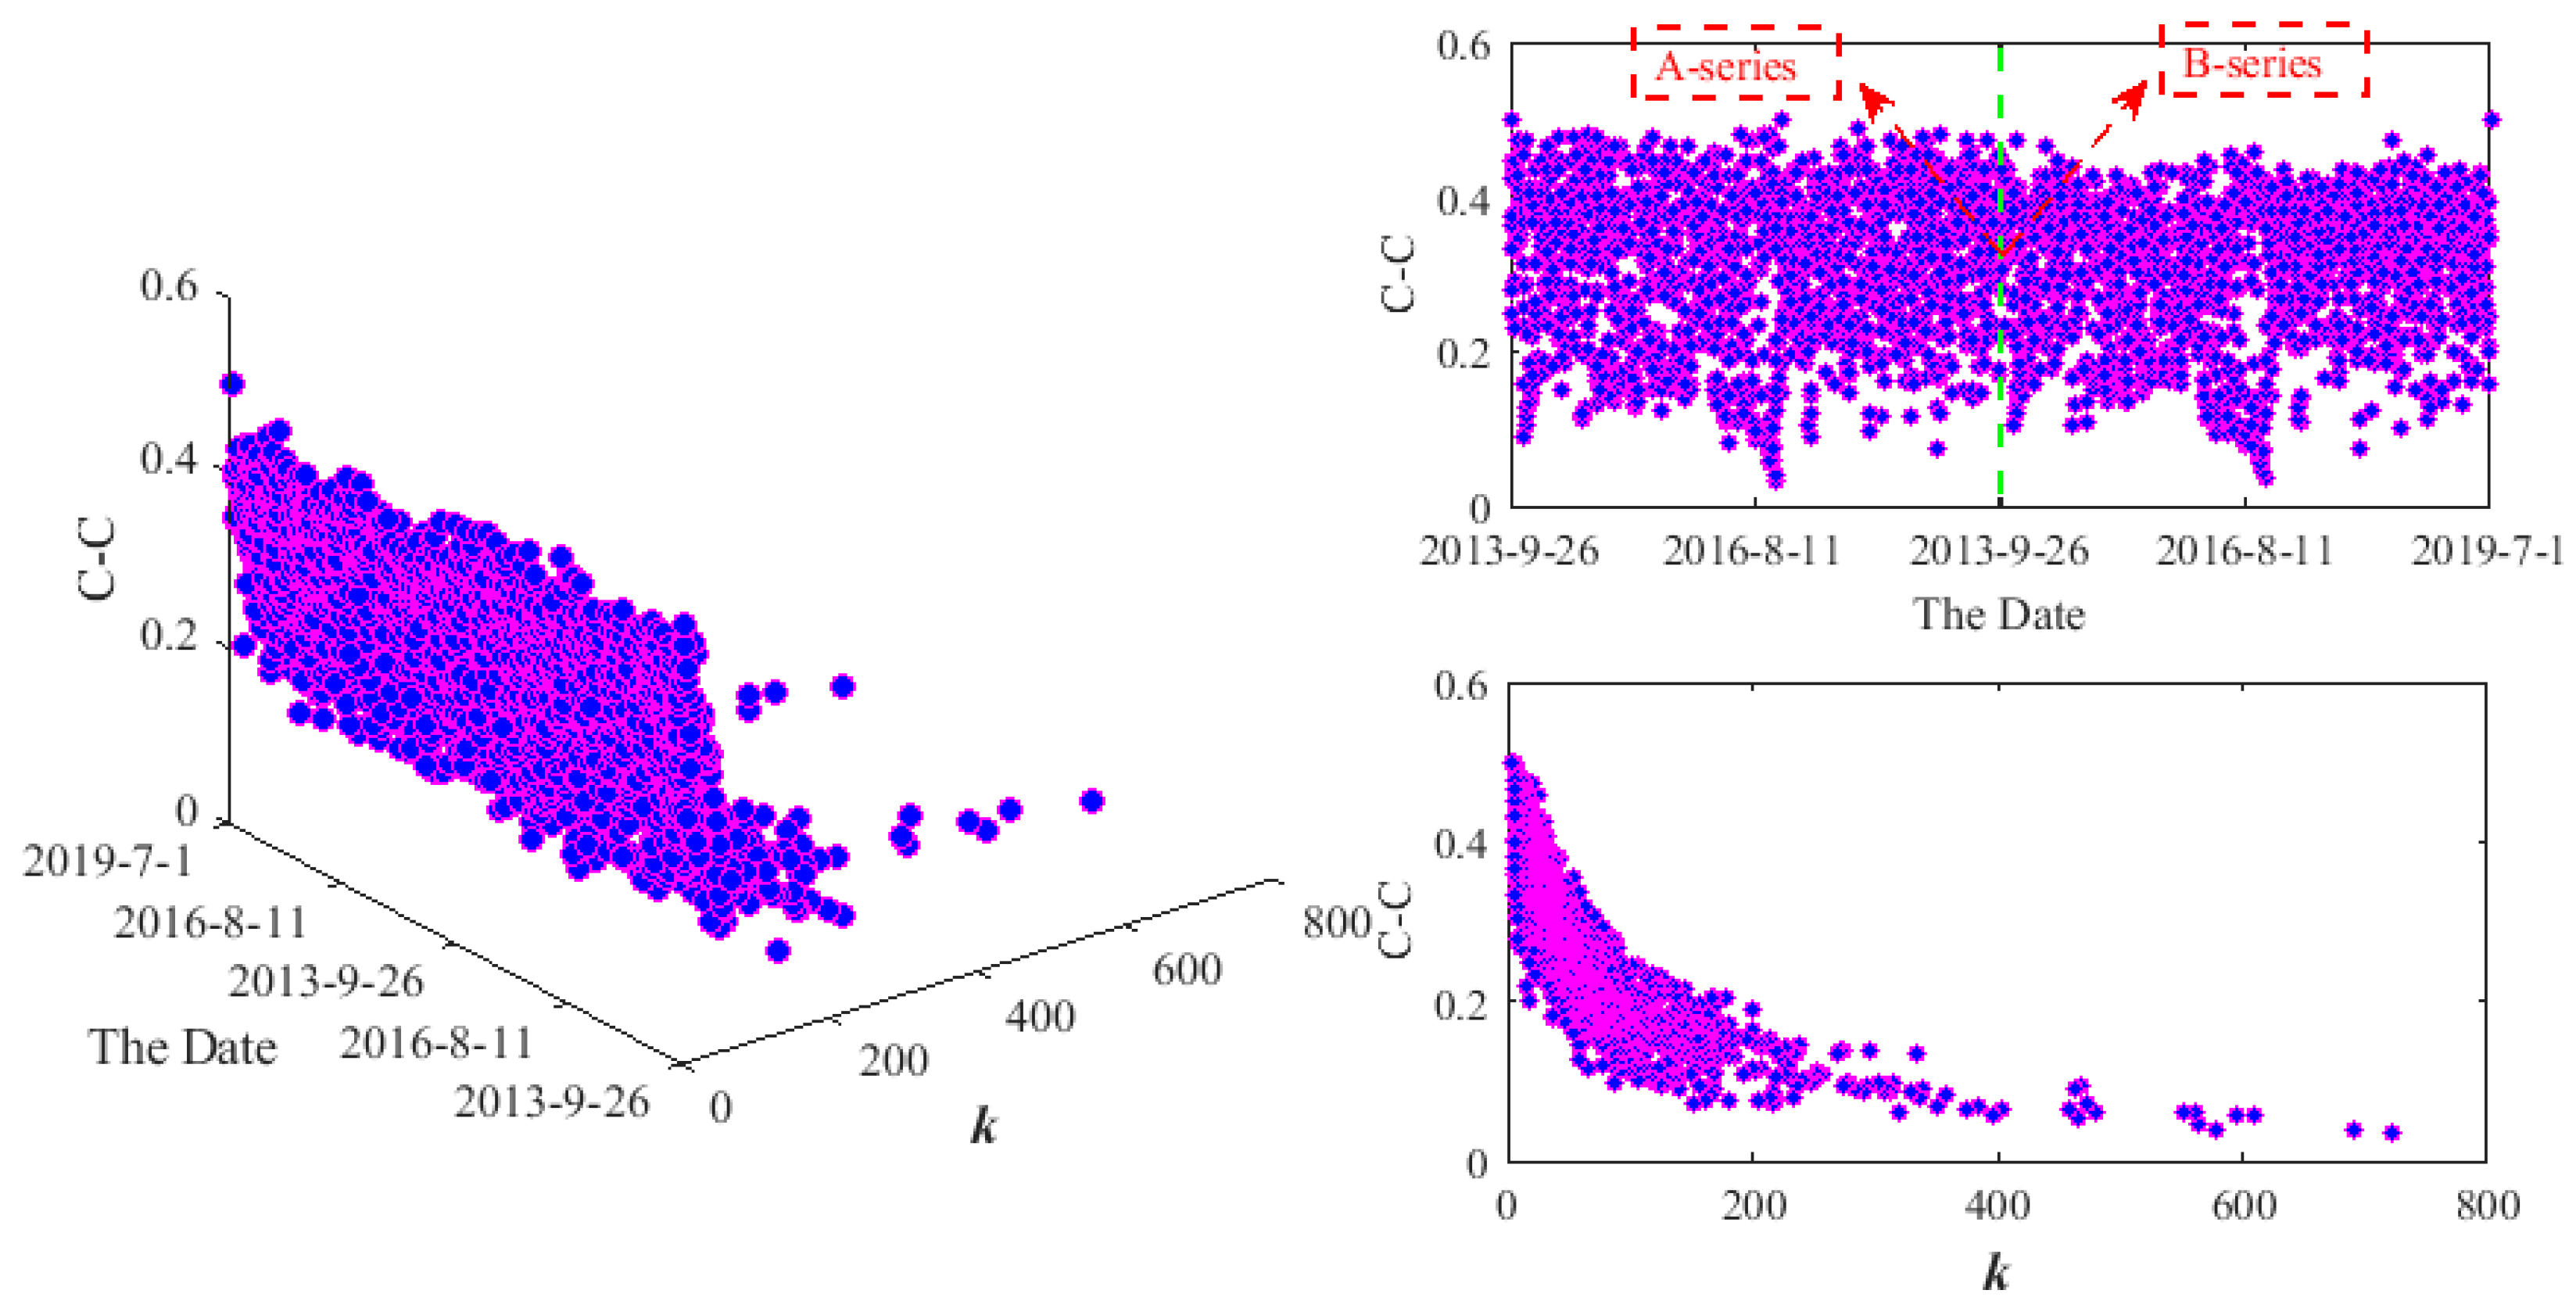
In order to describe the difficulty for the nodes to reach other nodes in the DLPIN, the distribution characteristics of the C-C are given (as shown in Figure 12) based on Equation (10), which reflects the closeness between one node and the other nodes.
According to Figure 12, the C-C of the nodes in the DLPIN shows a small difference in the early stage in the temporal distribution characteristics, that is, the transmission of the thermal coal price fluctuation information has similar transmission capacity in the early stage. However, the degree of the node is small and the C-C increases rapidly in the later stage, that is, the thermal coal price fluctuation has a strong influence on the adjacent price in the later stage. These two phenomena show that the transmission of the thermal coal price information has a certain distance and has a strong influence in a short distance. In addition, there are three nodes with C-C = 1 in the DLPIN, which are N 1405 , N 2808 , and N 2809 , which means that these nodes can directly reach other nodes when it can reach, that is, the shortest path is 1. However, there is only one node with C-C = 0 ( N 2810 ), which means that this node cannot reach other nodes in the DLPIN. It can be seen that the C-C reflects the influence of the nodes to other nodes through the DLPIN, which not only considers the degree of the nodes, but also considers the location of the nodes in the DLPIN. Therefore, the transfer ability of the thermal coal price fluctuation can be identified by means of analyzing the C-C, which can provide a basis for the short-term prediction of the thermal coal price.

3.2.3. The EC of the Nodes for DLPIN

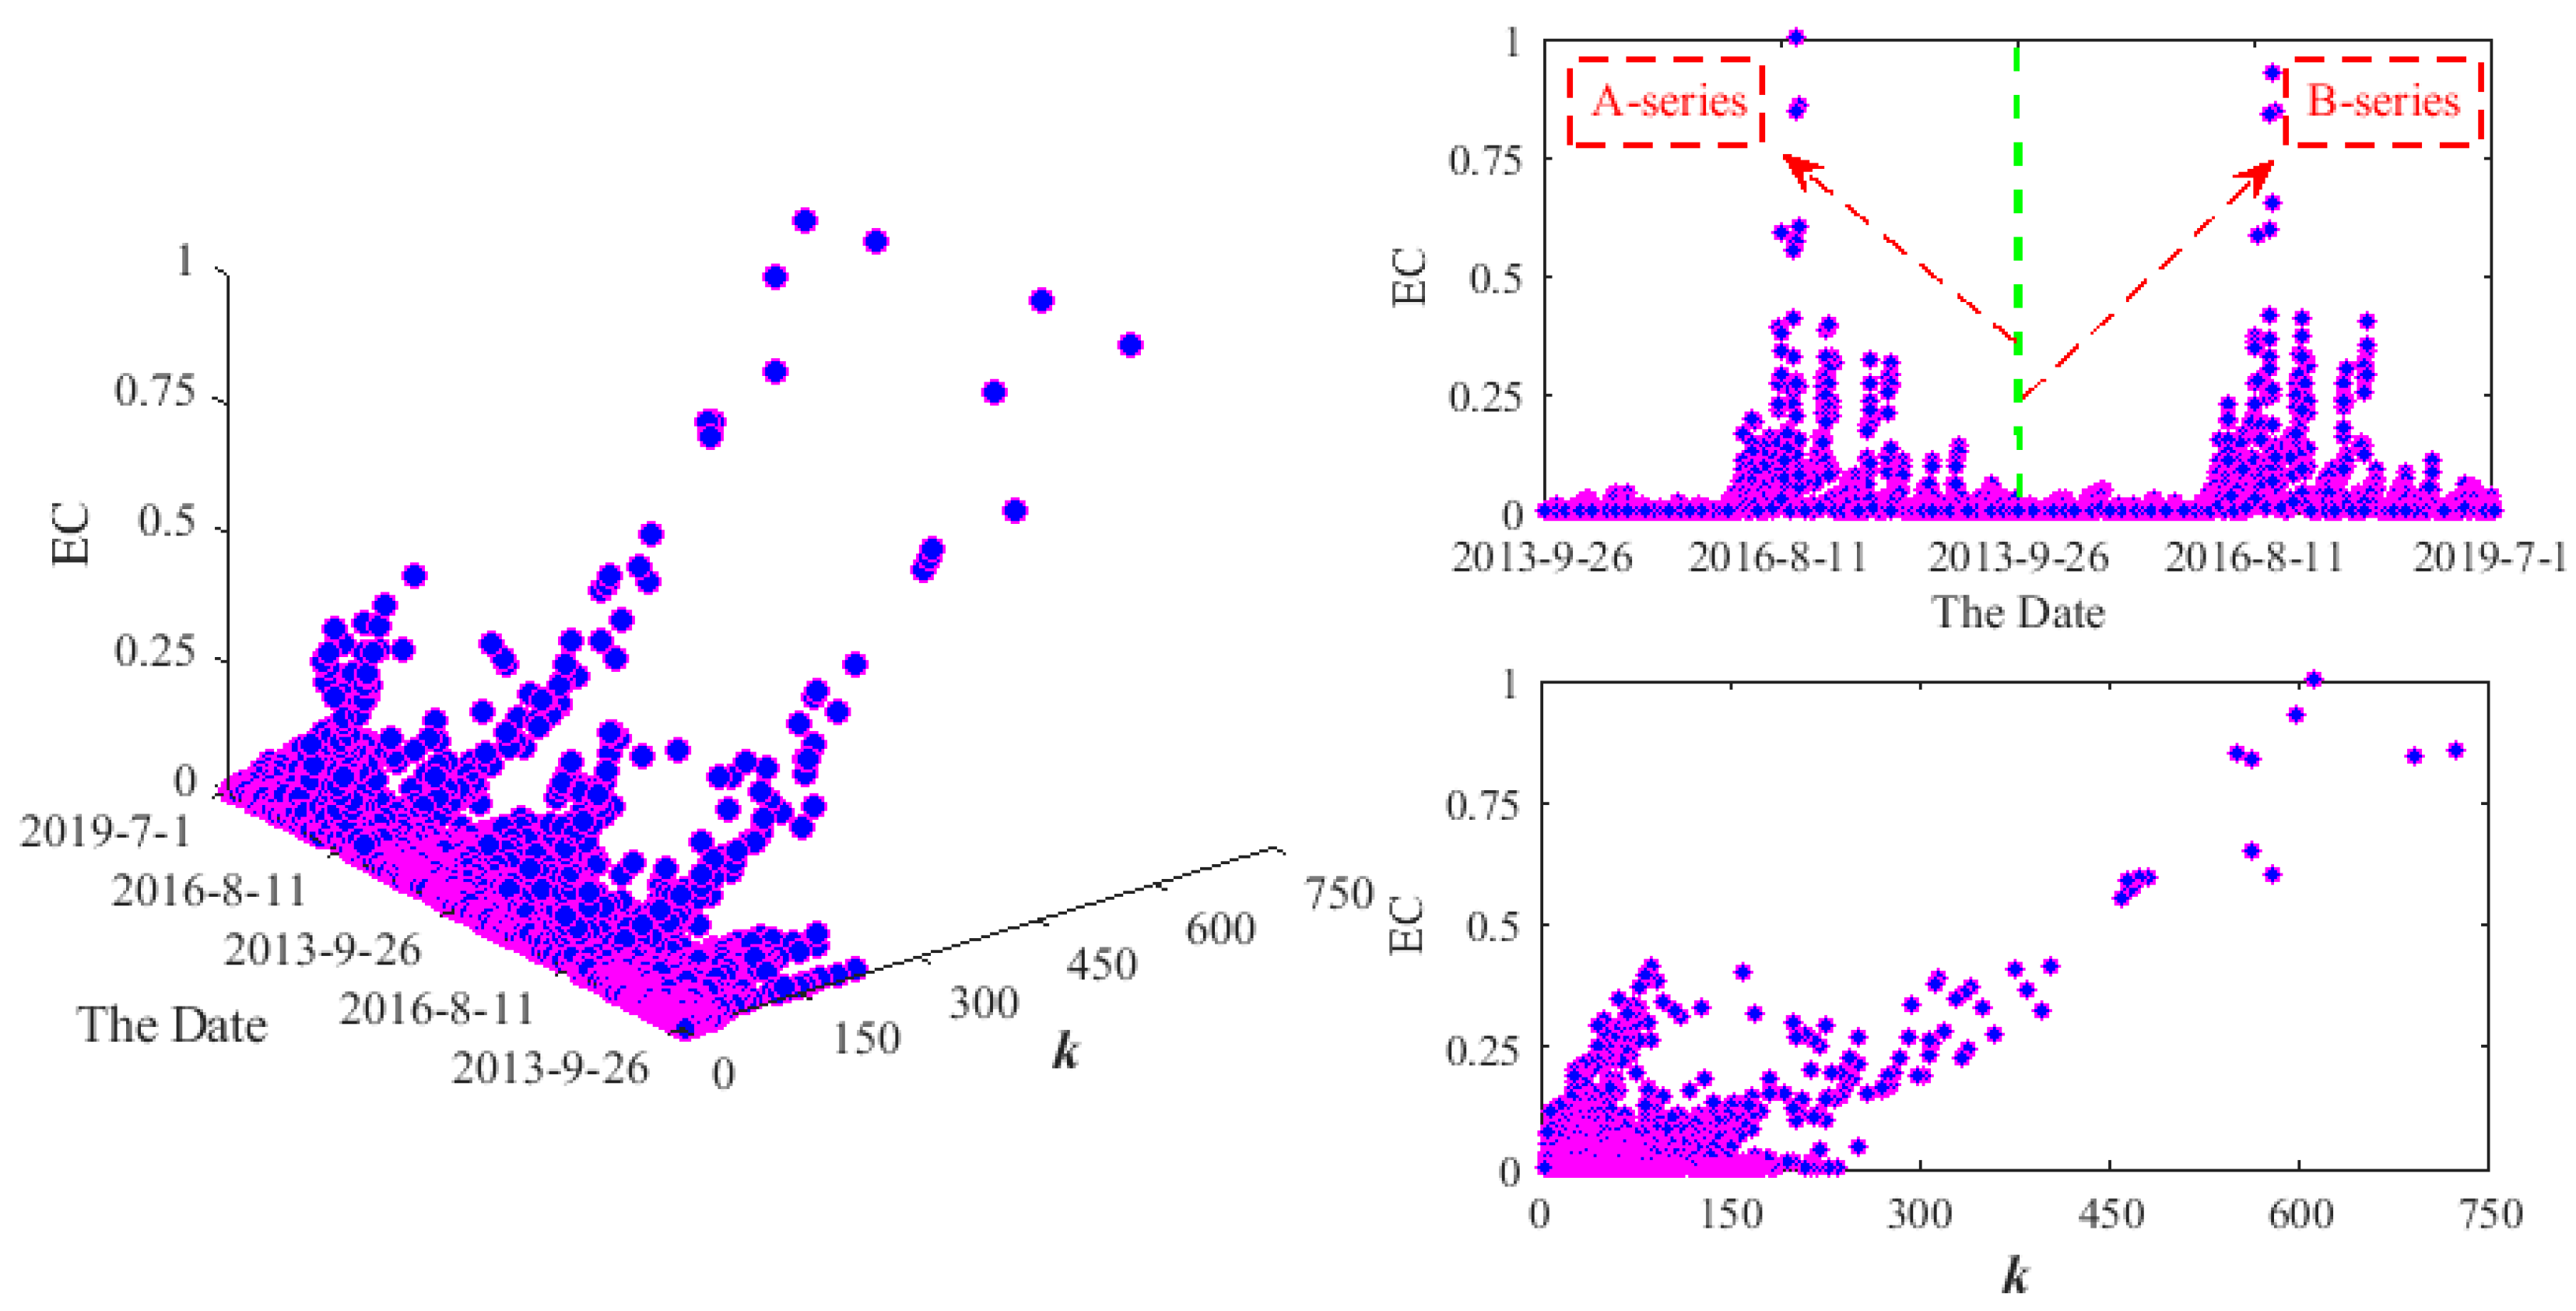
The importance of the nodes is not only related to the number of the connected edges, but also linearly related to the importance of the connected nodes, which means that the nodes can indirectly improve their importance in the network by the connecting important nodes. According to the algorithm and Equation (11) of the EC, the EC distribution of the nodes in DLPIN are as shown in Figure 13.
According to Figure 13, the EC of the nodes in the DLPIN is counted, and the first six nodes (of which the order is from large to small) are selected. The corresponding degree and time distribution of the nodes are shown in Table 7.
From Figure 13, we can find that most of the nodes have smaller eigenvalue centrality value, while the number of the nodes with a larger EC is smaller, which shows that most of the nodes are far away from the infectious source of the thermal coal price information, and a few nodes are close to the infectious source of the price information, which also needs to be focused on. Meanwhile, it can be seen that the nodes with a larger degree have a larger EC based on the distribution relationship between the degree and EC. Since the EC describes the long-term influence of the nodes in the DLPIN, which is mainly used for propagation analysis, therefore, we can realize the mining of the thermal coal price fluctuation, and analyze the path and range of the price information transmission through the EC, which is conducive to grasp the dynamic transmission characteristics of the influential price information for the thermal coal price fluctuation.

3.3. The Clustering Coefficient (CC) of the Nodes for DLPIN

The clustering coefficient (CC) of the node mainly reflects the closeness of the relationship among the adjacent nodes of the node, which indicates how the node is embedded in its adjacent nodes. According to the definition and algorithm of the clustering coefficient (CC) [38], this section analyzes the relationship between the clustering coefficient of the DLPIN and time and degree, as shown in Figure 14.
According to Figure 14, the average CC of the DLPIN is 0.303, which indicates that there is a relatively close relationship among any other nodes directly connected with the nodes, and has no obvious relationship with the temporal distribution characteristics of the nodes, but has a significant decreasing trend with the degree of the nodes. Meanwhile, it can be found that the node with a largest degree has the smallest CC through the relationship between the degree and CC, which indicates that there is a loose closeness among other nodes directly connected with this node. Therefore, it can be seen that the nodes with a larger CC have smaller degree, but a few larger CC will also appear in these nodes with a larger degree, which shows that the different networks are not completely random, and have the characteristics of "community" to some degree. This result is consistent with the above division of the modularity in Section 2.3. Through the analysis of the CC of the nodes in the DLPIN, the closeness among the OPS and CPS is explored, which can provide a reference for the research on the “mass occurrence” of the thermal coal price fluctuation and information transmission in the future.

3.4. The Authority and the Hub of the Nodes for the DLPIN

Considering the importance of the nodes in a directed network, a simple method is to treat the directed network as an undirected network, then the important index of the nodes in the undirected network can be directly used. However, the directionality of the edges in the directed network is very important for the nodes, and the authority and the hub are good indicators to measure the importance of the nodes in the directed network. According to the HITS algorithm [39], the algorithm of the authority and the hub is as follows:
(1)
Initial step: Let the initial value of the authority and the hub of all nodes in the network be x i ( 0 ) , y i ( 0 ) , i = 1 , 2 , , n ;
(2)
Iterative process: Perform the following three operations in the step k ( k 1 ) ;
  • The correction rules of the authority: The authority of each node is corrected to the sum of the hubs pointing to this node, as shown in Equation (12):
    x i ( k ) = j = 1 N a j i y j ( k 1 ) , i = 1 , 2 , , N
  • The correction rules of the hub: The hub of each node is corrected to the sum of the authorities pointing to this node, as shown in Equation (13):
    y i ( k ) = j = 1 N a i j x j ( k ) , i = 1 , 2 , , N .
  • Equations (9) and (10) are normalized, the pattern of which is shown in the Equation (14):
    x i ( k ) = x i ( k ) ( x ( k ) ) , y i ( k ) = y i ( k ) ( y ( k ) ) , i = 1 , 2 , , N .
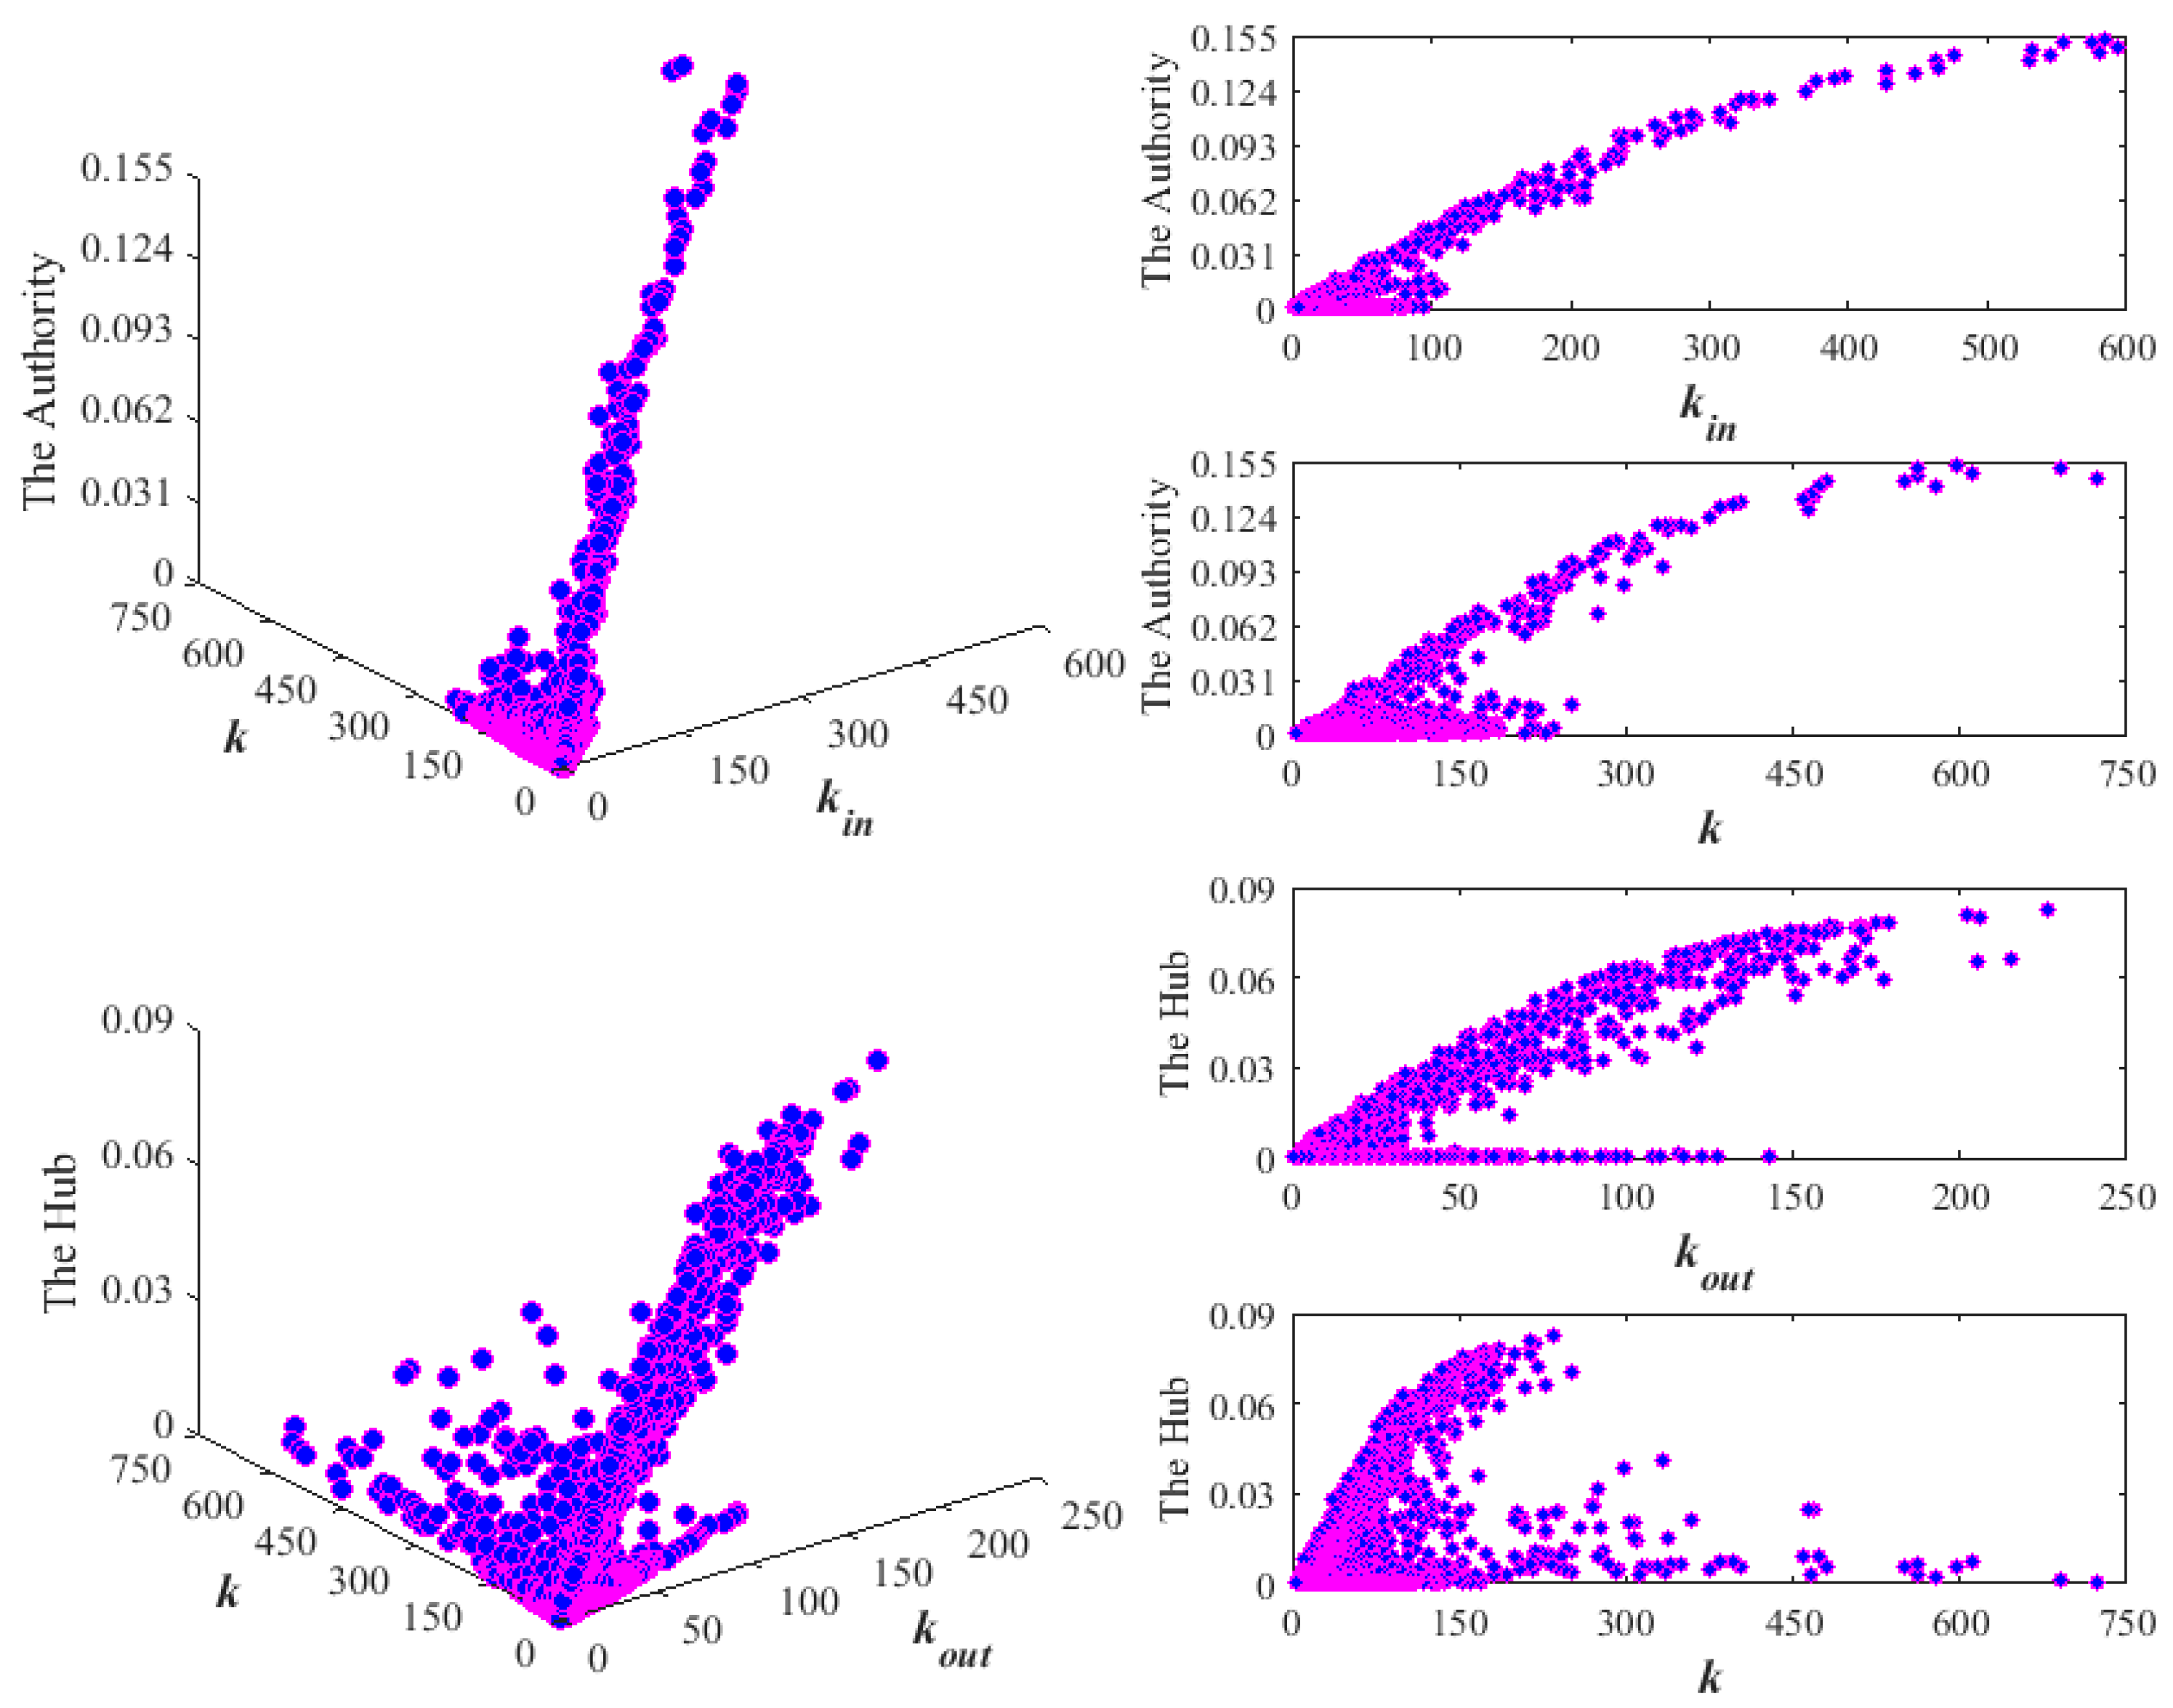
According to Equations (12)–(14), we can calculate the authority and the hub, and obtain the distribution characteristics of the in-degree, out-degree, degree, authority value, and hub value of the nodes in the DLPIN, which are dependent on the thermal coal price information. Then we obtain the distribution characteristics of the in-degree, out-degree, degree, authority, and hub of the nodes in the DLPIN, as shown in Figure 15.
From Figure 15, it can be seen that the in-degree and authority have the similar change trend in the DLPIN, and the out-degrees and hub also have the similar change trend, that is, with the increase of the in-degree and out-degree, the authority and hub also increase, respectively. This shows that the importance of the nodes in the directed network can be effectively identified by the authority and hub of the nodes, and the identification of the important nodes in the network can effectively grasp the important price information and analyze the transmission of the price information, which is helpful to deal with the risks of the price changes. Meanwhile, the authority represents the influence of the historical price information on it, and the hub represents the impact on the later prices. From the temporal distribution characteristics of the authority, the node with the largest authority in the DLPIN appears on 25 October 2016 (the closing price time), of which the corresponding in-degree, degree, and maximum degree are 585, 596, and 723, respectively. From the temporal distribution characteristics of the hub, the node with the largest hub in the DLPIN appeared on 19 December 2014 (the opening price time), and whose corresponding out-degree, degree, and maximum degree are 226, 234, and 723, respectively. The results show that the node with the largest degree is not the node with the largest hub and authority. In conclusion, there is an obvious increasing relationship between the in-degree and authority of the nodes in the DLPIN, and between the out-degree and hub of the nodes, but there is no significant change relationship between the degree and the authority and hub.

4. Summaries and Enlightenments

As for the thermal coal price, there is always the focus of the debate between the coal mining industry and power industry with the increasing contradiction of coal and power industry, which has also been received more and more attention in recent years. According to the criterion of the visibility graph and the irreversibility of the time series, this paper establishes the DLPIN of the thermal coal price fluctuation between the OPS and CPS, and obtains some practical results about the thermal coal price by means of the analysis of the network, which are as follows:
(1)
In this network, the number of the nodes with a smaller in-degree, out-degree, and degree is larger, while the number of the nodes with a smaller in-degree, out-degree, and degree is smaller, which show that there is a weak influence relationship among the most nodes, and only a few nodes have strong influence. Meanwhile, their distributions present a long tail distribution, which means that the DLPIN has an obvious scale-free feature and is a special network with a unique and complex static evolutionary feature.
(2)
By analyzing the information flow of the nodes in the DLPIN, it is found that some nodes have weak ability to transmit the price information, that is, they cannot transmit the received information completely, resulting in the loss of the price fluctuation information of the thermal coal, which is dependent on the thermal coal price fluctuation.
(3)
Most of the nodes are far from the infectious source of the price information, but only a few nodes are closer. Meanwhile, the transmission of the thermal coal price information has a certain distance, and there is a strong influence on the future price in a short distance.
(4)
The nodes with a larger CC generally have lower degree in the DLPIN, but a small number of the nodes with a larger CC also appear in the nodes with a larger degree, which indicates that the DLPIN is not completely random, and has the characteristics of “community” to some extent. By analyzing the CC corresponding to each time node, this paper explores the closeness of the price information, which can provide some references for the future research on the “mass generation” and information transmission for the thermal coal price information.
(5)
There is an obvious increasing relationship between the in-degree and authority of the nodes in the DLPIN, and between the out-degree and hub of the nodes, but there is no significant change relationship between the degree and the authority and hub.
Understanding coal price features is challenging. As we know, thermal coal industry is a typical demand-driven market in China, the price of which is largely affected by the state of macroeconomic development and the development of the related downstream industries, and the thermal coal future prices is no exception. Meanwhile, China’s coal price presents violent fluctuations influenced by many factors, and the fluctuation of thermal coal price are complex and susceptible to many uncertain factors, such as coal production capacity, coal inventory, coal import and export, transportation costs, supply and demand of the upstream and downstream products (coal-consuming industries, especially power, building materials and chemical industries ), international coal prices, national policies, other energy prices (i.e. gasoline price ), etc., which will have an impact on the thermal coal price, and result in the frequent fluctuations and unpredictable changes of the thermal coal price. Therefore, it is imperative for the governments to take measures to stabilize coal market.
To control the risks of the coal price fluctuation and ensure energy security, mining the fluctuation law of the thermal coal price should be the focus of the researchers. Through the study on the fluctuation laws of the thermal coal price, this paper explores a scientific and reasonable thermal coal price mechanism to solve the problem of the low resource allocation efficiency and the resulting environmental degradation through the "invisible hand" of the price market. Future research on the market price of thermal coal can provide a valuable tool to promote the sustainable development of the coal industry and the economy-society-environment. In addition, studying the overall-coordination-linkage mechanism between different coal product prices, and establishing a multilayer network between different coal product price fluctuations will be the focus of future research in the coal industry.

Author Contributions

G.Z.: data curation, methodology, formal analysis, writing—original draft preparation, funding acquisition, writing—reviewing and editing; L.T.: conceptualization, methodology, project administration, supervision, funding acquisition, resources; M.F.: supervision, funding acquisition, validation; B.W.: data curation, methodology, formal analysis; W.Z.: software, visualization, funding acquisition, investigation. All authors have read and agreed to the published version of the manuscript.

Funding

This research was funded by grants from the National Natural Science Foundation of China (No: 71690242, 91546118, 11731014, 51976085), the Social Science Foundation of Jiangsu Province (No: 18EYB020), Qing Lan Project of Jiangsu Province (SJ201812), Jiangsu Key Lab for NSLSCS (201904), Soft science project of Jiangsu (BR2019027), and Postgraduate Research & Practice Innovation Program of Jiangsu Province (KYCX18_2256).

Conflicts of Interest

The authors declare no conflict of interest.

References

  1. Cui, H.R.; Wei, P.B. Analysis of thermal coal pricing and the coal price distortion in China from the perspective of market forces. Energy Policy 2017, 106, 148–154. [Google Scholar] [CrossRef]
  2. Ding, Z.H.; Zhou, M.H.; Ning, B. Research on the influencing effect of coal price fluctuation on CPI of China. Energy Procedia 2011, 5, 1508–1513. [Google Scholar]
  3. Chen, Z.M. Inflationary effect of coal price change on the Chinese economy. Appl. Energy 2014, 114, 301–309. [Google Scholar] [CrossRef]
  4. Guo, J.; Zheng, X.Y.; Chen, Z.M. How does coal price drive up inflation? Reexamining the relationship between coal price and general price level in China. Energy Econ. 2016, 57, 265–276. [Google Scholar] [CrossRef]
  5. Chen, D.; Zhou, K.; Tan, X.; Zhou, Z.X.; Shi, L.; Ma, Z. Desulfurization Electricity Price and Emission Trading: Comparative analysis of thermal power industry in China and the United States. Energy Procedia 2019, 158, 3513–3518. [Google Scholar] [CrossRef]
  6. Lei, Y.L.; Li, L.; Pan, D.Y. Study on the Relationships Between Coal Consumption and Economic Growth of the Six Biggest Coal Consumption Countries: With Coal Price as a Third Variable. Energy Procedia 2014, 61, 624–634. [Google Scholar] [CrossRef] [Green Version]
  7. Haftendorn, C.; Holz, F. Modeling and Analysis of the International Steam Coal Trade. Energy J. 2010, 31, 201–225. [Google Scholar] [CrossRef]
  8. Ellerman, A.D. The world price of coal. Energy Policy 1995, 23, 499–506. [Google Scholar] [CrossRef]
  9. Humphreys, D.; Welham, K. The restructuring of the international coal industry. Int. J. Glob. Energy Issues 2000, 13, 333–347. [Google Scholar] [CrossRef]
  10. Warell, L. Defining geographic coal markets using price data and shipments data. Energy Policy 2005, 33, 2216–2230. [Google Scholar] [CrossRef]
  11. Li, R.; Joyeux, R.; Ripple, R.D. International steam coal market integration. Energy J. 2010, 31, 181–202. [Google Scholar] [CrossRef] [Green Version]
  12. Ekawan, R.; Duchêne, M. The evolution of hard coal trade in the Atlantic market. Energy Policy 2006, 34, 1487–1498. [Google Scholar] [CrossRef]
  13. Chi-Jen Yang, C.J.; Xuan, X.W.; Jackson, R.B. China’s coal price disturbances: Observations, explanations, and implications for global energy economies. Energy Policy 2012, 51, 720–727. [Google Scholar] [CrossRef]
  14. Batten, J.A.; Brzeszczynski, J.; Ciner, C.; Lau, M.C.K.; Lucey, B.; Yarovaya, L. Price and volatility spillovers across the international steam coal market. Energy Econ. 2019, 77, 119–138. [Google Scholar] [CrossRef]
  15. Zaklan, A.; Cullmann, A.; Neumann, A.; Hirschhausen, C.V. The globalization of steam coal markets and the role of logistics: An empirical analysis. Energy Econ. 2012, 34, 105–116. [Google Scholar] [CrossRef] [Green Version]
  16. Krzemien, A.; Fernandez, P.R.; Sanchez, A.S.; Lasheras, F.S. Forecasting European thermal coal spot prices. J. Sustain. Min. 2015, 14, 203–210. [Google Scholar] [CrossRef] [Green Version]
  17. Papież, M.; Śmiech, S. Causality-in-mean and causality-in-variance within the international steam coal market. Energy Econ. 2013, 36, 594–604. [Google Scholar] [CrossRef]
  18. Papież, M.; Śmiech, S. Dynamic steam coal market integration: Evidence from rolling cointegration analysis. Energy Econ. 2015, 51, 510–520. [Google Scholar] [CrossRef]
  19. Huang, Y.H.; Wu, J.H. A portfolio theory based optimization model for steam coal purchasing strategy: A case study of Taiwan Power Company. J. Purch. Supply Manag. 2016, 22, 131–140. [Google Scholar] [CrossRef]
  20. Śmiech, S.; Papiez, M.; Fijorek, K. Causality on the steam coal market. Energy Sources Part B Econ. Plan. Policy 2016, 11, 328–334. [Google Scholar] [CrossRef]
  21. Sun, Q.; Xu, W.J.; Xiao, W.L. An empirical estimation for mean-reverting coal prices with long memory. Econ. Model. 2013, 33, 174–181. [Google Scholar] [CrossRef]
  22. Matyjaszek, M.; Fernández, P.R.; Krzemień, A.; Wodarski, K.; Valverde, G.F. Forecasting coking coal prices by means of ARIMA models and neural networks, considering the transgenic time series theory. Resour. Policy 2019, 61, 283–292. [Google Scholar] [CrossRef]
  23. Alameer, Z.; Fathalla, A.; Li, K.L.; Ye, H.W.; Zhang, J.H. Multistep-ahead forecasting of coal prices using a hybrid deep learning model. Resour. Policy 2020, 65, 101588. [Google Scholar] [CrossRef]
  24. Haftendorn, C.; Kemfert, C.; Holz, F. What about Coal? Interactions between Climate Policies and the Global Steam Coal Market until 2030. Energy Policy 2012, 48, 274–283. [Google Scholar] [CrossRef] [Green Version]
  25. Wang, S.B.; Luo, K.L. Atmospheric emission of mercury due to combustion of steam coal and domestic coal in China. Atmos. Environ. 2017, 162, 45–54. [Google Scholar] [CrossRef]
  26. Schernikau, L. The Global Steam Coal Market and Supply Curve. In Economics of the International Coal Trade; Springer: Dordrecht, The Netherlands, 2010; pp. 111–137. [Google Scholar]
  27. Li, R. The evolution of the international steam coal market. Int. J. Energy Sect. Manag. 2010, 45, 19–34. [Google Scholar] [CrossRef]
  28. Shao, J.; Buldyrev, S.V.; Havlin, S.; Stanley, H.E. Cascade of failures in coupled network systems with multiple support-dependence relations. Phys. Rev. E 2010, 83, 1127–1134. [Google Scholar] [CrossRef] [PubMed] [Green Version]
  29. Buldyrev, S.V.; Parshani, R.; Paul, G.; Stanley, H.E.; Havlin, S. Catastrophic cascade of failures in interdependent network. Nature 2010, 464, 1025–1028. [Google Scholar] [CrossRef] [Green Version]
  30. Johansen, S. Estimation and hypothesis testing of cointegration vectors in gaussian vector autoregressive models. Econometrica 1991, 59, 1551–1580. [Google Scholar] [CrossRef]
  31. Zhou, T.T.; Jin, N.D.; Gao, Z.K.; Luo, Y.B. Limited penetrable visibility graph for establishing complex network from time series. Acta Phys. Sin. 2012, 61, 355–367. [Google Scholar]
  32. Tang, Y.; Yi, N.; Mao, J.H. Derived network based on directed limited penetrable visibility graph for time series. J. Syst. Eng. 2017, 32, 156–162. [Google Scholar]
  33. Intanagonwiwat, C.; Estrin, D.; Govindan, R.; Heidemann, J. Impact of Network Density on Data Aggregation in Wireless Sensor Networks. In Proceedings of the 22nd International Conference on Distributed Computing Systems, Vienna, Austria, 2–5 July 2002. [Google Scholar] [CrossRef]
  34. Blondel, V.D.; Guillaume, J.L.; Lambiotte, R.; Lefebvre, E. Fast unfolding of communities in large networks. J. Stat. Mech. Theory Exp. 2008, 10, P10008. [Google Scholar] [CrossRef] [Green Version]
  35. Freeman, L.C. A set of centrality based on betweenness. Sociometry 1977, 40, 35–41. [Google Scholar] [CrossRef]
  36. Freeman, L.C. Centrality in social networks: Conceptual clarification. Soc. Netw. 1979, 1, 215–239. [Google Scholar] [CrossRef] [Green Version]
  37. Bavelas, A. Communication patterns in task-oriented groups. J. Acoust. Soc. Am 1950, 22, 725–730. [Google Scholar] [CrossRef]
  38. Wei, D.C. An Optimized Floyd Algorithm for the Shortest Path Problem. J. Netw. 2010, 5, 1496–1504. [Google Scholar] [CrossRef]
  39. Kleinberg, J.M. Authoritative sources in a hyperlinked environment. J. ACM 1997, 46, 604–632. [Google Scholar] [CrossRef]
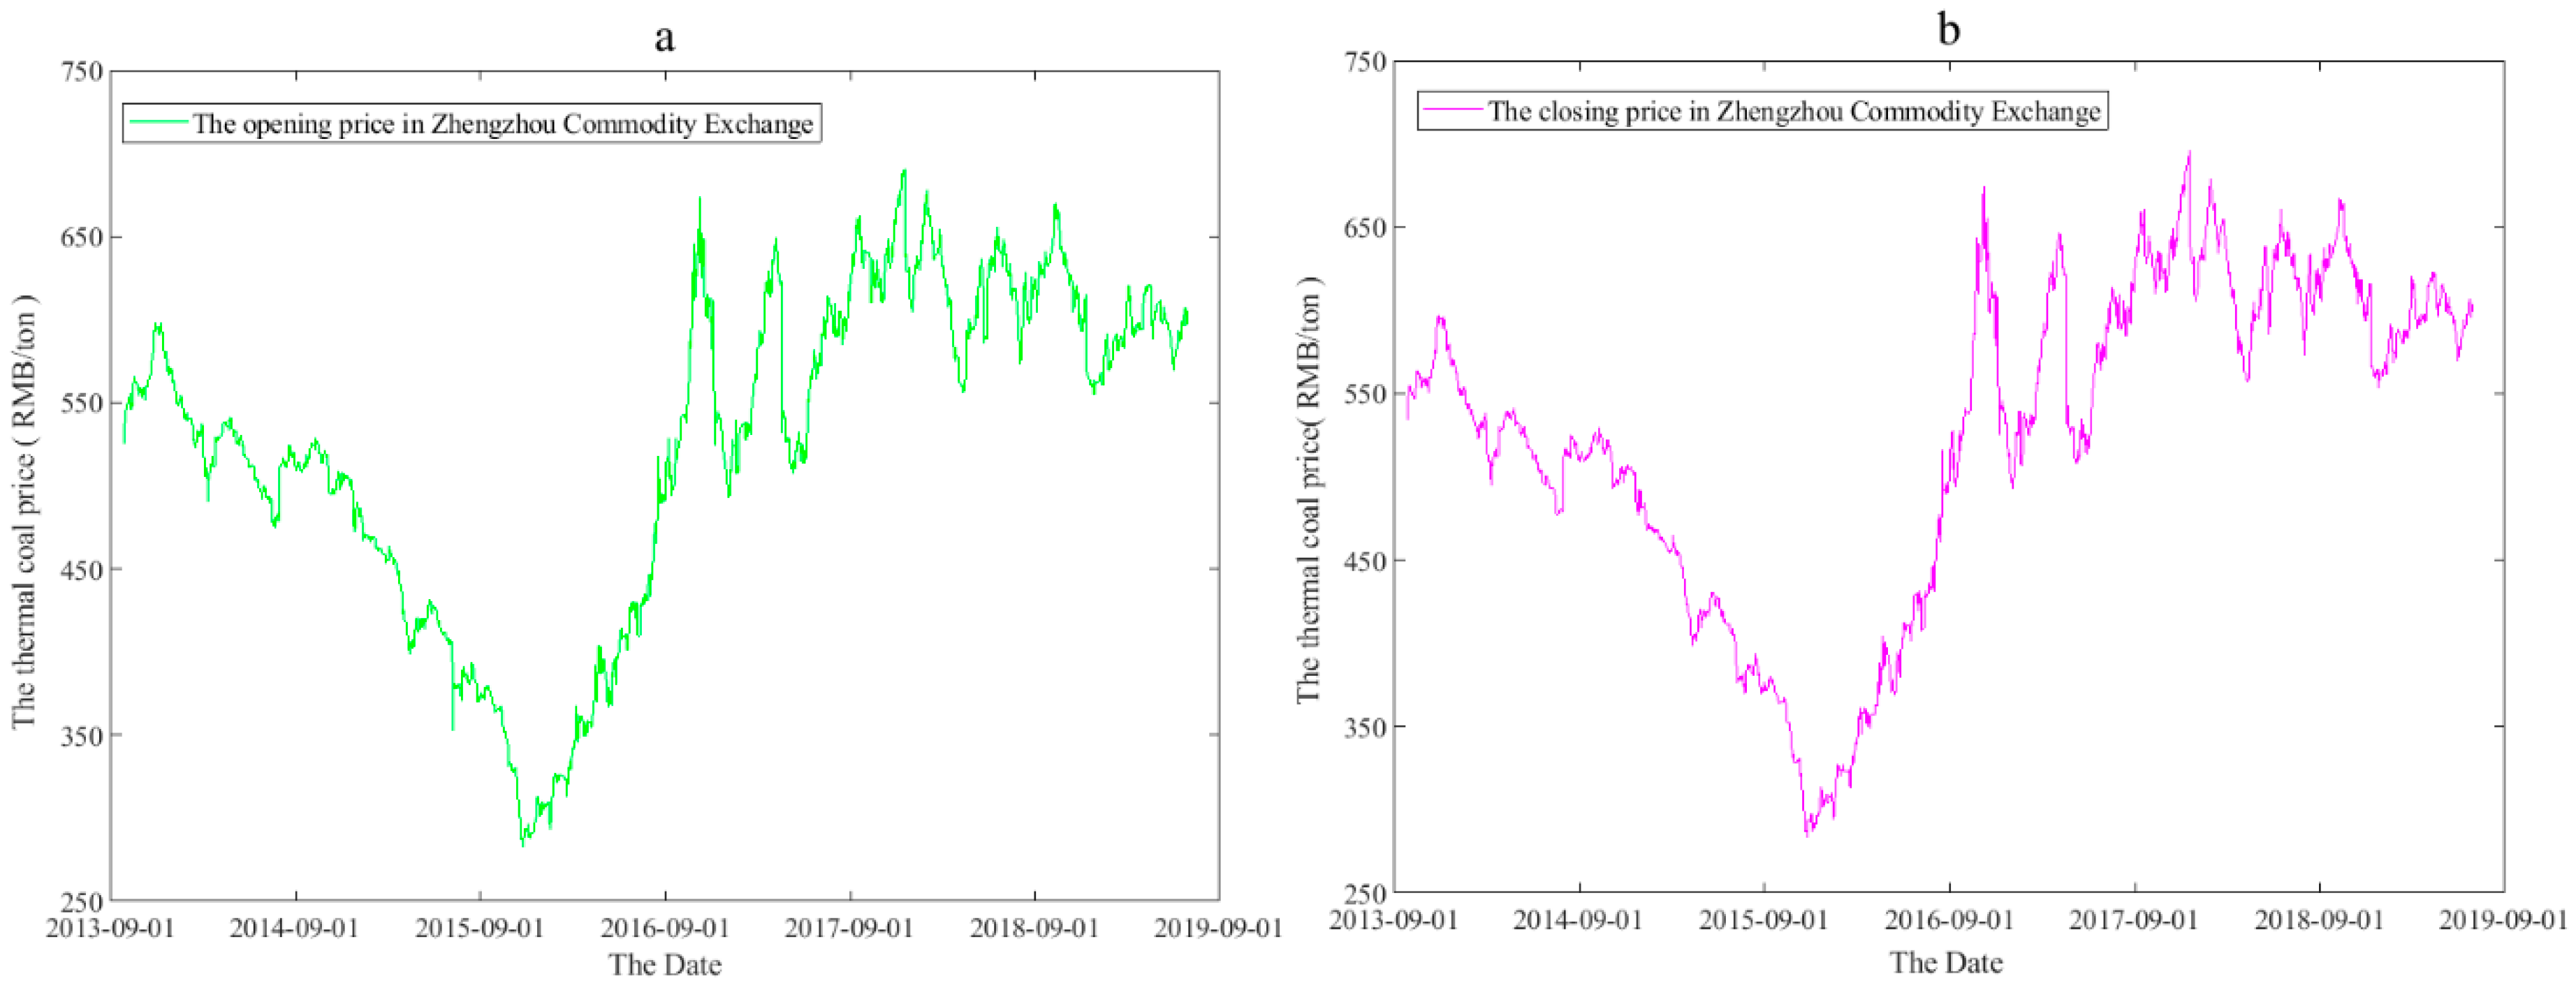
Figure 1. The fluctuation trend of the thermal coal price. (a) The opening price in Zhengzhou Commodity Exchange; (b) The closing price in Zhengzhou Commodity Exchange.
Sustainability 12 07815 g001
Figure 2. The node names of the network corresponding to the price series.
Sustainability 12 07815 g002
Figure 3. The directed limited penetrable visibility graph of the price series.
Sustainability 12 07815 g003
Figure 4. The directed limited penetrable visibility graph of the OPS and CPS.
Sustainability 12 07815 g004
Figure 5. The directed non-penetrable visibility graph of the nodes of the OPS to CPS.
Sustainability 12 07815 g005
Figure 6. The directed non-penetrable visibility graph of the nodes of the CPS to OPS.
Sustainability 12 07815 g006
Figure 7. The directed interdependent network about the OPS and CPS of the thermal coal.
Sustainability 12 07815 g007
Figure 8. The DLPIN of the thermal coal price information.
Sustainability 12 07815 g008
Figure 9. The in-degree, out-degree, and degree distribution of the nodes under time distribution.
Sustainability 12 07815 g009
Figure 10. The double logarithmic distribution and cumulative degree distribution of the nodes: where k i n means the in-degree of the node, k o u t means the out-degree of the node, and k = k i n + k o u t .
Sustainability 12 07815 g010
Figure 11. The Betweenness Centrality (BC) distribution of the nodes in the directed limited penetrable interdependent network (DLPIN).
Sustainability 12 07815 g011
Figure 12. The Closeness Centrality (C-C) distribution of the nodes in the DLPIN.
Sustainability 12 07815 g012
Figure 13. The Eigenvector Centrality (EC) distribution of the nodes in the DLPIN.
Sustainability 12 07815 g013
Figure 14. The clustering coefficient (CC) and distribution of the nodes in the DLPIN.
Sustainability 12 07815 g014
Figure 15. The distribution characteristics of the degree, authority, and hub of the nodes.
Sustainability 12 07815 g015
Table 1. The basic statistical characteristics of the thermal coal price in different times.
Price SeriesMeanStd. DevSkewnessKurtosisJarque-BeraProbability
Opening Price522.1598.92−0.62902.3953114.0466 ***0.0000
Closing Price522.3899.03−0.62652.3874113.8754 ***0.0000
Note: *** denotes the significance level = 1%.
Table 2. Unit root tests between the opening price series (OPS) and closing price series (CPS).
Different Times LevelFirst Difference
ADFPPKPSSERS ADFPPKPSSERS
The OPS−1.3428−1.27421.9876 ***6.2557−39.3769 ***−39.3651 ***0.13070.0959 ***
The CPS−1.3753−1.26941.9941 ***6.0629−40.1153 ***−40.1515 ***0.14000.1407 ***
Note: The unit root tests about the ADF, PP, KPSS, and ERS Point-optimal include only a constant. *** denotes significance at 1% levels.
Table 3. Unrestricted cointegration test from the OPS vs. CPS.
VariablesTestHypothesized No. of CE(s)Statistic ValueCritical ValueProb.**
0.010.05
The OPS vs. the CPSTraceNone *307.546019.937115.49470.0001
At most 11.69826.63493.84150.1925
Maximum EigenvalueNone *305.847818.520014.26460.0001
At most 11.69826.63493.84150.1925
Note: Trace test and Max-eigenvalue test indicate 1 cointegrating equation(s) at the 0.01 and 0.05 level, CE(s) is the Cointegrating Equation (s), * denotes rejection of the hypothesis at the 0.01 and 0.05 level, ** MacKinnon-Haug-Michelis (1999) p-values.
Table 4. The corresponding relationship between the price series and number series.
Different SeriesNumbersTimes x i X i
The Opening
Prices Series
(The OPS)
126 September 2013525.400.6115
227 September 2013535.800.6292
330 September 2013545.000.6447
48 October 2013555.000.6617
59 October 2013546.400.6471
610 October 2013545.600.6458
14051 July 2019605.400.7471
The Closing
Prices Series
(The CPS)
140626 September 2013534.400.6268
140727 September 2013546.600.6475
140830 September 2013555.000.6617
14098 October 2013547.400.6488
14109 October 2013547.000.6481
141110 October 2013547.400.6488
28101 July 2019598.800.7359
Table 5. The statistical characteristics of the network.
Index NameCorresponding Value
Total number of the edges68,573
The average degree24.403
The average path length4.397
The diameter12
The density (D(G))0.0087
The modularity (M)0.586
Table 6. The statistical information of the BC and degree (the first six from big to small).
Sort BC From Big to SmallSort k From Big to Small
BCkkinkoutkkinkoutBC
0.09007235801437235801430.0900
0.08806905741166905741160.0880
0.08051617487610594160.0043
0.06671539459596585110.0028
0.0534884147579530490.0339
0.0377965640563532310.0266
Table 7. The statistical information of the EC for DLPIN.
DLPIN
ECkThe NodesTime
1.0000610N75026 October 2016
0.9294596N215425 October 2016
0.8572723N75908 October 2016
0.8495551N74925 October 2016
0.8454690N216307 October 2016
0.8386561N215324 October 2016