Abstract
Organizations, companies and start-ups need to cope with constant changes on the market which are difficult to predict. Therefore, the development of new systems to detect significant future changes is vital to make correct decisions in an organization and to discover new opportunities. A system based on business intelligence techniques is proposed to detect weak signals, that are related to future transcendental changes. While most known solutions are based on the use of structured data, the proposed system quantitatively detects these signals using heterogeneous and unstructured information from scientific, journalistic and social sources, applying text mining to analyze the documents and natural language processing to extract accurate results. The main contributions are that the system has been designed for any field, using different input datasets of documents, and with an automatic classification of categories for the detected keywords. In this research paper, results from the future of remote sensors are presented. Remote sensing services are providing new applications in observation and analysis of information remotely. This market is projected to witness a significant growth due to the increasing demand for services in commercial and defense industries. The system has obtained promising results, evaluated with two different methodologies, to help experts in the decision-making process and to discover new trends and opportunities.
1. Introduction
One of the biggest threats for academia, governments, entrepreneurs and companies is the continuous changes in expanding markets. In fact, companies very often show difficulties predicting these variations and acting on time [].
Markets in general have proven to be unpredictable environments where making right decisions at the right time is very hard, but undoubtedly, doing so can be translated into better results for an organization.
In addition, social entrepreneurs contribute to creating social wealth by addressing social problems and enriching communities and societies. For this reason, an early discovery of a new problem or opportunity in the market could become vital for the success of the entrepreneurial venture [].
The amount of data managed by any organization is increasing considerably every day. Therefore, these processes of discovering new business opportunities involve both data engineers, and data scientists who must implement automatic analytics that reduce execution times and requirements, while providing a high reliability. For this reason, both software and hardware requirements need to be implemented in the most efficient way.
1.1. Weak Signals
The process of scanning an environment requires the identification of future signals in the shape of events, trends, and their relationships, by analyzing information [].
A weak signal is a type of future signal [] which can be defined as the evidence of emerging changes in a continuous process of exploration of a specific environment []. Weak signals are events that are too novel to measure their future impact and to react properly to them [].
These signals have seven common attributes: (1) an idea that will change the environment of an organization, (2) a novelty from the personal perspective of an expert, (3) difficult to detect among other events, (4) a threat or opportunity for the stakeholders, (5) often opposite to the opinion of a big group of experts, (6) it usually takes time before it becomes mainstream, and (7) is an opportunity to learn, grow and evolve [].
Therefore, a weak signal is hardly discernible in the present but will become an important trend []. If one of these signals evolves to the point that it becomes relevant or a strong signal, it will reinforce or obstruct the strategy of an organization.
Although “weak signals” is a term that is becoming popular in research studies, there are other synonym terms in literature, such as “seeds of change” [], “facts emerging” [,], “strategy signals” [] and “early warning signals” []. The semiotic model of the future sign by Hiltunen [], which follows the same structure of the semiotic model of the sign by Peirce [], has become the standard to identify the dimensions of future signals, and to understand the process of their amplification.
Hiltunen model defines three different dimensions for future signals: “issue”, “signal” and “interpretation”. The signal is defined as “the real visibility of a signal”, the issue is defined as “a variety of events”, and the interpretation is defined as “the meaning that a receiver gives to the sign”.
Information technology, thanks to its role in business intelligence, has become relevant in the detection of signals of the future []. Business intelligence is the knowledge applied to stored information, to interpret, forecast and act appropriately to the outside world []. In conclusion, there are three interrelated concepts: business intelligence as a discipline, data mining as a procedure, and the detection of weak signals of the future as an objective.
This analysis is widely used in many research works, such as, for example, the remote sensing sector [,,]. Traditionally, the detection of future signals has been an activity carried out by experienced experts. Currently, the amount of available information has increased considerably, and experts are not able to effectively scan environments in a very deep way. In addition, advances in hardware technology have made it feasible to compute a vast amount of data in a short time [].
1.2. Background and Related Work
The available studies about weak signals use specific types of sources which are scanned regularly. Most of them are qualitative or unsystematic analyses that are based on a specific model for specific environments. A couple of examples are the identification of signals of the future, related to terrorism or mass transport attacks [] or master planning London’s Olympic legacy []; sensor-based human activity recognition [], mechanical fault prediction by sensing vibration [], or a deep learning analysis to predict parking space availability []. Other examples are the influence of maximization in social networks [], a model to examine what schools would be like if they were a new invention [], or a deep analysis about charge prediction for criminal cases []. In general, these models cannot be used to scan other environments.
Some studies use the opinion of experts and stakeholders as an input for the detection of weak signals. Among those inputs are the feelings of known critics or the behavior of customers [].
Other works emphasize the use of structured data that is either owned by an organization or accessible via web, such as, for example, a methodology to detect weak signals for strategic forecasting []. Weak signals are extracted from the internal repositories of institutions, or available online sources, where online texts are obtained. Another example identifies signals for a better environment understanding, by using a range of storylines with negative and positive valences [].
New studies propose the use of text mining techniques from online sources, as web news to predict the future of solar panels [] or documents from the Journal of the Korean Ceramic Society to scan the field of nanotechnology []. These are also some of the first research proposals that carry out quantitative analysis, but both use a single type of data. This quantification is focused on measuring the importance of the visibility of events.
In addition, there is an available study that is using keyword network analysis, betweenness centrality for convergence measurement, and minimum spanning tree (MST), which provides a new view to detect future trends analyzing the changes in a network of words [], and a study based on text-mining techniques to design multidisciplinary group discussions and generate energy policies and technologies (EP + Ts) in South Korea for the future society, from a multidisciplinary perspective []. Regarding the triad of the future sign in the Hiltunen model, these studies focus on only one data source, ignoring the interpretation dimension.
Another available study creates a model to evaluate if free text expressed in natural language could serve for the prediction of action selection, in an economic context, modeled as a game []. In this study, a classifier is implemented in a model that considers personality attributes, but can only be used in a specific topic, and only uses pre-determined keywords.
The theoretical foundations and methodologies to detect weak signals are developing research areas, and there is a considerable margin of improvement. In other applications beyond identifying future signals, text mining includes natural language processing tools []. As the use of the extraction of multiword expressions is currently providing a good performance in other fields, better results could be expected in the field of future signals.
The process for detecting weak signals is complex, because there are a multitude of sources where they could be masked. Any system implemented for this task must be optimized in both hardware and software to the maximum.
This study describes a system to help experts in the detection of weak signals, by a quantitative analysis of multiple sources applied to the field of remote sensing, considering every word as a keyword, depending only on different types of text documents (unstructured data) used as a dataset. The main contributions are that the system has been designed for any field, using different input datasets of documents, and with an automatic classification of categories for the detected keywords.
Table 1 shows a comparison between the main features of the available systems from previous studies and the implemented system proposed in this paper.

Table 1.
Comparing implemented system with available studies.
This article is structured in the following sections: Section 2 explains, in detail, the design and implementation of the proposed weak signal detection system. In Section 3, the experimental setup to test the system in the field of remote sensing is defined. In Section 4, the results obtained in the experiment for the remote sensing sector are presented. In Section 5, the main findings and limitations of the system are analyzed. Finally, Section 6 synthesizes the conclusions and the lines of future work.
2. Description of the Proposed System
In this section, a description of every step of the implemented system for the detection of weak signals is carried out. This system has been designed to detect the three dimensions described by n.
In order to monitor a specific sector, organizations use data repositories that have been created internally and are already available [,]. However, for this study, the first step has been the creation of a dataset of information from several online sources. One of the main suppositions of the implemented system is that, in order to adapt it to a different sector, it is only necessary to generate a new dataset with information from that field. The data sources used to create the dataset have been scientific articles, newspaper articles and social media posts.
The collected documents are analyzed, and information is extracted from each one of the words from them. Next, categories are assigned to each one of those words, and text mining techniques are used to detect candidates for weak signals. In the last stage, natural language processing techniques are used to discard false positives and to obtain better results.
The seven stages of the implemented system can be seen in Figure 1 and are explained in the following subsections: (i) Definition of the data input, (ii) Creation of an input dataset, (iii) Extract-Transform-Load (ETL), (iv) Category assignment, (v) Text mining and clustering, (vi) Natural language processing (NLP), and (vii) Interpretation, evaluation and decision making.
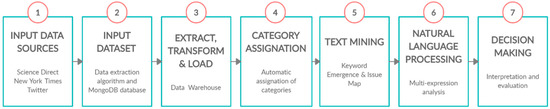
Figure 1.
Steps of the system implemented to detect future signals.
2.1. Stage 1: Definition of the Input Data Sources
The signal and issue dimensions depend on the visibility of an event, but the dimension of interpretation depends on the original source of that event. Therefore, to consider the dimension of interpretation, input data should come from documents from different types of sources.
To determine the sources that will be considered in the study, a better understanding of the process of diffusion of a novelty and its potential applications for society is required. Every issue is coded through primary signals called exosignals, that are later interpreted by one or several actors, placing it within a frame of reference to transform it into an interpreter’s endosignal, which will be an input signal that will be interpreted again by other actors [].
A novelty is normally the discovery of a team of engineers and scientists who conduct research. Then, they published their results in a scientific journal. This source is then read by a journalist, who interprets the information and publishes an article in a newspaper or in a web blog. Finally, other users read this post and share the information on social networks, along with their comments, impressions, and sentiments. Figure 2 shows this process.
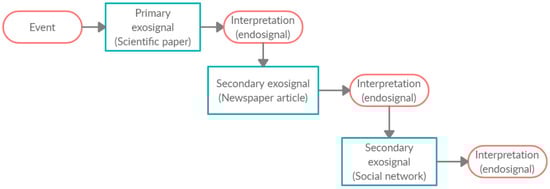
Figure 2.
The process of diffusion of signals and their interpretation.
In order to carry out a detailed monitoring of a sector, three different sources of data have been selected: scientific articles extracted from Science Direct, newspaper articles extracted from the New York Times and posts from the social network Twitter.
The starting point is to create a dataset of scientific documents related to the sector under study. To do this, a search of the selected field must be performed in an academic repository. The source selected is Science Direct, a prestigious and widely used website, which provides access to a large database of scientific and medical research. It hosts over 16 million peer-reviewed articles of content from 4279 academic journals, and covers all study areas: Physical Sciences and Engineering, Life Sciences, Health Sciences and Social Sciences and Humanities.
The next step is to detect newspaper articles related to the sector. For this task, The New York Times has been selected to retrieve all articles that mention the sector. The New York Times is an American newspaper with worldwide influence and readership. The newspaper includes an important Science section, in which journalists report about science to the public.
Finally, Twitter has been used as the source for social network posts, because of its flexibility and the numerous recent studies that have incorporated it as a source of knowledge [,,]. In this study, all Twitter posts sharing one of the detected scientific or newspaper articles have been considered, as well as all the responses and comments to these tweets.
This procedure is thus independent on the field under study, as different datasets of documents can be created for different sectors. Therefore, the system is designed to be applicable to every sector, just generating new input datasets.
2.2. Stage 2: Creation of an Input Dataset
Once the data input is selected, relevant information from Science Direct and New York Times was collected using an algorithm programmed in Python (v3.2.2, Python Software Foundation, Beaverton, OR, USA). This algorithm is created to download data from their respective websites using Beautiful Soup (v3.2.2, open source), a library to analyze HTML (HyperText Markup Language) data.
The algorithm performs a search of a selected field or sector in Science Direct, and extracts the following information for every peer-reviewed paper identified: title, author, summary, keywords, content, conclusions, year of publication and name of the journal. In addition to thousands of journals, Science Direct also contains more than 30,000 books, but the algorithm focuses only on peer-reviewed articles from indexed journals.
The algorithm also performs a search of the same selected field or sector in the New York Times and extracts the following information for every newspaper article: headline, author, section, lead paragraph, content, and year of publication.
After that, the Twitter official API (Twitter Application Programming Interface, v1.1, Twitter, San Francisco, CA, USA) is used to extract every tweet that mentions any of the detected scientific and newspaper articles, together with all comments and retweets. The content of the tweet and the year of publication are stored in the database.
There are multiple options for the implementation of the database for the input dataset. NoSQL (non-structure query languages) technologies have emerged to improve the limitations of the available relational databases []. These databases are more oriented to texts and are not modeled in means of tabular relations used in relational databases. In addition, as the dataset is composed of documents from different kinds, document-based databases are generally used []. The main operations that are performed in the database are the insertion and selection of items. As these operations are being carried out thousands of times, the execution time of these actions needs to be as short as possible []. For this reason, MongoDB (v4.0.8, open source) [] is a very efficient database technology oriented to store documents and perform text mining operations. Appendix A includes some computational execution times of the system.
2.3. Stage 3: Extract, Transform and Load (ETL)
The next step is the design of a data warehouse to store a large volume of information []. Each of the words that make up the documents collected in the previous stage is extracted and treated as a keyword, storing the following information items in the warehouse: source document, the number of occurrences, the year of publication and the source. The only words that are not taken into account are stopwords, which are words that do not have a specific meaning, such as articles, pronouns, prepositions, etc. They are filtered before the processing of natural language data, using the Natural Language Toolkit (NLTK, v3.4.5, open source) leading platform in Python.
Along with the elimination of stopwords, a stemming phase is performed to eliminate the suffixes of each word to obtain their root. Snowball, a small string processing language designed for creating stemming algorithms, is used to implement Porter’s process []. In this way, the number of insertions in the data warehouse is reduced. The word that represents the word group is the one that appears most frequently in all the documents in the dataset.
2.4. Stage 4: Category Assignation
In Stage 3, a group of categories is designated for every keyword. Two category assignation processes have been carried out. The first one is the assignation of representative layers. The second one is the automatic assignation of categories based on the topics of the documents where the keyword appears.
In the first process, keywords were classified into different layers: “environmental and sustainability factors”, “business needs” and “technological components”. For example, keywords such as “war” or “oil” were classified as environmental factors, “portable” or “cheap” as business needs, and “batteries” or “hybrid” as product/technological components [].
The second process is to automatically designate several categories for every word. These categories are automatically assigned, considering keywords, topics, and Special Issues of the documents of the scientific journals, where the word detected as a weak signal is present.
Although some studies use standard category lists [], one of the main advantages of assigning categories, automatically and dynamically, is that they only depend on the input dataset, therefore being the most relevant ones for the field of study.
2.5. Stage 5: Text Mining
Weak signals generally carry “information on potential change of a system towards an unknown direction” [].
However, they are very difficult to detect because they could be considered as noise (the trends of these terms are so imperceptible to experts because they do not easily seem to follow any pattern). If these signals exceed a threshold, they become strong signals, known to a vast majority.
In conclusion, weak signals currently exist as small and seemingly insignificant issues that can tell experts and organizations about the changes in the future. A wild card is defined as a surprising event that will have significant consequences in the future []. When this event is produced, the weak signal becomes a strong one. Figure 3 shows the process of weak signals becoming strong ones. The goal of this study is to detect weak signals as early as possible to extend the time to react.
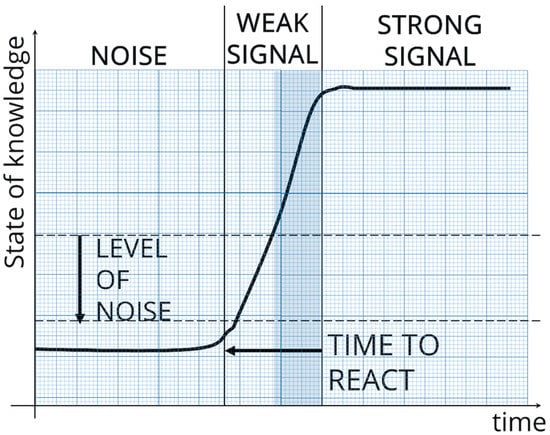
Figure 3.
Relation of Weak Signals and the time available to react.
The main difference between text and data mining is that the first one is applied to extract information from textual documents instead of structured sources []. The detection of these wild cards is similar to the use of data mining techniques to extract patterns in time series []. The main problem is the proper detection of a change point, that is, the identification of the time points where the behavior change is produced. Although all methods lose precision by decreasing the signal/noise ratio, the Batch algorithm offers better results when the dataset precedes the analysis, as in the case under study.
As previously described, the three components of the semiotic model need to be identified: signal, issue and interpretation.
The signal dimension is related to the absolute number of appearances of every word []. To measure this dimension, the degree of visibility (DoV) is established. First, a value is set by the ratio of the number of appearances and the total number of documents. Then, a factor is introduced to give more importance to the most recent appearances, giving a different weight for every period of a year. In this case study, a dataset of more than fifty thousand documents has been divided into eleven periods of one year (from 2007 to 2017). To carefully set the multiplying factor, a group of business experts has been consulted, defining tw as a time weight of 0.05. The description of the DoV of a word i in a period j is shown in Equation (1).
TFij is the number of appearances of the word i in period j, NNj is the total number of documents in the period j, while n is the number of periods and tw is a time weight.
The issue dimension is related to the total number of documents where the keyword appears []. To measure this dimension, the degree of diffusion (DoD) is established. As in the previous equation, the first step is to set the ratio of the number of documents which contained the keyword and the total number of documents. Then, a factor is introduced to give more importance to the most recent appearances, giving a different weight for every period of a year. This multiplying factor is set, following the same considerations than in the previous case. The description of the DoD of a word i in a period j is shown in Equation (2).
DFij is the number of texts where the word can be found.
Future signals that are candidates for weak signals have an absolute low number of occurrences, but a high fluctuation (a high geometric mean of DoD/DoV but low number of occurrences).
With the calculation of the increase ratios for every word in every document from the input dataset, two graph maps can be generated: the “Keyword Issue Map (KIM)”, a map of DoD with the absolute number of appearances of every word; and the “Keyword Emergence Map (KEM)”, a map of DoV with the number of texts, where every word can be found.
The structure of these two maps is shown in Figure 4. Above a threshold in the time weighted increasing rate axis, two clusters can be identified: the “Strong Signals” area is above an average frequency threshold, and the “Weak Signals” area is below. Below a line on the Y axis, words are identified as noise. This last cluster consists of terms that should be discarded because their appearances are not increased through time, or simply, if their appearances are studied, they do not follow any pattern at all.
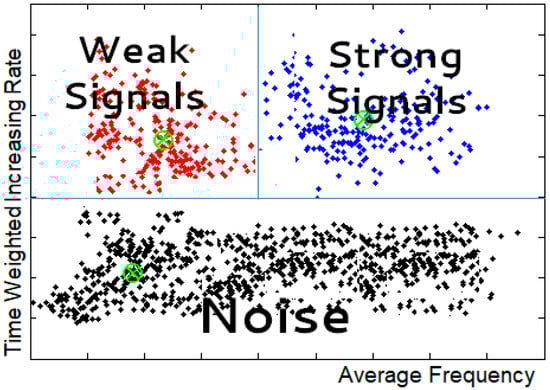
Figure 4.
The clusters of a Keyword Map.
The third dimension is interpretation, and this component is related to how the type of document influences the transmission of the signals. The importance of scientific journals has been selected to measure this dimension, because the first exosignals generated are usually the result of a research published in this type of documents.
All available bibliometric indexes for scientific journals have their advantages and limitations, but in general, studies show a high correlation between them, especially in the top of their rankings []. There are several journal indexes, such as the Journal Impact Factor (JIF), SCImago Journal Rank or SJR indicator, Eigenfactor Metrics, Scopus h-index or Google h-index. Documents published in journals with a high factor are more influential, and therefore, could accelerate the transformation of weak signals into strong.
Although Impact Factor is widely used, it does not consider that the source of the citations and journals that publish a large amount per year have less potential for a high Impact Factor. Clarivate Analytics has added the Emerging Sources Citation Index to extend the scope of publications in the Web of Science, but this index classifies scientific papers from 2015, and this study is using a dataset of documents from 2005. SCImago Journal Rank indicator is based on the SCOPUS database, which is bigger than the Journal Impact Factor, and places more emphasis on the value of publishing in top-rated journals than on the number of citations of a publication. In addition, SCImago has taken its database and calculated the H-index of every journal, providing a relevant value within the field of research.
The degree of transmission (DoT) is measured, considering all h-index values from the journals from all texts where the word i can be found, as shown in Equation (3). This index has been selected for several reasons: (i) it is based on a bigger database than Journal Impact Factor, (ii) it is freely available, which means it is easier to access to its content, helping the transmission of new changes, and (iii) unlike citations-per-article measures like Impact Factor, it is not skewed by a small number of individual, highly cited articles.
The values of the interpretation are graphically expressed with different sizes for each dot (which represents a keyword) in both KEM and KIM maps. For the final consideration of terms related to weak signals, every DoD and DoV are multiplied by their DoT. This way, scientific journals have a higher weight in the detection of weak signals than the other sources.
2.6. Stage 6: Natural Language Processing (NLP): Multi-Word Expressions
The words in both maps are possible terms related to weak signals. As a result, all keywords not detected in both maps are discarded. However, it is hardly ever possible to extract valuable information with just a single word, considering that a single word can have several meanings, or at least, be connected to several sub-issues.
Natural language processing is widely used in controlled environments [], but in this study, it is used as an additional stage to improve the quality of the information selected. As the system is only depending on the input dataset, NLP techniques are applied in no controlled environments, considering multi-word expressions.
In conclusion, the next step is a multi-word expression analysis, a natural language processing technique that will help obtain more accurate results, as is shown in previous studies [,]. The analysis is performed in the list of detected terms from the text mining analysis from the previous step. The study involves the first words immediately preceding and following the identified term in every appearance, but discarding all stopwords.
The result of the process is a network of expressions related to a keyword, ranked by their overall popularity.
2.7. Stage 7: Interpretation, Evaluation and Decision-Making
As a result of the whole system, experts and other stakeholders will have access to four outputs that will help them in the decision-making process:
- A list of potential weak signals represented in the Keyword Issue Map, depending on their Degree of Diffusion and Degree of Transmission.
- A list of potential weak signals represented in the Keyword Emergence Map, depending on their Degree of Visibility and Degree of Transmission.
- A ranking of all the keywords present in both graphs, which are more likely to be connected to weak signals.
- The results of the multi-word analysis, providing more accurate results to discard false signs.
3. Experimental Setup
3.1. Definition of the Experiment for Remote Sensing Sector
Once the parts of the proposed system have been described in the previous section, an experiment has been defined to test it. As previously stated, the system can be applied to any sector, because it is only dependent on the input dataset of documents. For this study, the sector that has been chosen is remote sensing. The main reason is because the global market for services related to remote sensing is in a huge expansion and will reach US $7 billion by 2024, due to applications that require the exploitation of satellite image data for companies and governments, such as disaster prevention, weather forecast or agriculture [].
Remote sensing services are providing new applications in observation and analysis of information at remote locations by means of airborne vehicles, satellites, and on-ground equipment []. Remote sensing solutions have multifaceted social applications, such as the mapping of open water surfaces, soil moisture mapping, surface movements, data mosaic and satellite maps, geology and mineral resources, urban and rural development, disaster management support, and climate change studies, among others.
The remote sensing market is projected to witness a significant growth due to the increasing demand for remote sensing services in our society. This growth of remote sensing services is attributed to the effective and flexible data-gathering from remote locations without being physically there [].
In conclusion, as there are currently many possibilities for social entrepreneurs and companies to work on remote sensing applications, the system has been applied to facilitate the prediction of the future impact of new technologies by the detection of weak signals.
To obtain the input data for the system, a search of the term “remote sensing” was performed in Science Direct and New York Times sources between 2007 and 2017. As recent appearances have more relevance in the weak signal analysis, documents prior to 2006 were not considered because their contribution to the results is negligible.
Although Science Direct also contains electronic books, only peer-reviewed scientific articles were considered in the study. The Python algorithm downloaded the required information from both websites and stored them in databases, as described in the previous section. After that, all tweets sharing all the detected documents from Science Direct and the New York Times were considered, together with all comments and responses from other users in the social network to those tweets.
As a result, more than 43,000 ScienceDirect scientific articles, 1800 New York Times newspaper articles and 59,000 Twitter tweets between 2007 and 2017 were extracted and divided into 11 groups of documents from every year for the analysis. Document distribution by type and year is shown in Figure 5.
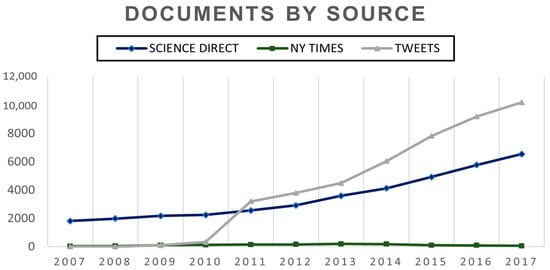
Figure 5.
Dataset of documents by type of source.
Once the input dataset was created, the additional stages of the system were performed. First, a data warehouse was created to store information from every word of every document: source document, number of occurrences and year of publication of the source. As previously stated, all stopwords were discarded and a Porter’s process of stemming was carried out. After this, the steps of category assignation and text mining were developed. As a result, a list of keywords related to weak signals was obtained, and both Keyword Issue and Emergence Maps. The next step was to carry out the multi-word expressions analysis, with the detected words from the previous steps.
3.2. Definition of the Evaluation Methods
In a quantitative analysis, words related to weak signals are expected to show a low absolute number of occurrences, but a high range of fluctuation []. The graph of DoV and DoD of a weak signal shows this behavior. A first analysis has been carried out to check that all detected weak signals follow this behavior.
In addition, two different methodologies have been used to evaluate the consistency of the algorithm. The first one consists of generating an additional dataset with the segment of documents for the years 2018 and 2019. Then, it is possible to compare which weak signals have become strong signals, knowing that no documents from these years are in the dataset of the experiment carried out to detect them.
The second method consists of consulting a group of experts to know if there is a match between their opinion and the obtained results []. A group of five experts in remote sensing from different institutions were interviewed to compare the results of the test with their predictions.
4. Results
In this section, the output results of the application of the implemented system applied to remote sensing will be described. Computing information about this experiment is shared in Appendix A.
4.1. Keyword Issue Map (KIM) for Remote Sensing
The two main factors that have been considered to configure the Keyword Issue Map are the number of documents where the term appears, and the geometric mean of an average time-weighted increasing rate of this frequency.
These potential weak signals have in common a low frequency of documents where the word can be found, but a high increasing rate. If a word has a high frequency of documents, the word is connected to a strong signal.
These two factors are used to measure the issue component of the sign from the semiotic model of the future sign.
A group of 248 words has been detected, that belong to the cluster of potential weak signals according to the criteria of their degree of diffusion, or DoD.
In addition, the interpretation dimension of the sign is measured using the impact factor or h-index of every word, giving a different size of every dot according to this value.
The clustering algorithm has determined a threshold of 104.54 of average document frequency. Above this threshold, there are no words considered as weak signals.
Figure 6 shows the graph of the Keyword Issue Map that has been generated in the test of the system.
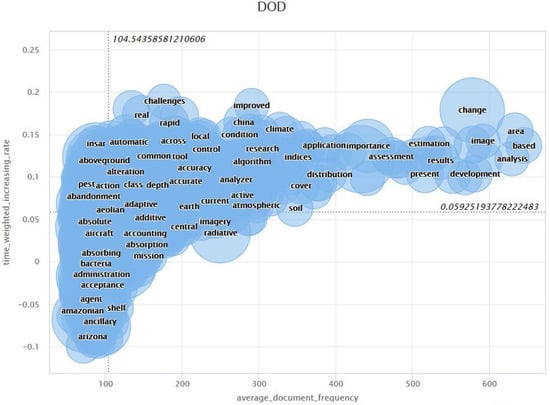
Figure 6.
Keyword Issue Map obtained for remote sensing test.
4.2. Keyword Emergence Map (KEM) for Remote Sensing
The two main factors that have been considered to configure the Keyword Emergence Map are the number of appearances of a term, and the geometric mean of an average time-weighted increasing rate of this frequency.
These potential weak signals have in common a low frequency of occurrences of the word, but a high increasing rate. If a word has a high frequency of occurrences, the word is connected to a strong signal. These two factors are used to measure the signal component of the sign from the semiotic model of the future sign.
A group of 233 words has been detected, that belong to the cluster of potential weak signals, according to the criteria of their degree of visibility, or DoV.
In addition, the interpretation dimension of the sign is also measured using the Impact Factor or H index of every word, giving a different size of every dot according to this value.
The clustering algorithm has determined a threshold of 616.01 of average frequency of occurrences. Above this threshold, there are no words considered as weak signals.
Figure A1 in Appendix B shows the graph of the Keyword Emergence Map that has been generated in the test of the system.
4.3. Detected Terms as Potential Weak Signals
A list of 87 words from these two maps fulfill both requirements of low frequency of occurrences and low frequency of documents where the word can be found:
- Keywords related to environmental, sustainability and geographical factors: Africa, alluvial, asteroids, attenuation, bedrock, Canadian, curvature, depression, desertification, disaster, diurnal, ENSO, extinction, foliar, forestry, Italy, Miocene, multitemporal, observatory, oceanography, pollen, rainforest, rangeland, southeast, sprawl, threat, topsoil, waste, weed and Wuhan.
- Keywords related to business needs: adjacent, archival, breaking, care, check, consumption, diagnosis, forward, guidance, indirect, interior, intervention, invariant, kernel, maximization, mega, native, NOAA, physiological, plantation, preference, probabilistic, rational, residential, stakeholder, super, supervised, triggering, uptake, vibration and wild.
- Keywords related to product/technological components: actuator, adaptative, array, bathymetry, cassini, clay, color, converter, endmember, excitation, gamma, hitran, inorganic, InSAR, oblique, passage, photometry, pigments, Rosetta, sounder, SRTM, stepwise, unmanned, UVSQ, volatile and voxel.
Some of the terms identified in both the Key Emergence Map and the Key Issue Map are shown in Table 2. This table shows a list of some of the keywords detected, divided into three different layers (business needs, environmental or geographical factors and product/technological components), their values of frequency of appearances (DoD and DoV) measured using Equations (1) and (2) applied to the whole period of 11 years, their normalized time-weighted increase ratios in the whole period, and its degree of transmission (DoT) measured using Equation (3). The table also shows the categories that have been assigned automatically by the system, in the third stage of the system. Some detected categories for remote sensing are climate change, meteorology, geography, water research, space, or agriculture.
Table 2.
Group of keywords related to weak signals detected in remote sensing test.
The pattern of the degrees of visibility and diffusion of the word “desertification”, one of the terms identified with a weak signal in the field of remote sensing, is shown in Figure 7. All graphs of DoV and DoD from every detected word show an abnormal pattern with a low frequency.
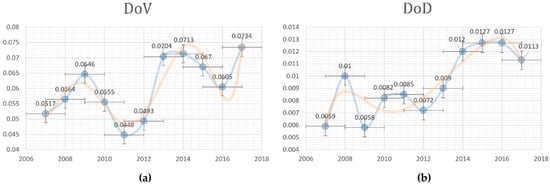
Figure 7.
The fluctuant pattern in the DoV (a) and DoD (b) of the word “desertification”.
4.4. Results of the Multi-Word Analysis
Some of the detected words from the text mining analysis were selected to perform a multi-word analysis with them, with the objective of obtaining more accurate information.
A few expressions identified as potential weak signals are “climate engineering”, “biosatellite engineering”, “spectral splitting”, “dioxide splitting”, “adaptative encoding”, “spectroscopic voxel”, “cooperative coevolution”, “desertification reversion”, “global desertification”, “ground photometry”, “urban sprawl”, “West Africa” or “UVSQ-Sat”. Figure 8 shows the words that have a higher correlation with the terms “desertification” and “photometry”, two of the detected terms related to work signals. The figure below every term is the percentage of times that the word appears beside “desertification” or “photometry” in all the documents of the dataset.
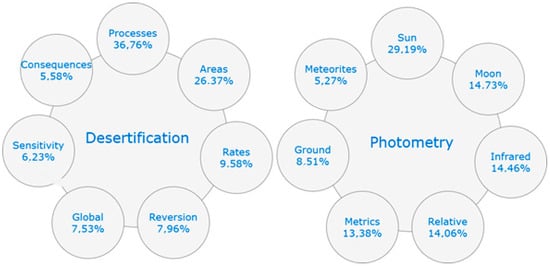
Figure 8.
Multi-Word Expressions Related to the words “desertification” and “photometry”.
4.5. Evaluation of the Results
In this experiment, some strong signals were detected in the period of 2018 and 2019, based on five scientific papers for 2018 and 2019 from the journal Remote Sensing, which showed the importance of West Africa [,,,,,], which was one of the expressions detected as a weak signal in the experiment related to the remote sensing sector. The expression “UVSQ-Sat”, which means “UltraViolet and infrared Sensors at high Quantum efficiency onboard a small SATellite”, detected as a candidate of weak signal and now a strong signal, appears for the first time in the title of a scientific paper of 2019 []. Finally, other detected keywords, such as “NOAA (National Oceanic and Atmospheric Administration)”, “InSAR (Interferometric synthetic aperture radar)”, “Rosetta” and “SRTM (Shuttle Radar Topography Mission) are also becoming strong signals in the last two years.
Regarding the group of experts, they indicated the following statements:
- The growth of remote sensing services is attributed to the effective and flexible data-gathering, thanks to highest resolutions of the metrics, cloud computing software and machine learning techniques. Several terms, such as “adaptative encoding” or “voxel”, were detected as related to weak signals.
- Among the outstanding applications, agriculture and especially desertification, are areas in which remote sensors will be more relevant. Desertification and other terms related to agriculture are keywords that the algorithm identified is related to weak signals.
- Interferometric synthetic aperture radar, abbreviated “InSAR”, which is a radar technique used in geodesy and remote sensing, is becoming more and more important. InSAR is a keyword that the algorithm identified as related to weak signals.
- West Africa is becoming one of the most interesting areas in the world for remote sensing applications. “West Africa” is an expression that the algorithm identified as related to weak signals [,,,,,].
5. Discussion
The main findings of the obtained results and the main limitations of the methodologies will be described in this section.
5.1. Main Findings
The input dataset that was generated consists of multiple documents about the remote sensing sector that were extracted from three different types of sources. There are a small amount of newspaper articles compared with the amount of scientific papers, which means that newspapers filter the content of scientific journals, publishing only relevant results and their applications []. However, the large number of tweets found shows that society has special interest in the applications of this sector.
Previous studies such as Koivisto et al. [], Yoon [] and Griol-Barres et al. [] have only detected weak signals related to terms within standard lists of keywords. The results show that several terms which rarely could be found on standard databases can be detected by this system, providing more reliable results. The results of the experiment show that the system can detect words such as “ENSO (El Niño–Southern Oscillation)”, “NOAA (National Oceanic and Atmospheric Administration)” or the Chinese region of Wuhan, because every word in every document is processed as a potential keyword.
The keywords related to weak signals are isolated terms that do not provide enough information for a rich analysis. The automatic assignation of categories to the weak signals detected provides more useful information. For instance, the word “Africa” was detected as one related to weak signals. The Classification stage provided the categories of “climate change” and “water research” for the word “Africa”, giving additional information about applications and subsectors where this word is becoming more relevant. As previously stated, these categories are obtained automatically, considering the names, keywords, topics, and Special Issues of the scientific articles and journals where the word “Africa” is present.
A multi-word analysis was performed to detect expressions that provide more accurate information that can be useful for experts and other stakeholders in their decision-making processes. For this process, only the 87 terms detected were considered. For instance, “West Africa” was a popular expression detected, providing a bit more information about the weak signal. Another example is the term “desertification”, that refers to a problem that can be tackled by remote sensing applications, while the multi-word expression “desertification reversion” refers to new opportunities to solve the problem.
After obtaining the results, the next step is to evaluate and validate them. In standard applications of neuronal networks, the dataset is usually divided into subsets to train and test the network. However, this is not recommended in applications to detect signals of the future applications, due to the low frequency of occurrences of words related to weak signals. In a previous study related to weak signals [], results were validated, with a deeper evaluation of the same documents of the dataset that was used for the test. This is also not recommended because results should be confirmed with external factors and not by using the same input dataset.
In another study [], a machine learning technique known as transductive learning was used to train the system, exposing the algorithm to all the examples (i.e., all written texts), but using specific labels (i.e., actions selected) for a subset of these examples. The main difference with this study is that, in this proposal, labels or categories are built automatically to build a system than can be used in any sector.
Two evaluation methods have been performed. The first method of evaluation has been carried out in previous works [,], and is based on the detection of strong signals in a new input dataset, with more recent documents than the ones considered in the experiment. In this method, the presence of strong signals in recent documents that were detected as weak signals in earlier references is considered a confirmation of the success in weak signal detection. To confirm the experimental results of the experiment, a new test was conducted with a dataset of documents from 2018 and 2019 related to remote sensing; a group of the detected weak signals have become strong signals. The second method of evaluation was to leverage relevant indicators from a group of experts in the field. The results have confirmed that the weak signals detected in our experiments matched the indicators identified by a panel of experts in the field of remote sensing. In conclusion, the obtained results and the methodologies applied in the evaluation show interesting and promising points that could be useful to detect new opportunities to entrepreneurs and other stakeholders, but the study also shows several limitations which will be addressed in future work.
5.2. Limitations
Although the study results are interesting, the experiment has confirmed that single word expressions do not generally provide relevant information for a better understanding of future trends. Furthermore, although systems to detect weak signals have been evaluated in various sectors [,], new studies in other fields should be carried out, to continue testing whether the proposed system is portable to other domains.
The lists of detected words in both the Keyword Issue and Emergence Maps present promising results, but they can also contain false positives that are not really connected to weak signals. A cost-effective method to avoid this situation has been adopted, by considering the words that appear in both lists, but this approach has the limitation of discarding some weak signals.
The automatic assignation of categories and applying natural language processing techniques such as the multi-word expression analysis are providing more useful information to entrepreneurs and other stakeholders. However, to improve the system to provide clearer and definitive guidance for decision-making, more natural language processing techniques could be applied, such as bag of words recognition, regular expressions, or sentiment analysis [], which will be tested in our future work.
The evaluation techniques applied to the system also present several limitations. The main problem of using a more recent input dataset to validate the results is that this can only be performed when a new dataset of documents is available. The conclusion is that this limitation can be assumed, as the study is concerned with the prediction of future trends, and consequently, the only fully reliable check method is to wait until that future becomes the present. On the other hand, using a group of experts to evaluate the results allows an immediate assessment, but has the limitation that they could discard some weak signals when they are out of their field of knowledge.
Despite these limitations, the performed experiment and its evaluation show that the implemented system is reaching good reliability, according to the opinion of the group of experts in remote sensing, and the dataset of documents from 2018 and 2019.
6. Conclusions
This study describes the design, implementation, and evaluation of a system to identify weak signals of the future. This system is designed to help experts, startups and other stakeholders in their decision-making processes, due to the difficulty of scanning complex environments full of textual information.
The system has been designed under the constraints of high efficiency, the use of multiple types of input sources, data sources of unstructured textual documents, its applicability in every field of study, and to extract conclusions based on quantitative results that are not dependent on the opinion of experts []. The experimental setup of the system includes a dataset of documents from 2007 to 2017 related to the field of remote sensing. Two methodologies to evaluate the experiment (new dataset with documents from 2018 and 2019 and a group of experts) were applied, with promising results that can be used by entrepreneurs and other organizations in their decision-making processes.
The system is only dependent of its input dataset of documents. If the system is tested in a different sector, it is only necessary to obtain a different input dataset with documents related to that sector, following the instructions explained in Section 2. In addition, although some studies use standard category lists [], one of the main advantages of assigning categories automatically and dynamically is that they are only dependent on the input dataset, therefore being the most relevant ones for the field of study. In conclusion, the system can be used to perform the detection of weak signals of the future in multiple sectors. The outputs are obtained by a quantitative scoring methodology that does not depend on the opinion of experts.
Finally, in future research, the system will be tested in other sectors, and new natural language processing techniques will be applied.
Author Contributions
Conceptualization, I.G.-B., S.M. and J.M.; methodology, I.G.-B. and J.M.; software, I.G.-B. and S.M.; validation, I.G.-B., S.M., H.F. and J.M.; formal analysis, I.G.-B.; investigation, I.G.-B. and J.M.; resources, I.G.-B., S.M. and H.F.; data curation, I.G.-B. and S.M.; writing—original draft preparation, I.G.-B., writing—review and editing, I.G.-B., A.C., H.F. and J.M.; visualization, I.G.-B.; supervision, J.M.; project administration, I.G.-B. and J.M.; funding acquisition, I.G.-B., H.F. and J.M. All authors have read and agree to the published version of the manuscript.
Funding
This research is partially supported by EIT Climate-KIC of the European Institute of Technology (project EIT Climate-KIC Accelerator—TC_3.1.5_190607_P066-1A) and InnoCENS from Erasmus+ (573965-EPP-1-2016-1-SE-EPPKA2-CBHE-JP).
Acknowledgments
This research is also part of a PhD from the Department of Electronics Engineering of the Polytechnic University of Valencia.
Conflicts of Interest
The authors declare no conflict of interest.
Appendix A
This appendix shows computing information about the experiment carried out in the study. The first consideration is that computer systems are moving from “central processing” performing on the CPU (central processing unit) to a “co-processing” performing distributed between the CPU and the GPU. To enable this new computational paradigm, there are new parallel hardware architectures that are used by a multitude of application developers. Multicore platforms are providing new computing capacity that enables the execution process of systems that analyze a vast number of documents.
The general-purpose GPU programming has become a standard in deep learning applications and keeps evolving. The Compute Unified Device Architecture (CUDA), which is the Nvidia framework for creating software to be executed in GPUs, is in fact one of the most reliable options for data engineers [].
The tests have been executed on a computer with the following setups:
- CPU: Intel core i7 7500U (Dual Core)
- GPU: NVidia Geforce GT 650M 1024 MB GDDR5—900MHz—384 CUDA Cores
- RAM: 16 GB DD4
The execution times show that the parallel GPU implementation is up to nine times faster compared with the standard sequential alternative using CPUs. The reason why the GPU rendering obtains this optimization is because GPUs have a large number of simple cores which allow parallel computing through thousands of threads computing at a time, and the system requires multiple operations related to every word in every document that can be easily executed in parallel.
Table A1 shows the execution times of the experiment.
Table A1.
Execution times.
Table A1.
Execution times.
| Stage | CPU | GPU |
|---|---|---|
| Data Warehouse creation | 6257 min | 688 min |
| Category assignation | 68 min | 9 min |
| Text mining | 124 min | 11 min |
| Multi-word expressions | 43 min | 6 min |
These results show that, despite the large number of documents processed, the system has been designed in an efficient way so that the calculation can be performed on equipment with medium-level hardware, and, therefore, on an equipment that could be affordable for entrepreneurs and SMEs.
Finally, Table A2 shows a benchmark of operation performance for different database technologies []. After this study, the database technology selected to store the data extracted from documents was MongoDB [], as shown in the definition and implementation of the system.
Table A2.
Comparing operation performance of different DB technologies with ten thousand records (time in milliseconds).
Table A2.
Comparing operation performance of different DB technologies with ten thousand records (time in milliseconds).
| Operation | Oracle | MySQL | MsSql | MongoDB | Redis | GraphQL | Cassandra |
|---|---|---|---|---|---|---|---|
| INSERT | 0.076 | 0.093 | 0.093 | 0.005 | 0.009 | 0.008 | 0.011 |
| SELECT | 0.025 | 0.093 | 0.062 | 0.009 | 0.016 | 0.010 | 0.014 |
Appendix B
Keyword Emergence Map obtained for remote sensing test.

Figure A1.
Keyword Emergence Map obtained for remote sensing test.
References
- Eisenhardt, K.M.; Brown, S.L. Patching: Restitching business portfolios in dynamic markets. Harv. Bus. Rev. 1999, 77, 72–82. [Google Scholar] [PubMed]
- Zahra, S.A.; Gedajlovic, E.; Neubaum, D.O.; Shulman, J.M. A typology of social entrepreneurs: Motives, search processes and ethical challenges. J. Bus. Ventur. 2009, 24, 519–532. [Google Scholar] [CrossRef]
- Choo, C.W.; Auster, E. Environmental scanning: Acquisition and use of information by managers. Ann. Rev. Inf. Sci. Technol. 1993, 28, 279–314. [Google Scholar]
- Ansoff, H.I.; McDonnell, E.J. Implanting Strategic Management; Prentice Hall: Cambridge, MA, USA, 1990; pp. 27–34. [Google Scholar]
- Ansoff, H.I. Managing Strategic Surprise by Response to Weak Signals. Calif. Manag. Rev. 1975, 18, 21–33. [Google Scholar] [CrossRef]
- Cooper, A.; Voigt, C.; Unterfrauner, E.; Kravcik, M.; Pawlowski, J.; Pirkkalainen, H. Report on Weak Signals Collection. TELMAP, European Commission Seventh Framework Project (IST-257822). 2011. Deliverable D4.1. pp. 6–7. Available online: https://cordis.europa.eu/docs/projects/cnect/2/257822/080/deliverables/001-D41Weaksignalscollectionfinal.doc (accessed on 25 April 2020).
- Coffman, B. Part I. Introduction. In Weak Signal Research; MG Taylor Corporation: Louisville, KY, USA, 1997. [Google Scholar]
- Godet, M. From Anticipation to Action, a Handbook of Strategic Prospective; UNESCO Publishing: Paris, France, 1994; p. 59. [Google Scholar]
- Molitor, G.T. Molitor Forecasting Model: Key Dimensions for Plotting the Patterns of Change. J. Future Stud. 2003, 8, 61–72. [Google Scholar]
- Dator, J. Futures Studies as Applied Knowledge. In New Thinking for a New Millennium; Routledge: London, UK, 1996; pp. 66–74. [Google Scholar]
- Dator, J. Universities without quality and quality without universities. Horizon 2005, 13, 199–215. [Google Scholar] [CrossRef]
- Nikander, I.O. Early Warnings, a Phenomenon in Project Management. Ph.D. Thesis, Helsinki University of Technology, Helsinki, Finland, 2002. [Google Scholar]
- Mannermaa, M. Tulevaisuuden Hallinta Skenaariot Strategiatyoskentelyssa. (Managing the Future, Scenarios in Strategy Work); WSOY: Porvoo, Finland, 1999; p. 227. [Google Scholar]
- Hiltunen, E. The future sign and its three dimensions. Futures 2007, 40, 247–260. [Google Scholar] [CrossRef]
- Peirce, C.S. Some Consequences of Four Incapacities. J. Specul. Philos. 1868, 2, 140–157. [Google Scholar]
- Han, J.; Kamber, M. Data Mining: Concepts and Techniques; Morgan Kaufmann Publishers: Burlington, MA, USA, 2001. [Google Scholar]
- Fischler, M.A.; Firschein, O. Intelligence: The Eye, the Brain and the Computer; Addison-Wesley: Boston, MA, USA, 1987; p. 221. [Google Scholar]
- Hong, S.W.; Kim, Y.E.; Bae, K.J.; Park, Y.W.; Park, J.K. Development of analysis model for R&D environment change in search of the weak signal. J. Korea Technol. Innov. Soc. 2009, 12, 189–211. [Google Scholar]
- Thorleuchter, D.; Scheja, T.; Van den Poel, D. Semantic weak signal tracing. Expert Syst. Appl. 2014, 41, 5009–5016. [Google Scholar] [CrossRef]
- Julien, P.A.; Andriambeloson, E.; Ramangalahy, C. Networks, weak signals and technological innovations among SMEs in the land-based transportation equipment sector. Entrep. Reg. Dev. 2004, 16, 251–269. [Google Scholar] [CrossRef]
- Wu, X.; Zhu, X.; Wu, G.Q.; Ding, W. Data mining with big data. IEEE Trans. Knowl. Data Eng. 2013, 26, 97–107. [Google Scholar] [CrossRef]
- Koivisto, R.; Kulmala, I.; Gotcheva, N. Weak signals and damage scenarios—Systematics to identify weak signals and their sources related to mass transport attacks. Technol. Forecast. Soc. Chang. 2016, 104, 180–190. [Google Scholar] [CrossRef]
- Davis, J.; Groves, C. City/future in the making: Masterplanning London’s Olympic legacy as anticipatory assemblage. Futures 2019, 109, 13–23. [Google Scholar] [CrossRef]
- Irvine, N.; Nugent, C.; Zhang, S.; Wang, H.; Ng, W.W.Y. Neural Network Ensembles for Sensor-Based Human Activity Recognition Within Smart Environments. Sensors 2020, 20, 216. [Google Scholar] [CrossRef] [PubMed]
- Huang, M.; Liu, Z. Research on Mechanical Fault Prediction Method Based on Multifeature Fusion of Vibration Sensing Data. Sensors 2020, 20, 6. [Google Scholar] [CrossRef] [PubMed]
- Awan, F.M.; Saleem, Y.; Minerva, R.; Crespi, N. A Comparative Analysis of Machine/Deep Learning Models for Parking Space Availability Prediction. Sensors 2020, 20, 322. [Google Scholar] [CrossRef]
- Baghmolaei, R.M.; Mozafari, N.; Hamzeh, A. Continuous states latency aware influence maximization in social networks. AI Commun. 2017, 30, 99–116. [Google Scholar]
- McGrath, J.; Fischetti, J. What if compulsory schooling was a 21st century invention? Weak signals from a systematic review of the literature. Int. J. Educ. Res. 2019, 95, 212–226. [Google Scholar] [CrossRef]
- Chao, W.; Jiang, X.; Luo, Z.; Hu, Y.; Ma, W. Interpretable Charge Prediction for Criminal Cases with Dynamic Rationale Attention. J. Artif. Intell. Res. 2019, 66, 743–764. [Google Scholar] [CrossRef]
- Van Veen, B.L.; Ortt, R.; Badke-Schaub, P. Compensating for perceptual filters in weak signal assessments. Futures 2019, 108, 1–11. [Google Scholar] [CrossRef]
- Thorleuchter, D.; Van den Poel, D. Idea mining for webbased weak signal detection. Futures 2015, 66, 25–34. [Google Scholar] [CrossRef]
- Rowea, E.; Wrightb, G.; Derbyshirec, J. Enhancing horizon scanning by utilizing pre-developed scenarios: Analysis of current practice and specification of a process improvement to aid the identification of important ‘weak signals’. Technol. Forecast. Soc. Chang. 2017, 125, 224–235. [Google Scholar] [CrossRef]
- Yoon, J. Detecting weak signals for long-term business opportunities using text mining of Web news. Expert Syst. Appl. 2012, 39, 12543–12550. [Google Scholar] [CrossRef]
- Yoo, S.H.; Won, D. Simulation of Weak Signals of Nanotechnology Innovation in Complex System. Sustainability 2018, 10, 486. [Google Scholar]
- Suh, J.H. Generating Future-Oriented Energy Policies and Technologies from the Multidisciplinary Group Discussions by Text-Mining-Based Identification of Topics and Experts. Sustainability 2018, 10, 3709. [Google Scholar] [CrossRef]
- Kwon, L.-N.; Park, J.-H.; Moon, Y.-H.; Lee, B.; Shin, Y.; Kim, Y.-K. Weak signal detecting of industry convergence using information of products and services of global listed companies—Focusing on growth engine industry in South Korea. J. Open Innov. Technol. Mark. Complex. 2018, 4, 10. [Google Scholar] [CrossRef]
- Ben-Porat, O.; Hirsch, S.; Kuchy, L.; Elad, G.; Reichart, R.; Tennenholtz, M. Predicting Strategic Behavior from Free Text. J. Artif. Intell. Res. 2020, 68, 413–445. [Google Scholar] [CrossRef]
- Fink, L.; Yogev, N.; Even, A. Business intelligence and organizational learning: An empirical investigation of value creation processes. Inf. Manag. 2017, 54, 38–56. [Google Scholar] [CrossRef]
- Ilmola, L.; Kuusi, O. Filters of weak signals hinder foresight: Monitoring weak signals efficiently in corporate decision-making. Futures 2006, 38, 908–924. [Google Scholar] [CrossRef]
- Weng, J.; Bu-Sung, L. Event detection in twitter. In Proceedings of the Fifth International AAAI Conference on Weblogs and Social Media, Barcelona, Spain, 17–21 July 2011. [Google Scholar]
- Doulamis, N. Event detection in twitter microblogging. IEEE Trans. Cybern. 2015, 46, 2810–2824. [Google Scholar] [CrossRef] [PubMed]
- Atefeh, F.; Wael, K. A survey of techniques for event detection in twitter. Comput. Intell. 2013, 31, 132–164. [Google Scholar] [CrossRef]
- Mehmood, N.; Culmone, R.; Mostarda, L. Modeling temporal aspects of sensor data for MongoDB NoSql database. J. Big Data 2017, 4, 15. [Google Scholar] [CrossRef]
- Bjeladinovic, S. A fresh approach for hybrid Sql/NoSql database design based on data structuredness. Enterp. Inf. Syst. 2018, 12, 1202–1220. [Google Scholar] [CrossRef]
- Čerešňák, R.; Kvet, M. Comparison of query performance in relational a non-relation databases. Transp. Res. Procedia 2019, 40, 170–177. [Google Scholar] [CrossRef]
- Yangui, R.; Nabli, A.; Gargouri, F. Automatic Transformation of Data Warehouse Schema to NoSQL Data Base: Comparative Study. Procedia Comput. Sci. 2016, 96, 255–264. [Google Scholar] [CrossRef]
- Inmon, W.H. Building the Data Warehouse, 4th ed.; John Wiley and Sons: Hoboken, NJ, USA, 2005; p. 156. [Google Scholar]
- Willett, P. The Porter stemming algorithm: Then and now. Program 2006, 40, 219–223. [Google Scholar] [CrossRef]
- Griol-Barres, I.; Milla, S.; Millet, J. Implementación de un sistema de detección de señales débiles de futuro mediante técnicas de minería de textos. (Implementation of a weak signal detection system by text mining techniques). Rev. Esp. Doc. Cient. 2019, 42, 234. [Google Scholar] [CrossRef]
- Kim, J.; Han, M.; Lee, Y.; Park, Y. Futuristic datadriven scenario building: Incorporating text mining and fuzzy association rule mining into fuzzy cognitive map. Expert Syst. Appl. 2016, 57, 311–323. [Google Scholar] [CrossRef]
- Mendonca, S.; Cunha, M.P.; Kaivo-Oja, J.; Ruff, F. Wild Cards, Weak Signals and Organizational Improvisation. Futures 2004, 36, 201–218. [Google Scholar] [CrossRef]
- Ishikiriyama, C.S.; Miro, D.; Gomesa, C.F.S. Text Mining Business Intelligence: A small sample of what words can say. Procedia Comput. Sci. 2015, 55, 261–267. [Google Scholar] [CrossRef]
- Yuen, J. Comparison of Impact Factor, Eigenfactor Metrics, and SCImago Journal Rank Indicator and h-index for Neurosurgical and Spinal Surgical Journals. World Neurosurg. 2018, 119, e328–e337. [Google Scholar] [CrossRef] [PubMed]
- Thomason, J.; Padmakumar, A.; Sinapov, J.; Walker, N.; Jiang, Y.; Yedidsion, H.; Hart, J.; Stone, P.; Mooney, R.J. Jointly Improving Parsing and Perception for Natural Language Commands through Human-Robot Dialog. J. Artif. Intell. Res. 2020, 67, 327–374. [Google Scholar] [CrossRef][Green Version]
- Guralnik, V.; Srivastava, J. Event detection from time series data. In Proceedings of the Fifth ACM SIGKDD International Conference on Knowledge Discovery and Data Mining, San Diego, CA, USA, 15–18 August 1999; pp. 33–42. [Google Scholar]
- Tseng, Y.-H.; Lin, C.-J.; Lin, Y.-I. Text mining techniques for patent analysis. Inf. Process. Manag. 2007, 43, 1216–1247. [Google Scholar] [CrossRef]
- Wood, L. Satellite Remote Sensing—Market Analysis, Trends, and Forecasts; Global Industry Analysts Inc.: San Jose, CA, USA, 2019; p. 12. [Google Scholar]
- Bindzarova-Gergelova, M.; Labant, S.; Kuzevic, S.; Kuzevicova, Z.; Pavolova, H. Identification of Roof Surfaces from LiDAR Cloud Points by GIS Tools: A Case Study of Lučenec, Slovakia. Sustainability 2020, 12, 6847. [Google Scholar] [CrossRef]
- Sugla, S.; Dhum, N. Remote Sensing Services Market by Platform (Satellites, UAVs, Manned Aircraft, and Ground), End User (Defense and Commercial), Resolution (Spatial, Spectral, Radiometric, and Temporal), and Region—Global Forecast to 2022; Markets and Markets: Dublin, Ireland, 2017; pp. 5–25. [Google Scholar]
- Badmos, O.S.; Rienow, A.; Callo-Concha, D.; Greve, K.; Jürgens, C. Urban Development in West Africa—Monitoring and Intensity Analysis of Slum Growth in Lagos: Linking Pattern and Process. Remote Sens. 2018, 10, 1044. [Google Scholar] [CrossRef]
- Thomson, E.R.; Malhi, Y.; Bartholomeus, H.; Oliveras, L.; Gvozdevaite, A. Mapping the Leaf Economic Spectrum across West African Tropical Forests Using UAV-Acquired Hyperspectral Imagery. Remote Sens. 2018, 10, 1532. [Google Scholar] [CrossRef]
- Samasse, K.; Hanan, N.P.; Tappan, G.; Diallo, Y. Assessing Cropland Area in West Africa for Agricultural Yield Analysis. Remote Sens. 2018, 10, 1785. [Google Scholar] [CrossRef]
- Anchang, J.Y.; Prihodko, L.; Kaptué, A.T.; Ross, C.W.; Ji, W.; Kumar, S.S. Trends in Woody and Herbaceous Vegetation in the Savannas of West Africa. Remote Sens. 2019, 11, 576. [Google Scholar] [CrossRef]
- Jung, H.C.; Getirana, A.; Arsenault, K.R.; Holmes, T.R.H.; McNally, A. Uncertainties in Evapotranspiration Estimates over West Africa. Remote Sens. 2019, 11, 892. [Google Scholar] [CrossRef]
- Mondal, P.; Liu, X.; Fatoyinbo, T.E.; Lagomasino, D. Evaluating Combinations of Sentinel-2 Data and Machine-Learning Algorithms for Mangrove Mapping in West Africa. Remote Sens. 2019, 11, 2928. [Google Scholar] [CrossRef]
- Meftah, M.; Damé, L.; Keckhut, P.; Bekki, S.; Sarkissian, A.; Hauchecorne, A.; Bertran, E.; Carta, J.P. UVSQ-SAT, a Pathfinder CubeSat Mission for Observing Essential Climate Variables. Remote Sens. 2020, 12, 92. [Google Scholar] [CrossRef]
- Zhang, W.; Yoshida, T.; Tang, X. Text classification based on multi-word with support vector machine. Knowl. Based Syst. 2008, 21, 879–886. [Google Scholar] [CrossRef]
- Griol, I.; Milla, S.; Millet, J. Improving strategic decision making by the detection of weak signals in heterogeneous documents by text mining techniques. AI Commun. 2019, 32, 347–360. [Google Scholar] [CrossRef]
- Griol, I.; Milla, S.; Millet, J. System Implementation for the Detection of Weak Signals of the Future in Heterogeneous Documents by Text Mining and Natural Language Processing Techniques. In Proceedings of the 11th International Conference on Agents and Artificial Intelligence, Prague, Czech Republic, 19–21 February 2019; pp. 631–638. [Google Scholar]
- Dzedzickis, A.; Kaklauskas, A.; Bucinskas, V. Human Emotion Recognition: Review of Sensors and Methods. Sensors 2020, 20, 592. [Google Scholar] [CrossRef]
- Haegeman, K.; Marinelli, E.; Scapolo, F.; Ricci, A.; Sokolov, A. Quantitative and qualitative approaches in future oriented technology analysis (FTA): From combination to integration. Technol. Forecast. Soc. Chang. 2013, 80, 386–397. [Google Scholar] [CrossRef]
- Silva, V.O.; Martins, C.; Ekel, P. An Efficient Parallel Implementation of an Optimized Simplex Method in GPU-CUDA. IEEE Lat. Am. Trans. 2018, 16, 564–573. [Google Scholar] [CrossRef]
© 2020 by the authors. Licensee MDPI, Basel, Switzerland. This article is an open access article distributed under the terms and conditions of the Creative Commons Attribution (CC BY) license (http://creativecommons.org/licenses/by/4.0/).