Abstract
The main purpose of the work is to identify and present the current situation and changes in the volume of energy supplies in the countries of the Visegrad Group. The specific objectives of the article are to determine the degree of concentration of energy supply sources in the countries of the Visegrad Group, the directions of their changes, types of energy used and changes in this area, establishing the correlation between the volume of energy supplies and changes in the economic situation in V4 countries. The period of research covers the years 1990–2018. The sources of materials were the literature on the subject, with the data from Eurostat. The following methods were used for the analysis and presentation of materials: descriptive, tabular, graphical, dynamics indicators with a constant basis; Gini concentration coefficient; concentration analysis using the Lorenz curve; coefficient of variation; Pearson’s linear correlation coefficient. It was found that, of a high concentration of energy supplies from one or more sources in all countries of the Visegrad Group, the largest was in Poland and the lowest were in Hungary and the Czech Republic. In each of these countries, the economy was transforming and there was also a gradual diversification of energy sources.
1. Introduction
It is very important for modern and future societies to manage natural resources, water and energy in a sustainable way. This approach is often in conflict with the goals of developing countries, which have high energy needs [1,2,3,4]. Such countries must follow a long-term integrated approach to energy supply and demand. They should use energy efficiently and obtain it to a large extent from renewable sources. However, there are problems in the transformation of these countries [5,6,7,8,9]. Coal, oil and natural gas have been the main energy resources in the world since the 1970s. The use of fossil fuels is described as unfavorable for the environment. At the same time, these resources are limited. In 2017, fossil fuels accounted for 65% of all energy sources in the world, hydropower 16%, nuclear 10%, and renewable only 9% [10]. In the second decade of the 21st century, the supply of energy from renewable sources grew at a double-digit rate, but still not fast enough to meet the increase in energy demand [11,12]. Sustainable energy should not cause significant environmental damage and climate change. Its production should not compromise the potential of future generations to meet their energy needs. The transition to sustainable energy sources makes it possible to meet many environmental, economic and development needs of the country and the world [13,14,15,16].
There is an energy policy within the EU. It has three main goals related to achieving sustainable development—i.e., ensuring competitive energy prices for consumers by increasing competition in energy markets, ensuring the security of energy supply and reducing the environmental impact of the energy system to acceptable levels. In 2007, the European Council adopted ambitious energy and climate change goals. It was assumed to increase the share of renewable energy to 20% in 2020 (27% by 2030) and to achieve a 20% improvement in energy efficiency [17,18,19,20,21,22,23].
An important issue is energy security and diversification of energy supplies. Energy security means uninterrupted physical availability of energy products on the market, at a price affordable for all consumers, respecting environmental protection and striving for sustainable development. There are various types of threats, including physical (from resource depletion as well as from geopolitical crisis or natural disasters), economic, regulatory (legal), social and environmental. Becoming dependent on one or one energy sources can be dangerous. That is why it is so important to diversify energy supply sources [24,25,26,27,28,29,30,31,32,33,34].
Technological innovations are of fundamental importance for making the energy economy cleaner and more efficient, with simultaneous economic, development and environmental benefits [35,36,37]. Public funds, which directly support the energy transformation, are of great importance in this respect. It is also important that society’s attitude to these types of changes in energy production, or the implemented patterns of energy consumption, contribute to the promotion of security and sustainable energy supply [38,39,40,41].
The Visegrad Group (V4) is an association of four Central European countries—i.e., Poland, the Czech Republic, Slovakia and Hungary. Its aim was to deepen cooperation between these countries, in the initial phase, in particular in the matters of joining the structures of the European Union and NATO. The Visegrad Group was established in 1991 by three countries (Poland, Hungary and Czechoslovakia), forming the so-called Visegrad Triangle. Later, as a result of the break-up of Czechoslovakia (on 1 January 1993), the Czech Republic and Slovakia became members of the group. The V4 states had incompatible main goals of their foreign policy, but also similar possibilities for its implementation. These were the former communist bloc states that were best prepared for a market economy. Additionally, they represented a very similar levels of socio-economic development [42,43,44,45].
2. Materials and Methods
The main purpose of the paper was to identify and present the current situation and changes in the volume of energy supplies in the countries of the Visegrad Group. The Czech Republic, Hungary, Poland and Slovakia are examples of developing countries trying to catch up with the most developed countries in Europe and the world. The specific objectives were the determination of the degree of concentration of energy supply sources in the Visegrad Group countries, the directions of their changes, types of energy used and changes in this regard, establishing the correlation between the volume of energy supplies and changes in the economic situation in the V4 countries. Two hypotheses were put forward in the study. According to the first, in the Visegrad Group countries, there was a gradual diversification of energy supply sources with a systematic increase in the importance of renewable energy sources. The second hypothesis assumed that the increase in renewable energy supplies is closely related to the parameters of the economy. Countries belonging to the Visegrad Group, which had quite a similar history, belonging to the socialist bloc and similar economic structures, were selected for the study in a purposeful manner. At the same time, these were countries that developed economically quite fast. The research period covered the years 1990–2018. The sources of materials were the literature on the subject and data from Eurostat. The study used energy data presented in Terajoules. One Terajoule equals 1,000,000,000,000 J (joul). In turn, 1 joule is a unit of energy in the SI system and means work done by a force of 1 N (Newton) when the point of force application is shifted by 1 m. Descriptive, tabular and graphical methods were used for the analysis and, for the presentation of materials: dynamics indicators with a constant basis; Gini concentration coefficient; concentration analysis using the Lorenz curve; coefficient of variation; Pearson’s linear correlation coefficient.
In the first stage, the energy demand in individual countries of the Visegrad Group in 1990–2018 was examined. In the second stage, the Gini concentration coefficient was calculated. It was used to determine the concentration level of energy supplies from various sources in the countries of the Visegrad Group. It is measured based on energy demand from different sources of this energy. If only one source of energy was used, the coefficient would be 1. If the obtained energy is spread over more countries, then the coefficient takes values smaller; the closer to 0, this proves that the energy supply is evenly distributed among its sources. The Lorenz curve is a graphical representation of the concentration level of energy supply in individual countries of the Visegrad Group.
The Gini coefficient is a measure of unevenness (concentration) of distribution of a random variable. When the observations are sorted in ascending order, the coefficient can be represented by the formula [46]:
where:
- n—number of observations;
- —value of the “i-th” observation;
- —the average value of all observations—i.e.,
The Lorenz curve determines the degree of concentration of a one-dimensional random variable distribution [47]. With sorted observations yi, which are non-negative values , , the Lorenz curve is a polyline which apexes , for h = 0,1,…, n, and has the following coordinates:
The Gini coefficient determines the area between the Lorenz curve and the diagonal of a unit square multiplied by 2.
The third stage of the research presented the structure of energy supply sources in individual countries of the Visegrad Group. In the fourth stage, indicators of the dynamics of energy demand with a breakdown into sources in individual countries were calculated. The result is information about directions and force changes in energy sources.
The dynamics indicators with a fixed base are determined as follows [48]:
where:
- —the level of the phenomenon in a certain period;
- —the level of the phenomenon during the reference period.
In the fifth step, the coefficients of variation for energy supply were calculated. Similarly, different energy sources in individual countries of the Visegrad Group were taken into account. Due to this, it was possible to determine whether the situation was stable or whether the supply from a given energy source was subject to very large fluctuations.
The coefficient of variation denoted Cv eliminates the unit of measurement from the standard deviation of a series of numbers by dividing it by the mean of this series of numbers. Formally, for a series of N numbers, the coefficient of variation is computed as [49]:
where:
- S—standard deviation from the sample;
- M—arithmetic mean from the sample.
In the sixth stage, the link between energy supply in individual countries of the Visegrad Group and the parameters relating to the economy was examined. The parameters were chosen purposely, based on the literature review. Most often, energy supply relates to economic parameters, such as the value of GDP, the value of export and import of goods and services, and final consumption expenditure of households. Parameters relating to the wealth of the society are also important, such as the value of GDP per capita and the final consumption expenditure of households per capita. The study also used the parameters related to the added value of major sectors of the economy. The presented parameters highlight all the most important aspects related to the economy of a given country.
Pearson’s linear correlation coefficient is a measure of the strength of a straight-line relationship between two measurable features. It is expressed by means of the following formula [50]:
where:
- C(X,Y)—covariance between the X and Y features;
- —X feature variance;
- —Y feature variance;
- —X feature’s standard deviation;
- —Y feature’s standard deviation.
The linear correlation coefficient can be considered as normalized covariance. Correlation always takes values in the range (−1, 1).
In the last stage of the research, a regression analysis was performed. Multiple regression using the least-squares method was used. All variables used in the study of the Pearson correlation coefficient were used for the analysis. The multivariable regression function can be written as follows [51]:
where:
Y = α0 + α1X1 + α2X2 + … + αkXk + ξ
- Y—dependent variable;
- Xi—independent variables (i = 1, 2, …, k);
- ξ—random variable;
- α0—intercept of regression function;
- αi—structural parameters of the model (i = 1, 2, …, k).
3. Results and Discussion
In the years 1990–2018, the demand for energy in the EU countries decreased by only 1.9% [52]. At that time, there was a large increase in production, so this result should be assessed as very good. In the countries of the Visegrad Group, only Poland increased energy supplies by 2.6% (Figure 1). In other countries, significant drops were recorded, in Slovakia by 20.1%, in the Czech Republic by 13.3% and in Hungary by 8.8%. In the entire V4 group, energy supplies decreased by 5.3%. The share of the Visegrad Group countries in energy supplies to the European Union in 2018 was 12%. This share was fairly stable over the entire period from 1990 to 2018. Within the Visegrad Group itself, in 1990, 50% of the energy was supplied to Poland, 25% to the Czech Republic, 14% to Hungary and 11% to Slovakia. In 2018, the proportions changed slightly, as they were 55, 22, 14 and 9%, respectively. However, the changes were insignificant.
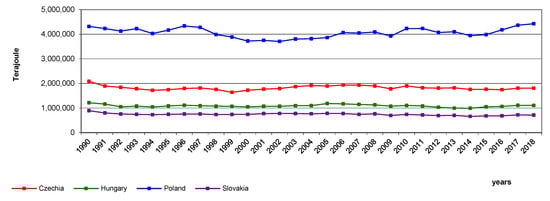
Figure 1.
Total energy supply in the Visegrad Group countries in 1990–2018. Source: Own study, based on Eurostat.
The Gini coefficient was used to determine the concentration level of energy supplies from various sources in the Visegrad Group countries. This coefficient is a correct and commonly used measure of inequality because it meets all the axioms postulated in this respect [53]. It assumes values in the range from 0 to 1. A result close to 1 means that there is a very high concentration of one energy supply source, and close to 0 indicates the dispersion of these sources. The data related to 2018 and included the countries of the Visegrad Group. The Gini coefficient calculated from the sample for energy supply in the Czech Republic was 0.56, and the estimated coefficient for the population was 0.61. This means a high concentration of one or more energy sources. The Gini coefficients for energy supplies were also calculated for the remaining countries of the Visegrad Group. Additionally, the differentiation was presented using the Lorenz concentration curve [54] (Figure 2). In 2018, the concentration of energy supplies was the highest in Poland (the coefficient from the sample was 0.69, and the estimated 0.78), and the lowest in Slovakia (from the sample 0.51, estimated 0.57). Thus, there were differences between countries in the level of concentration of supplies. Concentration coefficients were also calculated for the earlier periods, with a frequency every 5 years. Only between 1990–1993 was there a three-year break, but it was a difficult period related to economic transformation, so the state of 1990 showed the situation in the communist economy, and in 1993, after the introduction of market reforms. As a result, the results concern the years 1990–2018. It can be seen that the concentration of energy supplies from one or more sources has decreased in favor of diversification (Table 1). The changes were gradual and systematic, as in each subsequent period there was a decrease in the concentration of energy supply sources. This situation is positively assessed. In 1990, by far the greatest concentration on one energy source was in Poland, the economy of which was based on coal, while the smallest were in Hungary and Slovakia. In 2018, Poland was still dependent on coal, but to a smaller extent. The greatest diversification of energy supply sources occurred in Slovakia. Taking the example of the Visegrad Group countries, it can be seen that the processes of diversifying energy supply sources accelerated after 2003—i.e., after these countries joined the European Union. Within the EU itself, there was also a diversification of energy supplies.
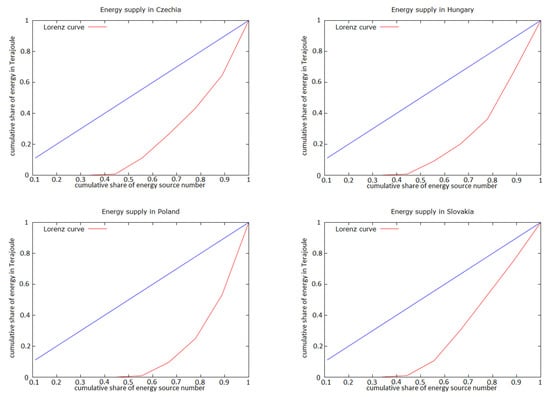
Figure 2.
Lorenz concentration curves for energy supply in the Visegrad Group countries in 2018. Source: Own study, based on Eurostat.

Table 1.
Estimated Gini coefficients for the energy supply in the Visegrad Group countries in 1990–2018.
Each of the Visegrad Group countries has its own history, also in terms of the energy resources used. In the Czech Republic, solid fossil fuels (mainly hard coal) dominated, but their share systematically decreased from 63% in 1990 to 35% in 2018 (Figure 3). At the same time, the importance of other energy sources, such as oil and petroleum products (to power means of transport), nuclear energy, natural gas and renewable energy sources increased. The increases in the share of energy supplied from renewable energy sources and nuclear energy were particularly visible. In the case of Hungary, as early as 1990, energy supply sources were more diversified (Figure 4). Natural gas and crude oil each accounted for approximately 31% of all supplies. Actually, identical results were obtained in 2018. The changes actually concerned two types of energy. The importance of renewable energy sources has increased, while the importance of solid fuels has decreased. It can, therefore, be concluded that, in 1990, Hungary had quite well diversified energy supply sources.
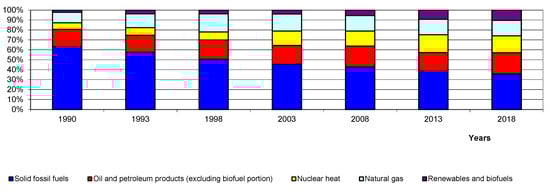
Figure 3.
Structure of energy supply sources in the Czech Republic in 1990–2018. Source: Own study, based on Eurostat.
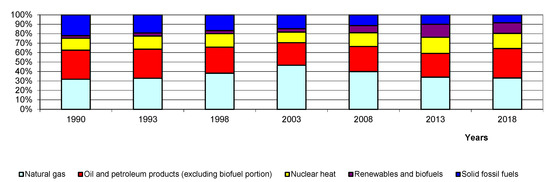
Figure 4.
Structure of energy supply sources in Hungary in 1990–2018. Source: Own study, based on Eurostat.
The Polish economy was based on hard coal. In 1990, 76% of energy was obtained from this source, approximately 13% was crude oil and 9% natural gas (Figure 5). However, Poland underwent the greatest transformation in this respect among all the countries of the Visegrad Group. In 2018, solid fuels accounted for only 47%, the share of crude oil increased to 28% (mainly due to the rapid development of the automotive industry and transport companies in this country) and natural gas to 15%. As in other countries, the share of energy obtained from renewable sources has systematically increased. Poland was the only country in the V4 that did not obtain nuclear energy. In Slovakia, the situation was different than in other countries (Figure 6). In 1990, 38% of energy was obtained from solid fuels, 24% from natural gas, 21% from crude oil and 15% from nuclear energy. Thus, there was quite a good diversification of energy supply sources. In 2018, the four most important sources each accounted for 20–24% of the total energy supply. Thus, the supply balance was even better. Obviously, the importance of energy obtained from renewable sources has been systematically growing.

Figure 5.
Structure of energy supply sources in Poland in 1990–2018. Source: Own study, based on Eurostat.
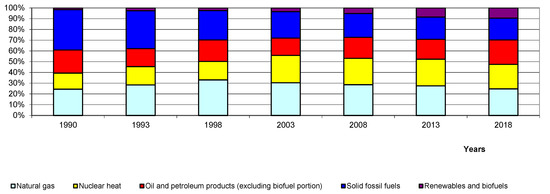
Figure 6.
Structure of energy supply sources in Slovakia in 1990-2018. Source: Own study, based on Eurostat.
In the EU countries in 1990, 37% of energy came from crude oil, 27% from solid fuels, 18% from natural gas, 13% from nuclear energy, and only 4% from renewable sources. Slovakia was the closest to such a structure. In 2018, there was more diversification in the EU, with 33% of energy coming from crude oil, 24% from natural gas, 15% from renewable energy sources, 14% from solid fuels and 13% from nuclear energy. There was a visible decrease in the importance of solid fuels, and an increase in natural gas and renewable energy sources. In 2018, no country with the V4 had a similar structure of energy sources. Slovakia was the closest again.
The share of energy obtained from renewable energy sources in the total energy demand in the Visegrad Group countries has been systematically increasing after accession to the EU in 2004 (Figure 7). The situation in the Czech Republic was the best in this respect. However, there were differences between individual sectors of the economy. In the V4 countries, the share in renewable energy sources in heating was the highest (in 2018, 21% in the Czech Republic, 18% in Hungary, 15% in Poland and 11% in Slovakia, respectively) and electricity production (in 2018, 22% in Slovakia, 14% in Czech Republic, 13% in Poland and 8% in Hungary), and the lowest in transport (8% in Hungary in 2018, 7% in the Czech Republic and Slovakia and 6% in Poland). In the EU, these indicators were different, because renewable energy accounted for 20% of total energy supply in electricity production, 20% in heating and 8% in transport.
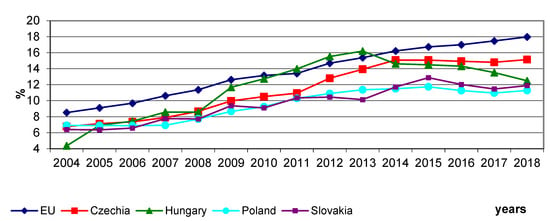
Figure 7.
Share of energy obtained from renewable sources in the total energy supply in the Visegrad Group countries in 2004–2018. Source: Own study, based on Eurostat.
In the next stage, the dynamics indicators for the basic groups of energy sources were calculated. The 1990 level was used as the basis (Table 2). Over 29 years, the importance of fossil fuels has declined significantly, the largest in Hungary (a decrease of 66%) and the lowest in Poland (a decrease of 38%). In some of the V4 countries, the importance of natural gas (Poland and the Czech Republic) increased, and, in some cases, it decreased (Hungary and Slovakia). This was the same with crude oil. The large increase in the demand for crude oil in Poland resulted from the high demand reported by the dynamically developing road transport services in this country. Poland has become the largest road carrier in the EU. In all V4 countries, energy supplies from renewable sources increased several times. The use of non-renewable waste and nuclear energy has also increased. There were quite similar trends in the EU. Thus, the countries of the Visegrad Group followed the patterns found throughout the EU.
Table 2.
Dynamics indicators for energy sources in the Visegrad Group countries in 1990–2018 (year 1990 = 100).
Then, the coefficients of variation for individual energy supply sources were calculated for the years 1990–2018 (Table 3). In the case of total energy, there were no large fluctuations in energy supplies in individual years. The supplies of energy from crude oil were also quite stable, except for Poland, where the demand was growing very quickly. Low variability was also found in the case of natural gas, similarly outside Poland. Greater variability occurred with solid fuels, due to the reduction in energy supplies from the source in all countries. On the other hand, very high variability occurred in the case of renewable energy sources and non-renewable waste. In both cases, energy supplies from these sources grew dynamically. In the case of nuclear energy, there were differences between countries, as supplies were relatively stable in Hungary, and volatile in the Czech Republic, where the importance of this energy source was growing. In the EU countries, there was usually a similar variation in energy supplies from individual sources.
Table 3.
Coefficients of variation of energy sources in the Visegrad Group countries in 1990–2018.
In order to establish the relationship between the total volume of energy supplies in the Visegrad Group countries and the basic parameters of the economy, Pearson’s linear correlation coefficients were calculated (Table 4). p = 0.05 was adopted as the cut-off value of the significance level [55]. Significant results are marked in bold in the table. Correlation coefficients were calculated for individual V4 countries for the entire period 1990–2018. The study tried to check the correlation, which does not indicate that a given factor affects another, but that there is a strong or weak relationship between them. In the case of the Czech Republic and Hungary, no relationship was found between the volume of energy supplied and the economic parameters. Significant, strong negative relations occurred in Slovakia. The increase in economic parameters, such as GDP, export value, etc. was associated with a decrease in the volume of energy supplies. The explanation for this situation is the increase in the efficiency of energy use, changes in the economy and a shift from energy-intensive production to one that is less energy-intensive. The changes that took place in Slovakia can be assessed best among the countries of the Visegrad Group. In Poland, for most parameters, significant positive relations with the volume of energy supplies were found. Relationship strength was medium, and only high for wholesale and retail trade, transport, accommodation and catering services, and agricultural, forestry and fishing activities. In Poland, economic growth was based on energy-intensive activities, and energy efficiency was not improved. One of the reasons for the results achieved was the dependence on hard coal, which is the main energy resource in Poland. A similar analysis was performed for energy from renewable sources (Table 5). For all parameters and for all V4 countries, a very large, significant positive correlation was found between the volume of energy supplies from renewable sources and the economic situation. Therefore, it can be concluded that the increasing importance of renewable energy sources took place along with the economic development of countries.
Table 4.
Pearson’s linear correlation coefficients between the volume of energy supplies in the Visegrad Group countries and the parameters of the economy.
Table 5.
Pearson’s linear correlation coefficients between the volume of energy supplies from renewable sources in the Visegrad Group countries and the parameters of the economy.
Then, the impact of individual economic parameters on energy demand was examined. All parameters used in calculating the correlation were taken into account, so the variable explaining Y was energy demand. The explanatory variables were as follows:
- X1—value of GDP;
- X2—final consumption expenditure of households;
- X3—export of goods and services;
- X4—import of good and services;
- X5—GDP per capita;
- X6—final consumption expenditure of households per capita;
- X7—gross value added of agriculture, forestry and fishing;
- X8—gross value added of industry (except construction);
- X9—gross value added of manufacturing;
- X10—gross value added of construction;
- X11—gross value added of wholesale and retail trade, transport, accommodation and food service activities.
Regression analysis was performed for each country separately. The following regression functions were obtained:
| Czech Republic: Y = 1,709,520 − 46.73 X1 + 575.33 X5 + 60.16 X10; |
| Hungary: Y = 880,016 + 69.33 X1 − 18.91 X2 − 3.56 X3 − 546.12 X5; |
| Poland: Y = 4,571,910 + 1468.82 X5 − 1917.38 X6 + 91.99 X8 − 147.09 X9 − 39.88 X11; |
| Slovakia: Y = 740,112 − 93.90 X1 − 11.03 X3 + 14.80 X4 + 437.63 X5 − 42.68 X7. |
The presented models show that there were different interdependencies in each country. Most variables entered the model in Slovakia and Poland, and the least in the Czech Republic. As a rule, a very important parameter influencing the energy demand was the value of GDP in total and per capita. Other parameters were varied, which means that, in every country, there was another set of factors affecting energy demand. For example, in Poland, the dependent variables were the parameters related to the value added from production, industry and transport. These are sections of fulfilling an important role in this country. Poland is a leader in the EU in terms of road transport. Industry and production with a high energy demand are equally important. On the other hand, in Slovakia, the explanatory variables were, inter alia, the value of imports and exports of goods and services and the value of agricultural production. These examples show that each country should be analyzed separately. Of course, there are some similarities, but there are no other very similar countries.
The assumptions about energy consumption in different countries are similar. In the Czech Republic, it is assumed that, in 2030, the share of energy from renewable sources in the total energy consumption will increase to 22%. Total energy consumption is projected to decrease by 6.6% between 2020–2030 [56]. In Hungary, it is assumed that, in 2030, the share of energy from renewable sources in total energy consumption will increase to 21%. Energy supply will increase slightly, by 1.3% in 2017–2030 [57]. In Poland, it is assumed that, in 2030, the share of energy from renewable sources in total energy consumption should increase to 21–23%. Additionally, energy efficiency should increase, which means a reduction in total energy consumption by 23% in the period 2007–2030 [58]. In Slovakia, it is assumed that, in 2030, the share of renewable energy in total energy consumption will increase to 19.2%. Additionally, energy consumption should decrease by 32.5% between 2007 and 2030 [59].
The research results indicate differences between countries in the structure of energy supplies and in the development of renewable energy. Even in the group of countries with a similar level of development, there are discrepancies. Therefore, there is a need for closer international cooperation in this area. Many studies also confirmed the existence of relationships consistent with the environmental Kuznets curve—i.e., the dependence of environmental impact on the level of economic development of the country [60,61,62,63,64]. However, in developing countries, there are differences in the relationship between economic growth in energy use and renewable energy. These differences also occurred in countries similar to each other, located in one region of the world [65,66]. Diversity also occurred within regions within a given country [67,68]. The obtained results relating to the countries of the Visegrad Group were also varied in this respect. Lu [69] confirmed the positive relationship between energy consumption and GDP. On the other hand, the studies of other authors also confirmed the strong relationship between the production of renewable energy and economic growth [1,3,70,71]. In the studies of Marinas et al. [72], different results were found in the countries of Central and Eastern Europe. In Hungary and Slovenia, the growing consumption of renewable energy was correlated with economic growth, while in Bulgaria and Romania there was no such relationship. In general, a significant relationship was found in economically developed or developing countries, but closer to this group [73,74,75,76,77]. The use of renewable energies is also beneficial, as it leads to reduced greenhouse gas emissions [78,79].
4. Conclusions
Energy is an essential resource for the functioning and development of the economy. Especially in economically developing countries, such a resource must be properly used. In the countries of the Visegrad Group, energy supplies increased only in Poland, and decreased significantly in Slovakia, and to a lesser extent in the Czech Republic and Hungary. During this time, these countries saw production growth. Thus, they had to either use energy more efficiently or switch to less energy-intensive but high-income activities. A high concentration of energy supplies from one or several sources was found in all countries of the Visegrad Group, the largest was in Poland and the smallest were in Hungary and the Czech Republic. Each of these countries was transforming its economy and diversifying its energy sources. This situation was positive. The V4 countries; however, differed from each other. In Poland, the main raw material was solid fuels (mainly hard coal), which was similar in the Czech Republic and, to a lesser extent, in Slovakia. In Hungary, as early as 1990, the sources of supply were diversified, so changes in the following years were not large. In all countries, coal and other solid fuels were abandoned in favor of other sources. Renewable energy sources were also introduced gradually and systematically. Their level is still low, but an upward trend was visible. Thus, the first research hypothesis was confirmed, according to which, in the countries of the Visegrad Group, there was a gradual diversification of energy supply sources with a systematic increase in the importance of renewable energy sources. It can also be stated that the processes of diversifying energy supply sources accelerated after 2003—i.e., after these countries joined the European Union. Within the EU itself, there was also a diversification of energy supplies.
Changes in the structure of energy supplies result from many premises—i.e., from the policy and requirements set out in the documents regulating aspects related to obtaining energy, signed contracts for energy supply, from the structure of the economy of a given country, from the efficiency of energy use. Therefore, some changes were similar in the Visegrad Group countries and the EU, such as moving away from solid fuels and switching to renewable energy sources. Greater use of crude oil was associated with the development of the automotive industry and an increase in work performed by road transport. Poland was an example of such a state. Energy was also obtained from non-renewable waste. This source was systematically gaining in importance. Another important aspect is the different stability of energy supplies. The smallest fluctuations occurred in the case of crude oil and natural gas, and the largest was in the case of renewable energy sources and non-renewable waste. Poland was a bit different from other countries. This country experienced greater variability in natural gas and crude oil due to increased consumption.
The changes that took place in Slovakia can be assessed best among the countries of the Visegrad Group. The increase in economic parameters in this country was associated with a decrease in the volume of energy supplies. The reason was an increase in the efficiency of energy use, changes in the economy and a move away from energy-intensive production to one that is less energy-consuming. In Poland, economic growth was based on energy-intensive activities, and energy efficiency was not improved. One of the reasons was the heavy dependence on hard coal. In the case of the Czech Republic and Hungary, no relationship was found between the volume of energy supplied and the economic parameters. The countries of the Visegrad Group diversified energy supplies, but in each of these countries the structure of energy sources was different. There is no one path or one optimal model towards which a given economy is heading. Each country chooses the best solution for itself. Most importantly, the diversification of energy supplies is taking place and the share of energy obtained from renewable sources is increasing. The second research hypothesis was also confirmed, according to which the increase in renewable energy supplies is closely related to the parameters of the economy.
Author Contributions
Conceptualization, T.R., A.P.; data curation, T.R., A.P.; formal analysis, T.R., A.P.; methodology, T.R., A.P.; resources, T.R., A.P.; visualization, T.R., A.P.; writing—original draft, T.R., A.P.; writing—review and editing, T.R., A.P.; supervision, T.R., A.P.; funding acquisition, T.R., A.P. All authors have read and agreed to the published version of the manuscript.
Funding
This research received no external funding.
Conflicts of Interest
The authors declare no conflict of interest.
References
- Armeanu, D.Ş.; Vintila, G.; Gherghina, Ş.C. Does Renewable Energy Drive Sustainable Economic Growth? Multivariate Panel Data Evidence for EU-28 Countries. Energies 2017, 10, 381. [Google Scholar] [CrossRef]
- Koçak, E.; Şarkgüneşi, A. The renewable energy and economic growth nexus in Black Sea and Balkan countries. Energy Policy 2017, 100, 51–57. [Google Scholar] [CrossRef]
- Bilan, Y.; Streimikiene, D.; Vasilyeva, T.; Lyulyov, O.; Pimonenko, T.; Pavlyk, A. Linking between Renewable Energy, CO2 Emissions, and Economic Growth: Challenges for Candidates and Potential Candidates for the EU Membership. Sustainability 2019, 11, 1528. [Google Scholar] [CrossRef]
- Yemelyanov, V.A.; Yemelyanova, N.Y.; Glebov, N.B.; Tyapkin, D.A.; Heдeлькин, A. Information System to Determine the Transported Liquid Iron Weight. In Proceedings of the 2019 IEEE Conference of Russian Young Researchers in Electrical and Electronic Engineering (EIConRus), Saint Petersburg and Moscow, Russia, 28–31 January 2019; pp. 377–380. [Google Scholar]
- Almutairi, K.; Thoma, G.; Durand-Morat, A. Ex-Ante Analysis of Economic, Social and Environmental Impacts of Large-Scale Renewable and Nuclear Energy Targets for Global Electricity Generation by 2030. Sustainability 2018, 10, 2884. [Google Scholar] [CrossRef]
- Cucchiella, F.; D’Adamo, I.; Gastaldi, M. Future Trajectories of Renewable Energy Consumption in the European Union. Resources 2018, 7, 10. [Google Scholar] [CrossRef]
- Vasylieva, T.; Lyulyov, O.; Bilan, Y.; Streimikiene, D. Sustainable Economic Development and Greenhouse Gas Emissions: The Dynamic Impact of Renewable Energy Consumption, GDP, and Corruption. Energies 2019, 12, 3289. [Google Scholar] [CrossRef]
- Da Silva, F.J.G.; Gouveia, R.M. Sustainable Production Cases. In Cleaner Production; Springer: Cham, Switzerland, 2020; pp. 281–373. [Google Scholar]
- Simionescu, M.; Strielkowski, W.; Tvaronavičienė, M. Renewable Energy in Final Energy Consumption and Income in the EU-28 Countries. Energies 2020, 13, 2280. [Google Scholar] [CrossRef]
- International Energy Agency. Key World Energy Statistics 2019; IEA: Paris, France, 2019. [Google Scholar]
- International Energy Agency. Global Energy & CO2 Status Report 2019; IEA: Paris, France, 2019. [Google Scholar]
- Ntanos, S.; Skordoulis, M.; Kyriakopoulos, G.L.; Arabatzis, G.; Chalikias, M.; Galatsidas, S.; Batzios, A.; Katsarou, A. Renewable Energy and Economic Growth: Evidence from European Countries. Sustainability 2018, 10, 2626. [Google Scholar] [CrossRef]
- Thollander, P.; Kimura, O.; Wakabayashi, M.; Rohdin, P. A review of industrial energy and climate policies in Japan and Sweden with emphasis towards SMEs. Renew. Sustain. Energy Rev. 2015, 50, 504–512. [Google Scholar] [CrossRef]
- Busu, M. The Role of Renewables in a Low-Carbon Society: Evidence from a Multivariate Panel Data Analysis at the EU Level. Sustainability 2019, 11, 5260. [Google Scholar] [CrossRef]
- Ebrahimi, M.; Rahmani, D. A five-dimensional approach to sustainability for prioritizing energy production systems using a revised GRA method: A case study. Renew. Energy 2019, 135, 345–354. [Google Scholar] [CrossRef]
- Zhao, W.; Zou, R.; Yuan, G.; Wang, H.; Tan, Z. Long-Term Cointegration Relationship between China’s Wind Power Development and Carbon Emissions. Sustainability 2019, 11, 4625. [Google Scholar] [CrossRef]
- Halmaghi, E.E. Sustainable development strategy of the European Union—Evolutionary approach. Land Forces Acad. Rev. 2016, 21, 342. [Google Scholar]
- Fulli, G.; Masera, M.; Covrig, C.-F.; Profumo, F.; Bompard, E.; Huang, T. The EU Electricity Security Decision-Analytic Framework: Status and Perspective Developments. Energies 2017, 10, 425. [Google Scholar] [CrossRef]
- Fulli, G.; Masera, M.; Spisto, A.; Vitiello, S. A Change is Coming: How Regulation and Innovation Are Reshaping the European Union’s Electricity Markets. IEEE Power Energy Mag. 2019, 17, 53–66. [Google Scholar] [CrossRef]
- Ionescu, R.V.; Filip, L.M. Europe 2020 Strategy vs. Global Environment Protection’s Challenge. Acta Univ. Danubius. Œconomica 2017, 13, 222–235. [Google Scholar]
- Khanam, T.; Rahman, A.; Mola-Yudego, B.; Pelkonen, P.; Perez, Y.; Pykäläinen, J. Achievable or unbelievable? Expert perceptions of the European Union targets for emissions, renewables, and efficiency. Energy Res. Soc. Sci. 2017, 34, 144–153. [Google Scholar] [CrossRef]
- Gómez, N.C.; Del Río, P.; Lechon, Y.; Gerbeti, A. Renewable Energy Cooperation in Europe: What Next? Drivers and Barriers to the Use of Cooperation Mechanisms. Energies 2018, 12, 70. [Google Scholar] [CrossRef]
- Siksnelyte, I.; Zavadskas, E.; Bausys, R.; Streimikiene, D. Implementation of EU energy policy priorities in the Baltic Sea Region countries: Sustainability assessment based on neutrosophic MULTIMOORA method. Energy Policy 2019, 125, 90–102. [Google Scholar] [CrossRef]
- Kruyt, B.; Van Vuuren, D.; De Vries, H.; Groenenberg, H.; Van Vuuren, D.P. Indicators for energy security. Energy Policy 2009, 37, 2166–2181. [Google Scholar] [CrossRef]
- Le Coq, C.; Paltseva, E. Measuring the security of external energy supply in the European Union. Energy Policy 2009, 37, 4474–4481. [Google Scholar] [CrossRef]
- Brown, M.A.; Wang, Y.; Sovacool, B.K.; D’agostino, A.L. Forty years of energy security trends: A comparative assessment of 22 industrialized countries. Energy Res. Soc. Sci. 2014, 4, 64–77. [Google Scholar] [CrossRef]
- Ang, B.; Choong, W.; Ng, T.S.A. Energy security: Definitions, dimensions and indexes. Renew. Sustain. Energy Rev. 2015, 42, 1077–1093. [Google Scholar] [CrossRef]
- Bompard, E.; Carpignano, A.; Erriquez, M.; Grosso, D.; Pession, M.; Profumo, F. National energy security assessment in a geopolitical perspective. Energy 2017, 130, 144–154. [Google Scholar] [CrossRef]
- Chalvatzis, K.J.; Ioannidis, A. Energy supply security in the EU: Benchmarking diversity and dependence of primary energy. Appl. Energy 2017, 207, 465–476. [Google Scholar] [CrossRef]
- Glynn, P.D.; Voinov, A.; Shapiro, C.D.; White, P.A. From data to decisions: Processing information, biases, and beliefs for improved management of natural resources and environments. Earth’s Futur. 2017, 5, 356–378. [Google Scholar] [CrossRef]
- Radovanovic, M.; Filipović, S.; Pavlović, D. Energy security measurement—A sustainable approach. Renew. Sustain. Energy Rev. 2017, 68, 1020–1032. [Google Scholar] [CrossRef]
- Azzuni, A.; Breyer, C. Energy security and energy storage technologies. Energy Procedia 2018, 155, 237–258. [Google Scholar] [CrossRef]
- Inglesi-Lotz, R. The Role of Potential Factors/Actors and Regime Switching Modeling. In The Economics and Econometrics of the Energy—Growth Nexus; Academic Press: Cambridge, MA, USA, 2018; pp. 113–139. [Google Scholar]
- Gasser, P.; Suter, J.; Cinelli, M.; Spada, M.; Burgherr, P.; Hirschberg, S.; Kadziński, M.; Stojadinović, B. Comprehensive resilience assessment of electricity supply security for 140 countries. Ecol. Indic. 2020, 110, 105731. [Google Scholar] [CrossRef]
- Sagar, A.D.; Van Der Zwaan, B. Technological innovation in the energy sector: R&D, deployment, and learning-by-doing. Energy Policy 2006, 34, 2601–2608. [Google Scholar] [CrossRef]
- Kittner, N.; Lill, F.; Kammen, D.M. Energy storage deployment and innovation for the clean energy transition. Nat. Energy 2017, 2, 17125. [Google Scholar] [CrossRef]
- Handayani, K.; Krozer, Y.; Filatova, T. From fossil fuels to renewables: An analysis of long-term scenarios considering technological learning. Energy Policy 2019, 127, 134–146. [Google Scholar] [CrossRef]
- Fri, R.W.; Savitz, M.L. Rethinking energy innovation and social science. Energy Res. Soc. Sci. 2014, 1, 183–187. [Google Scholar] [CrossRef]
- Stirling, A. Transforming Power: Social science and the politics of energy choices. Energy Res. Soc. Sci. 2014, 1, 83–95. [Google Scholar] [CrossRef]
- Van Der Werff, E.; Steg, L. One model to predict them all: Predicting energy behaviours with the norm activation model. Energy Res. Soc. Sci. 2015, 6, 8–14. [Google Scholar] [CrossRef]
- Bouman, T.; Verschoor, M.; Albers, C.J.; Böhm, G.; Fisher, S.D.; Poortinga, W.; Whitmarsh, L.; Steg, L. When worry about climate change leads to climate action: How values, worry and personal responsibility relate to various climate actions. Glob. Environ. Chang. 2020, 62, 102061. [Google Scholar] [CrossRef]
- Latawski, P. On converging paths? The visegrad group and the Atlantic alliance. J. Interdiscip. Int. Relat. 1993, 7, 78–93. [Google Scholar] [CrossRef]
- Cottey, A. The Visegrad Group and Beyond: Security Cooperation in Central Europe. In Subregional Cooperation in the New Europe; Palgrave Macmillan: London, UK, 1999; pp. 69–89. [Google Scholar]
- Dangerfield, M. The Visegrád Group in the Expanded European Union: From Preaccession to Postaccession Cooperation. East. Eur. Politi. Soc. Cult. 2008, 22, 630–667. [Google Scholar] [CrossRef]
- Ivanová, E.; Masarova, J. Performance evaluation of the Visegrad Group countries. Econ. Res. Ekon. Istraživanja 2018, 31, 270–289. [Google Scholar] [CrossRef]
- Dixon, P.M.; Weiner, J.; Mitchell-Olds, T.; Woodley, R. Erratum to ’Bootstrapping the Gini Coefficient of Inequality. Ecology 1988, 69, 1307. [Google Scholar] [CrossRef]
- Dagum, C. The Generation and Distribution of Income, the Lorenz Curve and the Gini Ratio. Econ. Appliquée 1980, 33, 327–367. [Google Scholar]
- Starzyńska, W. Statystyka Praktyczna; Wydawnictwo Naukowe PWN: Warsaw, Poland, 2002; p. 102. [Google Scholar]
- Abdi, H. Coefficient of variation. In Encyclopedia of Research Design; SAGE Publications, Inc.: Thousand Oaks, CA, USA, 2010; Volume 1, pp. 169–171. [Google Scholar]
- Jajuga, K.; Walesiak, M. Remarks on the Dependence Measures and the Distance Measures. In Klasyfikacja i Analiza Danych—Teoria i Zastosowania; Jajuga, K., Walesiak, M., Eds.; Prace Naukowe Akademii Ekonomicznej we Wrocławiu nr 1022; AE: Wroclaw, Poland, 2004; pp. 348–354. [Google Scholar]
- Cohen, J.; Cohen, P.; West, S.G.; Aiken, L.S. Applied Multiple Regression/Correlation Analysis for the Behavioral Sciences; Routledge: New Jersey, NJ, USA, 2013. [Google Scholar]
- Energy Statistics—An Overview. Available online: https://ec.europa.eu/eurostat/statistics-explained/index.php/Energy_statistics_-_an_overview (accessed on 26 July 2020).
- Atkinson, A.B. The Economics of Inequality; Clarendon Press: Oxford, UK, 1983; pp. 46–59. [Google Scholar]
- Lorenz, M.O. Methods of Measuring the Concentration of Wealth; American Statistical Association: Alexandria, VA, USA, 1905; Volume 9, pp. 209–219. [Google Scholar]
- Hauke, J.; Kossowski, T. Comparison of Values of Pearson’s and Spearman’s Correlation Coefficients on the Same Sets of Data. Quaest. Geogr. 2011, 30, 87–93. [Google Scholar] [CrossRef]
- National Energy and Climate Plan of the Czech Republic. Available online: https://ec.europa.eu/energy/sites/ener/files/documents/cs_final_necp_main_en.pdf (accessed on 26 July 2020).
- Thomas, S. The UK National Energy and Climate Plan. Econ. Policy Energy Environ. 2019, 173–179. [Google Scholar] [CrossRef]
- The National Energy and Climate Plan for 2021–2030, Objectives and Targets, and Policies and Measures. Available online: https://ec.europa.eu/energy/sites/ener/files/documents/pl_final_necp_part_1_3_en.pdf (accessed on 26 July 2020).
- Integrated National Energy and Climate Plan for 2021 to 2030. Available online: https://ec.europa.eu/energy/sites/ener/files/sk_final_necp_main_en.pdf (accessed on 26 July 2020).
- Reboredo, J.C. Renewable energy contribution to the energy supply: Is there convergence across countries? Renew. Sustain. Energy Rev. 2015, 45, 290–295. [Google Scholar] [CrossRef]
- Adamu, T.M.; Haq, I.U.; Shafiq, M. Analyzing the Impact of Energy, Export Variety, and FDI on Environmental Degradation in the Context of Environmental Kuznets Curve Hypothesis: A Case Study of India. Energies 2019, 12, 1076. [Google Scholar] [CrossRef]
- Jimenez, C.; Moncada, L.; Ochoa-Jimenez, D.; Ochoa-Moreno, W.-S. Kuznets Environmental Curve for Ecuador: An Analysis of the Impact of Economic Growth on the Environment. Sustainability 2019, 11, 5896. [Google Scholar] [CrossRef]
- Neagu, O. The Link between Economic Complexity and Carbon Emissions in the European Union Countries: A Model Based on the Environmental Kuznets Curve (EKC) Approach. Sustainability 2019, 11, 4753. [Google Scholar] [CrossRef]
- Sánchez, P.M.; Romero, L.Q.; Correa-Quezada, R.; de la Cruz del Río-Rama, M. Empirical Evidence in Ecuador between Economic Growth and Environmental Deterioration. Sustainability 2020, 12, 853. [Google Scholar] [CrossRef]
- Vo, A.T.; Vo, D.H.; Le, Q.T.-T. CO2 Emissions, Energy Consumption, and Economic Growth: New Evidence in the ASEAN Countries. J. Risk Financ. Manag. 2019, 12, 145. [Google Scholar] [CrossRef]
- Ismail, N.H.M.; Nayan, S.; Kadir, N.; Yusoff, M.Y.M. Causal Link in Carbon Dioxide (CO2) Emission, Energy Consumption and Economic Growth: Evidence from Selected Southeast Asia Countries. J. Emerg. Econ. Islam. Res. 2020, 8, 1–12. [Google Scholar] [CrossRef]
- Hao, Y.; Huang, Z.; Wu, H. Do Carbon Emissions and Economic Growth Decouple in China? An Empirical Analysis Based on Provincial Panel Data. Energies 2019, 12, 2411. [Google Scholar] [CrossRef]
- Wu, H.; Li, Y.; Hao, Y.; Ren, S.; Zhang, P. Environmental decentralization, local government competition, and regional green development: Evidence from China. Sci. Total. Environ. 2020, 708, 135085. [Google Scholar] [CrossRef] [PubMed]
- Lu, W.-C. Greenhouse Gas Emissions, Energy Consumption and Economic Growth: A Panel Cointegration Analysis for 16 Asian Countries. Int. J. Environ. Res. Public Heal. 2017, 14, 1436. [Google Scholar] [CrossRef] [PubMed]
- Ahmed, M.M.; Shimada, K. The Effect of Renewable Energy Consumption on Sustainable Economic Development: Evidence from Emerging and Developing Economies. Energies 2019, 12, 2954. [Google Scholar] [CrossRef]
- Lyeonov, S.; Pimonenko, T.; Bilan, Y.; Streimikiene, D.; Mentel, G. Assessment of Green Investments’ Impact on Sustainable Development: Linking Gross Domestic Product Per Capita, Greenhouse Gas Emissions and Renewable Energy. Energies 2019, 12, 3891. [Google Scholar] [CrossRef]
- Marinaș, M.-C.; Dinu, M.; Socol, A.-G.; Socol, C. Renewable energy consumption and economic growth. Causality relationship in Central and Eastern European countries. PLoS ONE 2018, 13, e0202951. [Google Scholar] [CrossRef] [PubMed]
- Apergis, N.; Danuletiu, D.C. Renewable energy and economic growth: Evidence from the sign of panel long-run causality. Int. J. Energy Econ. Policy 2014, 4, 578. [Google Scholar]
- Bildirici, M. Relationship between biomass energy and economic growth in transition countries: Panel ARDL approach. GCB Bioenergy 2014, 6, 717–726. [Google Scholar] [CrossRef]
- Chang, T.; Gupta, R.; Inglesi-Lotz, R.; Simo-Kengne, B.; Smithers, D.; Trembling, A. Renewable energy and growth: Evidence from heterogeneous panel of G7 countries using Granger causality. Renew. Sustain. Energy Rev. 2015, 52, 1405–1412. [Google Scholar] [CrossRef]
- Dogan, E.; Seker, F. The influence of real output, renewable and non-renewable energy, trade and financial development on carbon emissions in the top renewable energy countries. Renew. Sustain. Energy Rev. 2016, 60, 1074–1085. [Google Scholar] [CrossRef]
- Inglesi-Lotz, R. The impact of renewable energy consumption to economic growth: A panel data application. Energy Econ. 2016, 53, 58–63. [Google Scholar] [CrossRef]
- Sterpu, M.; Soava, G.; Mehedintu, A. Impact of Economic Growth and Energy Consumption on Greenhouse Gas Emissions: Testing Environmental Curves Hypotheses on EU Countries. Sustainability 2018, 10, 3327. [Google Scholar] [CrossRef]
- Bongers, A. The Environmental Kuznets Curve and the Energy Mix: A Structural Estimation. Energies 2020, 13, 2641. [Google Scholar] [CrossRef]


© 2020 by the authors. Licensee MDPI, Basel, Switzerland. This article is an open access article distributed under the terms and conditions of the Creative Commons Attribution (CC BY) license (http://creativecommons.org/licenses/by/4.0/).