Article

Geochemical Distribution Characteristics of Rare Earth Elements in Different Soil Profiles in Mun River Basin, Northeast Thailand

1
Institute of Earth Sciences, China University of Geosciences (Beijing), Beijing 10083, China
2
Institute of Hydrogeology and Environmental Geology, Chinese Academy of Geological Sciences, Shijiazhuang 050061, China
*
Author to whom correspondence should be addressed.
Sustainability 2020, 12(2), 457; https://doi.org/10.3390/su12020457
Submission received: 3 December 2019 / Revised: 3 January 2020 / Accepted: 5 January 2020 / Published: 7 January 2020

Abstract

:
Exploring the distributions of rare earth elements (REEs) in soil profiles is essential to understanding how natural and anthropogenic factors influence the geochemical behaviors of REEs. This study aimed to learn about the distribution characteristics of REEs in soils, including their fractionation and enrichment, and to explore the influence of soil pH and soil organic carbon (SOC) on REEs. One hundred and three samples were collected from six soil profiles under different land uses (paddy field: T1, T3; forest land: T2, T6; wasteland: T4; building site: T5) in the Mun River Basin, Northeast Thailand. The average total REE contents (∑REE) are much lower (<80 mg kg−1) than that of Earth’s crust (153.80 mg kg−1) in soil profiles T2, T3, T4, and T6. The contents of REEs tend to increase slightly with depth in all soil profiles. The ratios of (La/Yb)N range from 0.35 to 0.96 in most samples, indicating that the enrichment of heavy REEs (HREEs) relative to light REEs (LREEs) is the main fractionation pattern. Samples from profile T2 show relatively obvious negative Ce anomalies (0.55–0.78) and positive Eu anomalies (1.41–1.56), but there are almost no anomalies of Ce and Eu in other soil profiles. Enrichment factors of LREEs (EFLREEs) range from 0.23 to 1.54 and EFHREEs range from 0.34 to 2.27, which demonstrates that all soil samples show no LREE enrichment and only parts of samples show minor HREE enrichment. Soil organic carbon (SOC) contents positively correlate with the enrichment factors of REEs (EFREE) in soil profiles T1 (R = 0.56, p < 0.01) and T6 (R = 0.71), while soil pH values correlate well with EFREE in soil profiles T2 (R = 0.75) and T4 (R = −0.66, p < 0.01), indicating the important influence of soil pH and SOC on the mobility of REEs in some soil profiles.

1. Introduction

Rare earth elements (REEs) comprise lanthanides from lanthanum (La) to lutetium (Lu), of which fourteen (except promethium) are relatively abundant in the Earth’s crust [1,2]. Behaving similarly in the geochemical process, the REEs are widely used as environmental tracers for natural systems, such as plants, soil, and aqueous systems [3,4]. Recently, it has been revealed that rare earth elements are mobile during soil formation and weathering processes [5,6]. Many studies showed that REEs were fractionated during weathering, always characterized by the occurrence of Ce and Eu anomalies as well as the fractionation between light REEs (LREEs) and heavy REEs (HREEs) [1,7]. Based on these characteristics, the influence of weathering on REEs can be evaluated by the relative enrichment of REEs. On the other hand, REEs are highly sensitive to redox potential, soil pH, and adsorption/desorption reactions related to organic matter (OM) and iron–manganese oxides [8,9]. For instance, La, Ce, and Ge are easier to release under acidic and reducing conditions in soils [9]. Adsorption and migration mechanisms of REEs in soil were clearly clarified by many studies [10,11], but the profile distributions of REEs at different depths and under different land uses were rarely reported.
In addition to natural factors, anthropogenic activities can also exert significant influence on the distribution of REEs. The REEs are extensively applied in fertilizers due to their function of improving the quality and yield of crops [12]. As rare earth elements are widely used, REE mining has boomed all around the world over the years, and Thailand is one of the main countries producing rare earth elements [13]. Moreover, the study area is located in northeast Thailand, which is a large agricultural region where huge amounts of fertilizers are applied every year [14]. All of these applications of REEs may cause their enrichment in the local area, but the enrichment of REEs in soils is adverse for the environment and may eventually harm human health through the food chain [15]. This demonstrates that the enrichment of REEs is more likely to occur in paddy fields due to human activities, so land-use types were also considered in this study. Due to the potential toxicology of rare earth elements, it is important to explore the factors influencing the mobility of rare earth elements. Studying the distributions of rare earth elements in soil profiles and the correlations between them and other soil properties (e.g., soil organic carbon (SOC), soil pH) provides insights into the behavior of rare earth elements in soils.
Therefore, the objectives of this study are as follows: (1) To explore the profile distributions of REEs under different land uses; (2) to understand the fractionation and enrichment of REEs in the soil profiles; (3) to assess the influence of soil organic matter and soil pH on the mobility of REEs.

2. Materials and Methods

2.1. Study Area

The study site is located in the Mun River Basin (14°00′–16°00′ N, 101°30′–105°30′ E), which is the largest basin in Thailand with an area of 82,000 km2. With the average annual precipitation between 1300 to 1500 mm and average monthly temperature between 25 and 30 °C, the site has a tropical savanna climate, which is characterized by owning two distinctive seasons, a dry season (November to April) and a rainy season (May to October), respectively [16]. The Mun River Basin is mainly covered by agricultural lands, about 75% of which are used as paddy fields; meanwhile, there are many other kinds of lands, including forest lands, wetlands, grasslands, building lands, etc. [17,18]. As an agricultural region, chemical fertilizer and pesticides are commonly applied in about 80% of the total planting area, inevitably causing some pollution [19,20].
Due to the existence of the Khorat Plateau, the terrain of the Mun River Basin is generally high in the west and low in the east. The rock basement of the Mun River Basin is the so-called Khorat Group, which is mainly composed of sandstone, siltstone, shale, and conglomeritic sandstone (Figure 1). The rock basement is mainly covered by the unconsolidated Quaternary alluvial sediment [21,22,23].

2.2. Sampling and Analysis

Six soil profiles were dug in March 2018 at six study sites under different land uses (Figure 1). Specifically, two soil profiles were located in the paddy fields (T1, T3), two in the forest lands (T2, T6), one in the wasteland (T4), and one in the building site (T5). Compared with the paddy field where T1 is located, the other one is different because it was in a non-cultivation period for two years. A total of 103 soil samples were collected at depth intervals of 10 cm. The detailed description for each soil profile is recorded in Table 1.
After plant residue, roots, and stones were removed, soil samples were air dried sufficiently [24]. To make soils homogenized enough, soil samples were entirely ball milled with a grinding machine (Retsch MM400, Retsch GmbH, Haan, Germany) until they passed a 200-mesh sieve [25]. Subsamples of about 100 mg were placed into Teflon beakers separately. Subsequently, these beakers were filled with 1 mL of ultra-pure hydrofluoric acid (HF 40%) and 3 mL of ultra-pure nitric acid (HNO3 70%), and were then heated at 120 °C for 7 days on a hotplate. The digestion process was repeated when some solid residue remained in the beakers. If soil solutions remained unclear, aqua regia (70% ultra-pure HNO3: 38% ultra-pure HCl, 1:3) was used to digest the remaining solid residue. After the solutions became clear, 2 mL ultra-pure nitric acid (70% HNO3) were added to drive out the fluorine compounds for two times [26]. Finally, the digested samples were diluted with 50 mL ultra-pure nitric acid (2% HNO3). The digestion experiment was done in the super-Clean laboratory of Surficial Environmental Geochemistry, China University of Geosciences, Beijing.
Rare earth elements were measured using inductively coupled plasma mass spectrometry (ICP-MS, Elan DRC-e, Perkin Elmer) at the Institute of Geographic Sciences and Natural Resource Research, Chinese Academy of Sciences, Beijing. Quality control was achieved using standard reference material (GBW07449 and GBW07447).

2.3. Data Treatment

Rare earth elements (REEs) are commonly divided into light REEs (LREE: La to Eu) and heavy REEs (HREEs: Gd to Lu) based on their atomic weights and radii [27,28]. Under natural conditions, concentrations of REEs show two distinctive characteristics: (1) They generally tend to decrease from La to Lu; (2) REEs with even atomic numbers have higher concentrations than neighboring elements. To eliminate these two effects and to show the distribution patterns of REEs visually, normalization to a reference is commonly applied to their concentrations [29]. In this study, post-Archaean Australian shale (PAAS) was chosen as the reference material to normalize REE concentrations [30].
Ce and Eu are different from other REEs because they have different oxidation states (Ce: Ce4+ and Ce3+; Eu: Eu3+ and Eu2+) and show more significant fractionation relative to other REEs [31], making them essential in tracing redox conditions. Ce and Eu anomalies [27] were calculated as follows:
C e   a n o m a l y = C e N / ( L a N × P r N ) 0.5
E u   a n o m a l y = E u N / ( S m N × G d N ) 0.5 ,
where LaN, CeN, PrN, SmN, EuN, and GdN imply PAAS-normalized values. The values greater than 1 indicate positive anomalies and the values lower than 1 indicate negative anomalies.
The enrichment factors of REEs (EFREE) relative to the UCC (upper continental crust) are widely used to evaluate the influence of weathering and human activities [1]. Al is one of the most frequently used reference elements, for which the EFREE was defined as [32]:
E F R E E = ( [ X ] / [ A l ] ) S / ( [ X ] / [ A l ] ) U C C ,
where X represents REE, and S represents soil samples. Concentrations of REEs and Al in the upper continental crust come from Wedepohl [33].

3. Results and Discussion

3.1. Contents of Rare Earth Elements in Soil

The average contents and the vertical distribution of LREE, HREE, and total REE in six soil profiles are presented in Figure 2. The average ∑REEs (total REE contents) of samples from different profiles are 201.45, 42.19, 29.68, 78.51, 133.06, and 22.96 mg kg−1, respectively. It is obvious that average REE contents of samples from soil profile T1 are higher than those from other profiles. The total REE contents of samples from soil profiles T2, T3, T4, and T6 are relatively low, much lower than that of Earth’s crust (153.80 mg kg−1) [34]. Vertically, the contents of light REEs, heavy REEs, and total REEs tend to increase slightly with depth in all six soil profiles. The LREE contents of all soil samples account for a large part (>87%) of total REE contents, which is consistent with the distribution characteristics of REEs in the Earth’s crust [35]. In the soil profile T5, the highest REE contents were found at the bottom, much higher than those of other samples (Figure 2). The bottom of T5 reaches the boundary between the bedrock and soil, where the weathering for the rocks is the strongest in the whole profile. It denotes that the weathering processes might exert essential influence on the behavior of REEs under natural conditions. During weathering, many chemical elements (including REEs) are released with the breaking up of minerals, which is beneficial for the accumulation of soil REEs [36,37,38]. Meanwhile, the leaching of REEs also contributes to the phenomenon that REE contents tend to increase with soil depth. The Mun River Basin has relatively heavy rainfall every year [16], which would improve the leaching processes of REEs in soils.

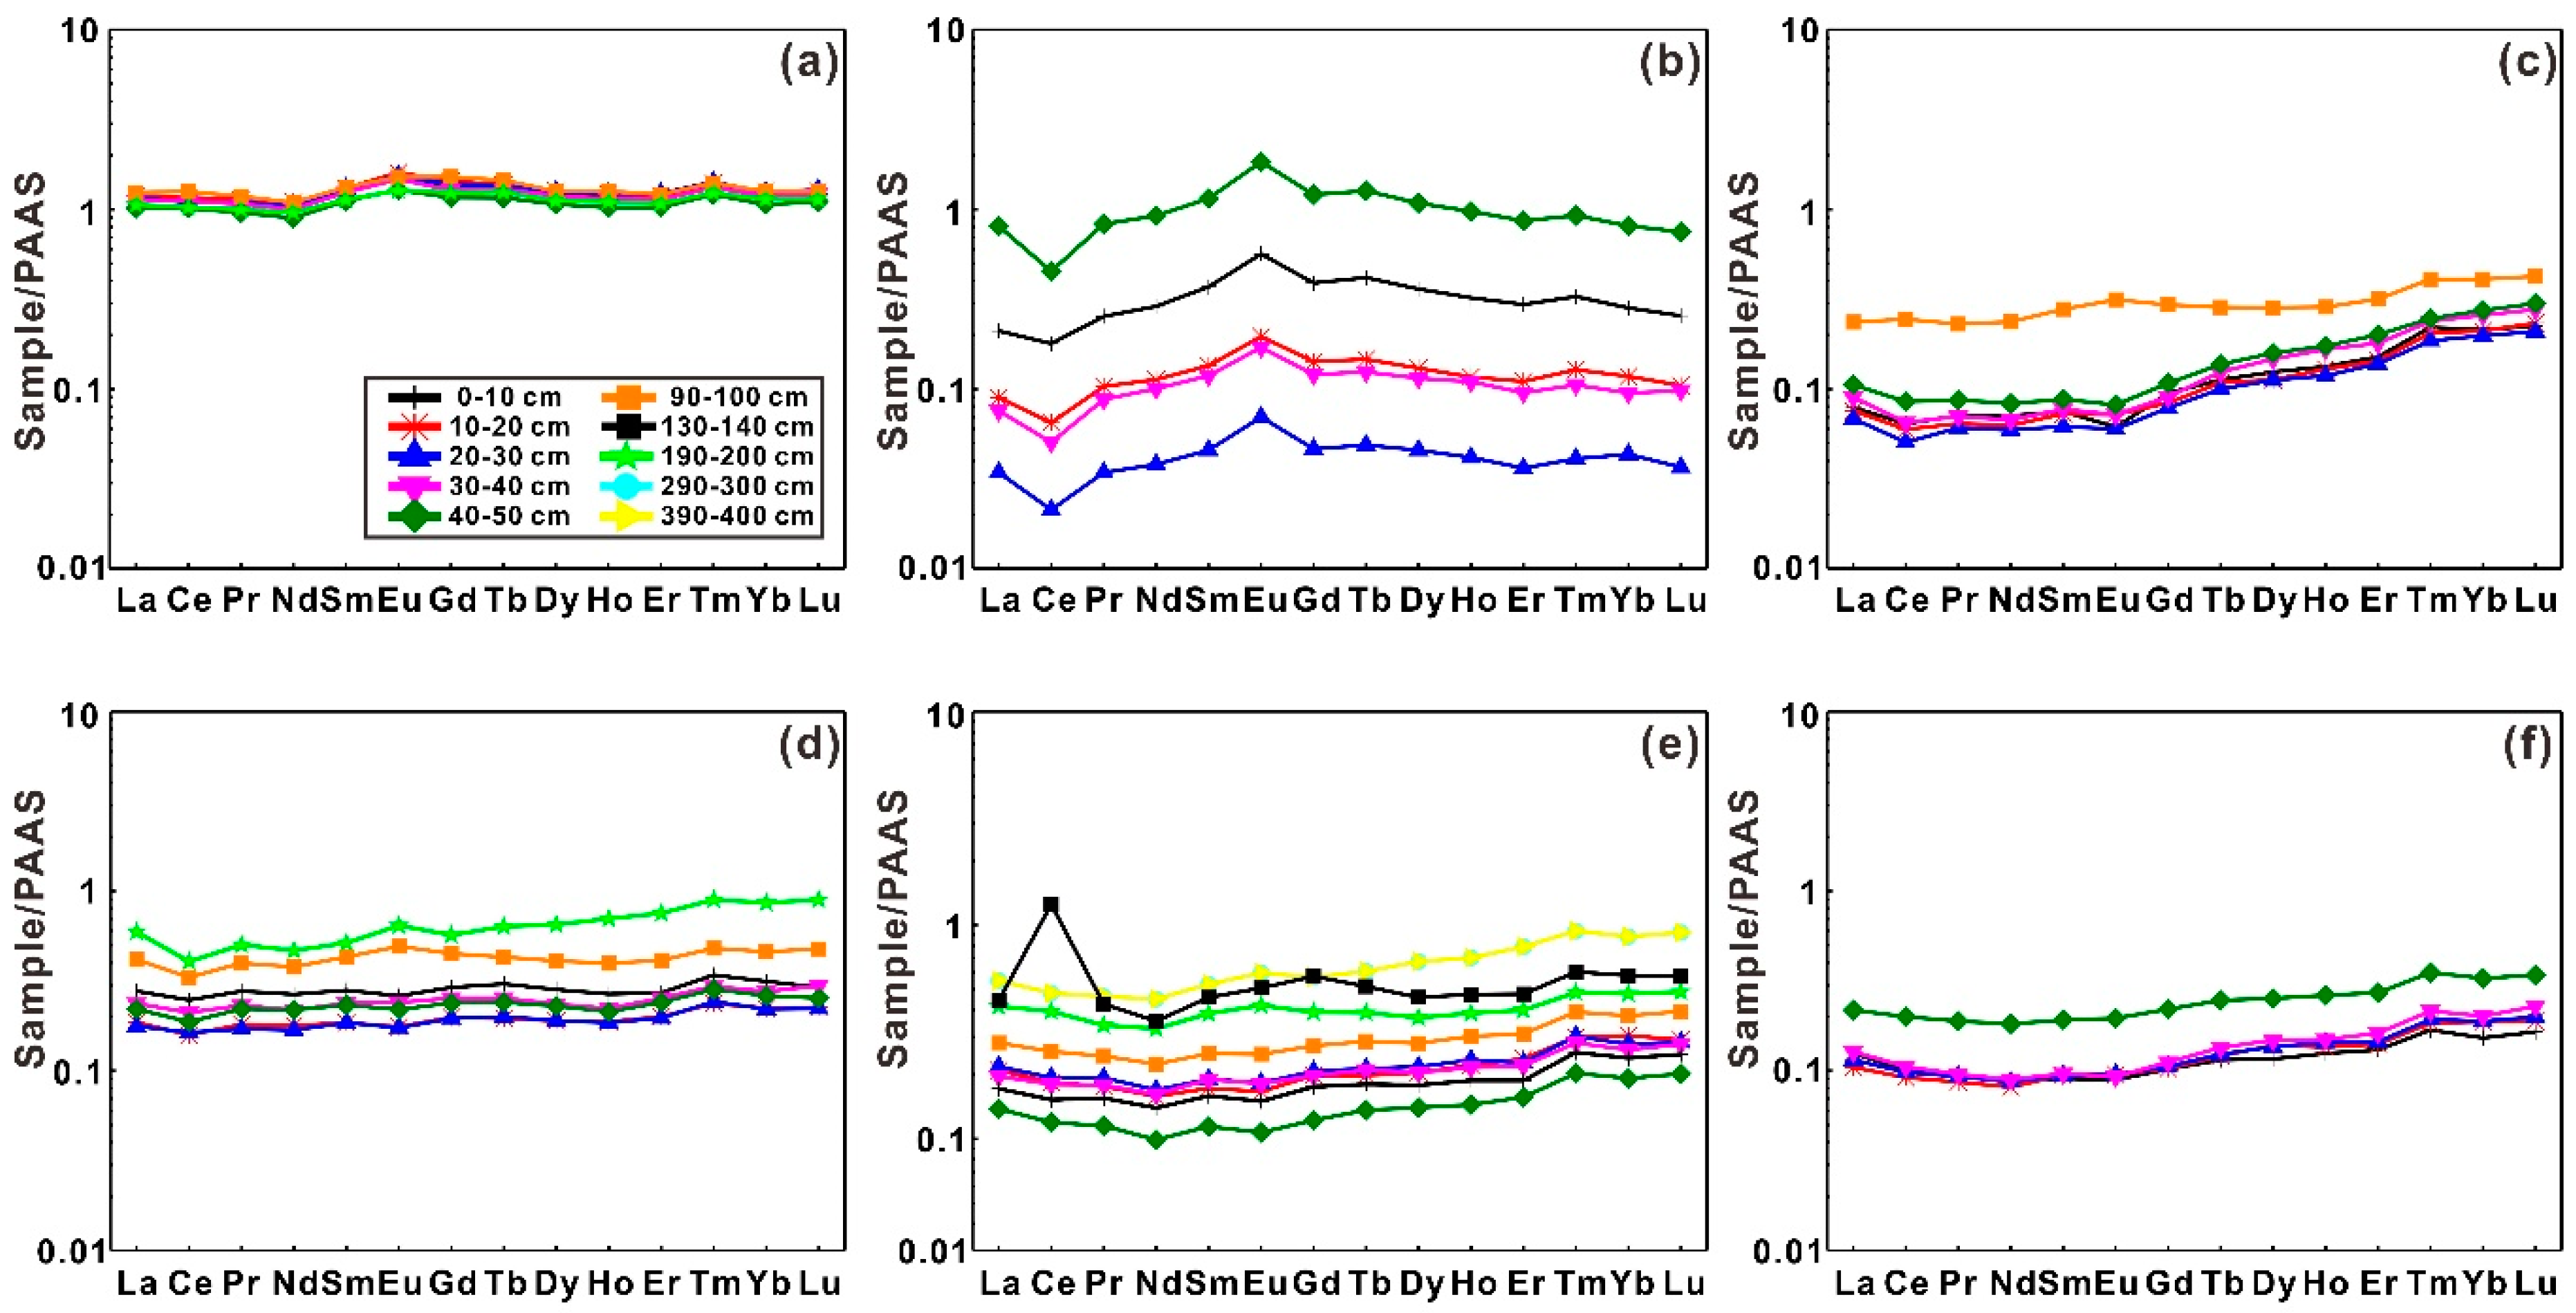
3.2. PAAS-Normalized REE Patterns

3.2.1. Fractionation between LREEs and HREEs

The normalized REE distribution patterns at different depths are presented in Figure 3. It shows that these plots tend to tilt slightly to the upper right, indicating a mild HREE enrichment relative to that of the LREEs. The ratio of (La/Yb)N was calculated to quantify the enrichment because it is a widely used indicator that reflects the fractionation extent between HREEs and LREEs [39,40,41]. The results show that the ratios of (La/Yb)N are lower than 1 for most samples (90%)—roughly in the range of 0.35 to 0.96—indicating that the enrichment of HREEs is the main fractionation pattern for most soil samples. The results show that LREEs are generally more mobile than HREEs under natural conditions. A few of the samples whose (La/Yb)N > 1 exist near the weathered crust observed in the field, mainly in the soil profiles T4 and T5 (Table 1). This contradictory phenomenon may have resulted from HREEs’ higher mobility than that of LREEs in the weathered crust, because they tend to form the complexes with carbonate ligands which have better migration than other complexes [10,42]. Different migration speeds lead to the enrichment of LREE in the upper section and the enrichment of HREE at the bottom of the weathered crust.

3.2.2. Ce and Eu Anomalies

The Ce anomalies (Ce anomaly values: 0.94–1.05) and Eu anomalies (Eu anomaly values: 0.91–1.18) are not obvious in most soil samples from the selected depths. However, as shown in Figure 3, samples from profile T2 show obvious negative Ce anomalies (Ce anomaly values: 0.55–0.78) and positive Eu anomalies (Eu anomaly values: 1.41–1.56); by contrast, a significantly positive Ce anomaly (Ce anomaly value: 2.87) was observed at the middle section of profile T5. The Ce and Eu anomalies are usually explained by the changes of redox potential [9,43], because Ce can occur as Ce (IV) and Eu can occur as Eu (II) under different redox conditions, which makes them different from other REEs (III). The negative Ce anomalies were rarely found in soils, so it is of great significance to explore the reasons. Middelburg et al. (1988) reported the negative Ce anomalies in weathering profiles on granites. They implied that Ce (III) was oxidized to Ce (IV) during weathering processes. Because Ce (IV) is less mobile than Ce (III) by precipitating as CeO2 or being absorbed onto Fe/Mn-(hydr)oxides [44], Ce(IV) would preferentially remain in the weathering suite [45]. Therefore, Ce was relatively depleted in the residual soils, resulting in the negative Ce anomalies. The positive Eu anomalies can also be explained in the weathering profiles of granites: Divalent Eu is quite similar to Ca ions in the ionic radius, so it always happens that Eu2+ takes the place of Ca2+ in feldspar minerals and stays in these minerals during magmatic processes [46,47]. Combined with the local geological background (volcanic rock exposure, including granites, basic, and ultrabasic rocks) [48], soils from profile T2 are very likely derived from granites. Moreover, negative Ce anomalies were already observed in soils derived from granites in Thailand [49], which is consistent with our results. However, the positive Eu anomalies may also be correlated with carbonates or fluid mineral interaction. To confirm the contribution of these factors, further research should be committed to learning about the distributions of REEs in certain mineral groups. In terms of the positive Ce anomaly (Ce anomaly value: 2.87) in profile T5, it almost occurred at the same depth as that of iron–manganese oxides (Table 1), indicating the potential correlation between them. Actually, the behavior of Ce is closely correlated with ferromanganese nodules [50] because iron and manganese oxides absorb Ce (IV) preferentially, causing the enrichment of Ce relative to neighboring elements [1,51].

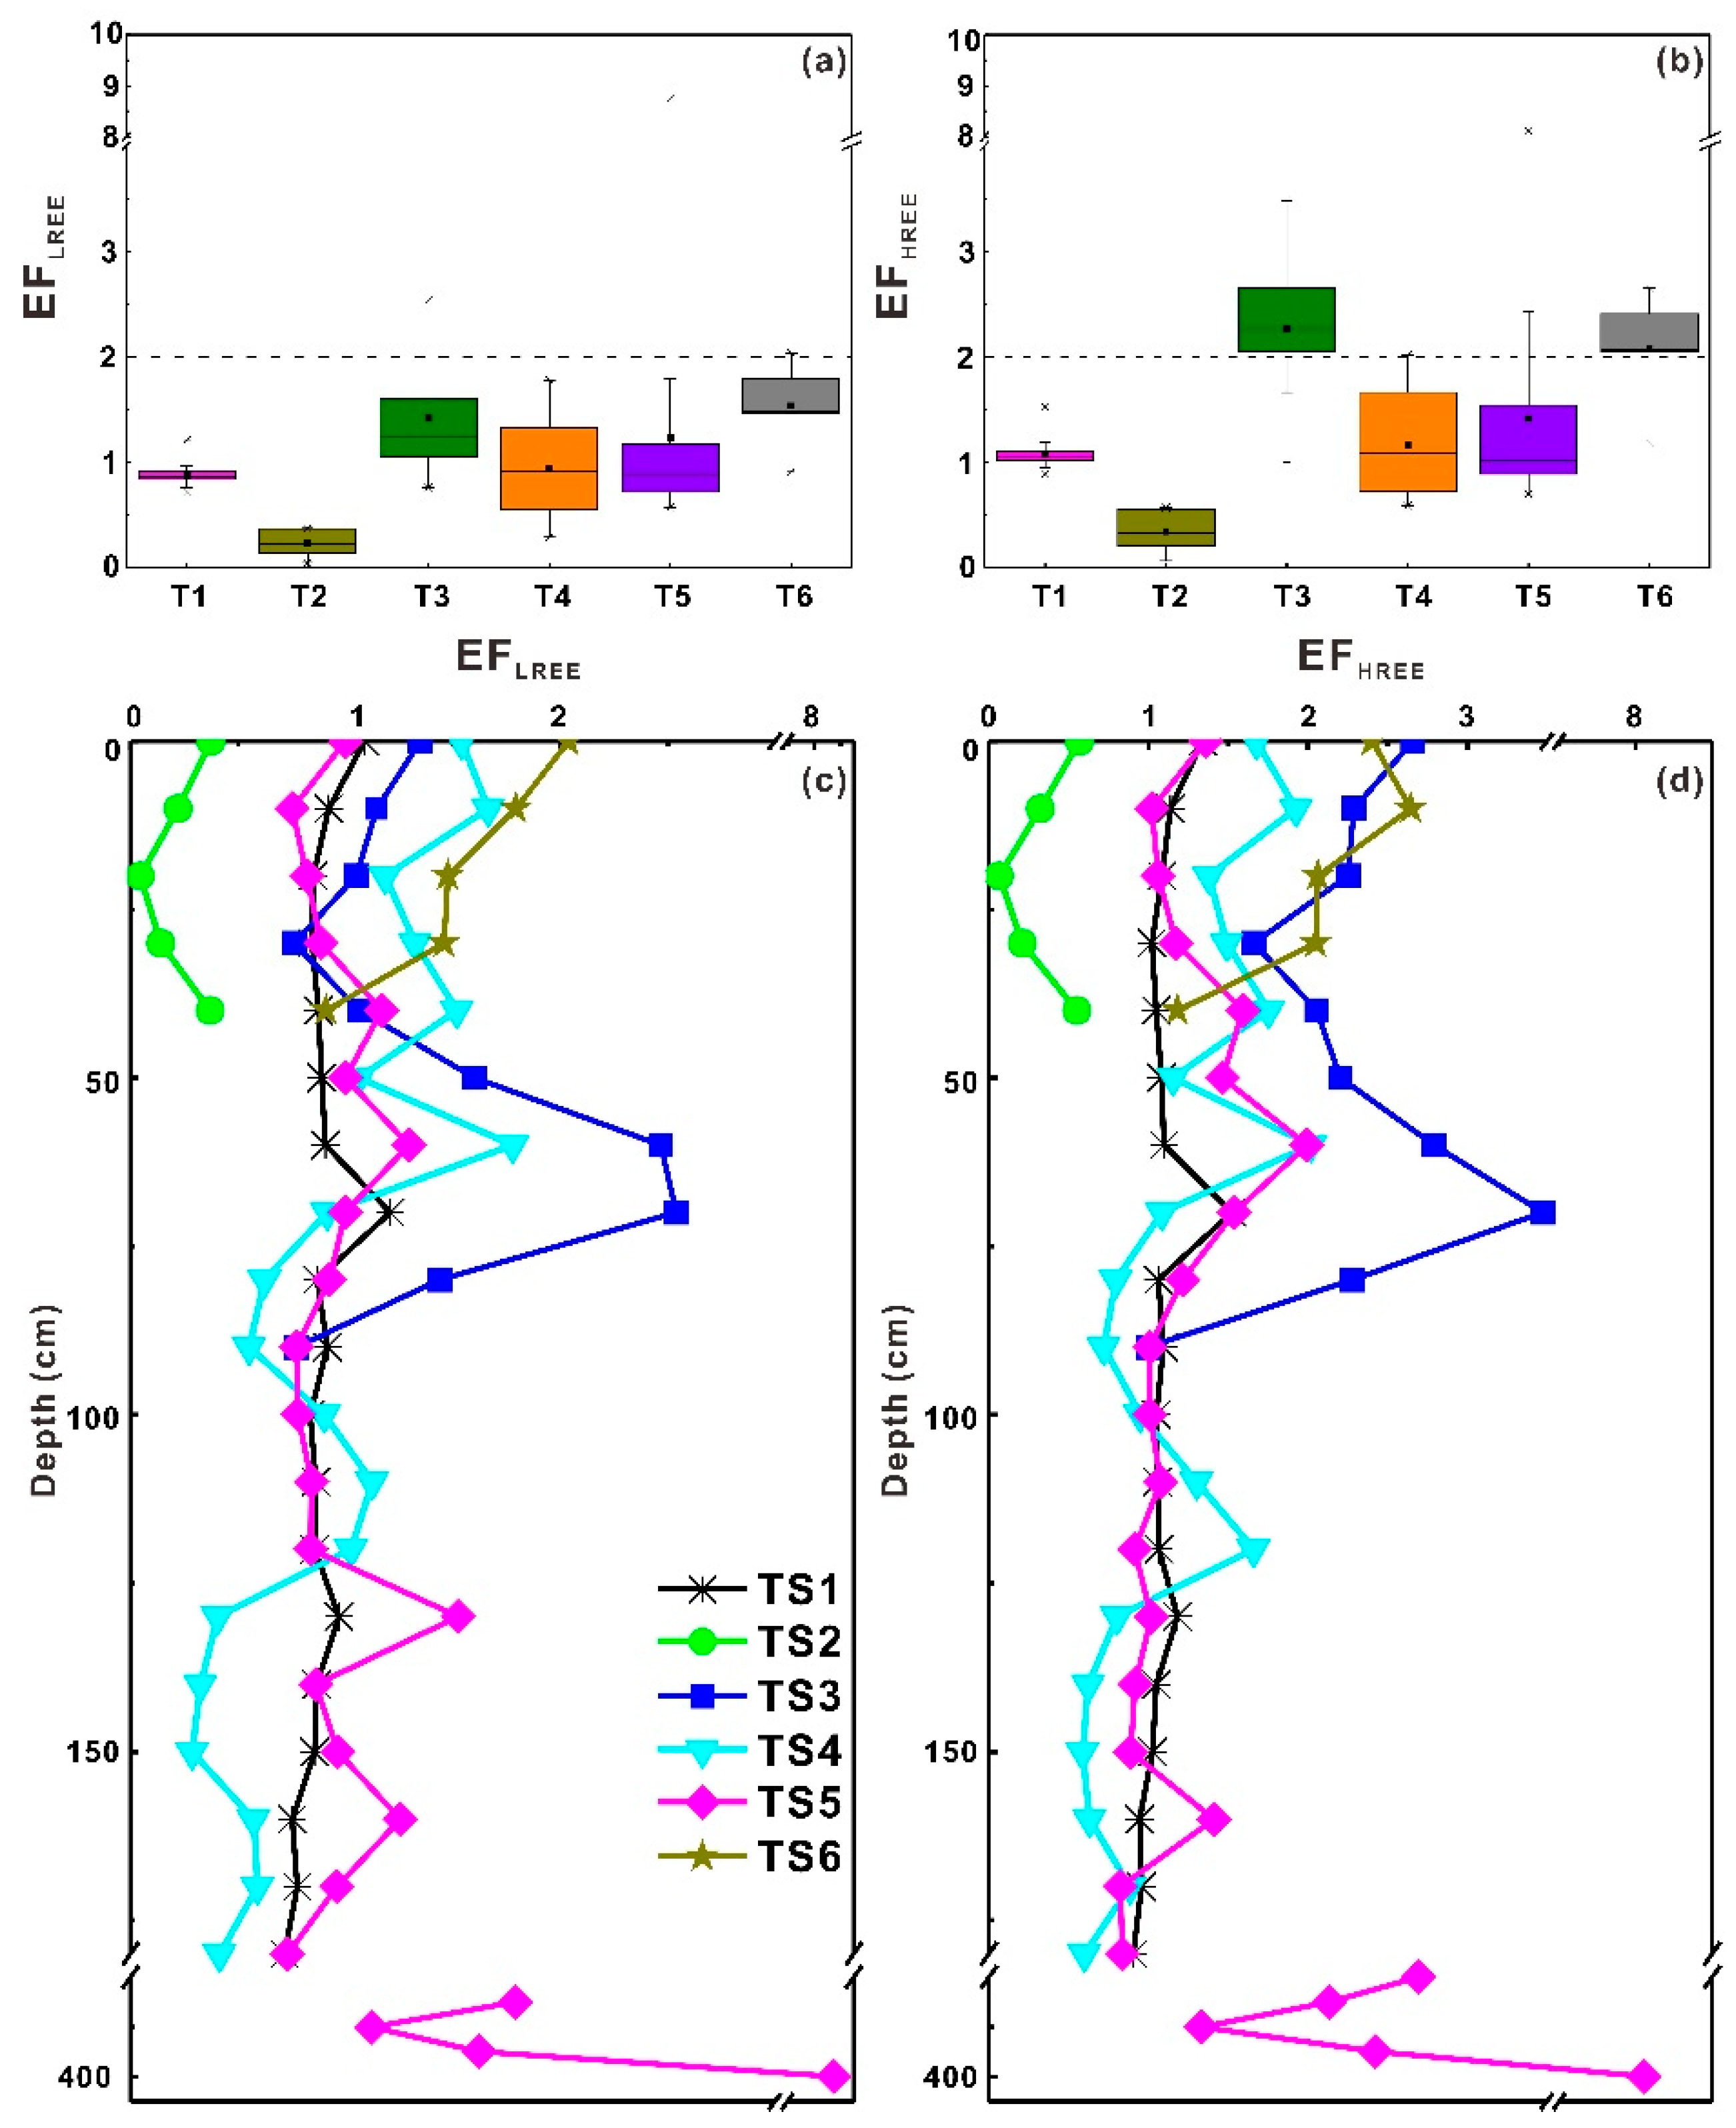
3.3. Enrichment Factors (EFs) of REEs

3.3.1. Distribution Patterns of EFs

The vertical distributions and box plots of the calculated enrichment factors (EFs) for LREEs and HREEs are shown in Figure 4. The average EF values for the LREEs and HREEs of each profile are 0.96, 0.23, 1.42, 0.97, 1.28, and 1.54 and 1.08, 0.34, 2.27, 1.16, 1.41, and 2.07, respectively. According to the EF values, the enrichment degrees of soil REEs can be categorized as no enrichment (≤2), minor enrichment (2–3), moderate enrichment (3–5), and severe enrichment (≥5) [52]. It can be seen that almost all samples show no enrichment of LREEs, but most samples from profiles T3 and T6 show minor enrichment of HREEs, indicating that HREEs are less mobile than LREEs. The phenomenon that HREEs are more enriched than LREEs can be explained by the adsorption/desorption processes: Under the effect of the lanthanide contraction, HREEs have smaller ionic radii, so they can be more stably absorbed than LREEs [36].
Vertically, the EFs of LREEs and HREEs generally tend to decrease slightly along with depth, but they show one huge positive peak at the depth of 55 to 75 cm in the soil profiles T3, T4, and T5 (Figure 4). One exception is that samples from the bottom of the soil profile T5 (boundary between the bedrock and soil) have severe enrichment of both LREEs and HREEs. Obviously, this anomalous enrichment is very likely related to weathering processes: In the process of weathering, many REEs are released from minerals and accumulate in soils, while some Al may have been lost, causing the severe enrichment of REEs relative to the UCC [53]. As for the positive peak, it may have resulted from the leaching of REEs down the soil profiles and their accumulation at certain soil depths.

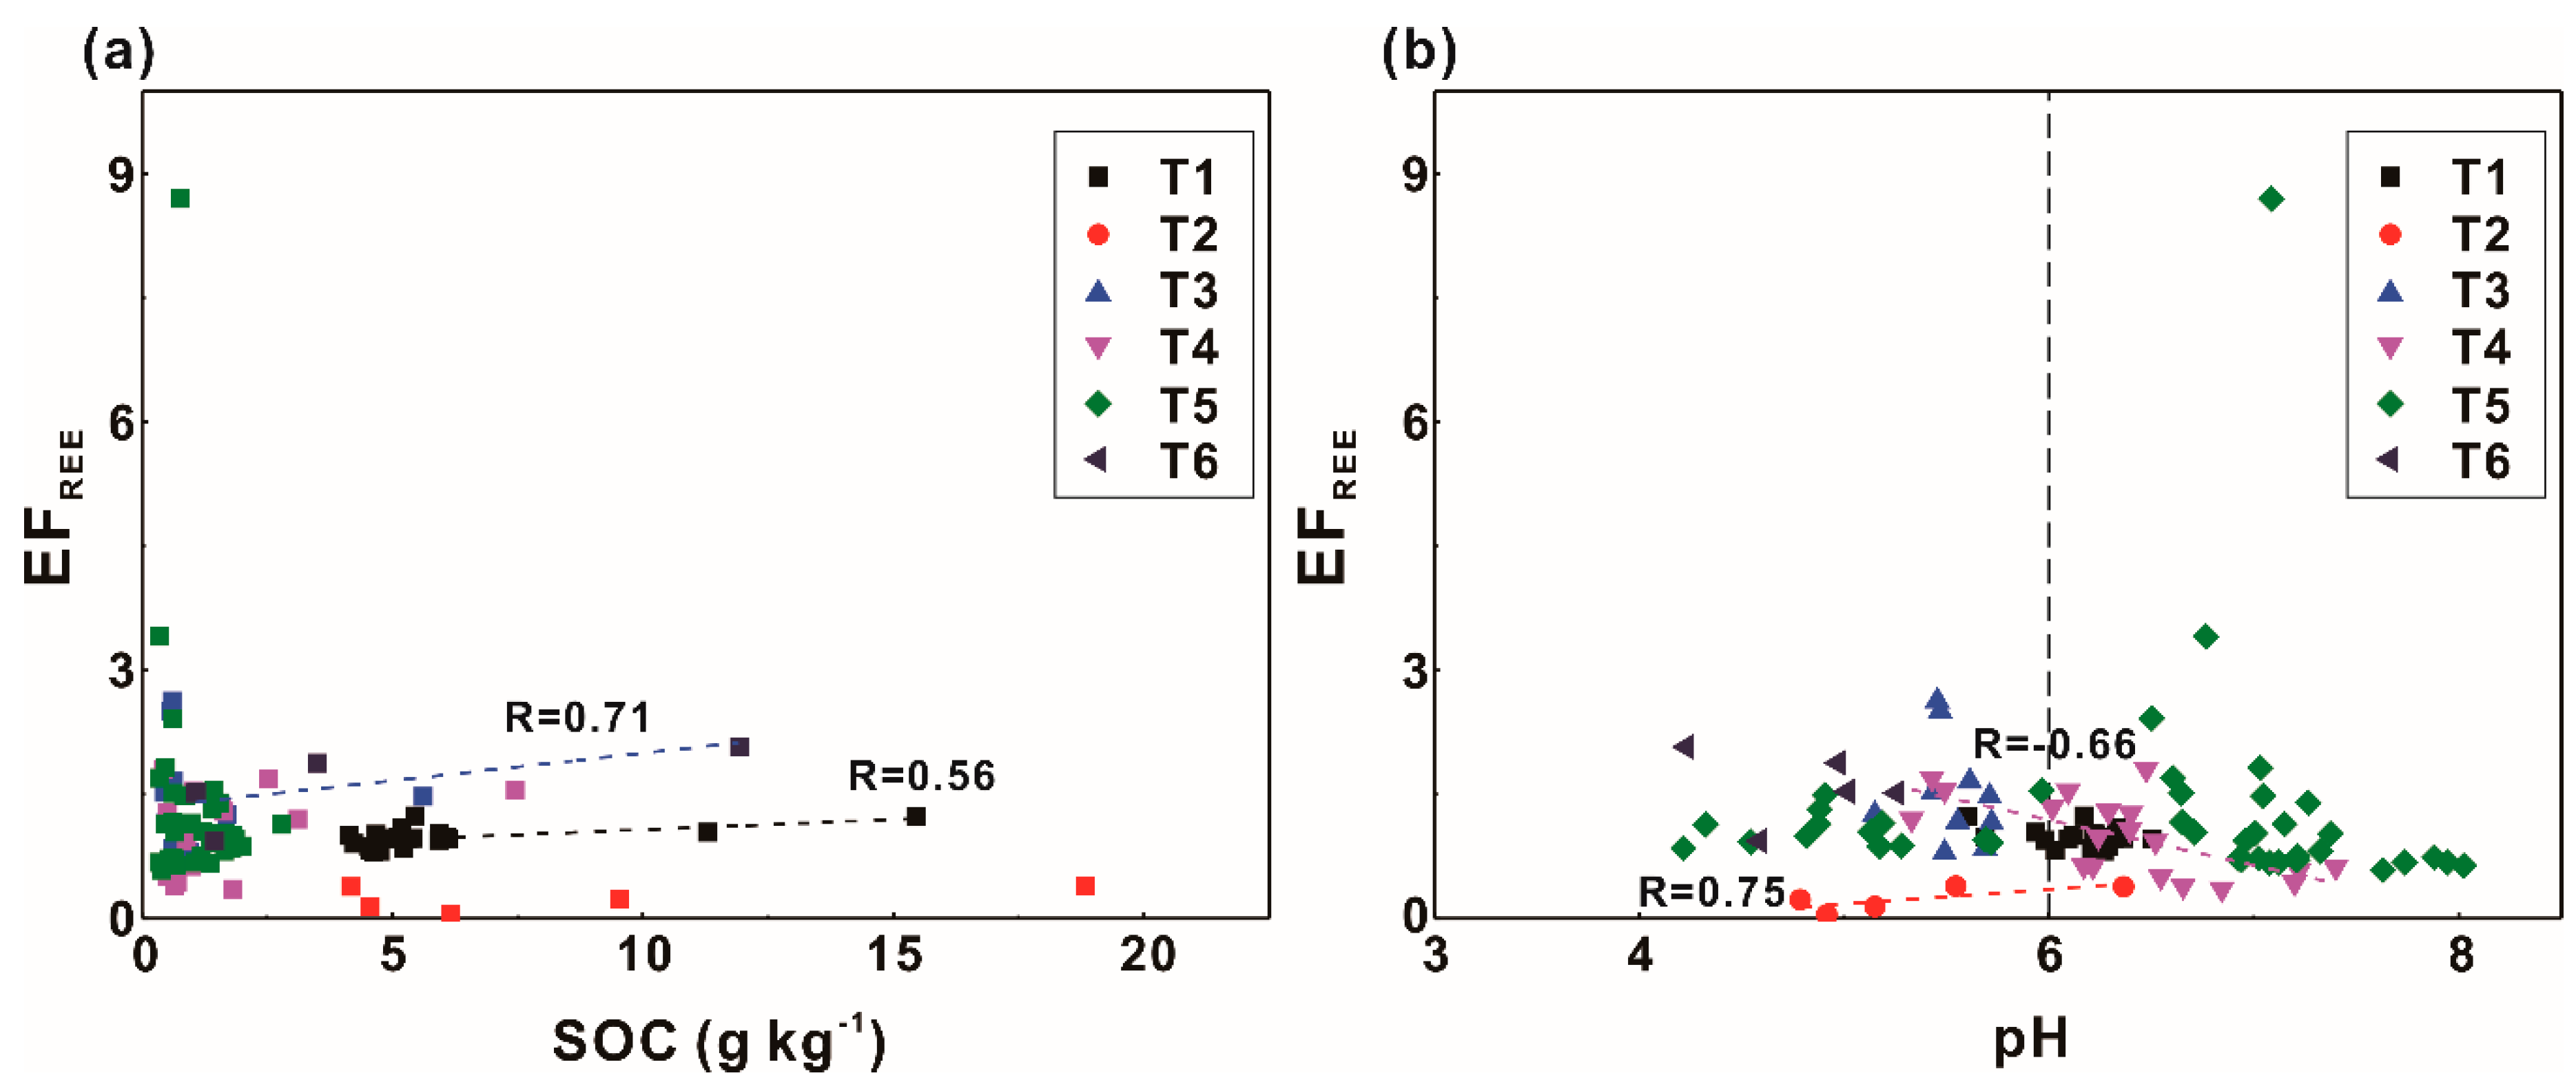
3.3.2. Factors Influencing EFs of Rare Earth Elements

The enrichment of REEs can be highly influenced by soil physicochemical properties, such as organic matter, soil pH, and soil texture [11,35]. In this study, the effects of SOC and soil pH on ∑REEs were explored to better understand the migration mechanisms of rare earth elements.
As shown in Figure 5, the enrichment factors of ∑REEs tend to increase slightly with SOC contents. Moreover, EFREE shows a relatively stronger correlation with SOC contents in soil profiles T1 (R = 0.56, p < 0.01) and T6 (R2 = 0.71). Many researches have studied the distributions of REEs in organic components and revealed the positive correlation between soil organic matter (SOM) and REEs [54,55]. Some functional groups of SOM own the ability to complex with REE ions, which enhances the absorption of SOM to REEs [56]. Soil pH values are correlated with EFREE in soil profiles T2 (R = 0.75) and T4 (R = −0.66, p < 0.01). Generally, the EFREE shows both positive (pH < 6) and negative (pH > 6) correlation with soil pH (Figure 5). The phenomenon demonstrates that pH is an important factor controlling the mobility of REEs, but the negative correlation between them contradicts with what many studies have found: The adsorption of REEs is positively correlated with soil pH because as soil pH increases, there will be more hydroxide ions (OH) forming complexes with REE ions [3,9,57,58]. One potential reason for the negative correlation between soil pH and EFREE when soil pH is higher than 6 could be that the mobility of the reference element Al is also strongly influenced by soil pH. It is known that as pH increases, Al ions tend to occur as Al–OH complexes [59], which is more easily retained in soils. When the enrichment rates of Al are higher than those of REEs, the EFREE will decrease as soil pH increases although the adsorption of REEs is improved.

4. Conclusions

The study of REEs’ profile distributions presents many distinctive characteristics of soil in the Mun River Basin. The main conclusions of this study are as follows: (1) The average contents of REEs in soil profiles T2, T3, T4, and T6 are quite low (<80 mg kg−1) compared with those in other regions, and these contents seem to be little influenced by land uses. (2) The enrichment of HREEs relative to LREEs is the main fractionation pattern for most samples, but a few samples near weathered crusts show the opposite results, indicating that HREEs are more mobile than LREEs during weathering processes. (3) The negative Ce anomalies and positive Eu anomalies occurring in the soil profile T2 demonstrate that these soil samples are very likely derived from granites. (4) Most soil samples show no enrichment of REEs even in paddy fields, indicating that anthropogenic activities have little influence on REEs, and that the behavior of REEs in soil is dominated by natural factors. (5) The correlation analysis shows that the low soil pH benefits the mobility of REEs, while high organic matter contents are not conducive to their mobility.

Author Contributions

Conceptualization, G.H. and W.Z.; methodology, G.H., M.L., X.L., and C.S.; validation, G.H., M.L., and W.Z.; formal analysis, W.Z.; investigation, G.H., M.L., X.L., and C.S.; resources, G.H.; data curation, W.Z.; writing—original draft preparation, W.Z.; writing—review and editing, G.H.; supervision, G.H.; project administration, G.H.; funding acquisition, G.H. All authors have read and agreed to the published version of the manuscript.

Funding

This research was funded by the National Natural Science Foundation of China (Grant No. 41661144029; 41325010).

Acknowledgments

The authors gratefully acknowledge Fairda Malem and her team from the Ministry of Natural Resources and Environment of Thailand.

Conflicts of Interest

The authors declare no conflict of interest.

References

  1. Cheng, H.; Hao, F.; Ouyang, W.; Liu, S.; Chunye, L.I.N.; Wenjing, Y. Vertical distribution of rare earth elements in a wetland soil core from the Sanjiang Plain in China. J. Rare Earths 2012, 30, 731–738. [Google Scholar] [CrossRef]
  2. Dołęgowska, S.; Migaszewski, Z.M. Anomalous concentrations of rare earth elements in the moss–soil system from south-central Poland. Environ. Pollut. 2013, 178, 33–40. [Google Scholar] [CrossRef] [PubMed]
  3. Han, G.L.; Song, Z.L.; Tang, Y. Geochemistry of rare earth elements in soils under different land uses in a typical karst area, Guizhou Province, Southwest China. Can. J. Soil Sci. 2017, 97, 606–612. [Google Scholar] [CrossRef] [Green Version]
  4. Welch, S.A.; Christy, A.G.; Isaacson, L.; Kirste, D. Mineralogical control of rare earth elements in acid sulfate soils. Geochim. Cosmochim. Acta 2009, 73, 44–64. [Google Scholar] [CrossRef]
  5. Tyler, G. Vertical distribution of major, minor, and rare elements in a Haplic Podzol. Geoderma 2004, 119, 277–290. [Google Scholar] [CrossRef]
  6. Ohlander, B.; Land, M.; Ingri, J.; Widerlund, A. Mobility of rare earth elements during weathering of till in northern Sweden. Appl. Geochem. 1996, 11, 93–99. [Google Scholar] [CrossRef]
  7. Patino, L.C.; Velbel, M.A.; Price, J.R.; Wade, J.A. Trace element mobility during spheroidal weathering of basalts and andesites in Hawaii and Guatemala. Chem. Geol. 2003, 202, 343–364. [Google Scholar] [CrossRef]
  8. Davranche, M.; Pourret, O.; Gruau, G.; Dia, A.; Le Coz-Bouhnik, M. Adsorption of REE (III)-humate complexes onto MnO2: Experimental evidence for cerium anomaly and lanthanide tetrad effect suppression. Geochim. Cosmochim. Acta 2005, 69, 4825–4835. [Google Scholar] [CrossRef]
  9. Cao, X.D.; Chen, Y.; Wang, X.R.; Deng, X.H. Effects of redox potential and pH value on the release of rare earth elements from soil. Chemosphere 2001, 44, 655–661. [Google Scholar] [CrossRef]
  10. Nesbitt, H.W. Mobility and fractionation of rare-earth elements during weathering of a granodiorite. Nature 1979, 279, 206–210. [Google Scholar] [CrossRef]
  11. Davranche, M.; Grybos, M.; Gruau, G.; Pedrot, M.; Dia, A.; Marsac, R. Rare earth element patterns: A tool for identifying trace metal sources during wetland soil reduction. Chem. Geol. 2011, 284, 127–137. [Google Scholar] [CrossRef]
  12. Pang, X.; Li, D.; Peng, A. Application of rare-earth elements in the agriculture of china and its environmental behavior in soil. Environ. Sci. Pollut. Res. Int. 2002, 9, 143–148. [Google Scholar] [CrossRef] [PubMed]
  13. Balaram, V. Rare earth elements: A review of applications, occurrence, exploration, analysis, recycling, and environmental impact. Geosci. Front. 2019, 10, 1285–1303. [Google Scholar] [CrossRef]
  14. Prabnakorn, S.; Maskey, S.; Suryadi, F.X.; de Fraiture, C. Rice yield in response to climate trends and drought index in the Mun River Basin, Thailand. Sci. Total Environ. 2018, 621, 108–119. [Google Scholar] [CrossRef]
  15. Pagano, G.; Guida, M.; Tommasi, F.; Oral, R. Health effects and toxicity mechanisms of rare earth elements-Knowledge gaps and research prospects. Ecotox. Environ. Safe. 2015, 115, 40–48. [Google Scholar] [CrossRef]
  16. Wijnhoud, J.D.; Konboon, Y.; Lefroy, R.D.B. Nutrient budgets: Sustainability assessment of rainfed lowland rice-based systems in northeast Thailand. Agric. Ecosyst. Environ. 2003, 100, 119–127. [Google Scholar] [CrossRef]
  17. Zhou, W.X.; Han, G.L.; Liu, M.; Li, X.Q. Effects of soil pH and texture on soil carbon and nitrogen in soil profiles under different land uses in Mun River Basin, Northeast Thailand. Peer J. 2019, 7, 15. [Google Scholar] [CrossRef] [Green Version]
  18. Qu, R.; Han, G.; Liu, M.; Li, X. The mercury behavior and contamination in soil profiles in Mun River Basin, Northeast Thailand. Int. J. Environ. Res. Public Health 2019, 16, 4131. [Google Scholar] [CrossRef] [Green Version]
  19. Khunthasuvon, S.; Rajastasereekul, S.; Hanviriyapant, P.; Romyen, P.; Fukai, S.; Basnayake, J.; Skulkhu, E. Lowland rice improvement in northern and northeast Thailand 1. Effects of fertiliser application and irrigation. Field Crop. Res. 1998, 59, 99–108. [Google Scholar] [CrossRef]
  20. Akter, A.; Babel, M.S. Hydrological modeling of the Mun River basin in Thailand. J. Hydrol. 2012, 452–453, 232–246. [Google Scholar] [CrossRef]
  21. Nimnate, P.; Thitimakorn, T.; Choowong, M.; Hisada, K. Imaging and locating paleo-channels using geophysical data from meandering system of the Mun River, Khorat Plateau, Northeastern Thailand. Open Geosci. 2017, 9, 675–688. [Google Scholar] [CrossRef] [Green Version]
  22. Dheeradilok, P. Mineral resources and landuse planning for industrial development in Nakhon Ratchasrima, Northeastern Thailand. J. Southeast Asian Earth Sci. 1993, 8, 567–571. [Google Scholar] [CrossRef]
  23. Löffler, E.; Thompson, W.P.; Liengsakul, M. Quaternary geomorphological development of the lower Mun river basin, North East Thailand. CATENA 1984, 11, 321–330. [Google Scholar] [CrossRef]
  24. Liu, M.; Han, G.L.; Zhang, Q.; Song, Z.L. Variations and indications of 13CSOC and 15NSON in soil profiles in karst critical zone observatory (CZO), Southwest China. Sustainability 2019, 11, 16. [Google Scholar]
  25. Liu, M.; Han, G.; Zhang, Q. Effects of agricultural abandonment on soil aggregation, soil organic carbon storage and stabilization: Results from observation in a small karst catchment, Southwest China. Agric. Ecosyst. Environ. 2020, 288, 106719. [Google Scholar] [CrossRef]
  26. Han, G.; Li, F.; Tang, Y. Organic matter impact on distribution of rare earth elements in soil under different land uses. Clean-Soil Air Water 2017, 45. [Google Scholar] [CrossRef]
  27. Alfaro, M.R.; do Nascimento, C.W.A.; Biondi, C.M.; da Silva, Y.; da Silva, Y.; Accioly, A.; Montero, A.; Ugarte, O.M.; Estevez, J. Rare-earth-element geochemistry geochemistry in soils developed in different geological settings of Cuba. Catena 2018, 162, 317–324. [Google Scholar] [CrossRef]
  28. Sadeghi, M.; Morris, G.A.; Carranza, E.J.M.; Ladenberger, A.; Andersson, M. Rare earth element distribution and mineralization in Sweden: An application of principal component analysis to foregs soil geochemistry. J. Geochem. Explor. 2013, 133, 160–175. [Google Scholar] [CrossRef]
  29. Laveuf, C.; Cornu, S. A review on the potentiality of Rare Earth Elements to trace pedogenetic processes. Geoderma 2009, 154, 1–12. [Google Scholar] [CrossRef]
  30. Taylor, S.R.; McLennan, S.M. The Continental Crust: Its Composition and Evolution; Blackwell Scientific Publications: London, UK, 1985. [Google Scholar]
  31. Compton, J.S.; White, R.A.; Smith, M. Rare earth element behavior in soils and salt pan sediments of a semi-arid granitic terrain in the Western Cape, South Africa. Chem. Geol. 2003, 201, 239–255. [Google Scholar] [CrossRef]
  32. Reimann, C.; De Caritat, P. Intrinsic flaws of element enrichment factors (EFs) in environmental geochemistry. Environ. Sci. Technol. 2000, 34, 5084–5091. [Google Scholar] [CrossRef]
  33. Wedepohl, K.H. The composition of the continental-crust. Geochim. Cosmochim. Acta 1995, 59, 1217–1232. [Google Scholar] [CrossRef]
  34. Huang, H.; Lin, C.; Yu, R.; Yan, Y.; Hu, G.; Wang, Q. Spatial distribution and source appointment of rare earth elements in paddy soils of Jiulong River Basin, Southeast China. J. Geochem. Explor. 2019, 200, 213–220. [Google Scholar] [CrossRef]
  35. Hu, Z.Y.; Haneklaus, S.; Sparovek, G.; Schnug, E. Rare earth elements in soils. Commun. Soil Sci. Plant Anal. 2006, 37, 1381–1420. [Google Scholar] [CrossRef]
  36. Chapela Lara, M.; Buss, H.L.; Pett-Ridge, J.C. The effects of lithology on trace element and REE behavior during tropical weathering. Chem. Geol. 2018, 500, 88–102. [Google Scholar] [CrossRef] [Green Version]
  37. Santos, J.C.B.D.; Le Pera, E.; Oliveira, C.S.D.; Souza Júnior, V.S.D.; Pedron, F.D.A.; Corrêa, M.M.; Azevedo, A.C.D. Impact of weathering on REE distribution in soil-saprolite profiles developed on orthogneisses in Borborema Province, NE Brazil. Geoderma 2019, 347, 103–117. [Google Scholar] [CrossRef]
  38. Zeng, J.; Yue, F.-J.; Wang, Z.-J.; Wu, Q.; Qin, C.-Q.; Li, S.-L. Quantifying depression trapping effect on rainwater chemical composition during the rainy season in karst agricultural area, southwestern China. Atmos. Environ. 2019, 218, 116998. [Google Scholar] [CrossRef]
  39. Sholkovitz, E.R.; Landing, W.M.; Lewis, B.L. Ocean particle chemistry: The fractionation of rare earth elements between suspended particles and seawater. Geochim. Cosmochim. Acta 1994, 58, 1567–1579. [Google Scholar] [CrossRef]
  40. Mihajlovic, J.; Bauriegel, A.; Stärk, H.-J.; Roßkopf, N.; Zeitz, J.; Milbert, G.; Rinklebe, J. Rare earth elements in soil profiles of various ecosystems across Germany. Appl. Geochem. 2019, 102, 197–217. [Google Scholar] [CrossRef]
  41. Han, G.L.; Xu, Z.F.; Tang, Y.; Zhang, G.P. Rare earth element patterns in the karst terrains of Guizhou Province, China: Implication for water/particle interaction. Aquat. Geochem. 2009, 15, 457–484. [Google Scholar] [CrossRef]
  42. Cao, X.; Wu, P.; Cao, Z. Element geochemical characteristics of a soil profile developed on dolostone in central Guizhou, southern China: Implications for parent materials. Acta Geochim. 2016, 35, 445–462. [Google Scholar] [CrossRef]
  43. Akagi, T.; Fu, F.F.; Yabuki, S. Absence of Ce anomaly in the REE patterns of peat moss and peat grass in the Ozegahara peatland. Geochem. J. 2002, 36, 113–118. [Google Scholar] [CrossRef] [Green Version]
  44. Laveuf, C.; Cornu, S.; Juillot, F. Rare earth elements as tracers of pedogenetic processes. C. R. Geosci. 2008, 340, 523–532. [Google Scholar] [CrossRef]
  45. Han, G.; Song, Z.; Tang, Y.; Wu, Q.; Wang, Z. Ca and Sr isotope compositions of rainwater from Guiyang city, Southwest China: Implication for the sources of atmospheric aerosols and their seasonal variations. Atmos. Environ. 2019, 214, 116854. [Google Scholar] [CrossRef]
  46. Semhi, K.; Chaudhuri, S.; Clauer, N.; Boeglin, J.L. Impact of termite activity on soil environment: A perspective from their soluble chemical components. Int. J. Environ. Sci. Technol. 2008, 5, 431–444. [Google Scholar] [CrossRef] [Green Version]
  47. Alderton, D.H.M.; Pearce, J.A.; Potts, P.J. Rare-earth Element mobility during granite alteration—Evidence from southwest England. Earth Planet. Sci. Lett. 1980, 49, 149–165. [Google Scholar] [CrossRef]
  48. Carling, P.A. The geology of the lower Mekong River. In The Mekong; Elsevier: Amsterdam, The Netherlands, 2009; pp. 13–28. [Google Scholar]
  49. Sanematsu, K.; Kon, Y.; Imai, A.; Watanabe, K.; Watanabe, Y. Geochemical and mineralogical characteristics of ion-adsorption type REE mineralization in Phuket, Thailand. Miner. Depos. 2013, 48, 437–451. [Google Scholar] [CrossRef]
  50. Bau, M.; Koschinsky, A. Oxidative scavenging of cerium on hydrous Fe oxide: Evidence from the distribution of rare earth elements and yttrium between Fe oxides and Mn oxides in hydrogenetic ferromanganese crusts. Geochem. J. 2009, 43, 37–47. [Google Scholar] [CrossRef] [Green Version]
  51. Takahashi, Y.; Shimizu, H.; Usui, A.; Kagi, H.; Nomura, M. Direct observation of tetravalent cerium in ferromanganese nodules and crusts by X-ray-absorption near-edge structure (XANES). Geochim. Cosmochim. Acta 2000, 64, 2929–2935. [Google Scholar] [CrossRef]
  52. Elias, M.S.; Ibrahim, S.; Samuding, K.; Kantasamy, N.; Daung, J.A.D.; Rahman, S.A.; Hashim, A. Dataset on concentration and enrichment factor of rare earth elements (REEs) in sediments of Linggi River, Malaysia. Data Brief 2019, 25, 103983. [Google Scholar] [CrossRef]
  53. Condie, K.C.; Dengate, J.; Cullers, R.L. Behavior of rare-earth elements in a paleoweathering profile on granodiorite in the front range, Colorado, USA. Geochim. Cosmochim. Acta 1995, 59, 279–294. [Google Scholar] [CrossRef]
  54. Tang, Y.; Han, G.L. Characteristics of major elements and heavy metals in atmospheric dust in Beijing, China. J. Geochem. Explor. 2017, 176, 114–119. [Google Scholar] [CrossRef]
  55. Yong, R.; Zheng, L. The distribution of exogenous REEs in Chinese major types of soil. Rare Earth Elem. 1992, 2, 31–35. [Google Scholar]
  56. Wu, Z.H.; Luo, J.; Guo, H.Y.; Wang, X.R.; Yang, C.S. Adsorption isotherms of lanthanum to soil constituents and effects of pH, EDTA and fulvic acid on adsorption of lanthanum onto goethite and humic acid. Chem. Speciat. Bioavail. 2001, 13, 75–81. [Google Scholar]
  57. Davranche, M.; Pourret, O.; Gruau, G.; Dia, A.; Jin, D.; Gaertner, D. Competitive binding of REE to humic acid and manganese oxide: Impact of reaction kinetics on development of cerium anomaly and REE adsorption. Chem. Geol. 2008, 247, 154–170. [Google Scholar] [CrossRef]
  58. Zeng, J.; Han, G.; Wu, Q.; Tang, Y. Effects of agricultural alkaline substances on reducing the rainwater acidification: Insight from chemical compositions and calcium isotopes in a karst forests area. Agric. Ecosyst. Environ. 2020, 290. [Google Scholar] [CrossRef]
  59. Hendershot, W.; Lalande, H.; Duquette, M. Soil reaction and exchangeable acidity. In Soil Sampling and Methods of Analysis; CRC Press Company: Boca Raton, FL, USA, 1993; Volume 2. [Google Scholar]
Figure 1. Map of sampling points and lithological distribution in the Mun River Basin.
Sustainability 12 00457 g001
Figure 2. Box charts and vertical distributions of rare earth elements (REEs) in six soil profiles. Some data are omitted because they are in small ranges of variation. (ac): Box diagrams of light REE (LREE), heavy REEs (HREE), and total REE contents in six soil profiles; (df): Vertical distributions of LREE, HREE, and total REE contents in six soil profiles.
Sustainability 12 00457 g002
Figure 3. Rare earth elements fractionation patterns (post-Archaean Australian shale (PAAS)-normalized) at the selected depths in six soil profiles in the Mun River Basin. (af) represent soil profiles T1–T6.
Sustainability 12 00457 g003
Figure 4. Box charts and vertical distributions of enrichment factors for LREEs and HREEs in six soil profiles. Some data are omitted because they are in small ranges of variation. (a,b): Box diagrams of the enrichment factors for LREEs and HREEs in six soil profiles; (c,d): Vertical distributions of the enrichment factors for LREEs and HREEs in six soil profiles.
Sustainability 12 00457 g004
Figure 5. (a) Correlation between soil organic carbon (SOC) and enrichment factors of total rare earth elements. (b) Correlation between soil pH and enrichment factors of total rare earth elements. Data from [17].
Sustainability 12 00457 g005
Table 1. General information of the six soil profiles in the Mun River Basin.
Sampling PointLand CoverLocationImportant Field Records
T1Rice14°56′32.59″ N
101°58′34.10″ E
Relatively uniform soil at different depths
T2Forest14°33′5.03″ N
104°56′14.76″ E
Brown, red, and compact soil
T3Rice15°09′0.77″ N
105°10′56.44″ E
0–12 cm: Gray-black root layer
12–100 cm: Fine silt
>100 cm: Iron–manganese nodules
T4Wild grass15°03′55.86″ N
104°55′7.50″ E
0–20 cm: Plant root layer
20–112 cm: Fine silt
112–180 cm: Red weathering crust
180–193 cm: Gray-green sand
>193 cm: Bedrock
T5Artificial building14°58′33.11″ N
104°23′44.07″ E
0–105 cm: Fine silt
105–205 cm: Iron–manganese nodules
205–405 cm: Clay layer
T6Forest15°11′59.35″ N
104°30′28.23″ E
Fine silt

