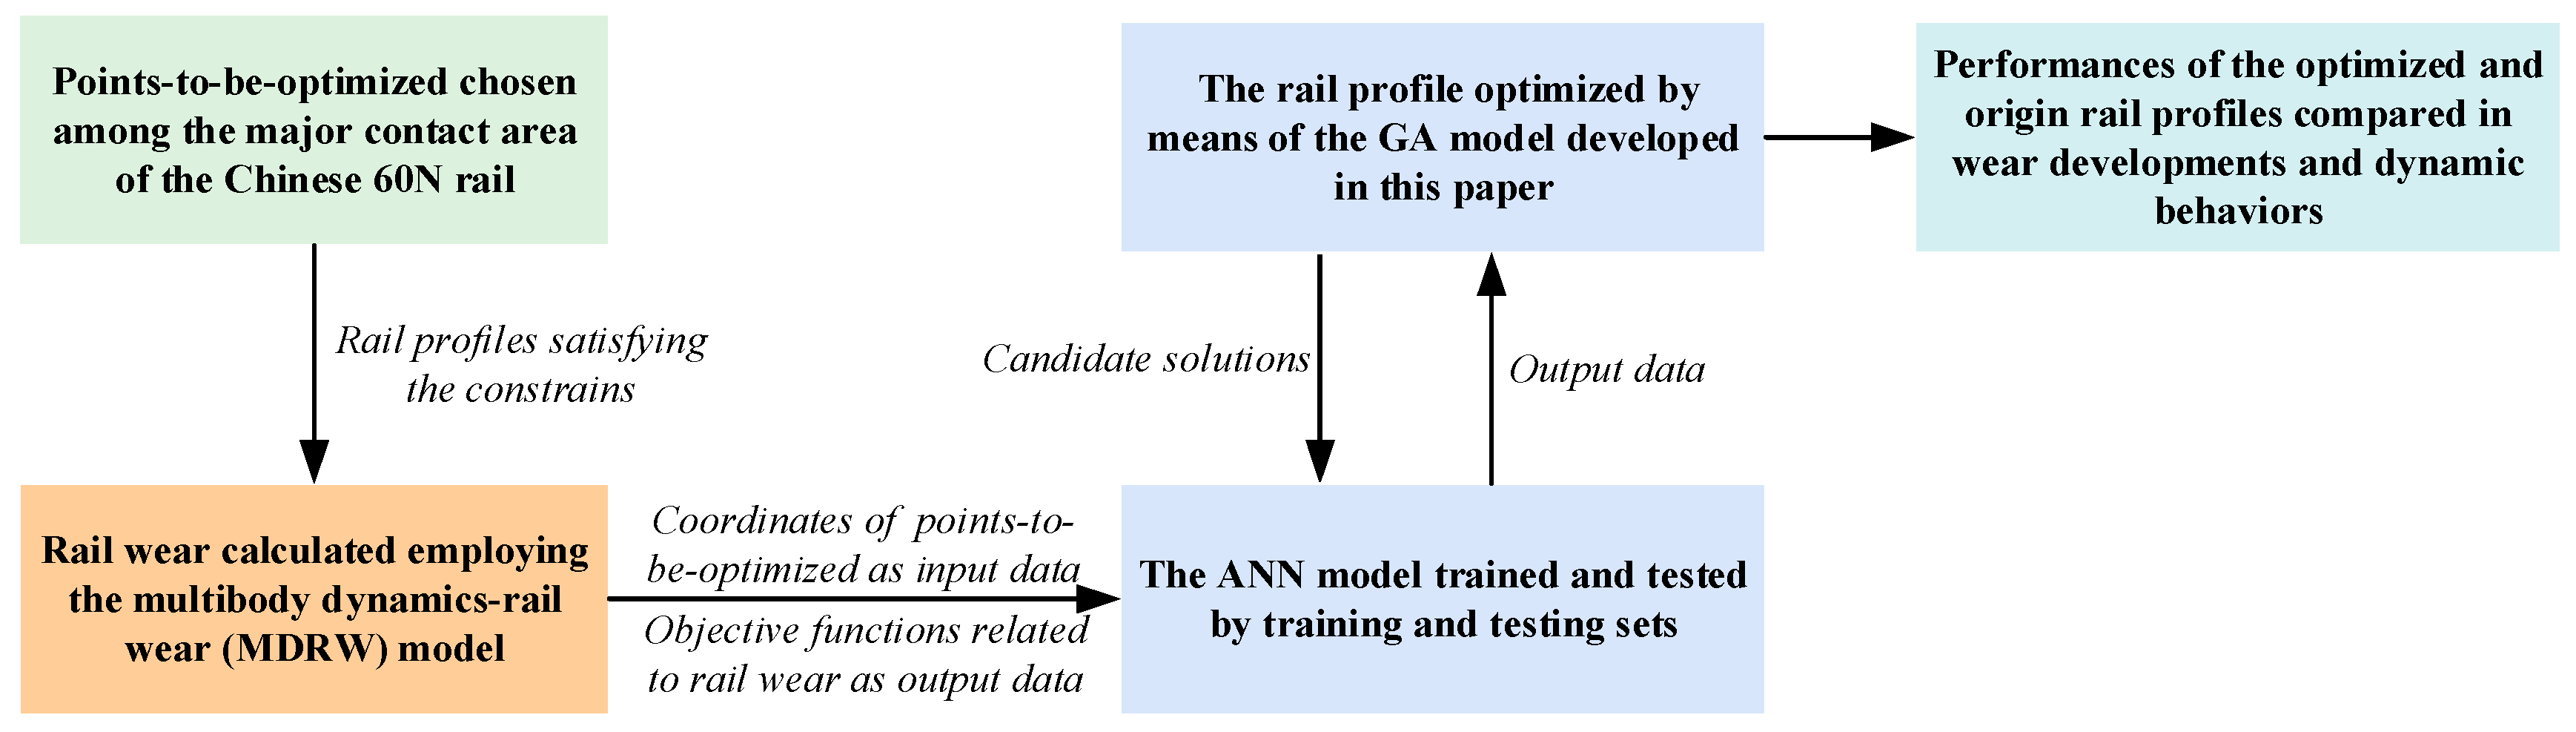
Figure 1.
The framework of the optimization method in this paper.
Figure 1.
The framework of the optimization method in this paper.
Figure 2.
The illustration of design variables.
Figure 2.
The illustration of design variables.
Figure 3.
(a) The lateral irregularities and (b) vertical irregularities.
Figure 3.
(a) The lateral irregularities and (b) vertical irregularities.
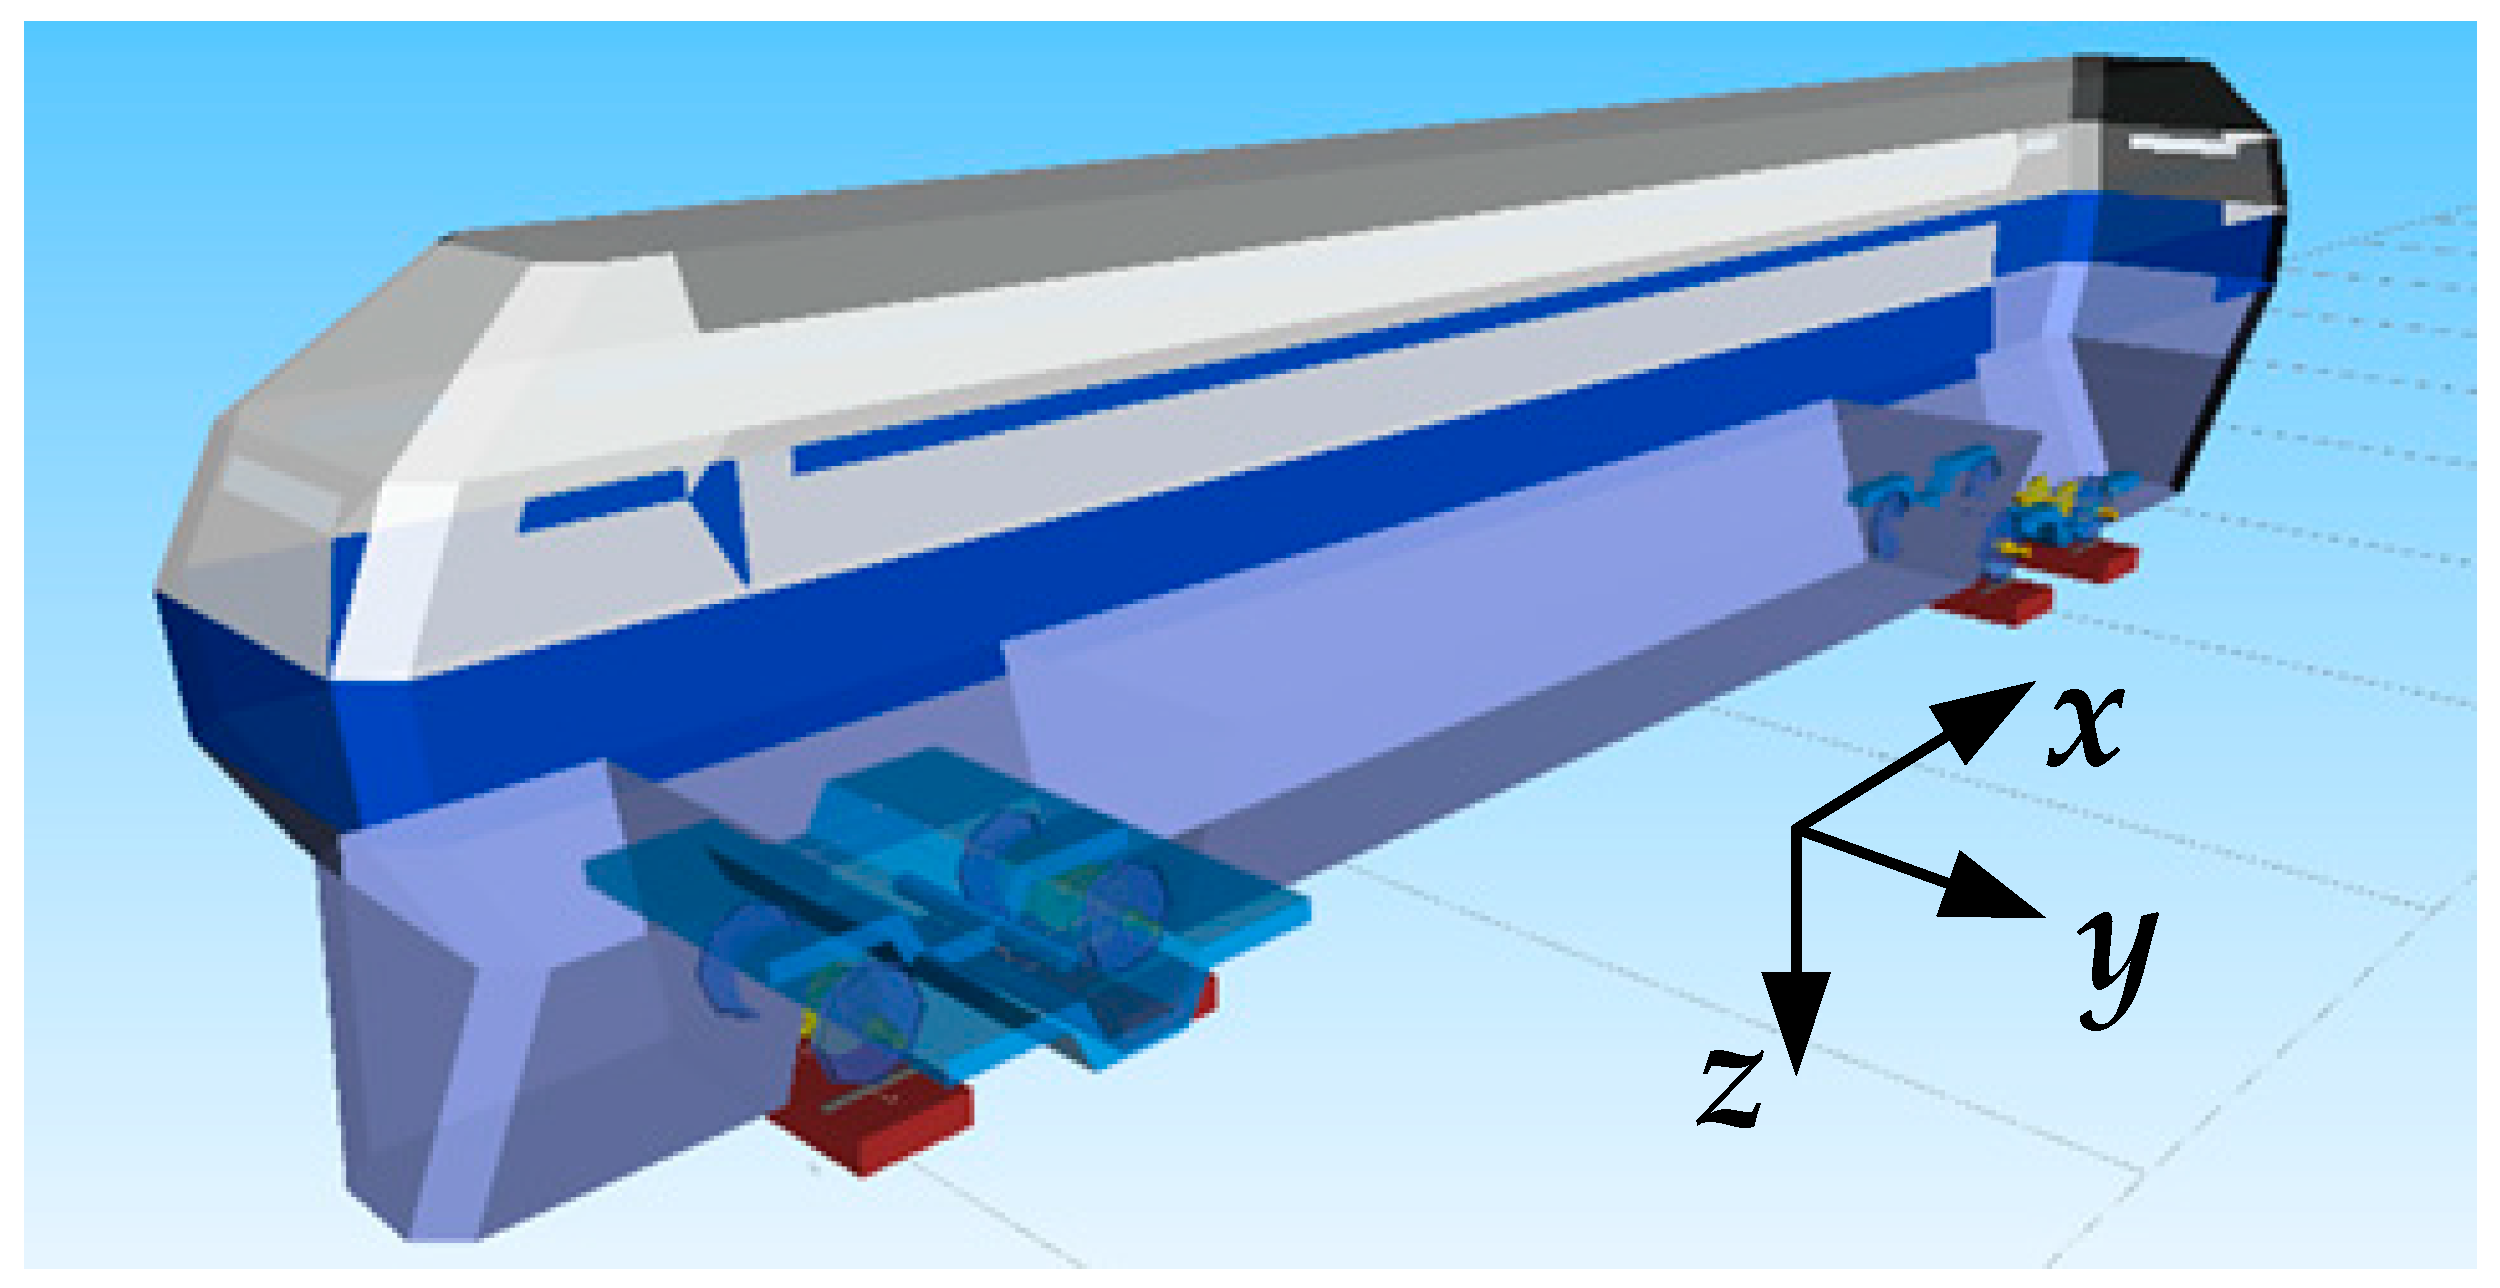
Figure 4.
The multibody dynamics model.
Figure 4.
The multibody dynamics model.
Figure 5.
The Archard wear coefficient.
Figure 5.
The Archard wear coefficient.
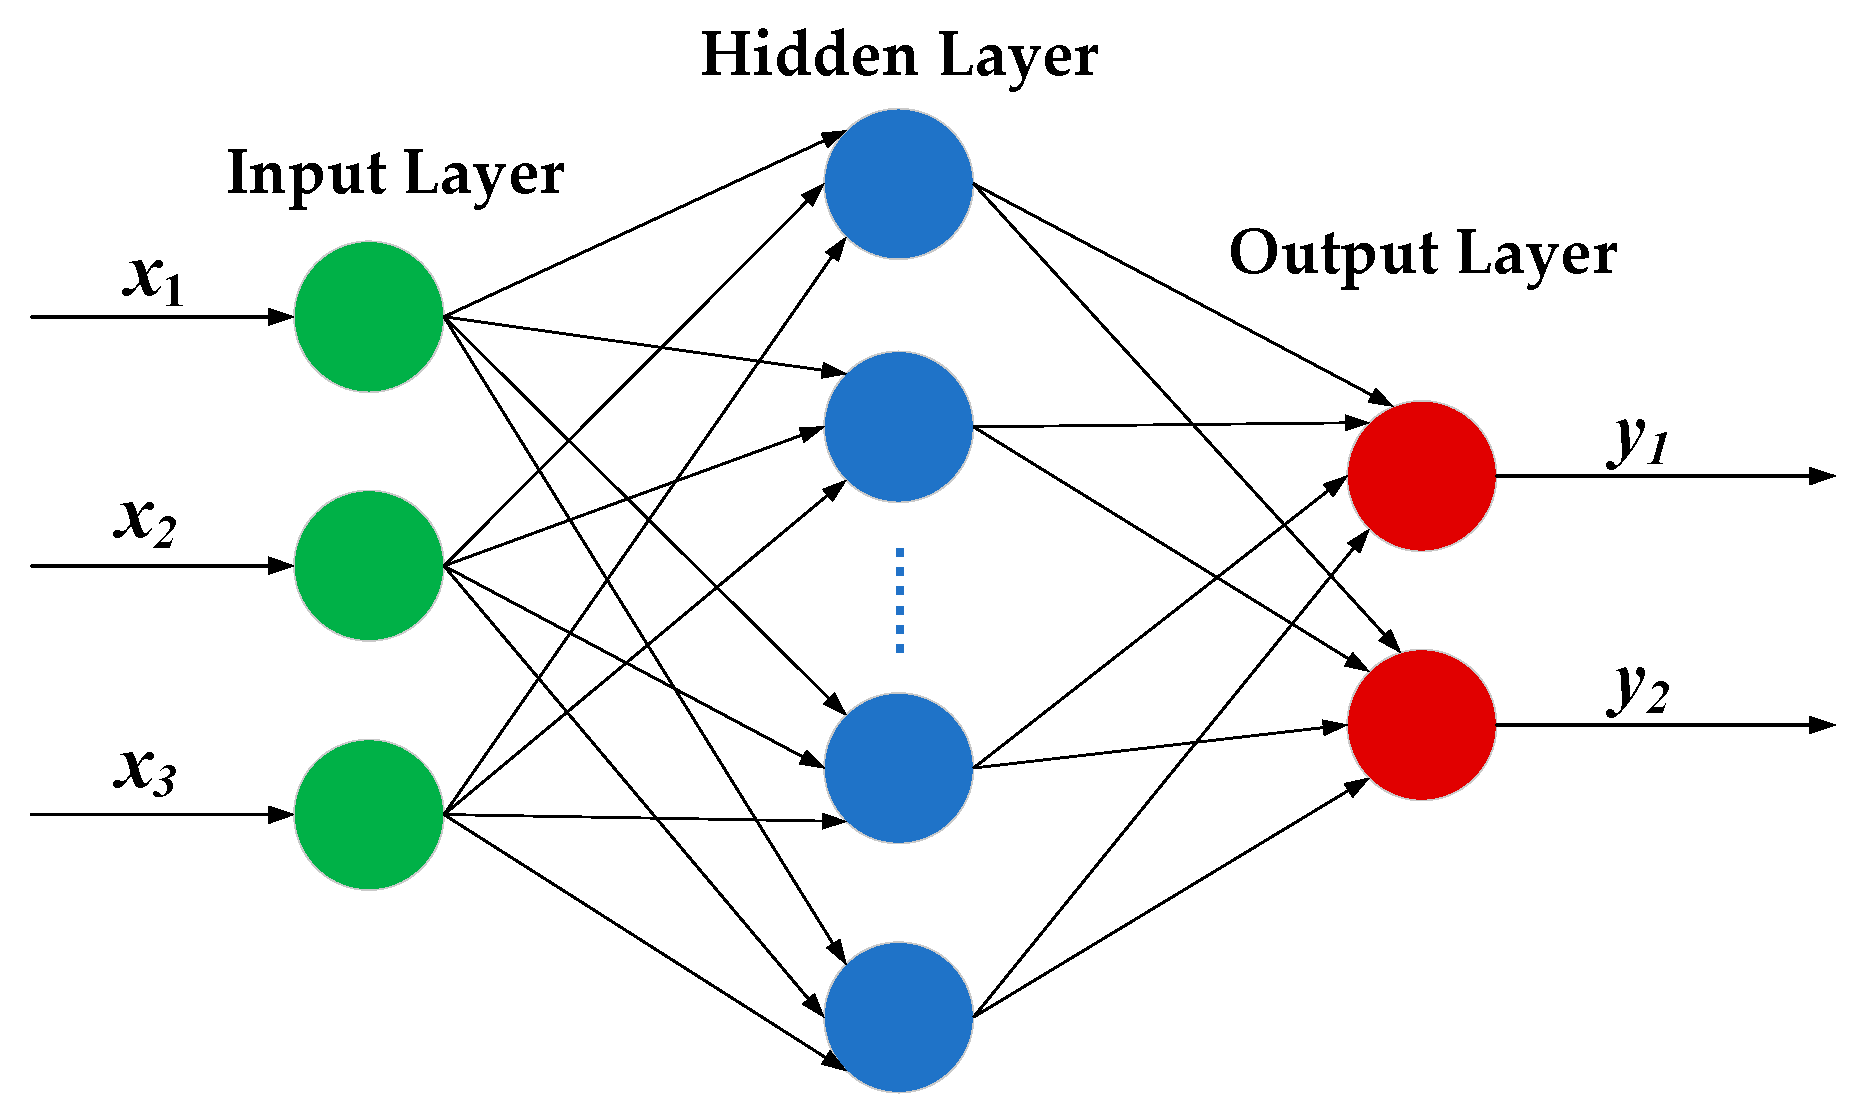
Figure 6.
The structure of an artificial neural network (ANN). (xi and yi are the input and output, respectively).
Figure 6.
The structure of an artificial neural network (ANN). (xi and yi are the input and output, respectively).
Figure 7.
The relationship between the number of hidden-layer nodes and mean square error (MSE).
Figure 7.
The relationship between the number of hidden-layer nodes and mean square error (MSE).
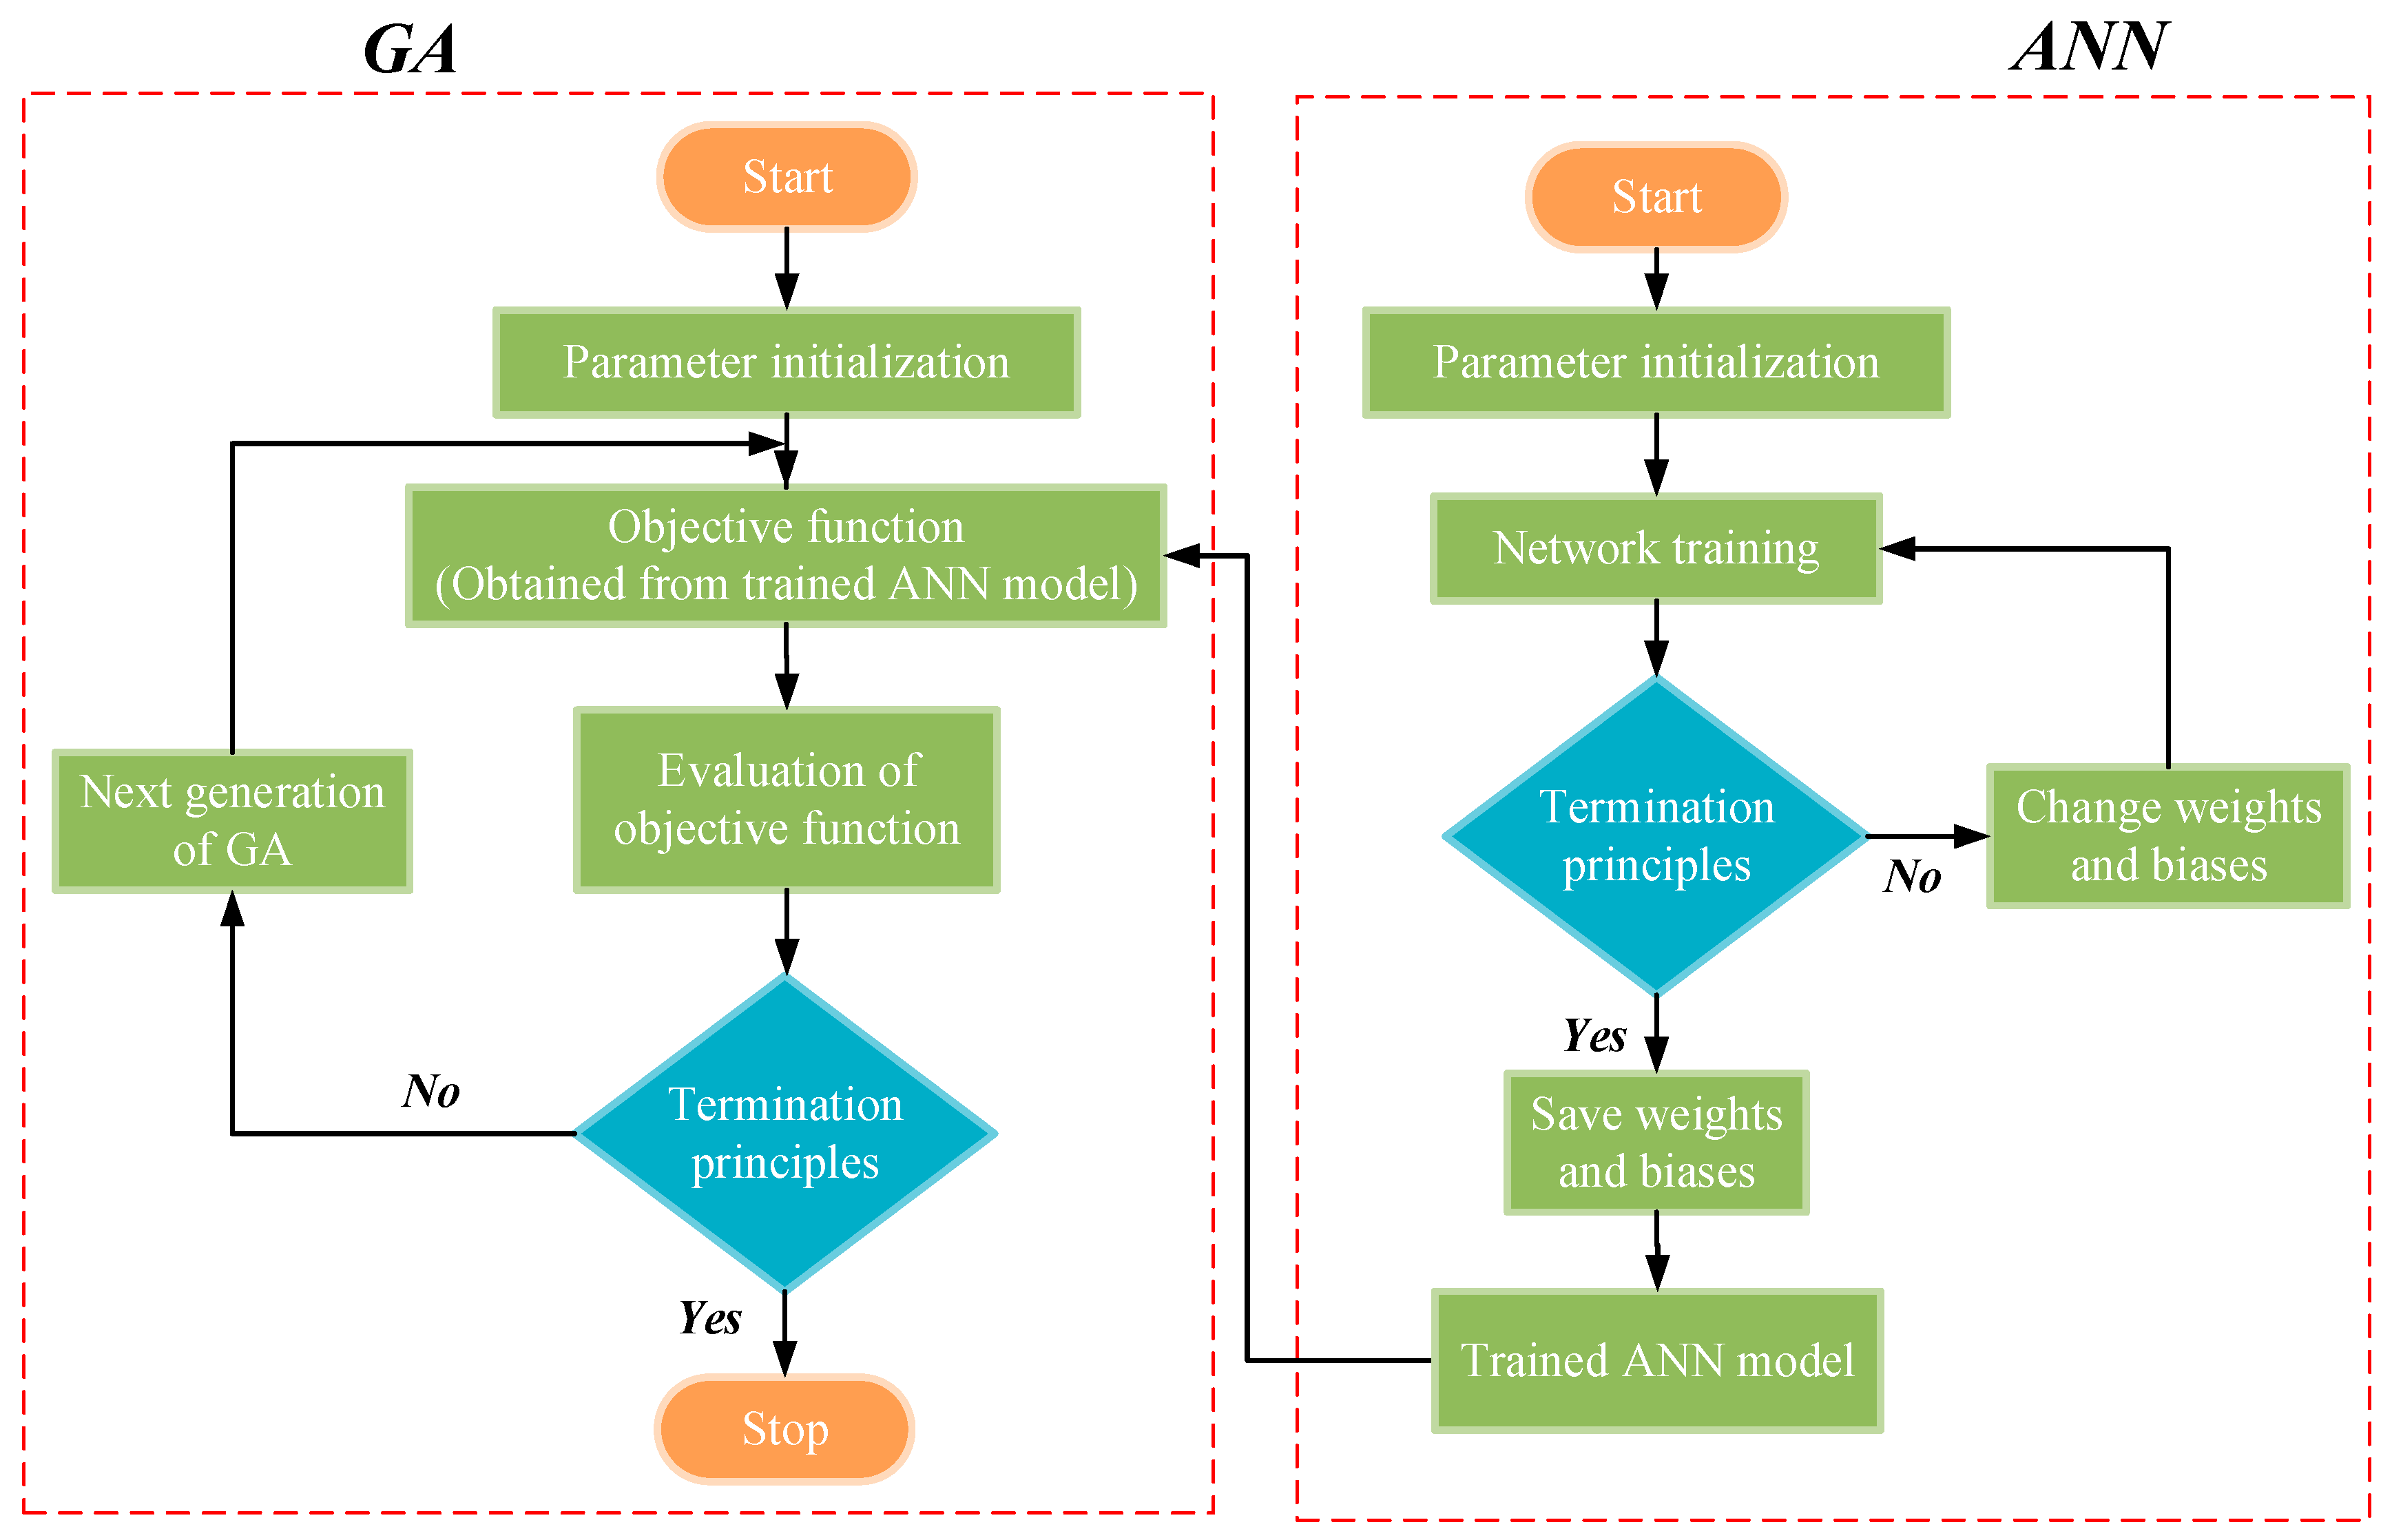
Figure 8.
The ANN-GA (genetic algorithm) coupled optimization method.
Figure 8.
The ANN-GA (genetic algorithm) coupled optimization method.
Figure 9.
The geometric parameters of the Chinese 60N rail profile.
Figure 9.
The geometric parameters of the Chinese 60N rail profile.
Figure 10.
The three types of wheel profiles.
Figure 10.
The three types of wheel profiles.
Figure 11.
The satisfactory rail profiles.
Figure 11.
The satisfactory rail profiles.
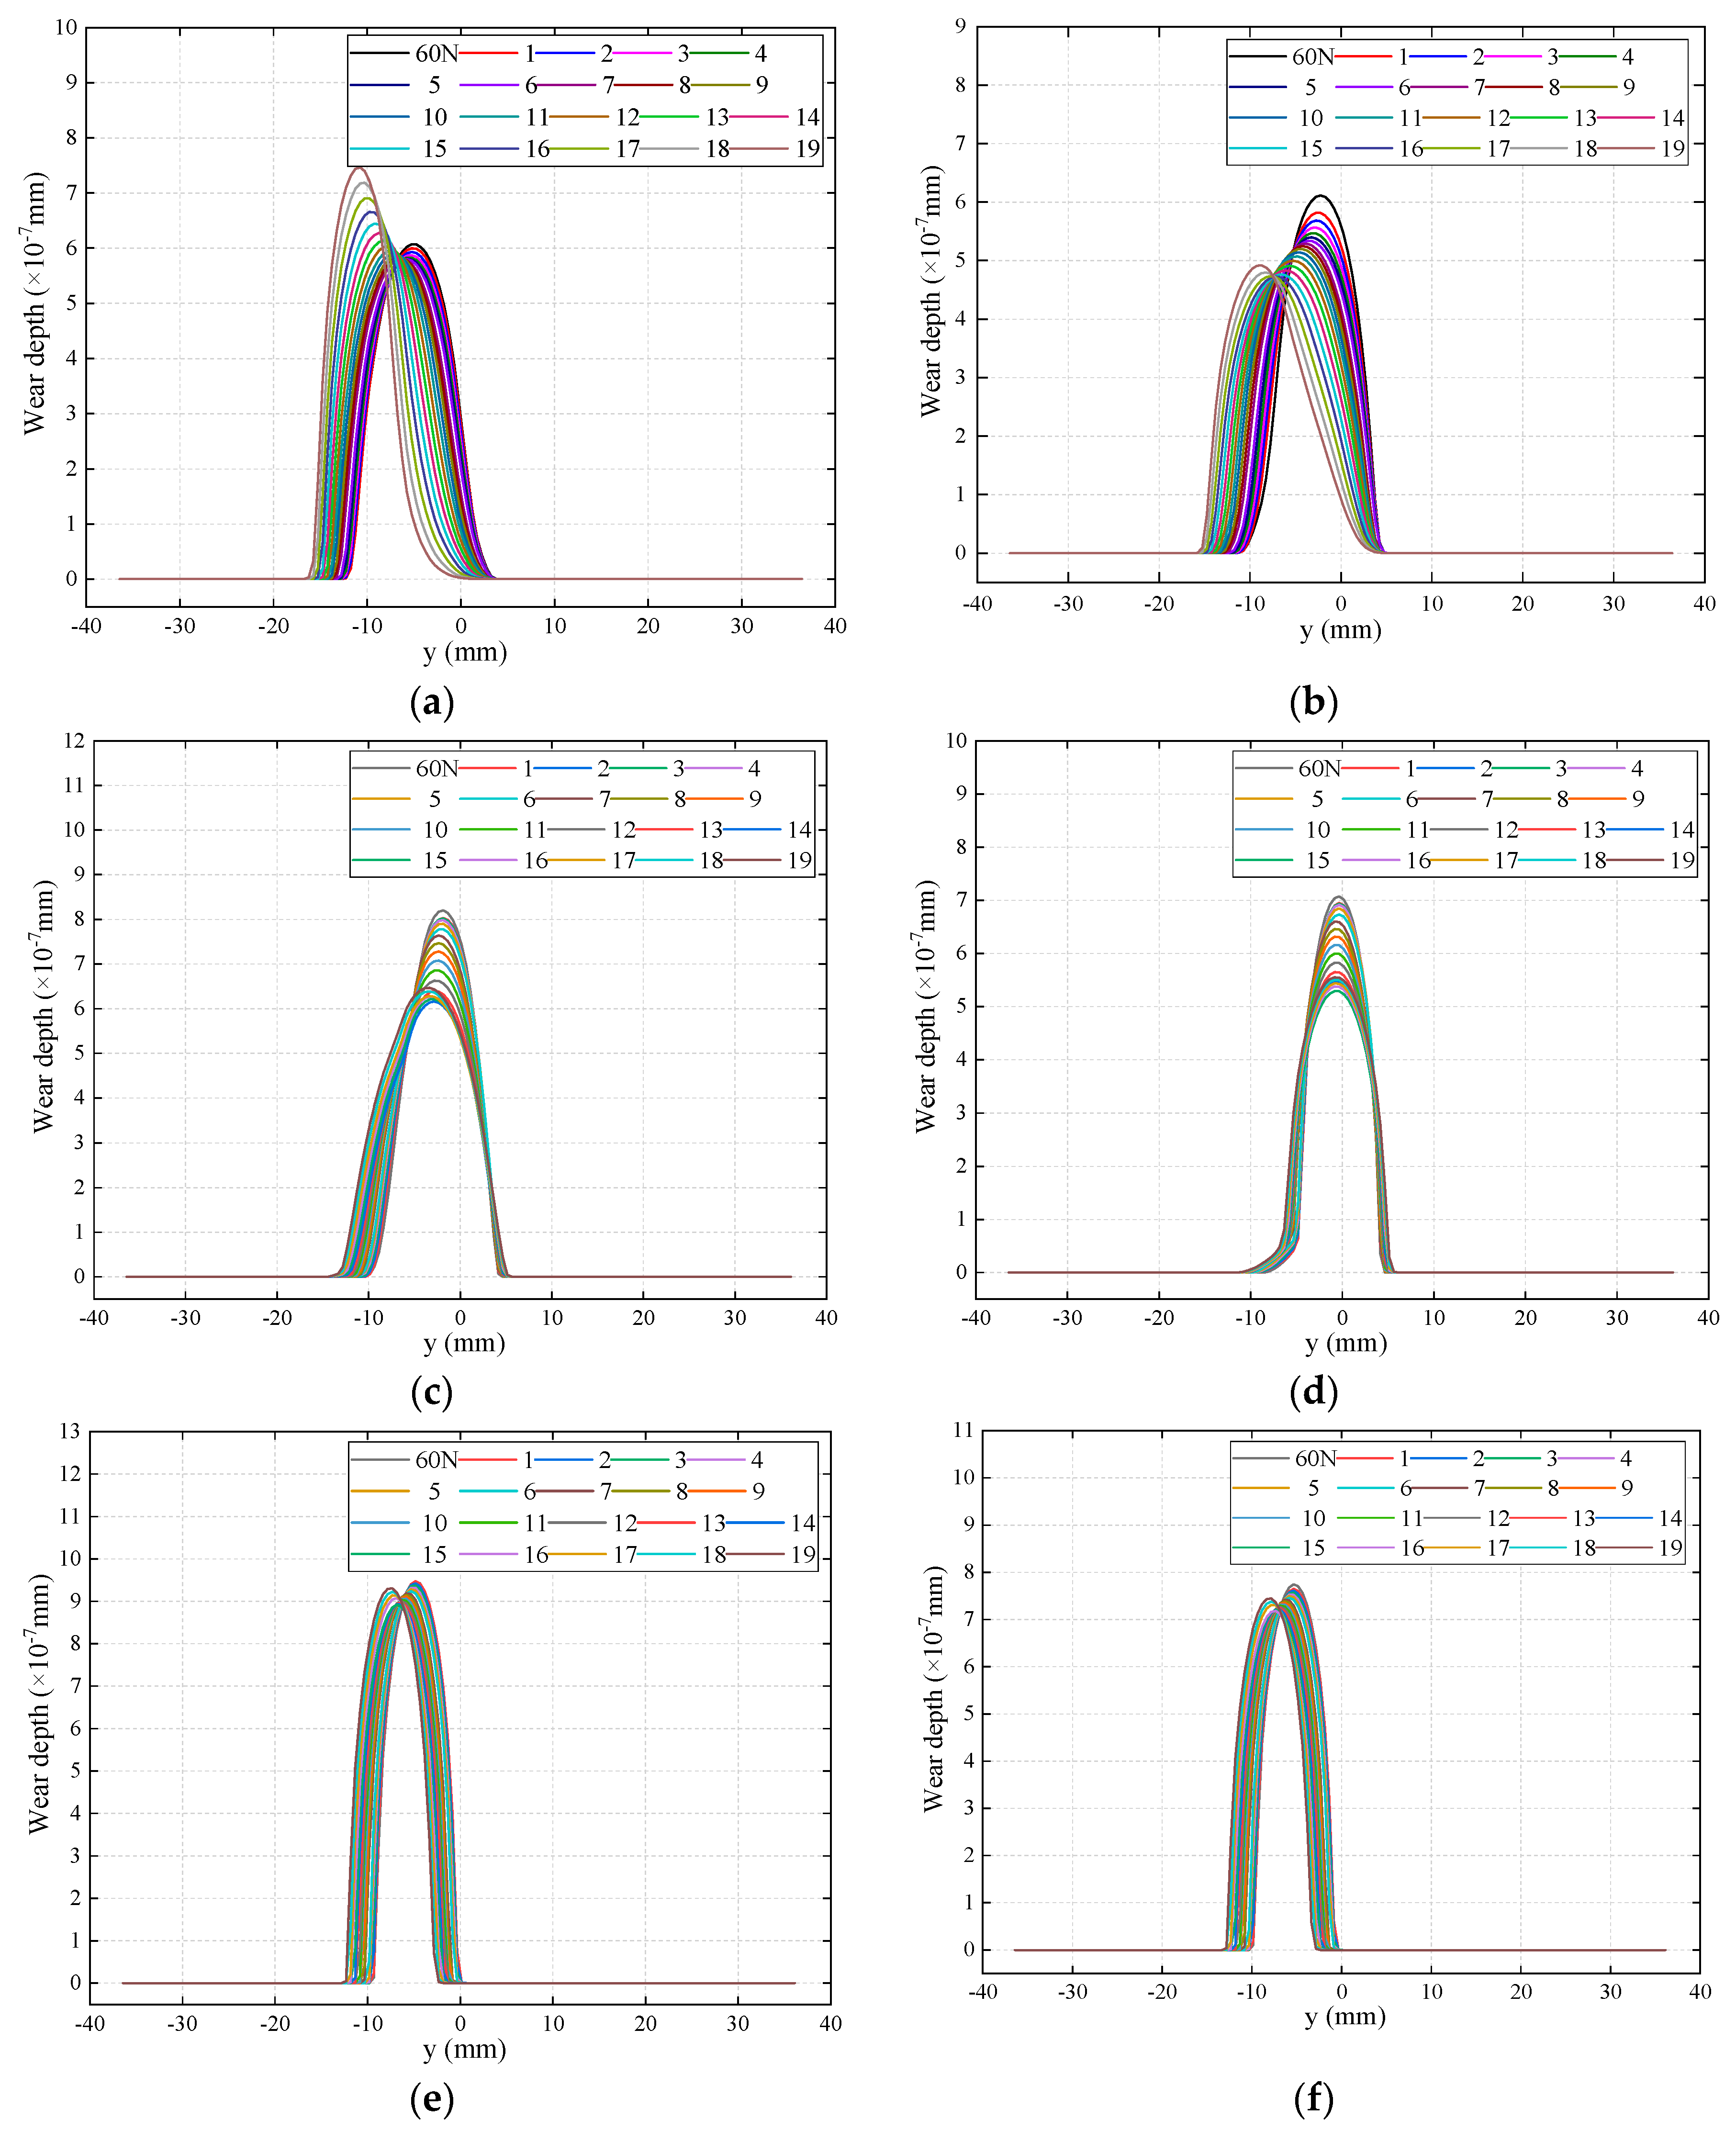
Figure 12.
The wear depth of (a) left rails of S1002CN, (b) right rails of S1002CN, (c) left rails of LMA, (d) right rails of LMA, (e) left rails of XP55, and (f) right rails of XP55.
Figure 12.
The wear depth of (a) left rails of S1002CN, (b) right rails of S1002CN, (c) left rails of LMA, (d) right rails of LMA, (e) left rails of XP55, and (f) right rails of XP55.
Figure 13.
The illustration of objective functions.
Figure 13.
The illustration of objective functions.
Figure 14.
The variation of fitness.
Figure 14.
The variation of fitness.
Figure 15.
The original and optimized profiles.
Figure 15.
The original and optimized profiles.
Figure 16.
The wear depth of (a) left wheels of S1002CN, (b) right wheels of S1002CN, (c) left wheels of LMA, (d) right wheels of LMA, (e) left wheels of XP55, and (f) right wheels of XP55. (The red, blue and grey lines refer to optimized profiles, the original profiles, and wheel profiles, respectively).
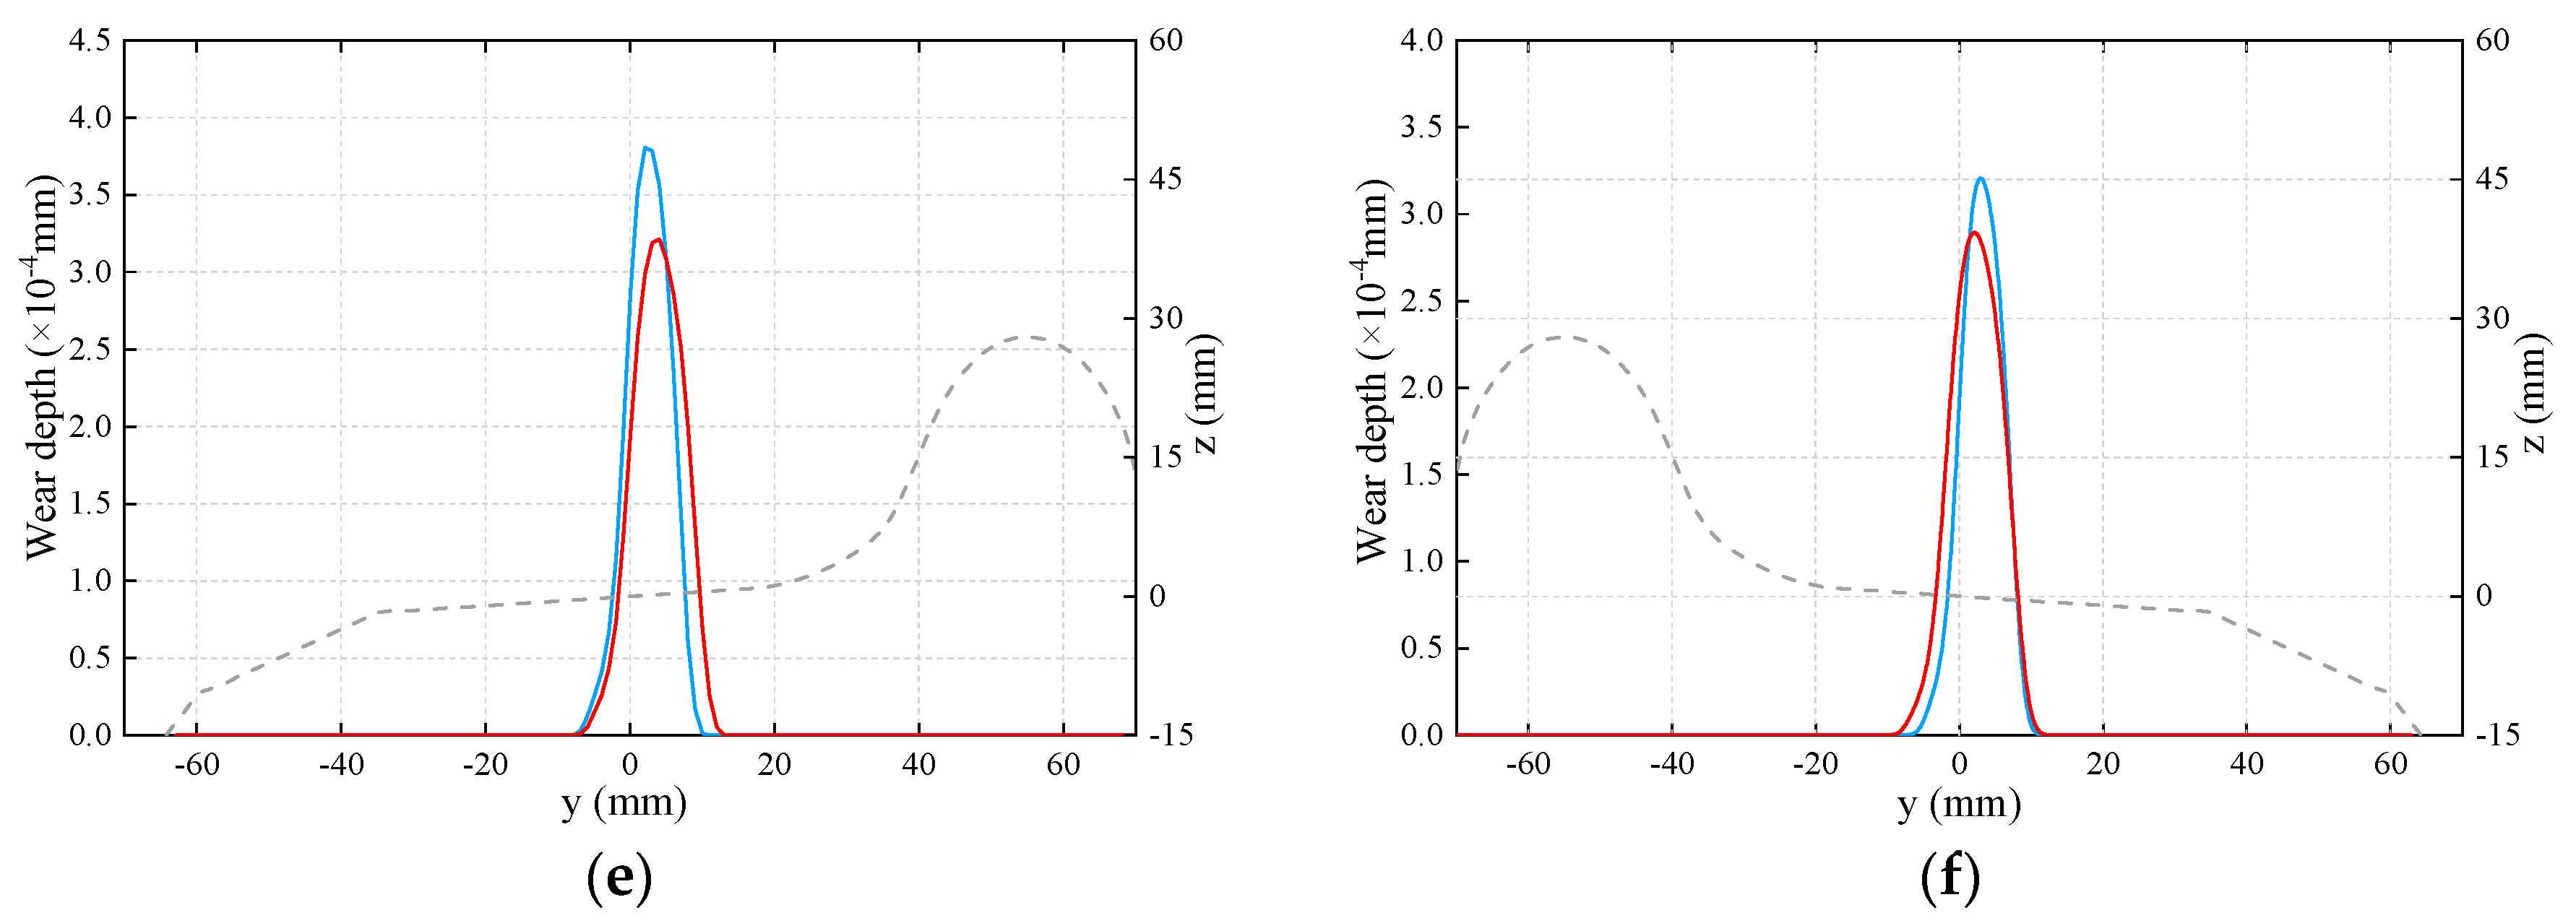
Figure 17.
The wear depth of (a) left rails of S1002CN, (b) right rails of S1002CN, (c) left rails of LMA, (d) right rails of LMA, (e) left rails of XP55, and (f) right rails of XP55. (The red, blue and purple lines refer to optimized profiles, the original profiles, and rail profiles, respectively).
Figure 18.
The evaluation indexes of dynamic performances (the red and blue bars refer to optimized profiles and the original profiles, respectively.) Note: (a–e) are peak values, and (f) is the average value. The values on the top of the purple dotted lines are the limiting values.
Figure 18.
The evaluation indexes of dynamic performances (the red and blue bars refer to optimized profiles and the original profiles, respectively.) Note: (a–e) are peak values, and (f) is the average value. The values on the top of the purple dotted lines are the limiting values.
Figure 19.
The statistical histograms of (a–f) vertical/lateral wheel–rail force, (g–i) derailment coefficient, and (j–l) wheel load reduction ratio of S1002CN, LMA, and XP55, respectively. (The red and blue bars refer to optimized profiles and the original profiles, respectively).
Figure 19.
The statistical histograms of (a–f) vertical/lateral wheel–rail force, (g–i) derailment coefficient, and (j–l) wheel load reduction ratio of S1002CN, LMA, and XP55, respectively. (The red and blue bars refer to optimized profiles and the original profiles, respectively).
Figure 20.
The time history curves of contact patch area of (a) S1002CN, (b) LMA, and (c) XP55 (the red and blue lines refer to optimized profiles and the original profiles, respectively).
Figure 20.
The time history curves of contact patch area of (a) S1002CN, (b) LMA, and (c) XP55 (the red and blue lines refer to optimized profiles and the original profiles, respectively).
Table 1.
The degrees of freedom of the vehicle model.
Table 1.
The degrees of freedom of the vehicle model.
| Rigid Body Name | Longitudinal | Lateral | Vertical | Roll | Pitch | Yaw |
|---|
| Car body | xc | yc | zc | φc | γc | Φc |
| Frame | xfi | yfi | zfi | φfi | γfi | Φfi |
| Axle box | None | None | None | None | γai | None |
| Wheelset | xwi | ywi | zwi | φwi | γwi | Φwi |
Table 2.
The parameters in dynamic simulations.
Table 2.
The parameters in dynamic simulations.
| Parameter | Value | Parameter | Value |
|---|
| Rail cant | 1/40 | Rail gauge (mm) | 1435 |
| Radius of curve (m) | 7000 | Superelevation (mm) | 150 |
| Length of transition curve (m) | 670 | Length of circular curve (m) | 2000 |
| Length of tangent section before curved section (m) | 1380 | Length of tangent section after curved section (m) | 280 |
| Running speed (km/h) | 300 | | |
Table 3.
The comparison of dynamic responses.
Table 3.
The comparison of dynamic responses.
| Evaluation Index | This Paper | Zhai [18] |
|---|
| Vertical wheel-rail force (kN) | 132.33 | 140.89 |
| Lateral wheel-rail force (kN) | 19.01 | 24.38 |
| Derailment coefficient | 0.21 | 0.29 |
Table 4.
The datasets adopted in the ANN model.
Table 4.
The datasets adopted in the ANN model.
| Datasets | Input Data (×–1 mm) | Output Data (×10−7 mm) |
|---|
| 1 | 1.292 | 0.633 | 0.257 | 0.088 | 0.010 | 0.010 | 0.088 | 0.257 | 0.633 | 1.292 | 13.8580 |
| 2 | 1.302 | 0.657 | 0.290 | 0.125 | 0.048 | 0.048 | 0.125 | 0.290 | 0.657 | 1.302 | 13.6690 |
| 3 | 1.312 | 0.682 | 0.323 | 0.162 | 0.087 | 0.087 | 0.162 | 0.323 | 0.682 | 1.312 | 13.6080 |
| 4 | 1.321 | 0.707 | 0.356 | 0.198 | 0.125 | 0.125 | 0.198 | 0.356 | 0.707 | 1.321 | 13.4005 |
| 5 | 1.331 | 0.731 | 0.389 | 0.235 | 0.163 | 0.163 | 0.235 | 0.389 | 0.731 | 1.331 | 13.2630 |
| 6 | 1.341 | 0.756 | 0.422 | 0.271 | 0.202 | 0.202 | 0.271 | 0.422 | 0.756 | 1.341 | 13.0758 |
| 7 | 1.351 | 0.780 | 0.455 | 0.308 | 0.240 | 0.240 | 0.308 | 0.455 | 0.780 | 1.351 | 13.0643 |
| 8 | 1.361 | 0.805 | 0.488 | 0.345 | 0.279 | 0.279 | 0.345 | 0.488 | 0.805 | 1.361 | 13.0418 |
| 9 | 1.371 | 0.829 | 0.520 | 0.381 | 0.317 | 0.317 | 0.381 | 0.520 | 0.829 | 1.371 | 12.9944 |
| 10 | 1.381 | 0.854 | 0.553 | 0.418 | 0.355 | 0.355 | 0.418 | 0.553 | 0.854 | 1.381 | 12.9913 |
| 11 | 1.391 | 0.878 | 0.586 | 0.455 | 0.394 | 0.394 | 0.455 | 0.586 | 0.878 | 1.391 | 12.9652 |
| 12 | 1.401 | 0.903 | 0.619 | 0.491 | 0.432 | 0.432 | 0.491 | 0.619 | 0.903 | 1.401 | 12.9441 |
| 13 | 1.411 | 0.928 | 0.652 | 0.528 | 0.471 | 0.471 | 0.528 | 0.652 | 0.928 | 1.411 | 12.9136 |
| 14 | 1.421 | 0.952 | 0.685 | 0.565 | 0.509 | 0.509 | 0.565 | 0.685 | 0.952 | 1.421 | 12.8299 |
| 15 | 1.431 | 0.977 | 0.718 | 0.601 | 0.547 | 0.547 | 0.601 | 0.718 | 0.977 | 1.431 | 12.7234 |
| 16 | 1.440 | 1.001 | 0.751 | 0.638 | 0.586 | 0.586 | 0.638 | 0.751 | 1.001 | 1.440 | 12.6435 |
| 17 | 1.450 | 1.026 | 0.784 | 0.675 | 0.624 | 0.624 | 0.675 | 0.784 | 1.026 | 1.450 | 12.6669 |
| 18 | 1.460 | 1.050 | 0.817 | 0.711 | 0.663 | 0.663 | 0.711 | 0.817 | 1.050 | 1.460 | 12.6900 |
| 19 | 1.470 | 1.075 | 0.849 | 0.748 | 0.701 | 0.701 | 0.748 | 0.849 | 1.075 | 1.470 | 12.9405 |
| 20 | 1.480 | 1.099 | 0.882 | 0.785 | 0.739 | 0.739 | 0.785 | 0.882 | 1.099 | 1.480 | 13.3525 |
Table 5.
The relative errors based on testing data.
Table 5.
The relative errors based on testing data.
| Number of Rail Profiles | Prediction Result (×10−7 mm) | Target Value (×10−7 mm) | Relative Error ξ (%) |
|---|
| 16 | 12.6435 | 10.5575 | 0.9141 |
| 3 | 13.6080 | 9.7627 | −2.2523 |
| 15 | 12.7234 | 10.3132 | −0.5516 |
Table 6.
The comparisons of evaluation indexes.
Table 6.
The comparisons of evaluation indexes.
| Evaluation Index | S1002CN | LMA | XP55 | Cui et al. [36] |
|---|
| Increment of the area of contact | 29.59% | 33.00% | 25.08% | 16.11% |
| Decrease of the maximum contact pressure | 28.06% | 33.65% | 26.21% | 23.50% |


