Article

Experience and Acceptance of Autonomous Shuttles in the Brussels Capital Region

Research Centre MOBI—Mobility, Logistics and Automotive Technology, Vrije Universiteit Brussel, Pleinlaan 2, Elsene, 1050 Brussels, Belgium
*
Author to whom correspondence should be addressed.
These authors contributed equally to this work.
Sustainability 2020, 12(20), 8403; https://doi.org/10.3390/su12208403
Submission received: 22 July 2020 / Revised: 11 September 2020 / Accepted: 30 September 2020 / Published: 13 October 2020

Abstract

:
Current technological developments allow the testing of shared autonomous electric vehicles in real-life conditions. Consequently, we can evaluate how users react and if these developments might lead to more sustainable transport behaviour in the future. The purpose of this study was to capture public opinion regarding autonomous vehicles in terms of user experience and intended future use. Autonomous shuttles were operated in the Brussels Capital Region in a mixed traffic situation, allowing interaction with other road users. We compared the results of two pilots with different target groups in the same city. Public opinion was captured through an online survey after passengers had experienced a ride. Our results showed that more than 70% of the passengers expressed no concerns with regards to autonomous vehicles. The majority had a positive experience with the shuttle and evaluated the shuttle positively in terms of driving behaviour, entry and exit and comfort. The regression analysis indicated that enjoyment of the ride is an important factor that contributes to the intention to use autonomous shuttles in the future.

1. Introduction

Cities are facing challenges in terms of urban transportation problems related to congestion, the scarcity of open space, infrastructure for active travel modes, availability of parking, air pollution, noise, cost of travel, energy consumption, accidents and the accessibility of public transport services [1,2,3,4]. Similarly, the Brussels Capital Region struggles with urban transportation problems. Average congestion levels are high, especially during peak hours [5,6], causing longer average travel times. According to TomTom’s Traffic Index (see https://www.tomtom.com/en_gb/traffic-index/) the average congestion level in Brussels was 38% in 2019. This means that 11.4 min of extra average travel time are needed for a 30 min trip compared to uncongested conditions. In areas where road and public transport infrastructure allow high levels of accessibility, higher levels of air pollution are found [7]. Regional parking plans aim to discourage the use of personal cars so that the quality of public space can be improved. However, in residential neighbourhoods, where personal cars remain parked on the street and where commercial activities attract visitors, a saturation of available parking space occurs [8].
The underlying cause of urban transportation problems is the heavy use of personal cars for daily trips [8,9]. However, it has been argued that autonomous vehicles (AV) in the form of shared transport services (e.g. car sharing and ride-sharing) can form a viable alternative to the personal car [10]. If the user uptake of shared AVs is high, they can have a substantial impact on traffic related to personal mobility in cities [11,12]. Reductions in fleet size requirements have been reported to vary between 43% and 97%, while total vehicle kilometres travelled could increase or decrease, depending on the type of service (car sharing, ride-sharing), the user uptake of services and the presence of mass public transit services [13,14,15].
One specific service application of shared AVs is to form a first/last mile connection with a mass public transit hub. In the current paper, we refer to this type of service as an autonomous shuttle service. This type of integrated and on-demand service can reduce traffic in urbanised areas and lower travel costs for its users, thanks to shared costs per trip and the optimised deployment of vehicles [16,17]. Assuming that the shared-AV fleet consists of electric vehicles, such services can also cause a substantial drop in CO2 emissions [16]. Ultimately, improved access to the public transport network can reduce private car dependency in suburban areas [18].
Autonomous shuttles (AS) are increasingly being deployed and tested in a variety of cities around the world. The Union Internationale des Transports Publics (UITP) pinpoints pilot sites of shared autonomous use cases on an interactive map (see https://space.uitp.org/initiatives). A great deal can be learned from field research in which passengers and other road users experience an autonomous shuttle. The main research purpose of the pilot projects is often capturing user attitudes and willingness to use future autonomous services [19,20,21,22,23,24,25,26,27]. The present study aimed to investigate citizens’ intention to use autonomous vehicles in the Brussels Capital Region. Therefore, data were gathered from two separate pilot sites with the same data collection tool. The goal was to place the findings in the wider context of the user acceptance of autonomous shuttles and to compare the findings to other (European) pilot sites.
This article is structured as follows. We first describe the theoretical models that capture the behavioural intention to use new technology and review previous autonomous shuttle pilot findings. In Section 3, we discuss the methodology concerning the pilots, the respondents and the questionnaires. In Section 4, we compare the results for both pilot sites in a descriptive manner and investigate the results of correlation analysis and regression analysis. Next, in Section 5, we discuss the results from the perspective of previous findings. Lastly, suggestions are formulated for future user acceptance studies of autonomous shuttles, and managerial and policy advice is proposed for shuttle operators and city authorities. Section 6 presents the conclusion of this work.

2. Literature Review

In this section, we first describe the theoretical models that capture the behavioural intention to use new technology. Secondly, we review the findings of previous pilot studies with autonomous shuttles and focus in particular on the technology acceptance model and related results.

2.1. Theoretical Framework: Technology Acceptance Models

The Theory of Reasoned Action (TRA), developed by Fishbein and Ajzen [28], is a theoretical model that explains the intended behaviour of an action based on the attitude towards the intended behaviour and subjective norms, or social pressures from others to behave in a certain way.
In 1986, Davis introduced the Technology Acceptance Model (TAM), which is an adaptation of TRA [29]. TAM models the behavioural intention to use information systems, which in turn determines actual system use [30]. It posits that two main personal beliefs can predict the intention to use a new computer system, namely perceived usefulness and perceived ease of use, and that the relationships of the model are linear. Perceived usefulness is defined as the extent to which a person believes that the new information system will benefit their performance. Perceived ease of use refers to the degree to which a person expects that they can easily master the use of the information system [29,30].
In 2003, Venkatesh, Morris, Davis and Davis [31] presented the Unified Theory of Acceptance and Use of Technology (UTAUT) for the prediction of the intention to use and actual use of technology in an organisational context. Based on TAM and seven other previous models or theories on technology use, the UTAUT model consists of four main predictors [32]. Performance expectancy, similar to perceived usefulness, reflects the degree to which a user believes that the technology will benefit their activities; effort expectancy, as with perceived ease of use, refers to the expected degree of ease when using the technology; social influence represents the extent to which a user thinks that other important parties believe they should use the technology; and facilitating conditions are linked to a user’s perception of available resources and support [32]. The model states that performance expectancy, effort expectancy and social influence can predict the behavioral intention to use a technology while facilitating conditions influence actual use [32].
Venkatesh, Thong and Xu further extended the UTAUT model to UTAUT2—a model that can be applied outside the context of information systems use in organisations [32]. Alongside the four main factors of the first UTAUT model, the second UTAUT model includes three more predictors of behavioural usage intention. Hedonic motivation captures the fun or pleasure derived from using technology, price value is linked to the tradeoff between the user’s perceived benefits of the application and the monetary cost of use, and habit labels automatically performed behaviour [32].

2.2. Previous Pilot Studies

In the last five years, increasing numbers of pilot projects are being deployed throughout Europe and the rest of the world. In this section, an overview is given of shuttle pilots with a specific research focus on user experience and acceptance.
One of the first European pilots that tested the operation of autonomous shuttles in real traffic conditions took place in Trikala, Greece [25]. The results from their passenger survey showed that most respondents rated the usefulness, the comfort of the vehicle, the availability of information and the acceleration and deceleration of the vehicle as “good” to “very good” [25]. Furthermore, the majority of passengers were also positive about the service quality (in terms of waiting time and on-board time), the integration of the service with other modes of transport and the frequency of unexpected stops. Next, passengers were asked to rate the perceived feeling of safety and security on board of the shuttle compared to a regular bus. Most passengers felt equally safe or safer on board the shuttle (in terms of the risk of being involved in an accident with a pedestrian or another vehicle). The majority of respondents believed that autonomous shuttles (AS) are equally or less secure in terms of the risk of attacks and the ability to handle emergencies.
Similarly, Rehrl and Zankl [33] tested the operation of a first/last mile connection with public transport using an autonomous shuttle in a rural area (municipality of Kopple, Austria). Feedback from the passengers of the shuttle was gathered using an online survey immediately after the test ride. The study reported that passengers had considerable previous knowledge about autonomous technology and even some experience with autonomous shuttles. The main expected purposes of shuttle use were commuting and other daily trips. In total, 90% of the passengers indicated that they had enjoyed the experience and felt safe during the ride, although 59% of passengers would not be willing to replace their privately owned first or second vehicle with the use of an autonomous shuttle. Additionally, the authors highlighted some of the passengers’ responses in the form of statements, indicating that dislike or feeling unsafe was linked to the abrupt braking of the vehicle, and respondents’ high sense of safety could be due to the safety operator on board of the vehicle.
The CityMobil2 project included several demonstrations with autonomous shuttles in different European cities. During three of these demonstrations, survey data were gathered using items adapted from the UTAUT model to help understand the predictors of intended use after passengers experienced a ride in an automated shuttle. Results from regression analysis showed that the enjoyment of using the shuttle and the performance of the transport system are the two main factors that influence travellers’ intention to use an autonomous shuttle service. To a lesser extent, having the necessary knowledge and resources to use the service and the opinion of others also positively affected passengers’ acceptance of the service [21,22].
A similar acceptance study was performed in an office campus in Berlin, Germany [23]. Results from the correlation analysis indicated a significant positive relationship between the quality of the service and intention to use it, and also between the performance of the system and intention to use it [23]. The study also reported on the post-test measurements of attitudes towards the shuttle itself. The results showed that the respondents were generally very positive towards the in-vehicular aspects of the shuttle, such as its comfort and its design and the ease of boarding the vehicle, but less positive about its speed. Similar to the Greek study, the German respondents agreed that their experience in an autonomous shuttle was enjoyable and considered it useful. However, when asked to compare the use of the shuttle to their current mode of transport, respondents were not convinced that the shuttle would be faster, more efficient or easier to use. Additionally, the study focused on travellers’ opinions on the potential of autonomous shuttles as feeders to public transport and assessed their perceptions of the service. The study found that passengers would be willing to use autonomous shuttle transport as a connection between a train station or another transport hub and their destination, both in urban and rural areas. The majority of respondents agreed that the service should at least be under remote human supervision, and a third of respondents preferred an on-board operator.
Similar conclusions were reached in a different German acceptance study that surveyed visitors who experienced a ride in an autonomous shuttle on a hospital campus in Berlin. Although the acceptance model was not built on general technology acceptance theory, the results showed that passengers indicated high ratings for their intention to use the vehicle in the future, expressed acceptance and trust in the vehicle and perceived it as safe [26]. Using hierarchical multiple regression analysis, the study showed that acceptance, linked to the usefulness or satisfaction with the shuttle, is the strongest predictor of usage intention, followed by perceived safety and age [27].
Moták et al. [34] extended the Technology Acceptance Model (TAM) and the Theory of Planned Behaviour (TPB) to predict the intention to use autonomous shuttles. They tested the predictability of the model through survey-based field research with participants that experienced a ride in an autonomous shuttle on a French hospital campus. The study reported that the TAM and TPB constructs explained the majority (43%) of the variance in behavioural intention, with perceived usefulness being the strongest predictor. The constructs of the group norm (social influence), positive affective attitudes (pleasurable experience) and experience of a ride in an autonomous shuttle accounted for an additional 12% of explained variance of usage intention.
Similarly, Herrenkind et al. [35] used a TAM-based model with extensions to assess user acceptance of autonomous shuttles in a smaller German city. The study surveyed respondents after they experienced a ride on an autonomous shuttle on public roads. Results showed that a positive attitude towards using autonomous shuttles is the strongest predictor of usage intention, and perceived usefulness and perceived ease of use have a significant positive effect on attitude formation. Additionally, a person’s trust in technology and social influences can increase their acceptance of autonomous shuttles. Lastly, system characteristics also play an important role. Perceived enjoyment of the ride positively affects people’s intention to use autonomous shuttles by enhancing their relative advantages (such as ease of use) compared to other modes of transport.
TAM-based survey research has also been conducted for the scooter-dominated culture of Taiwan [19]. The data were collected after respondents experienced a ride on an autonomous shuttle in restricted mixed traffic. The trajectory connected two light rail stations and passed alongside a business park in the city of Kaohsiung. In addition to the TAM constructs, trust and perceived enjoyment were included in the model. The model explained 52.3% of the variance of usage intention. In contrast to Herrenkind et al. [35], perceived usefulness was the strongest predictor of usage intention, followed by attitude and perceived enjoyment. Trust was not found to affect intention significantly. Perceived ease of use and perceived usefulness positively affected attitudes, with perceived ease of use being a stronger predictor. Additionally, attitude was also positively affected by trust and perceived enjoyment. Furthermore, the study reported that respondents showed high satisfaction ratings on the shuttle aspects of safety, comfort, speed and clarity of information.
In conclusion, we find that technology acceptance models have formed the basis of behavioural intention models in previous acceptance studies on autonomous shuttles. The variables of effort expectancy (or perceived ease of use), performance expectancy (or perceived usefulness) and hedonic motivation (or perceived enjoyment) have been found to positively affect the intention to use autonomous shuttles. These studies confirm that UTAUT-based constructs are important factors that can determine the intention to use autonomous shuttles together with additional latent variables, such as perceived safety and advantages that come with the shuttle characteristics.

3. Methodology

In 2019, two autonomous shuttle pilot projects were launched in the Brussels Capital Region, with the objective of understanding the operation of autonomous shuttles and gaining insights into user perspectives. This paper discusses the insights gathered from the user’s surveys conducted within these projects, which took place at two different locations, each operating a trajectory in a controlled setting.
In this section, we first discuss the selection of the pilot sites. Next, in Section 3.2, we address the sample selection. In Section 3.3, we discuss the survey design and administration. Lastly, in Section 3.4, we explain the data analysis design.

3.1. Selection of the Pilot Sites

The first project was coordinated by the local public transport operator STIB. The Société des Transports Intercommunaux de Bruxelles (STIB) provides public transport services in the Brussels Capital Region and its periphery. It operates a metro, tram and bus network (see https://www.stib-mivb.be/). Two shuttles covered a trajectory of 1.5 km following a fixed-route in a park with five station-based stops in the municipality of Sint-Pieters-Woluwe (see Figure 1). The park site allowed for interaction with pedestrians and cyclists. The shuttles operated on Fridays and during the weekends from the end of June until the end of September 2019.
In the second project, the trajectory connected student dormitories to the auditoriums of the Brussels Health Campus in the municipality of Jette. The trajectory was situated on private terrain with a mixed traffic situation. One shuttle covered a trajectory of 350 m and operated on weekdays from August until the end of October 2019 (see Figure 2). This project was coordinated by the research group MOBI (VUB) and carried out together with the research groups SMIT (VUB) and Louise (ULB).
In both projects, the pilot tests were performed with Easy Mile EZ10 shuttles. The shuttles have a capacity of 8–12 passengers and operate at a speed of 10–15 km/h. A safety operator was on board at all times.

3.2. Sample Selection

In Woluwe, all visitors of the park were invited to take a ride in the shuttle, and passengers were invited to take part in the survey. The target population for the study were inhabitants of the Brussels Capital Region. A total of 5293 visitors took a ride in the shuttle, and 443 respondents took part in the survey. Filtering out the incomplete surveys, the sample consisted of a total of 384 passengers. On the Brussels Health Campus, the target users were mainly students, but also staff and visitors of the university or hospital. Data on user perspectives were collected from both passengers of the shuttle after their experience and from other road users. Over the duration of the first phase, 549 passengers and 251 respondents were counted. Leaving out the incomplete surveys, a total of 145 passengers and 75 other road users completed the survey. For both sites, the sampling strategy was a convenience sample.

3.3. Survey Design and Administration

As discussed in the literature review, the constructs of effort expectancy, performance expectancy and hedonic motivation have been found to positively affect the intention to use autonomous shuttles. In line with previous research, we expect that these constructs have a significant positive relationship with behavioural intention to use autonomous shuttles. Table 1 contains the definitions of these constructs in the context of our study. Additionally, we believe that passengers’ general experience of a ride in an autonomous shuttle contributes to their intention to use the shuttles. Lastly, the intention to use autonomous shuttles as part of the public transport services can be linked to the personal beliefs and mobility habits of the public. Therefore, we take into account these three main determinants in the survey design of this study.
An online survey tool (using the Qualtrics experience management software) was designed that allowed for the swift administration of the questionnaire in a real-world setting and that took a limited time to complete. In line with Madigan et al. [22], the items of the questionnaire were drafted based on the UTAUT2 model. Table 2 lists the items that were included in the model. Additionally, items related to vehicle characteristics were included based on Nordhoff et al. [23], and respondents were also asked to complete socio-demographic questions and questions related to their current mobility habits and preferences. Lastly, if desired, the survey allowed the respondents to textually express their perceptions about the pilot test, the vehicle’s characteristics and any worries they might have concerning autonomous vehicles.
The same questionnaire items were used in each of the pilots. All items were measured on a seven-point Likert scale. The questionnaire used at the Woluwe site included an item related to the involvement of the local public transport operator in the testing of autonomous shuttles. The questionnaire used at Brussels Health Campus also included a set of questions related to the perception of other road users (non-passengers) towards the shuttle and their feelings of safety on the campus. The insights from this part of the study can be consulted in [36].
The contribution of this study lies, on the one hand, in its testing of the explanatory effect of the constructs for shuttle use and, on the other hand, in its assessment of the value of additional constructs linked to the experience of the shuttle and personal mobility habits and beliefs.

3.4. Data Analysis Design

For comparison purposes, we will analyse the survey data from the two pilot sites separately. First, we will provide the socio-demographic representation of the two samples. Next, we will present the descriptive results from the passengers’ shuttle ratings, their experience ratings of shuttle use and their intended use. Additionally, we focus on the respondents’ personal beliefs regarding the expectations of future car necessity and their environmental concerns. After that, the correlations of the independent variables with the dependent variable—behavioural intention to use autonomous shuttles—are presented. Finally, we analyse the relationships between usage intention and a subset of independent variables using hierarchical multiple regression analysis.
The purpose of using hierarchical regression analysis in our study is twofold: first, we want to test if the selected UTAUT-based items are significant predictors for the behavioural intention to use autonomous shuttles; second, by adding variables that are pertinent to the context of the study, we want to assess possible moderating effects and compare the variance explained by each model. In line with previous research, we believe that the UTAUT-based items will be the strongest predictors of the intention to use autonomous shuttles. Furthermore, we expect that the demographic factors of gender and age will not have a significant effect on the model. However, as suggested by Madigan et al. [22], we want to test whether education significantly impacts usage intention, seeing as “first/last mile solutions are likely to be targeted at marginalised groups who are not catered for by current public transport provisions”. Additionally, we want to test whether the rating of the experience with the shuttle and personal mobility-related beliefs can add to the predictive power of the linear equation for behavioural usage intention. To test this, we will add variables to the regression model in four steps: (1) the predictor variables effort expectancy, performance expectancy and hedonic motivation; (2) the moderating factors age, gender and degree; (3) the general experience with the shuttle; and (4) the items related to the expectations of future car necessity and environmental concerns.

4. Results

We first present the findings based on the descriptive statistics of the sample. In Section 4.1, we will zoom in on the socio-demographic characteristics of the respondents and their opinions on the shuttle aspects. Furthermore, passenger views on the usefulness of the shuttle testing are discussed, as well as worries about autonomous vehicles. In the next section, we focus on the passengers’ experience and expectation of shuttle use. In Section 4.3, opinions regarding the necessity of cars are studied, and we consider environmental awareness and usage expectation. Lastly, in Section 4.4, the findings of the correlation analysis are described, and hierarchical multiple regression analysis results are presented.

4.1. Passenger and Shuttle Characteristics

In Woluwe park, the final sample of the study included 384 respondents, 47.92% of whom were male. The respondents were aged between 17 and 91, with a mean age of 44.27 years. Regarding their occupation, 70.31% of the respondents were working or currently unemployed, 16.93% were retired and 12.76% were students. Furthermore, for 64.84% of the respondents, the highest obtained degree was a university or college degree.
At the Brussels Health Campus, a total of 145 respondents completed the survey for shuttle passengers, 42.76% of which were male. As the trajectory was situated on a university campus, 73.10% of the respondents were students and 68.97% were below the age of 25. For 40% of the respondents, the highest obtained degree was a university or college degree, while for 44% of the respondents, the highest obtained degree was a high school degree. In both samples, the majority of the respondents indicated that their main mode of transport in the Brussels capital region was public transport; a third used a car or motorcycle and a few travelled by bicycle or on foot. The main characteristics of the two samples are listed in Table 3.
After indicating their main mode of transport, respondents were asked to select reasons for using that mode. The options were “price (cheaper)”, “no traffic”, “better for the environment”, “less stressful”, “faster”, “comfort” and “I have no alternative”. In the Woluwe sample, 83 respondents selected “better for the environment” as one of the reasons for their choice of transport mode. At the Brussels Health Campus, 50 respondents selected the “better for the environment” option.
At both sites, the respondents were asked to rate their experience on a seven-point Likert scale with the shuttle in terms of several aspects: comfort of the vehicle, ease of getting in and out of the vehicle, the driving behaviour of the vehicle and the experience in general. As can be seen in Figure 3, respondents generally rated these aspects positively. The general experience reached an average score of 6.1 for the Woluwe site and 6.0 for the Health Campus, indicating that respondents felt that they had a good experience with the shuttle. Respondents found it easy to board and exit the vehicle, with average ratings of 6.4 for Woluwe and 6.3 for the Health Campus. The driving behaviour of the shuttle was also positively rated by the respondents, with average scores of 6.5 for Woluwe and 5.8 for the Health Campus. The slightly dispersed ratings between both sites might be due to the difference of the traffic situation in each of the sites. At the Health Campus, the shuttle drove by parked cars and interacted with other motor vehicles. In Woluwe Park, only soft transport modes interacted with the vehicle along its trajectory. Lastly, most respondents appreciated the comfort of the shuttle, with average scores of 5.8 for Woluwe and 6.0 for the Brussels Health Campus. The respondents’ comments indicated that the negative ratings regarding the comfort of the vehicle could be linked to the discomfort of the seating in the shuttle. Several respondents remarked that they did not appreciate the “hard wooden seating”, which is “not suitable for long travel”.
The respondents also evaluated the availability and professionalism of the accompanying personnel, as there was a safety operator on board at all times. Figure 4 shows that the opinions were very positive, with ratings mostly ranging from “good” to “very good”. In the Woluwe park, over 96% of the passengers rated the availability and professionalism of the accompanying personnel as “good” or “very good”. At the Brussels Health Campus, the satisfaction with the on-board personnel was even more pronounced, with over 62% of the respondents rating availability and professionalism as “very good”. This indicates that the service of the operator in the autonomous vehicles is much appreciated. Additionally, in the open comment section of the survey, respondents often pointed out that they particularly appreciated the on-board personnel and their knowledge of the technology. Additionally, some respondents pointed out that they appreciated the available information about the shuttle and the technology that was available at the stops.
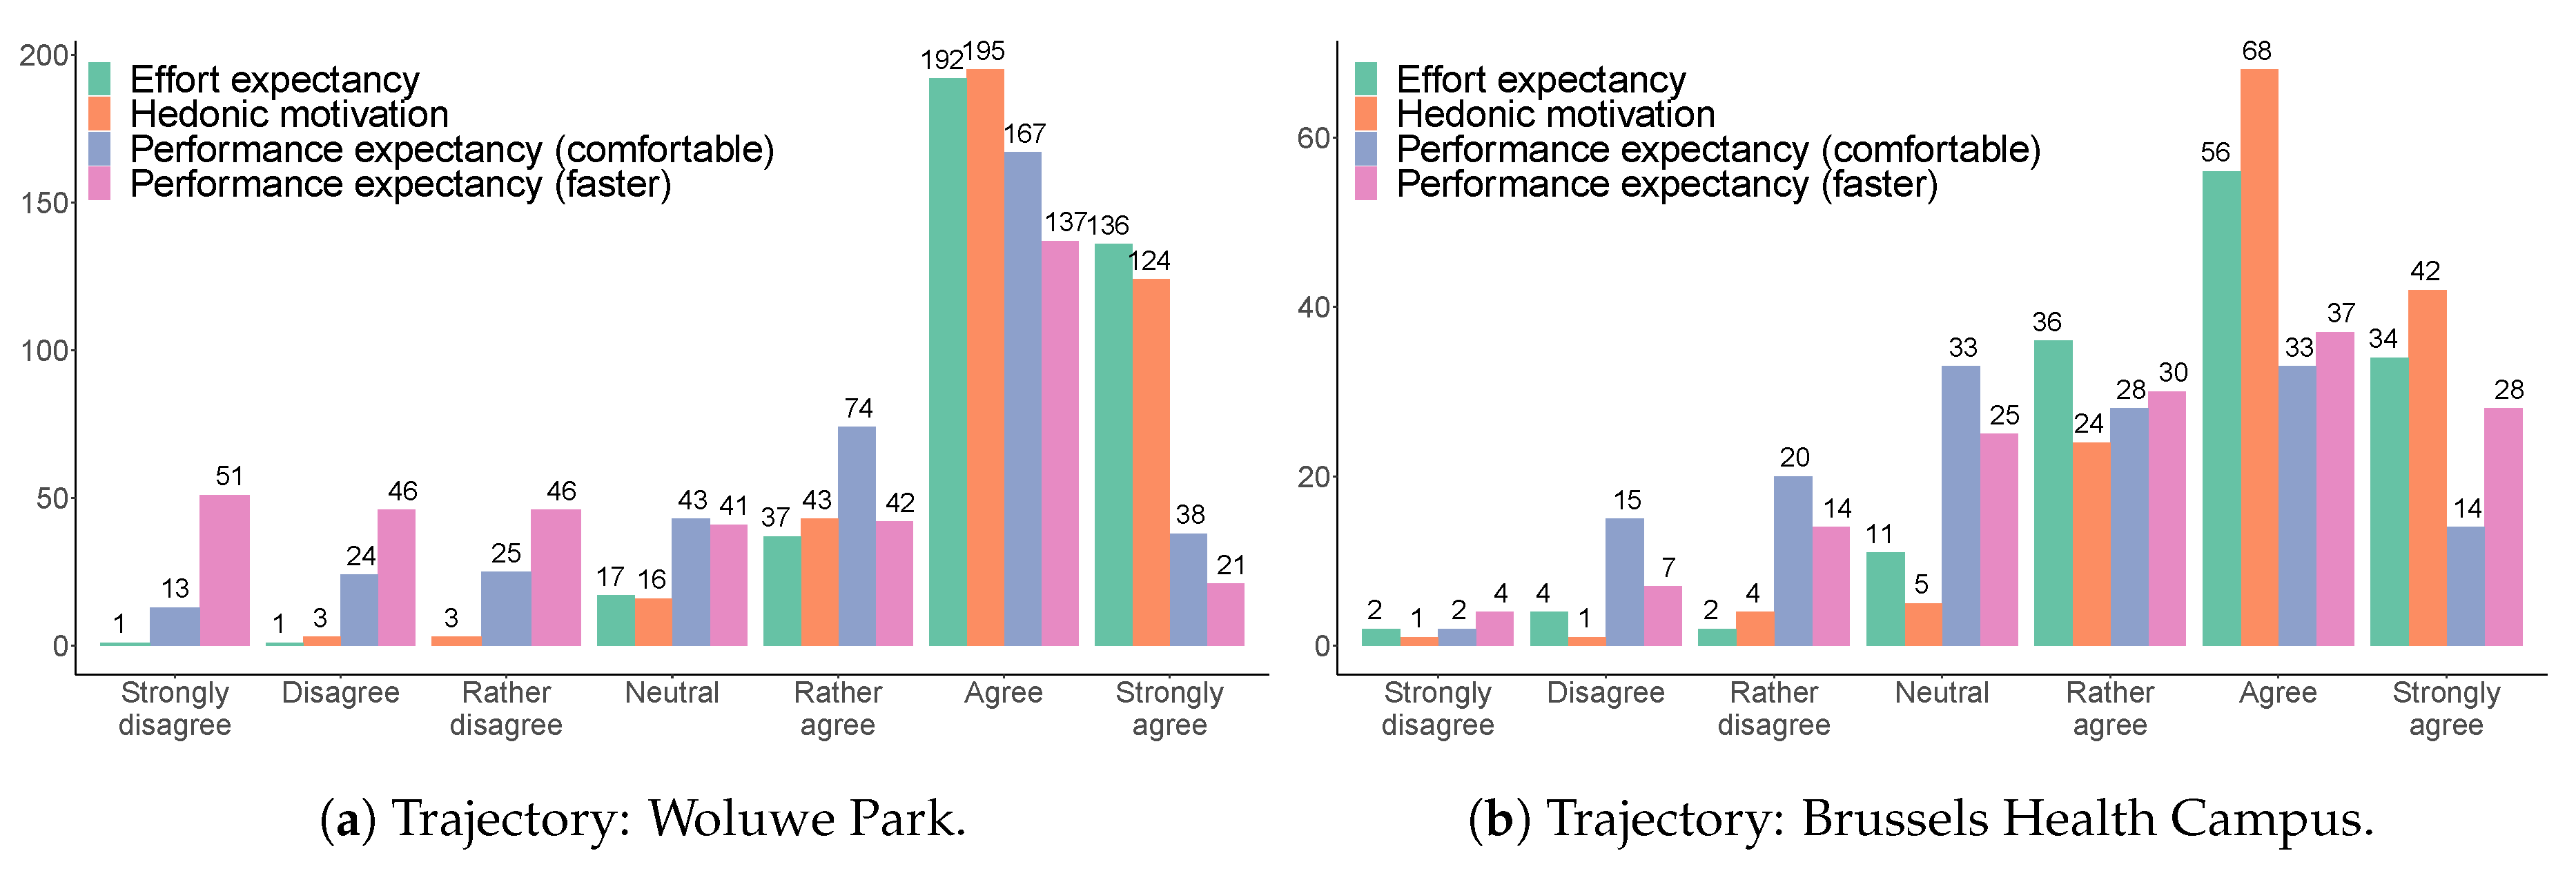
At both sites, respondents were asked to rate three statements concerning the usefulness of shuttle testing (see Figure 5). Passengers agreed that testing autonomous shuttles at their respective sites is useful and does not bother them. At the Woluwe site, 194 passengers agreed that the test corresponded to their needs, while at the Brussels Health Campus, 66 respondents found themselves in a neutral position towards the statement.
Additionally, respondents were asked to indicate their agreement with two statements linking the image of the public transport operator or the Brussels Health Campus to the respective pilot tests. Passengers from the Brussels Health Campus found that testing autonomous vehicle technology on the campus fit the image of the campus and gave a positive image to the campus. Similarly, passengers from the Woluwe Park agreed that the autonomous shuttle test fit the image of the public transport operator and gave it a positive image (see Figure 6).
At Woluwe Park, respondents were asked about the responsibility of the public transport operator to test new mobility solutions and technology. A majority—284 respondents—stated that they believe that this is the role of the public transport operator. Figure 7 shows the respondents’ ratings to the negative formulation of the statement.
In the final section of the survey on the experience and expectations of autonomous shuttles, respondents were asked whether they had any worries with regard to autonomous vehicles. To this question, 75% of the Woluwe respondents and 70% of the Health Campus respondents answered “no”. If respondents answered “yes”, they were invited to comment on the kinds of worries they had. Their comments showed that the most frequent concerns were related to emergencies (danger, accident, obstacle), technical or technological failures of the vehicle and its behaviour in a regular traffic situation (“How would it react in dense traffic situations”, “There are always concerns in normal traffic situations for the pedestrians”, “In this setting no, elsewhere yes”, “Reaction towards other vehicles” and “On the road”). Respondents also expressed frequent concerns about the function of the vehicle in everyday life (“How would they be integrated in everyday life”, “Where to put them IRL (in real life)” and “What place does it have in the real circulation”), the loss of driver jobs and the risk of external misuse of the intelligent driving system (“What if it is hacked and misused” and “Risk of being boycotted”). To a lesser extent, respondents worried about the operation of the vehicle in poor weather conditions (such as rain and snow) and the possibility of acting as a replacement for active modes of transport. Lastly, a respondent commented, “I would be unable to board without on-board personnel”. Although a button on the outside of the vehicle is used to activate the wheelchair ramp, the design of the surrounding infrastructure and stops must permit the use of the ramp.
Regardless of expressing worries concerning AVs, all respondents were provided with the option of entering any remark they might have about the shuttle test or autonomous shuttles in general. First, regarding the shuttle aspects, respondents mentioned the low speed of the vehicle and the discomfort of the seats. Second, several respondents expressed their concern for the job security of drivers: “If it becomes widespread it will lead to job loss, no more drivers, no more work for them”, “Loss of driver jobs” and “If everything is automated, what about the employment of the drivers?”. Third, some respondents were concerned about the “lack of social control (delinquency, violence, …)”. Fourth, in line with the respondents’ impressions regarding the test and the image it provides, they remarked that it is an “Excellent initiative”, “It is cool”, “It is positive” and “Super”. Lastly, while excited about the test, respondents found it hard to imagine the use of autonomous shuttles as they experienced them in a real urban setting. However, they expressed belief that an AS can serve a purpose on campuses and at hospitals. More importantly, respondents expressed a belief in the usefulness of AS transport for people with reduced mobility and therefore argued that more space should be provided for wheelchairs and strollers.

4.2. Passengers’ Experience and Expectation of Shuttle Use

To gain insight into the participants’ perception of the use of autonomous shuttles, they were asked to rate their experience of the ride in terms of four statements on a seven-point Likert scale. These statements are listed in Table 2. Figure 8 show the distribution of the responses for each of the items per site. At both sites, more than 90% of respondents believed that the use of AS is fun (rather agree to strongly agree). Respondents also stated that AS is easy to use, with 95% of the Woluwe park respondents and 87% of the Health Campus respondents expressing agreement with the statement. When asked whether they believed that the use of AS would allow them to reach their destination in a more comfortable way, the data show that more than 70% of the users at both sites believed so. Finally, 52% of the respondents at both sites believed that the use of AS would help them to reach their destinations more quickly.
The respondents were also asked to rate their intention to use AS in the future. Figure 9 shows a clear positive perception, as 86.72% of the Woluwe respondents and 65.52% of the Health Campus respondents intended (rather agree to strongly agree) to use AS in the future.
Table 4 presents the descriptive statistics, including the mean and standard deviation, for the measurement items.

4.3. Passengers’ Opinions on the Necessity of Cars and Environmental Concern

Next, we describe the passengers’ opinions on the necessity of cars. Part of the goal of providing first/last mile shuttle trajectories is to improve the connection between car-dependent areas and the public transport network to contribute to more sustainable mobility solutions. Even though the shuttle did not operate in such a setting, respondents were asked to consider if they believed that owning a car would be less necessary after the adoption of autonomous vehicles. The respondents’ opinions to this statement are plotted in Figure 10. A different picture was found for the two sites: at the Brussels Health Campus, 53% of the respondents thought that owning a car would no longer be necessary; in contrast, at Woluwe Park, half of the respondents disagreed with the statement (rather disagree to strongly disagree).
Focusing more closely on the aspect of the necessity of cars, the ratings were plotted against different socio-demographic attributes of the sample. Table 5 and Table 6 show the respondents’ ratings with regards to the necessity of cars for each age group. At the Woluwe Park site, respondents between the ages of 25 and 64 generally disagreed with the statement of a reduced necessity of cars. More than 50%f the respondents within each age group expressed disagreement: 51.06% in the 25 to 34 age group, 57.14% in the 35 to 44 age group, 55.77% in the 45 to 54 age group, and 58.14% in the 55 to 64 age group. In the younger age group of 15 to 24 years of age, 42.55% disagreed with the statement. Finally, the share of respondents in disagreement with the statement in the category older than 65 was 35.09%. Among the older passengers, agreement with the statement was highest and reached 45.61%. At the Brussels Health Campus, 70% of the respondents were aged between 15 and 24, and 51.49% of them believed that cars would be less necessary after AV adoption.
Figure 11 shows the respondents’ opinions regarding the necessity of cars per occupation type. The respondents were grouped into the categories of student, working or retired based on their selected work situation. Within the Woluwe Park sample, 70% of the respondents fell within the working group, of which 54.44% did not believe that the necessity of cars would drop after AV adoption. At the Brussels Health Campus, 73% of the passengers are students, of which 51.89% had a positive perception of the reduced need for car ownership.
The figures show that the active working population, aged 25 to 65, indicated a stronger disagreement with regard to reduced necessity of cars after AV adoption than the young and elderly.
While the major share of car users at the Brussels Health Campus felt optimistic about the reduction of car ownership (51.22% agreed), car users at Woluwe Park generally disagreed (57.5%). The majority of respondents, however, used public transport as their primary mode of transportation in Brussels. Figure 12 shows respondents’ opinions regarding the necessity of cars distributed across three levels of frequency of public transport use: daily, multiple times a week and once a week or less. At the Brussels Health Campus, public transport usage is evenly distributed across the three levels, and respondents within each of the categories generally seemed to believe that cars would be less necessary. At the Woluwe park, the distribution shows a different picture: the majority of the respondents were daily public transport users, and almost half of them did not believe that cars would be less necessary. Additionally, among the frequent and less frequent users of public transport, more than 50% of the respondents disagreed with the statement.
Among the respondents in both samples, several respondents stated that they took environmental concerns into account in their choice of their primary mode of transportation. For the Woluwe site, this group covers one-fifth of the total sample, and at the Brussels Health Campus, the share of environmentally conscious passengers comprised one-third of the sample. 
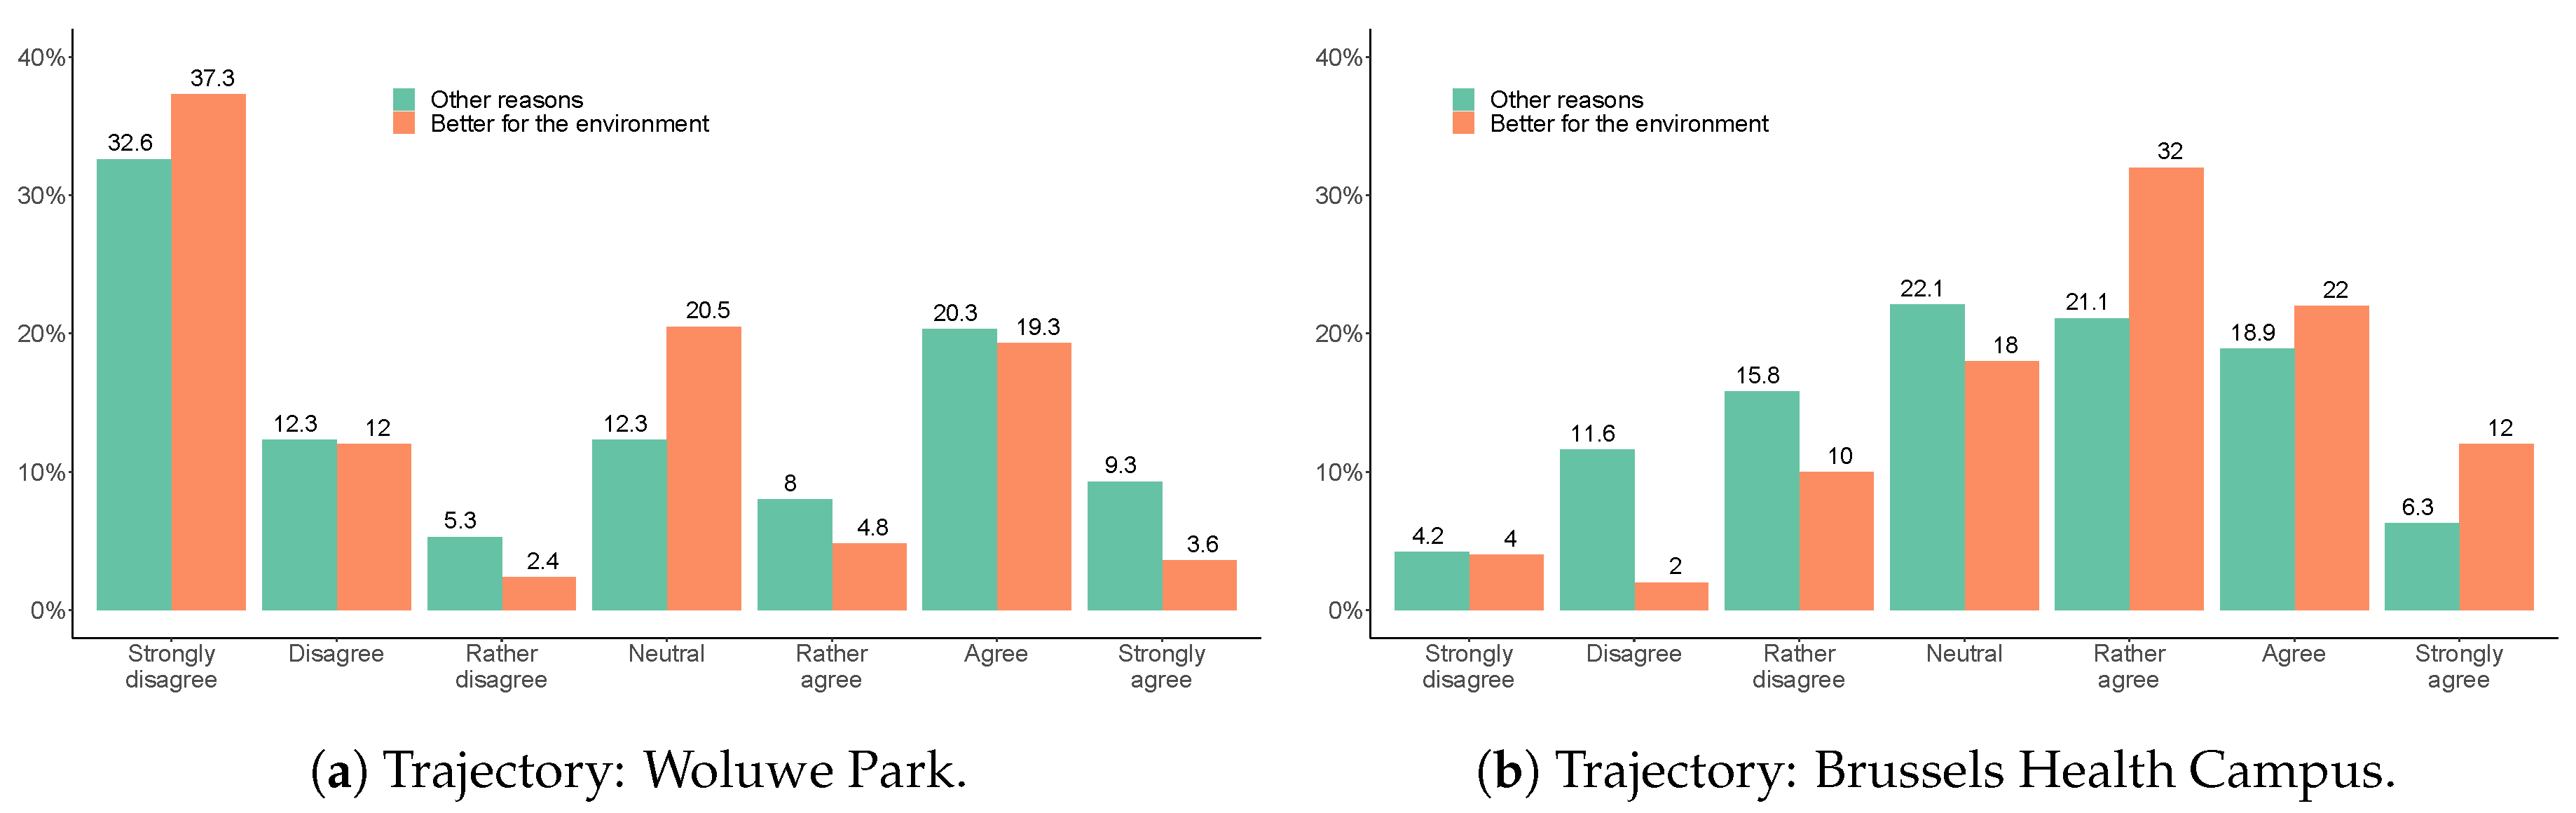
Figure 13 shows the respondents who selected “better for the environment” as one of the reasons behind their choice of transport mode and their intention to use AS in the future. Most of the environmentally-conscious respondents expected to use AS in the future. The distribution of the opinions of this subgroup is similar to the distribution of opinions within the general sample. Figure 14 shows that environmentally-conscious respondents of the Woluwe sample mostly did not agree that cars would be less necessary after the adoption of AVs. At the Brussels Health Campus, environmentally-conscious respondents were more positive towards the reduction of necessity of cars. The environmentally-conscious respondents comprised 42.86% of the total portion of respondents who believed that cars would be less necessary. In general, the distribution of opinions resembles that of the entire sample.

4.4. Correlations and Hierarchical Multiple Regression Analysis

In the next step, a correlation matrix was calculated to investigate the correlations between the different variables. For the sample of the Brussels Health Campus, a strong correlation of 0.66 can be found between the scoring for the general experience of the shuttle and hedonic motivation (p < 0.01). For the sample from Woluwe Park, no moderate or strong correlations were found.
Table 7 shows the correlations found between behavioural intention and other variables. We assumed equal appearing intervals for the variables measured on a seven-point Likert scale and calculated Pearson’s r correlations between behavioural intention and effort expectancy, hedonic motivation, performance expectancy, general experience and the necessity of cars. We calculated Spearman’s p correlations between behavioural intention and the variables of gender, occupation, degree, worries and environmental consciousness.
Here, we note that for the Brussels Health Campus, moderately strong correlations were found between behavioural intention and the items of the UTAUT2 model. In contrast, for Woluwe Park, the UTAUT2 items showed rather weak correlations with behavioural intention. Besides the items related to the shuttle experience, the questionnaire asked whether respondents had any worries concerning autonomous vehicles in general. They were also asked to rate whether they believed that autonomous shuttles would decrease the need to own a personal vehicle. Lastly, respondents were asked to indicate their most used mode of transportation and their reasons for choosing that mode. A new dichotomous variable, environmentally conscious, was created based on this question, indicating whether “better for the environment” was one of the options behind choosing a specific mode of transport.
For both studies, correlations between the dependent variable and these other variables were found to be very weak (r < 0.20). It can be noted that, although respondents indicated having worries with regard to AVs, this did not significantly influence their intention to use AS in the future. Furthermore, having a future intention to use autonomous shuttle did not seem to be strongly related to the necessity of owning a personal car. Finally, environmental consciousness and usage intention showed a very weak negative correlation.
To further investigate the relationships between respondents’ usage intention and the independent variables, a hierarchical multiple linear regression was performed [22,27]. In the first step, the linear model included the items based on the UTAUT2 model. In the second step, socio-demographic factors were added. In the third step, the general experience with the autonomous shuttle was added. In the fourth step, environmental consciousness and the necessity of cars were added, which are factors related to personal beliefs.
Prior to evaluating the model as a whole for each of the pilot sites, we used the “OLSRR” package in R to check for the multicollinearity and normality of the outcome [37]. Firstly, no correlations were larger than 0.70 for both sites, indicating that there was no multicollinearity between the predictor variables. Using collinearity diagnostics, this was confirmed. The minimum tolerance was 0.73 for Woluwe and 0.44 for the Health Campus, and the maximum VIF was 1.37 for Woluwe and 2.28 for the Health Campus [38]. Secondly, for Woluwe, the interpretation of the Q–Q plot suggests that the outcome of the model is not perfectly normally distributed. For the Health Campus, all the points fell approximately along the 45 reference line; therefore, we can assume normality.
Although the outcome data were not perfectly normally distributed, we continued with the interpretation of the regression results due to the argued robustness of the parametric statistics, even when working with ordinal Likert scale items [39].
Table 8 shows the results of the hierarchical multiple regression for the Woluwe site. In the first step, the regression results showed that hedonic motivation, effort expectancy and performance expectancy in terms of reaching the destination faster significantly affected usage intention. When accounting for the socio-demographic factors, degree became a significant predictor and added to the variance explained by the model. In the third step, general experience cannibalised the predictive effect of effort expectancy while explaining additional variance. In the final step, we found that environmental consciousness and the necessity of cars did not significantly affect the dependent variable nor add to the variance explained by the model. The model as a whole explained 20% of the usage intention ( R 2 = 0.20 ).
Table 9 shows the results of the hierarchical multiple regression for the Brussels Health Campus. In the first step, the factors of hedonic motivation, effort expectancy and performance expectancy in terms of reaching the destination in a more comfortable way were found to be significant predictors of usage intention. The second step showed no significant effect in terms of the socio-demographic factors. Adding general experience with the shuttle in the third step and personal beliefs in the fourth step did not significantly explain the additional variance of usage intention, although adding these factors to the model subtracted the predictive effects of performance expectancy (comfortable) and hedonic motivation. The model as a whole explained 54% of the usage intention ( R 2 = 0.54 ).
At both sites, for step one of the model, hedonic motivation was found to be the strongest predictor of usage intention.

5. Discussion

Firstly, we would like to put the current results in perspective of previous studies. In the Greek pilot study, passengers perceived the shuttle as useful and comfortable and were satisfied with its driving behaviour. In Brussels, the same results were found: passengers were satisfied with the comfort, the ease of entering and exiting and the driving behaviour of the shuttle, resulting in an overall positive experience. Greek passengers generally also felt that the shuttle was equally safe, secure and able to handle an emergency as a regular bus [25]. In this study, the majority of respondents indicated that they did not have concerns regarding autonomous vehicles in general; even though safety and security aspects of the shuttle were not separately rated by the Brussels’ respondents, from their textually expressed remarks, it is clear that they had several concerns regarding these aspects of the shuttle. They felt uncertain about the shuttle’s reactions in the case of an emergency and the technical safety of the vehicle in terms of risk of failure, especially if the shuttle were to operate in more complex traffic environments. Respondents also expressed concerns about the risks of external attacks, both in terms of the risk of hacking the driver system and the risk of personal harassment due to the lack of social control without a driver or safety operator.
A further comparison of the respondents’ comments from the Brussels sites to the comments gathered at the Austrian pilot site [33] shows similarities in terms of the aspects of the shuttle and experiences that were liked and disliked. Passengers appreciated the silent and smooth driving behaviour of the vehicle, and they felt safe during the ride. They were also positively surprised by the technology and expressed trust in the automated driving system. Common negative aspects included the abrupt breaking, the comfort of the vehicle in terms of seating and space and the low operating speed of the shuttle. Overall, the results from the Brussels surveys showed that the passengers, in general, had a positive experience of riding the shuttle.
Additionally, the current study showed that passengers expected to use autonomous shuttles in the future. They agreed that using the shuttle was fun and easy and that it made for a comfortable mode of transportation that could help them to reach their destination more quickly. The statements that were used to rate these factors of acceptance towards future use were based on a previous pilot study, with a conceptual model built on UTAUT [22]. As discussed previously, several studies have included constructs adjusted from general technology acceptance theory to capture the intention to use autonomous shuttles and its predictors [19,21,22,34,35]. Although the constructs of the models were not operationalised in the same way, the careful comparison of the mean values of the constructs measured at other European test sites and the items for the Brussels sites confirmed that autonomous shuttles are perceived as enjoyable modes of transport that are easy to use. Another similarity is the slightly less positive average ratings found for performance expectancy or the expected usefulness of autonomous shuttles [21,22,34]. The experienced usefulness of autonomous shuttles does not yet correspond to the potential they could reach at full driving automation (SAE level 5). An on-board safety operator is still needed to adjust the route of the vehicle in some cases of obstacle detection by the system, and the current operating speed of the vehicles is lower than the speed of a regular bus. This could partially explain the reduced ratings for performance expectancy or perceived usefulness of autonomous shuttles.
Secondly, we want to discuss the evaluation of the conceptual model. In line with previous shuttle acceptance studies [21,22,27], we used hierarchical multiple regression analysis to test the moderated research model. For Woluwe Park, the first model included the UTAUT-based items and explained 15% of the variance of usage intention. Adding the socio-demographic factors and general experience with the shuttle to the model increases its predictive power, explaining 20% of the variance of usage intention. The results of the regression model for the Woluwe Park context are comparable to survey research from the CityMobil projects in La Rochelle and Lausanne, where the model explained 22% of the variance and performance expectancy was the strongest predictor. The items included in this earlier study also had an explicit focus on the connection of autonomous shuttles with public transport.
In the context of the Brussels Health Campus, we found that the first model explained 52% of the variance in behavioural intention. This is comparable to the predictive power of the UTAUT-based regression model in Greece of 58% [22] and the TAM-based model in France of 43% [34].
We must note that the sample of respondents at the Health Campus represented a rather homogeneous population of relatively young passengers, of which the majority were currently students. The mobility needs and objectives of these type of passengers are quite similar, and therefore the respondents had similar beliefs with regard to autonomous mobility. Compared to the Woluwe site, which represented a more heterogeneous population, this could partially explain the difference between the variances explained by the model for the Health Campus and the Woluwe site. Additionally, the lower predictive power of the model for the Woluwe site indicates that a significant contributor is still missing for successfully predicting the intention to use autonomous shuttles for a diverse population. Based on results from previous research, trust in autonomous technology and the perceived safety of autonomous shuttles have been found to be significant factors [27,35].
Although we expected the three UTAUT-based constructs to be significant predictors of the behavioural intention to use autonomous shuttles at both pilot sites, the results from our regression analysis showed that this was not the case. In the context of the Brussels Health Campus, both effort expectancy and hedonic motivation were significant and strong predictors for behavioural intention. Performance expectancy in terms of comfortable travel was shown to be only a slightly significant factor, while performance expectancy in terms of reaching the destination more quickly was not a significant factor for the Health Campus sample. For the Woluwe sample, we conclude that hedonic motivation is also a strong significant predictor, followed by performance expectancy in terms of reaching the destination more quickly. Performance expectancy in terms of comfortable travel was not found to be a significant factor nor a strong coefficient of the model. Lastly, effort expectancy, while initially only a slightly significant factor, was no longer found to be a strong coefficient when general experience with the shuttle was added to the model.
Lastly, we like to draw attention to the differences between the survey sites. There is a difference regarding respondents’ opinions on the necessity of cars between the two sites. At the Brussels Health Campus, a small majority agreed that owning a car would be less necessary after the adoption of autonomous vehicles. At Woluwe Park, however, half of the respondents did not agree with that statement. Furthermore, in other studies, passengers indicated they would not be willing to replace their private car with the use of an autonomous shuttle. For the Brussels studies, this could partly be explained by the different socio-demographic compositions of the two samples. However, this could also be related to the trajectories of the shuttles. At the Brussels Health Campus, the shuttle covered a distance of 350 m between two stops, while in Woluwe Park, the trajectory covered 1.5 km. The additional stops and the route along which respondents were taken could have provided the passengers with a more elaborate opportunity to assess the usefulness of this trajectory and the usefulness of autonomous shuttle transport in a broader context.
The majority of respondents used public transport services as their primary mode of transportation in Brussels. Brussels has a dense network of rail and road services operated by the STIB, and most respondents used public transport daily or at a high frequency. Despite the habit of using public transport, the Woluwe Park sample showed that respondents did not believe that cars will become less necessary after AV adoption. The underlying reasoning of respondents could be linked to the fact that, at its current size and speed, the autonomous shuttle is not ready to be implemented in real traffic situations and will therefore not be able to form a sustainable connection between car-dependent areas and the core public transport network. Several respondents expressed their concerns about the use of AS in a real-life setting or dense traffic areas.
In both studies, respondents’ satisfaction with aspects of the shuttle and the availability and professionalism of the accompanying personnel was very positive. Furthermore, in other European pilot studies, the presence of an onboard operator has been remarked to provide an increased feeling of safety for passengers [33]. In a transition period from manually driven to autonomous transport, it can be argued that on-board personnel can serve to inform the passengers and reassure them with their knowledge. Additionally, onboard personnel can be of assistance to passengers with reduced mobility. Respondents expressly point out that autonomous shuttle transport can be valuable in areas that are difficult to reach for people with reduced mobility. At both sites, respondents agreed that testing autonomous shuttles is useful and fit the image of the operator or operation site. Additionally, the majority of the respondents from the test in Woluwe Park believed that it is the role of the public transport operator to test new transport solutions and technologies that could improve urban mobility.

6. Conclusions

The main conclusion we draw from our two data sets is the general positive experience of the passengers towards the use of autonomous shuttles. This is important, as respondents who have a positive experience will have a higher intention to use the technology in the future. The current study also shows that passengers from the two different pilot sites agreed to use autonomous shuttles in the future. However, they still had some concerns regarding the safe and useful operation of the shuttles in complex urban traffic situations. The ratings also show that the current experience does not suffice to convince the majority of passengers that autonomous shuttles will reduce the need to own a personal vehicle after the adoption of autonomous vehicles. As argued by previous studies, and as also found in the current study, positive affective attitudes and perceived enjoyment are strong factors affecting the intended use of autonomous shuttles.
City authorities should allow and support the pilot testing of autonomous vehicles on public roads. Further testing of autonomous shuttles in complex urban traffic situations is needed not only to evaluate the technical feasibility of the currently available technology but also to foster acceptance from citizens. This research shows a positive attitude towards autonomous shuttle testing and aspects of the vehicle in a contrived setting. Passengers, however, realised and expressed their concerns about the integration of autonomous shuttles in a truly mixed traffic situation. Trust in the technology, the enjoyment of the ride and the relative advantages of autonomous shuttles are key factors that play a role in the acceptance of autonomous shuttles, all of which can be demonstrated by setting up safe and useful trajectories in increasingly complex traffic situations. Examples of this are a connection between a public transport hub and a frequently visited facility, such as a main bus stop and the entrance of a hospital, or a train station and an industrial site. Operators and city authorities should keep in mind that the disturbance of the regular traffic situation by the shuttle would have a negative effect on passengers’ and other road users’ acceptance; therefore, alignment between the operator and the local authorities is advised, including the mapping of possible issues and causes for disturbances, such as the low operating speed of shuttle transport. They should take appropriate actions to mitigate possible disturbances; for instance, by implementing a speed reduction in the operation zone of the shuttle or the allocation of a separate road section for shuttle transport.
Finally, we want to address the limitations of our research and future improvements. The surveys were conducted at two different locations in the Brussels Capital Region. The use of the shuttle was open to all visitors of Woluwe Park and the Brussels Health Campus. Users of the shuttle service were approached after their ride to ask for their participation in the survey study. All respondents participated voluntarily and did not receive a compensation after the completion of the survey. Visitors of pilot sites might have been attracted to participate in the shuttle test and the survey because of an interest in autonomous mobility. Therefore, the results obtained from the survey are subject to a degree of self-selection bias and non-response bias. Future user acceptance studies could include the measurement of respondents’ willingness to pay for the use of autonomous shuttles under different cost structures and in various settings. Local public transport operators could use this type of information to set up the first economically viable shuttle connections. Certain types of shuttles do not require infrastructural investments, and leasing a fleet of autonomous shuttles would allow the operator to evaluate the longer-term testing of the operation of the fleet and its integration with the existing public transport network.

Author Contributions

L.V. conceptualised the study design; E.R., L.V. and M.F. developed the questionnaire; E.R. and M.F. collected and analysed the data; E.R. did the visualisation; M.F. wrote the manuscript; E.R. and L.V. edited it. Project supervision and funding acquisition by L.V. All authors have read and agreed to the published version of the manuscript.

Funding

This research was funded by Innoviris within the Testit Living Labs program. The UZ Brussel provided operational support to the pilot project on the Brussels Health Campus.

Acknowledgments

The authors thank Innoviris for the funding of the project at the UZ Brussel. The authors would also like to thank the Brussels public transport operator, STIB, for their cooperation during this research and for providing the opportunity to collect data at the Woluwe site. Lastly, the authors are grateful to the reviewers of the paper for their comments, which helped to improve the manuscript.

Conflicts of Interest

The authors declare no conflict of interest. The funders had no role in the design of the study; in the collection, analyses, or interpretation of data; in the writing of the manuscript, or in the decision to publish the results.

References

  1. Dingil, A.E.; Schweizer, J.; Rupi, F.; Stasiskiene, Z. Updated models of passenger transport related energy consumption of urban areas. Sustainability 2019, 11, 4060. [Google Scholar] [CrossRef] [Green Version]
  2. Goetz, A.R. Transport challenges in rapidly growing cities: Is there a magic bullet? Transp. Rev. 2019, 39, 701–705. [Google Scholar] [CrossRef]
  3. World Health Organization. Global Status Report on Road Safety 2018; Technical Report 1; World Health Organization: Geneva, Switzerland, 2018. [Google Scholar]
  4. Sultana, S.; Salon, D.; Kuby, M. Transportation sustainability in the urban context: A comprehensive review. Urban Geogr. 2019, 40, 279–308. [Google Scholar] [CrossRef]
  5. De Clerck, Q.; van Lier, T.; Messagie, M.; Macharis, C.; Van Mierlo, J.; Vanhaverbeke, L. Total Cost for Society: A persona-based analysis of electric and conventional vehicles. Transp. Res. Part Transp. Environ. 2018, 64, 90–110. [Google Scholar] [CrossRef]
  6. van Lier, T.; De Witte, A.; Macharis, C. The Impact of Telework on Transport Externalities: The Case of Brussels Capital Region. Procedia Soc. Behav. Sci. 2012, 54, 240–250. [Google Scholar] [CrossRef] [Green Version]
  7. da Schio, N.; Boussauw, K.; Sansen, J. Accessibility versus air pollution: A geography of externalities in the Brussels agglomeration. Cities 2019, 84, 178–189. [Google Scholar] [CrossRef] [Green Version]
  8. Hubert, M.; Lebrun, K.; Huynen, P.; Dobruszkes, F. Daily mobility in Brussels: Challenges, tools and priority undertakings. Bruss. Studies 2013, 71. [Google Scholar] [CrossRef] [Green Version]
  9. Federale Overheidsdienst Mobiliteit en Vervoer. Enquête Monitor over de Mobiliteit van de Belgen; Technical Report; Federale Overheidsdienst Mobiliteit en Vervoer: Brussels, Belgium, 2019. [Google Scholar]
  10. Nazari, F.; Noruzoliaee, M.; Mohammadian, A.K. Shared versus private mobility: Modeling public interest in autonomous vehicles accounting for latent attitudes. Transp. Res. Part Emerg. Technol. 2018, 97, 456–477. [Google Scholar] [CrossRef]
  11. Milakis, D.; Van Arem, B.; Van Wee, B. Policy and society related implications of automated driving: A review of literature and directions for future research. J. Intell. Transp. Syst. Technol. Plan. Oper. 2017, 21, 324–348. [Google Scholar] [CrossRef]
  12. Narayanan, S.; Chaniotakis, E.; Antoniou, C. Shared autonomous vehicle services: A comprehensive review. Transp. Res. Part Emerg. Technol. 2020, 111, 255–293. [Google Scholar] [CrossRef]
  13. International Transport Forum. Urban Mobility System Upgrade-How Shared Self-Driving Cars Could Change City Traffic; Technical Report; OECD/ITF: Paris, France, 2015. [Google Scholar]
  14. International Transport Forum. Shared Mobility-Innovation for Liveable Cities; Technical Report; OECD/ITF: Paris, France, 2016. [Google Scholar]
  15. PTV; COWI. The Oslo Study—How Autonomous Cars May Change Transport in Cities; Technical Report April; Ruter: Oslo, Norway, 2019. [Google Scholar]
  16. Salazar, M.; Rossi, F.; Schiffer, M.; Onder, C.H.; Pavone, M. On the Interaction between Autonomous Mobility-on-Demand and Public Transportation Systems. In Proceedings of the 2018 21st International Conference on Intelligent Transportation Systems (ITSC), Maui, HI, USA, 4–7 November; pp. 2262–2269. [CrossRef] [Green Version]
  17. Shen, Y.; Zhang, H.; Zhao, J. Integrating shared autonomous vehicle in public transportation system: A supply-side simulation of the first-mile service in Singapore. Transp. Res. Part Policy Pract. 2018, 113. [Google Scholar] [CrossRef]
  18. Ohnemus, M.; Perl, A. Shared autonomous vehicles: Catalyst of new mobility for the last mile? Built Environ. 2016. [Google Scholar] [CrossRef]
  19. Chen, C.F. Factors affecting the decision to use autonomous shuttle services: Evidence from a scooter-dominant urban context. Transp. Res. Part Traffic Psychol. Behav. 2019, 67, 195–204. [Google Scholar] [CrossRef]
  20. Eden, G.; Nanchen, B.; Ramseyer, R.; Evéquoz, F. Expectation and experience: Passenger acceptance of autonomous public transportation vehicles. In Human-Computer Interaction–INTERACT 2017; Bernhaupt, R., Dalvi, G., Joshi, A., Balkrishan, K.D., O’Neill, J., Winckler, M., Eds.; Springer International Publishing: Basel, Switzerland, 2017; pp. 360–363. [Google Scholar] [CrossRef] [Green Version]
  21. Madigan, R.; Louw, T.; Dziennus, M.; Graindorge, T.; Ortega, E.; Graindorge, M.; Merat, N. Acceptance of Automated Road Transport Systems (ARTS): An Adaptation of the UTAUT Model. Transp. Res. Procedia 2016, 14, 2217–2226. [Google Scholar] [CrossRef] [Green Version]
  22. Madigan, R.; Louw, T.; Wilbrink, M.; Schieben, A.; Merat, N. What influences the decision to use automated public transport? Using UTAUT to understand public acceptance of automated road transport systems. Transp. Res. Part Traffic Psychol. Behav. 2017. [Google Scholar] [CrossRef]
  23. Nordhoff, S.; de Winter, J.; Madigan, R.; Merat, N.; van Arem, B.; Happee, R. User acceptance of automated shuttles in Berlin-Schöneberg: A questionnaire study. Transp. Res. Part Traffic Psychol. Behav. 2018, 58, 843–854. [Google Scholar] [CrossRef] [Green Version]
  24. Nordhoff, S.; de Winter, J.; Payre, W.; van Arem, B.; Happee, R. What impressions do users have after a ride in an automated shuttle? An interview study. Transp. Res. Part Traffic Psychol. Behav. 2019, 63, 252–269. [Google Scholar] [CrossRef] [Green Version]
  25. Portouli, E.; Karaseitanidis, G.; Lytrivis, P.; Amditis, A.; Raptis, O.; Karaberi, C. Public attitudes towards autonomous mini buses operating in real conditions in a Hellenic city. IEEE Intell. Veh. Symp. Proc. 2017, 571–576. [Google Scholar] [CrossRef]
  26. Zoellick, J.C.; Kuhlmey, A.; Schenk, L.; Schindel, D.; Blüher, S. Assessing acceptance of electric automated vehicles after exposure in a realistic traffic environment. PLoS ONE 2019, 14, 1–23. [Google Scholar] [CrossRef]
  27. Zoellick, J.C.; Kuhlmey, A.; Schenk, L.; Schindel, D.; Blüher, S. Amused, accepted, and used? Attitudes and emotions towards automated vehicles, their relationships, and predictive value for usage intention. Transp. Res. Part Traffic Psychol. Behav. 2019, 65, 68–78. [Google Scholar] [CrossRef] [Green Version]
  28. Fishbein, M.; Ajzen, I. Belief, Attitude, Intention, and Behavior: An Introduction to Theory and Research; Addison-Wesley: Reading, MA, USA, 1975. [Google Scholar]
  29. Davis, F.D.; Bagozzi, R.P.; Warshaw, P.R. User Acceptance of Computer Technology: A Comparison of Two Theoretical Models. Manag. Sci. 1989, 35, 982–1003. [Google Scholar] [CrossRef] [Green Version]
  30. Davis, F.D. A Technology Acceptance Model for Empirically Testing New End-User Information Systems: Theory and Results. Ph.D. Thesis, Massachusetts Institute of Technology, Cambridge, MA, USA, 1986. [Google Scholar] [CrossRef]
  31. Venkatesh, V.; Morris, M.G.; Davis, G.B.; Davis, F.D. User Acceptance of Information Technology: Toward a Unified View. MIS Q. 2003, 27, 425–478. [Google Scholar] [CrossRef] [Green Version]
  32. Venkatesh, V.; Thong, J.Y.; Xu, X. Consumer acceptance and use of information technology: Extending the unified theory of acceptance and use of technology. Mis Q. Manag. Inf. Syst. 2012, 36, 157–178. [Google Scholar] [CrossRef] [Green Version]
  33. Rehrl, K.; Zankl, C. Digibus©: Results from the first self-driving shuttle trial on a public road in Austria. Eur. Transp. Res. Rev. 2018, 10. [Google Scholar] [CrossRef]
  34. Moták, L.; Neuville, E.; Chambres, P.; Marmoiton, F.; Monéger, F.; Coutarel, F.; Izaute, M. Antecedent variables of intentions to use an autonomous shuttle: Moving beyond TAM and TPB? Rev. Eur. Psychol. Appl. 2017, 67, 269–278. [Google Scholar] [CrossRef]
  35. Herrenkind, B.; Brendel, A.B.; Nastjuk, I.; Greve, M.; Kolbe, L.M. Investigating end-user acceptance of autonomous electric buses to accelerate diffusion. Transp. Res. Part Transp. Environ. 2019, 74, 255–276. [Google Scholar] [CrossRef]
  36. Rombaut, E.; Feys, M.; Vanobberghen, W.; Cauwer, C.D.; Vanhaverbeke, L. Experience and Acceptance of an Autonomous Shuttle in the Brussels Capital Region; ISTS: Nashville, TN, USA, 2020. [Google Scholar]
  37. Hebbali, A. olsrr: Tools for Building OLS Regression Models; R Package Version 0.5.3. Available online: https://cran.r-project.org/web/packages/olsrr/ (accessed on 20 July 2020).
  38. Garson, G.D. Testing Statistical Assumptions: Blue Book Series; Statistical Associate Publishing: Asheboro, NC, USA, 2012; pp. 1–54. [Google Scholar]
  39. Norman, G. Likert scales, levels of measurement and the “laws” of statistics. Adv. Health Sci. Educ. 2010, 15, 625–632. [Google Scholar] [CrossRef]
Figure 1. Shuttle and trajectory at Woluwe Park.
Sustainability 12 08403 g001
Figure 2. Shuttle and trajectory at Brussels Health Campus.
Sustainability 12 08403 g002
Figure 3. Respondents’ opinions on several aspects of the autonomous shuttle.
Sustainability 12 08403 g003
Figure 4. Respondents’ opinions on the accompanying personnel.
Sustainability 12 08403 g004
Figure 5. Respondents’ opinions on the usefulness of shuttle testing.
Sustainability 12 08403 g005
Figure 6. Respondents’ opinions on image.
Sustainability 12 08403 g006
Figure 7. Trajectory: Woluwe Park. Statement: “It is not the role of the STIB (Société des Transports Intercommunaux de Bruxelles) to test new mobility/technology solutions to improve mobility in Brussels”.
Sustainability 12 08403 g007
Figure 8. Respondents’ acceptance ratings towards autonomous shuttles.
Sustainability 12 08403 g008
Figure 9. Respondents’ intention to use autonomous shuttles in the future.
Sustainability 12 08403 g009
Figure 10. Respondents’ opinions on the necessity of cars after the adoption of autonomous vehicles.
Sustainability 12 08403 g010
Figure 11. Respondents’ opinions on the necessity of cars after the adoption of autonomous vehicles per occupation type.
Sustainability 12 08403 g011
Figure 12. Respondents’ opinions on the necessity of cars after the adoption of autonomous vehicles according to frequency of public transport usage.
Sustainability 12 08403 g012
Figure 13. Environmentally-conscious respondents’ intentions to use AS in the future.
Sustainability 12 08403 g013
Figure 14. Environmentally-conscious respondents’ opinions on the necessity of cars after the adoption of autonomous vehicles.
Sustainability 12 08403 g014
Table 1. Construct definitions, adapted from [22].
ConstructDefinition
Behavioural intentionThe extent to which users believe they will use autonomous shuttles in the future.
Performance expectancyThe degree to which using an autonomous shuttle will provide benefits to users in their travel activities.
Effort expectancyThe degree of ease associated with the use of the autonomous shuttle.
Hedonic motivationThe fun or pleasure derived from the use of the autonomous shuttle.
Table 2. Questionnaire determinants and items.
Determinant and ItemsWordingAdapted from
Technology acceptance Madigan et al. [22]
Behavioral intentionI intend to use autonomous shuttles in the future.
Performance expectancy(1) Using autonomous shuttles will help me reach my destination in a more comfortable way.
(2) Using autonomous shuttles will help me reach my destination faster.
Effort expectancyI find autonomous shuttles easy to use.
Hedonic motivationUsing autonomous shuttles is fun.
Shuttle and service characteristics Nordhoff et al. [23]
General experienceSatisfaction with regard to the experience with the autonomous shuttle in general
Personal belief and opinion Own set up
Car necessityAutonomous shuttles will reduce the need to own a personal vehicle
Environmentally consciousWhy do you choose this [most used] mode of transport? “Better for the environment”
Table 3. Passenger sample characteristics, split between sites.
Woluwe ParkBrussels Health Campus
Participants, n384145
Age in years, M (SD)44.27 (16.81)25.88 (11.48)
Gender (ref: female), n (%)200 (52.08%)83 (57.24%)
Degree (ref: high school or lower), n (%)135 (35.15%)97 (60%)
Occupation (ref: student), n (%)49 (12.76%)106 (73.10%)
Main mode: public transport, n (%)229 (59.64%)85 (58.62%)
Main mode: car or motorcycle, n (%)127 (33.09%)44 (30.34%)
Main mode: other, n (%)28 (7.29%)16 (11.04%)
Environmentally conscious, n (%)83 (21.61%)50 (34.48%)
Table 4. Descriptive statistics of measurement items.
WoluweBrussels Health Campus
ItemMean (SD)Mean (SD)
Using autonomous shuttles will help me to reach my destination in a more comfortable way.5.07 (1.52)5.25 (1.17)
Using autonomous shuttles will help me to reach my destination more quickly.4.23 (1.94)4.55 (1.54)
I find autonomous shuttles easy to use.6.15 (0.85)5.61 (1.25)
Using autonomous shuttles is fun.6.07 (0.89)5.91 (1.06)
I intend to use autonomous shuttles in the future.5.73 (1.13)5.02 (1.57)
Table 5. Respondents’ opinion on the necessity of cars after the adoption of autonomous vehicles per age group at Woluwe Park.
Strongly DisagreeDisagreeRather DisagreeNeutralRather AgreeAgreeStrongly Agree
15–249 (19.15%)7 (14.89%)4 (8.51%)12 (25.53%)4 (8.51%)8 (17.02%)3 (6.38%)
25–3432 (34.04%)12 (12.77%)4 (4.26%)9 (9.57%)8 (8.51%)22 (23.40%)7 (7.45%)
35–4438 (41.76%)9 ( 9.89%)5 (5.49%)12 (13.19%)4 (4.40%)17 (18.68%)6 (6.59%)
45–5425 (48.08%)4 ( 7.69%)0 (0.00%)3 (5.77%)4 (7.69%)12 (23.08%)4 (7.69%)
55–6414 (32.56%)8 (18.60%)3 (6.98%)7 (16.28%)3 (6.98%)6 (13.95%)2 (4.65%)
>6511 (19.30%)7 (12.28%)2 (3.51%)11 (19.30%)5 (8.77%)12 (21.05%)9 (15.79%)
Table 6. Respondents’ opinions on the necessity of cars after the adoption of autonomous vehicles per age group at Brussels Health Campus.
Strongly DisagreeDisagreeRather DisagreeNeutralRather AgreeAgreeStrongly Agree
15–241 (0.99%)11 (10.89%)15 (14.85%)22 (21.78%)25 (24.75%)21 (20.79%)6 (5.94%)
25–343 (14.29%)1 (4.76%)3 (14.29%)5 (23.81%)2 (9.52%)3 (14.29%)4 (19.05%)
35–441 (10.00%)0 (0.00%)0 (0.00%)0 (0.00%)3 (30.00%)4 (40.00%)2 (20.00%)
45–540 (0.00%)0 (0.00%)2 (33.33%)1 (16.67%)3 (50.00%)0 (0.00%)0 (0.00%)
55–641 (33.33%)0 (0.00%)0 (0.00%)0 (0.00%)2 (66.67%)0 (0.00%)0 (0.00%)
>650 (0.00%)0 (0.00%)0 (0.00%)1 (33.33%)1 (33.33%)1 (33.33%)0 (0.00%)
Table 7. Correlations with the dependent variable of behavioral intention for the two sites (p < 0.01). AV: autonomous vehicle.
Woluwe ParkBrussels
Independent Variable Health Campus
Effort expectancy0.190.61
Hedonic motivation0.300.61
Performance expectancy (comfortable)0.130.55
Performance expectancy (faster)0.240.46
General experience0.230.55
Worries with regard to AVs (ref: No)0.04−0.09
Car less necessary after AV adoption0.150.12
Environmentally conscious−0.060.02
Age−0.030.15
Gender (ref: Female)−0.080.17
Degree (ref: High school or lower)0.15−0.11
Occupation (ref: Student)−0.040.08
Table 8. Hierarchical regression analyses with usage intention as the dependent variable; results from the Woluwe site. Note: · p < 0.1 ; * p < 0.05 ; * * p < 0.01 ; * * * p < 0.001 .
Step Step 1 β Step 2 β Step 3 β Step 4 β R 2 Δ R 2
1Constant 2.46 * * * 2.25 * * * 1.52 * * 1.64 * * 0.150.15
Effort expectancy 0.15 * 0.15 * 0.12 · 0.09
Performance, faster 0.14 * * * 0.13 * * * 0.13 * * * 0.13 * * *
Performance, comfortable 0.02 0.02 0.02 0.03
Hedonic motivation 0.32 * * * 0.34 * * * 0.29 * * * 0.29 * * *
2Age 0.00 0.00 0.00 0.180.03
Gender 0.05 0.04 0.05
Degree (ref: high school or lower) 0.38 * * * 0.40 * * * 0.41 * * *
3General experience 0.21 * * 0.20 * * 0.200.02
4Car necessity 0.04 0.200.00
Environmentally conscious 0.07
Table 9. Hierarchical regression analyses with usage intention as the dependent variable; results from the Health Campus site. Note: · p < 0.1 ; * p < 0.05 ; * * p < 0.01 ; * * * p < 0.001 .
Step Step 1 β Step 2 β Step 3 β Step 4 β R 2 Δ R 2
1Constant 1.51 * * 1.51 * 1.82 * 1.48 * * 0.520.52
Effort expectancy 0.43 * * * 0.43 * * * 0.41 * * * 0.42 * * *
Performance, faster 0.06 0.06 0.06 0.12
Performance, comfortable 0.22 * 0.22 * 0.20 · 0.20 ·
Hedonic motivation 0.43 * * * 0.43 * * * 0.38 * * 0.34 *
2Age 0.00 0.00 0.00 0.53 0.01
Gender 0.34 · 0.34 · 0.33 ·
Degree (ref: high school or lower) 0.06 0.04 0.10
3General experience 0.15 0.18 0.530.00
4Car necessity 0.12 · 0.540.01
Environmentally conscious 0.01

