Abstract
This study investigated the theory of residential mobility in terms of quality of life, focusing on convenience and the urban environment. The evaluation items (e.g., the accessibility to infrastructure, security, the environment, and social relationships) were selected based on previous studies, and a one-way ANOVA was conducted. The Korea Housing Survey was used to obtain data on the evaluations of homeowners who migrated to Seoul (the capital of South Korea) and to the surrounding metropolitan area (Gyeong-in). The regression analysis identified the factors affecting the overall satisfaction with the two destinations. The group that had migrated from Gyeong-in to Seoul was more satisfied with the medical, public, cultural, and transportation facilities than the group that had migrated from Seoul to Gyeong-in. Differences were also found between the two groups in the factors affecting their overall satisfaction with the migration destination. Factors such as satisfaction with transportation, commercial facilities, and cultural facilities affected the overall satisfaction with both destinations. However, homeownership affected the dependent variables only in Gyeong-in. The implications for potential improvements to infrastructure and housing distribution are discussed.
1. Introduction
Residential mobility, which refers to household movement within urban areas, is a population movement phenomenon that is primarily observed in developed and upper-level developing countries [1]. From a result-oriented perspective, it is sometimes called ‘residential relocation’, focusing on the specific movement of individual households [2].
The causes and consequences of residential mobility have been studied in terms of population, politics, economy, society, and culture. With increased data availability, macrolevel research on urban informatics has progressed, along with research on residential mobility at the individual household level. For example, from an urban informatics perspective, residential mobility has been studied in terms of housing equity and the labor market [3], while the labor-market perspective has expanded to focus on job-related residential mobility in tandem with industrialization processes [4]. Meanwhile, research on individual household-level residential mobility has found that residential satisfaction affects mobility [5], and factors such as the neighborhood quality, including the housing quality, are important determinants of household movement [6]. Urban planning and public housing policy studies have highlighted the importance of quality of life (QOL) in household migration and resident satisfaction. Relevant studies have explored social interaction or access to infrastructure with regard to household or individual evaluations [2,7]. Such work has expanded our understanding of residential mobility by examining the socioeconomic factors that affect it [8,9].
Spatial scope is an important aspect of recent research in this area. While the prior studies focused on the overall theories of residential mobility, more recent work has focused specifically on population movement between cities within a given country. Urban studies have examined patterns of mobility between densely populated metropolitan areas, rather than between nations. Such work has investigated residential mobility’s effects on urban residents’ QOL by analyzing physical, social, and environmental characteristics. It has also explored region-specific household satisfaction levels, focusing on, for example, the effect of institutional factors on the socioeconomic characteristics of urban residents [10,11,12,13]. Despite such work, there remains a need to fill knowledge gaps by establishing research models based on the status of specific countries and cities [14,15,16].
The present study focused on Seoul, the capital of South Korea, and its surrounding metropolitan area, Gyeong-in. Seoul started to experience rapid population growth after 1955, and by 1992 it was home to more than 10.96 million people. In 2016, however, the population of Korean nationals fell below 10 million. This was caused by multiple factors, including low birth rates, the aging of the population, rising housing prices, and increased housing supply in adjacent metropolitan areas stemming from large-scale development. Moreover, the total population of Seoul (including foreign and domestic nationals) is also expected drop below 10 million in the near future [17]. Meanwhile, the population of Seoul’s surrounding metropolitan area (Gyeong-in) has exceeded 10 million people since 2002. While other provincial cities had seen declining populations, by 2019, the population of Gyeong-in had increased to 13.65 million [18]. Thus, the need for comparative research on residential mobility between Seoul and Gyeong-in has been highlighted recently [19,20]. However, studies of residential mobility still tend to focus on movement between metropolitan cities, or between provincial or nonmetropolitan areas. Moreover, the relevant studies of South Korean cities have mainly focused on population movement itself, neglecting to examine important differences in environmental satisfaction in terms of physical, social, and community perspectives.
In this context, the present study examined the differences between Seoul and Gyeong-in in terms of satisfaction with physical facilities and the local environment. To this end, this study used data from a survey of households that had completed residential migration between the two areas. This study also aimed to identify the factors that affect the perceptions of migration destinations. Specifically, this study examined residential migration in the target areas in terms of urban environmental factors and QOL, thereby providing implications for relevant policies.
2. Literature Review
2.1. Residential Mobility in Metropolitan Areas and Postoccupancy Evaluation-Based QOL
From a macroperspective, residential mobility is a relocation phenomenon resulting from political, economic, and social events. Accordingly, researchers adopting this perspective generally address residential mobility by way of demographic attributes, encompassing specific events and the factors affected by them (e.g., the gender of the head of household, income, the number of household members). Residential migration tends to be closely related to life events, such as the birth of children or changes in employment [21]. In this view, residential mobility is based on the unsuitability of the current residence; that is, the relocation behavior is based on a desire for living spaces with larger or better environments, on changes in ownership, and so on [22]. This perspective focuses on identifying the causes of residential migration.
Meanwhile, research in the last 10 years has taken a critical stance on prior research, focusing instead on the associations between environmental factors and neighborhoods [23]. An underlying assumption of this approach is that “many people are reluctant to leave areas where they have grown up, or become accustomed to in the course of daily life” [23]. These factors of familiarity include “nearness to shops, schools, public transport, sport facilities, and the city, affinity for pleasant surroundings and nearness to friends and relatives” ([23] in reference to [24]). Therefore, since the familiarity of the residential environment is directly related to QOL, residential mobility caused by life events and the corresponding change in neighborhood are directly associated with QOL [25]. In addition, based on the view that intermetropolitan residential mobility is affected by economic and QOL factors [26], recent studies have examined residential mobility in terms of QOL in different countries’ large cities as spatial backgrounds. This is because QOL, including satisfaction with physical, environmental, and social factors, may be a predictor of both residential mobility and the long-term behavior of urban residents [27]. Therefore, the evaluation of the migration destination based on postoccupancy evaluation (POE) and measuring and analyzing QOL are important tools for the interpretation of population movement in different countries. Furthermore, given that the subjective features of neighborhoods can help to explain residential mobility [28], the examination of the link between home relocation and changes in residential satisfaction could highlight ways to improve housing and urban planning policies [2,29].
2.2. Subjective Indicators for the Evaluation of Neighborhood Environmental Factors
Based on the idea that “community satisfaction highly affects intentions to move” [30], research on migration intentions and results has expanded to include qualitative examinations of the current residence and residential environment. The selection of indicators related to the physical environment and to migrant household satisfaction thus have implications for sustainable urban development [6]. Although there are differences in the relevant indicators depending on the research field, in quantitative studies of urban planning and social science, the two approaches described below are typically used alone or in conjunction.
The first, from the urban informatics field, involves the use of data to measure effects on residential mobility or outcomes. This includes using objective indicators such as population, economics, and transportation (e.g., travel time and distance to work) [31]; land use and transportation accessibility [32]; the distance between residential areas and infrastructure [33]; health status [34]; population and population aging; poverty [35]; and income level [36]. Studies using these indicators have the advantage of explaining population movement between cities by way of long-term case studies, and such research has been conducted in multiple cities. However, these approaches also have limitations in terms of providing detailed implications for the improvement of housing and urban planning policies from a long-term perspective. This is because of the exclusion of subjective factors, such as QOL.
The second is the construction and evaluation of a framework based on the subjective factors of housing, the city, the environment, relations with neighbors, and so on. In this respect, interview-based research has been conducted in order to focus on smaller spatial scopes or specific social phenomena, while surveys have been used for larger-scale studies. The measurement items have included satisfaction levels based on the following: the evaluation of dwelling features, neighborhood facilities, the environment, and social interaction [37]; the evaluation of spatial, contextual, and functional features [38]; and the evaluation of subjective accessibility to key infrastructure, security, and the forms and functions of physical facilities [39]. However, since individual subjective judgments give rise to differences in the measurement of subjective factors, specific person–place interactions must be considered in research on residential mobility [40]. That is, there are limitations to objective examinations of particular issues in residential mobility, because each individual’s subjective tendencies are extensively manifested if the study is conducted at a single target site with a limited sample. Therefore, various studies (e.g., [41]) have made use of sociodemographic, housing, and neighborhood characteristics in order to measure subjective environmental factors.
Most studies that use subjective features target one region in the reviewing of the QOL of people who have experienced residential mobility. This method is useful for the evaluation of the subjective QOL of respondents in a particular region. However, in terms of residential mobility, the measurement of neighborhood factors or effects requires a comprehensive conceptualization of the context and environmental exposures [40]. Ultimately, interregional or intercity evaluation is necessary in order for the evaluation to be generalized. In other words, if the subjective features relevant to migration are measured and compared across numerous cities or regions, interregional residential mobility can be more extensively interpreted, and the results can be generalized.
It is important to consider interregional inbound and outbound migration when analyzing residential mobility. Studies involving residential mobility in metropolitan areas (e.g., [29,42,43]) tend to include individual-level socioeconomic attributes, as well as aspects such as population, the economy, society, and space. The present study, therefore, aimed to address the environmental factors evaluated by actual residents following residential relocation, and the related individual socioeconomic attributes. In this process, this study distinguished groups into those migrating to and from metropolitan areas, in order to observe the differences in the attributes that affect environmental factors, and to draw implications for urban planning and policy.
3. Materials and Methods
3.1. Research Materials and Processes
As mentioned earlier, Seoul has seen large population outflows, while the surrounding metropolitan area (Gyeong-in) has seen significant inflows. The construction of new cities and improved transportation convenience in metropolitan areas have been cited as important reasons for residential mobility. Comparing environmental factors between Seoul and the surrounding metropolitan area could provide support for that argument. To this end, this study collected and analyzed data from Seoul and Gyeong-in using the Korea Housing Survey (KHS), published by the South Korean government in 2019. However, the KHS drew samples from households across the country, and described general household and population characteristics as well as socioeconomic contexts (e.g., residential environments and cost of living). The content of the KHS, therefore, posed certain obstacles for this study. Consequently, this study acquired undisclosed data held by a research institute on residential mobility between the targeted areas. In these data, the metropolitan area is divided into three categories: Seoul, Incheon, and Gyeonggi Province. The three regions consist of 25, 10, and 31 basic local governments, respectively, with the metropolitan areas of Incheon and Gyeonggi Province surrounding the capital city of Seoul (see Figure 1). Thus, this research was able to distinguish the sample that had completed their migration to the target area in the year of the survey.
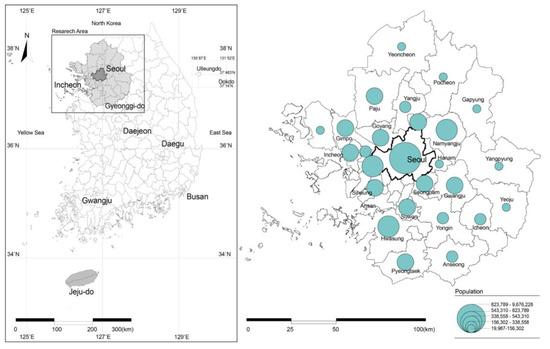
Figure 1.
Research areas.
Regarding methods, a quantitative comparison was first made of physical-environmental satisfaction with the migration destination. as evaluated by the population that completed the migration. Given that the various spatial, facility, and environmental backgrounds of residential areas affect migrated residents’ QOL, the mean values were compared in order to examine the differences between Seoul, where infrastructure and capital are concentrated, and Gyeong-in, where infrastructure and capital are expected to be more modest. Table 1 presents the evaluation indicators, which consist of 13 residential status evaluation items that have been standardized by the South Korean government since 2012. These items serve as comparative measurements of satisfaction levels from a physical-environmental perspective in terms of the current area of residence and the surrounding areas compared to the previous area of residence.

Table 1.
Indicators for the evaluation of residential environment satisfaction levels (n = 5834).
This study added inbound mobility within Seoul and metropolitan areas (Gyeong-in) as comparison groups, which were classified into four groups: migrants from Seoul to Gyeong-in, migrants from Gyeong-in to Seoul, migrants within Seoul, and migrants within Gyeong-in. In this way, this study examined the differences between inbound-based mobility—which is known to be a more general attribute in terms of residential mobility—and the various attributes evaluated by the households that have completed migration between Seoul and Gyeong-in.
The second method involved examining the overall residential satisfaction levels of samples that had completed residential migration from Seoul to Gyeong-in, or from Gyeong-in to Seoul, and the factors affecting their satisfaction. Although it is possible to compare high and low levels of satisfaction with regard to physical-environmental conditions, the 13 items—which is an excessive number—did not include the physical characteristics of residences. These items also failed to include demographic and economic characteristics, which are important factors in household migration. Therefore, it is necessary to select the impact factors in order to illustrate the trend of residential mobility in large samples. In the case of excessive variables, it is effective to reduce the number of variables in order to select and analyze key factors. Therefore, this study selected variables in terms of individual or household characteristics and physical characteristics in order to explore their effects. Individual (household) characteristics included the age of the head of the household, the number of household members, education, income, and assets and liabilities. The physical characteristics included the physical environment of the residence—that is, the area and form of the residence, and the age of the building. The physical-environmental characteristics included the aforementioned 13 items.
Using these methods, this study aimed to comprehensively examine each factor affecting the overall satisfaction with the local residential environments, as evaluated by households that had completed migration to or from Seoul. Table 2 presents the variables used in the analysis.
Table 2.
General characteristics of respondents.
3.2. Research Models and Methods
The model used to quantitatively compare the physical-environmental satisfaction levels of the migration destinations, and to examine the overall residential satisfaction and the factors affecting it, is described below.
First, a one-way analysis of variance (ANOVA) was conducted on the 13 variables in Table 1, in order to compare differences among the four groups for each of the independent variables. In ANOVA tests, large f-statistics indicate differences among the groups. The formula used is as presented below:
where MSB stands for the mean square due to differences between the groups, MSW refers to the mean square due to error (within group, the residual mean square), and MSB and MSW are the sum of the squares (MSB, MSW) divided by the degree of freedom (), as follows:
It is possible to obtain each sum of squares . Specifically, since the addition of all of the sums of squares equals 0, the total sum of squares equals the sum of and , as follows:
After a between-group comparison of the 13 variables, as noted above, a regression analysis was conducted in order to explore the overall residential satisfaction levels of the sample, and the related factors. The analysis included individual, residential, and physical-environmental characteristics, which have different attributes, as independent variables. Hence, stepwise regression was used in order to evaluate the increase or decrease in the model’s explanatory power by gradually inputting each variable. This method has advantages in that the effect of each group can be examined by a stepwise input of each independent variable group, because the characteristics of the independent variable groups differ across the socioeconomic and land-use fields [44]. Additionally, this method makes it possible to identify the factors and variables that have the greatest influence on a particular phenomenon by including residential and socioeconomic characteristics [45]. This approach uses the same method as multiple regression, but differs in that it observes the change in explanatory power via the stepwise inputs of each variable group. This study interpreted the analysis results by inputting the variable groups in Table 2 into the regression model. The formula used for each regression analysis is as follows:
where Yi is the ith observation of the dependent variable, is the intercept, represent the slope coefficient for each independent variable, and is the error term for the ith observation. F, which measures the overall significance of the regression model, was calculated as follows:
where R2 is the residual sum of squares and the sum of the squared estimate of errors. In addition, MSR refers to the regression mean square, and MSE represents the mean square error. As the R2 value increases, the independent variables increase in importance. In the multiple regression, R2 was used as the criterion for the selection of the independent variable (see Equation 7). The variance inflation factor (VIF) was used in order to measure the multicollinearity between the independent variables:
where R2 denotes the R-square, refers to the total sample size, and is the number of predictors. With regard to explanations and interpretations, it is common in regression analyses to use factor analysis in order to reduce the factors, and thereby understand their trends and improve the model’s goodness of fit. However, except for [46] and [47], individual policies, characteristics, or evaluation indicators are typically used as independent variables in order to interpret each result when a regression model is used to study residential mobility. This process may be considered to be a research method that focuses on the interpretation of the results, rather than the model’s goodness of fit.
4. Results
4.1. Comparison of the Results for Residential Environment Satisfaction Evaluation by Type
This study compared residence and residential environment satisfaction levels among the following four groups: those having migrated from Seoul to Gyeong-in and vice versa, and groups that migrated within Seoul and Gyeong-in. The between-group comparison indicated whether the evaluations of residents in Gyeong-in confirmed the assumption of relatively insufficient infrastructure in such areas. It also had potential as a measure and basis for the establishment or improvement of relevant policies in terms of future population dispersion or balanced regional development.
The between-group sample consisted of 1451 households that migrated from Seoul to Gyeong-in, 460 households that migrated within Seoul, 1127 households that migrated from Gyeong-in to Seoul, and 2796 households that migrated within Gyeong-in. Figure 2 presents the means of the four groups for the 14 variables. Security-related items had the highest levels of postmigration satisfaction, indicating a tendency to be satisfied with the status of crime or pedestrian conditions. Relatively high scores were seen for accessibility to public facilities (facility accessibility), environmental variables (garbage collection, cleanliness around residential areas), and relations with neighbors. Compared to other variables, items related to facilities (cultural and parking facilities) and environmental variables (level of noise) had relatively low levels of satisfaction.
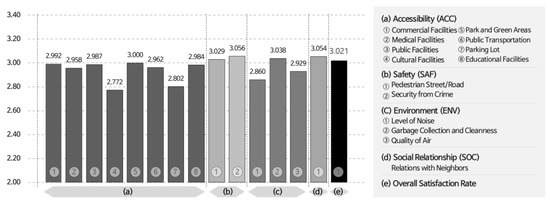
Figure 2.
Total means for each satisfaction level item (including both Seoul and Gyeong-in).
Figure 3 shows the one-way ANOVA results for all 14 variables. General differences are seen in the mean of each item in the four regions. However, a Scheffé test showed no statistically significant interregional differences in respondents’ satisfaction levels regarding the accessibility to parking facilities (2.772), security and crime (3.056), educational facilities (2.984), the accessibility to parks and green areas (3.000), and relations with neighbors (3.054). Interregional differences were observed for the remaining variables.
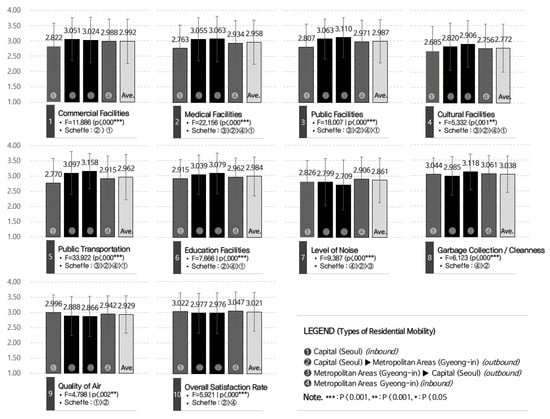
Figure 3.
Comparison of mean satisfaction levels by region (ANOVA).
Figure 3 offers several interesting insights. In terms of the accessibility to each facility, the satisfaction of respondents who migrated from Gyeong-in to Seoul was higher compared to the other groups. In particular, this group had the highest level of satisfaction with accessibility to medical and public facilities, and public transportation. Respondents who migrated from Seoul to Gyeong-in had lower levels of satisfaction, followed by those whomigrated within Gyeong-in, and those who migrated within Seoul. As for accessibility to commercial facilities, households that migrated to Gyeong-in had higher levels of satisfaction than the other groups; however, this difference was not statistically significant.
Satisfaction with the accessibility of public and cultural facilities, and of public transportation among major residential facilities was the highest among households that migrated from Gyeong-in to Seoul. The respondents who had migrated from Seoul to Gyeong-in had the second-highest level of satisfaction, indicating differences between the two groups. The accessibility of cultural facilities also showed satisfaction levels in a similar range. Specifically, the satisfaction levels from highest to lowest were as follows: respondents who migrated to Seoul, those who migrated to Gyeong-in, and those who migrated within Seoul. This indicates a tendency to perceive improvements in access to major facilities following migration from Gyeong-in to Seoul. The accessibility of educational facilities, which is considered to be a cause of migration within Seoul, also had the statistically highest value among respondents who had internally migrated, followed by those who had migrated within Gyeong-in, and those who had migrated from Seoul to Gyeong-in. This result highlights the current migration trends in South Korea. Furthermore, whilst they were statistically insignificant, the values for accessibility to parks and green areas were high for households that migrated within Gyeong-in, and from Seoul to Gyeong-in. This result points to the smaller urbanized areas of Gyeong-in compared to Seoul.
4.2. Comparison of the Regression Models for Inbound and Outbound Residential Mobility
This study used a regression model to analyze the factors that affect the overall satisfaction with the current area of residence compared to the previous area of residence, as evaluated by households that had completed a migration. The results were then analyzed in order to determine the economic and social characteristics, as well as the physical conditions, that affected the satisfaction levels of the migrated households. In this way, this study also aimed to identify areas that need improvement for the future sustainability of people’s lives post-migration.
The groups in this regression were the group that experienced outbound residential migration from Seoul to Gyeong-in and vice versa. In addition, in order to observe the general trend of residential mobility between Seoul and Gyeong-in, the researcher combined samples of the two groups and inputted them into the same statistical model. The results were compared and expounded, as presented in Table 3 and Table 4.
Table 3.
Standardized coefficients, t-statistics, and p-values of the regression analysis (Model III).
Table 4.
Model summary (based on Model III).
The results showed an increase in the explanatory power of the three regressions from Model I to Model III. The explanatory power increased the most when the independent variables of the physical-environmental characteristics of group III were inputted into the model (see Table 4). Likewise, the Durbin–Watson value was close to 2, but not to 0 or 4, indicating that there was no correlation between the residuals; hence, the goodness of fit for each regression model was considered adequate. However, the individual characteristics, which were the first variables added to the regression model, did not significantly affect the three models. The researcher interpreted this result as an indication that the age, education level, income, assets, or liabilities of the respondents did not affect their satisfaction with their residences. This finding differs from previous studies. Although the independent variables included in the physical-environmental and residential characteristics were found to affect residence satisfaction levels, the results differed depending on the type of residential migration, as described below.
First, the results of the ‘overall’ model (see Table 4 (a)), where the samples for all of the residential migration between Seoul and Gyeong-in were inputted into the model, are summarized as follows. Regarding the physical characteristics of residences, building age (t = −6.778, p = 0.000) and ownership type (t = 5.056, p = 0.000) were found to significantly affect the dependent variables. This could suggest that, in residential migration, owning relatively new housing positively affects the satisfaction with the residential area. Consider that the number one reason for residential migration in South Korea is to find housing with better infrastructure (approximately 20.55%), while the number three reason is to purchase one’s own house (14.05%). This study’s findings regarding migration between Seoul and Gyeong-in might be considered to reflect similar tendencies. In addition, with regard to physical-environmental accessibility characteristics, the accessibility to parking facilities (t = 2.942, p = 0.000) and public facilities (t = 2.810, p = 0.000) were found to affect satisfaction levels. Satisfaction with security in residential areas (t = 6.087, p = 0.000) was found to lead satisfaction levels in the area of safety. As for the environment of residential areas, the local cleanliness (t = 3.972, p = 0.000) and air quality (t = 3.599, p = 0.000) were found to affect the dependent variables. Concerning the social aspect, relations with neighbors (t = 4.979, p = 0.000) had relatively high values, indicating that a combination of the residential area and the surrounding environment affects residential satisfaction.
Second, for all of the survey items, households that moved from Seoul to Gyeong-in showed the same results as the total sample (as mentioned above). However, some of the results were different from those obtained for the households that had migrated from Gyeong-in to Seoul. Specifically, as for residential characteristics, the building’s age still affected respondents’ satisfaction, but leasing or purchasing a house did not affect the dependent variables. Such results should be interpreted bearing in mind that the rate of homeownership in Seoul (42.7%) is low compared to the national average (58.0%) and to Gyeong-in (56.85%). While the percentage of respondents residing in houses costing more than KRW 600 million is the highest in Seoul (38.3%), in Gyeong-in, it is very low (7.3%). In fact, in Gyeong-in, the proportion of houses costing in the range of KRW 200 million to KRW 600 million is the highest (approximately 31%) [48]. That is, given that the pursuit of transportation and convenience facilities is a main factor influencing residential migration to Seoul, it can be assumed that purchasing a house does not affect the satisfaction with the residential area. Nevertheless, the analysis showed that the independent variables that statistically affected the dependent variables were limited to the accessibility to cultural facilities and the air quality, while other independent variables were not significant. Such results may be interpreted to mean that there are discrepancies in the reasons for residential migration to Seoul, as well as the accompanying residential satisfaction.
5. Conclusions and Discussion
In order to examine the relationship between residential mobility and QOL, this study analyzed a survey of households that had migrated from the capital city (Seoul) to metropolitan areas (Gyeong-in), or vice versa, in South Korea. This study examined satisfaction with the current location of residence compared to the previous location, and with facilities and environments, as well as the demographic, physical, and environmental factors that affected satisfaction. The results can be summarized as follows. First, overall satisfaction with cultural facilities, parking facilities, noise, and air quality was lower than satisfaction with the accessibility to other facilities and the residential environment. These results can be understood in terms of the generally high levels of urbanization and housing density in Seoul (and the accompanying characteristics of noise, air quality, parking facilities, and so on) compared to the surrounding areas.
Second, there were differences in satisfaction regarding the accessibility to convenience facilities and the environment, depending on the direction of residential migration. Satisfaction with infrastructure (e.g., medical facilities, public facilities, cultural facilities, public transportation) was higher among those who migrated from Gyeong-in to Seoul than in those who migrated from Seoul to Gyeong-in. Meanwhile, the satisfaction with noise and air quality was higher among those who migrated to Gyeong-in. Nevertheless, there was no statistically significant difference in the residential satisfaction between the two groups. For inbound migration within Seoul, there was lower satisfaction with commercial, medical, public, cultural, transportation, and educational areas, among others.
Third, the infrastructure accessibility and residential environment factors showed differences between the groups. Those who migrated from Seoul to Gyeong-in had higher satisfaction with the residential area when they lived in newer houses and were homeowners. Furthermore, the satisfaction with public facilities, parking lots, security, local cleanliness, and hygiene, as well as relations with neighbors, contributed to overall satisfaction. However, migrating from Gyeong-in to Seoul, where housing prices are relatively high, did not directly affect satisfaction levels. This is likely to be because the main reasons for such migration were better transportation accessibility and infrastructure, as well as closer proximity between home and work. Nevertheless, cultural and public facilities, including education and transportation, were statistically irrelevant to satisfaction with housing and residential areas. Previous studies have identified these as key factors that affect residence migration. This highlights the differences between South Korea and the regions investigated in the other studies.
This study’s findings suggest that plans and policies should seek to reinforce the accessibility to infrastructure in the metropolitan areas and provincial cities, while also focusing on security, the environment, and social factors in order to improve residents’ QOL. Meanwhile, for those who reside in or have just moved to Seoul, policies should be established to stabilize the housing prices. This is because the high price of housing is currently cited as the greatest burden for consumers. It is also necessary to develop policies that aim to mitigate negative environmental factors, such as noise and air quality.
This study has certain limitations. First, the data were limited, since the national statistics merge Gyeong-in with Seoul. However, considering that relatively large numbers of samples can be used to produce research results that are acceptable as being population based, and that governments are currently producing new data for research, it is anticipated that—in the future—more accurate investigations will be possible. Moreover, this study did not have data on the specific reasons for each sample’s residential migration. This had to do with the regulations related to acquiring data from government agencies. If such data can be collected in the future, it will help to improve the interpretations of results. Despite such limitations, this study is significant because it selected objective indicators and data for knowledge sharing between countries and cities regarding residential mobility. Moreover, it investigated the movement between a capital and its metropolitan areas, focusing on the economy, society, and culture of a country that has recently drawn much research attention.
Funding
This research received no external funding.
Conflicts of Interest
The author has no conflicts of interest to declare.
References
- Short, J.R. Residential mobility. Prog. Hum. Geog. 1978, 2, 419–447. [Google Scholar] [CrossRef]
- Wang, F.; Wang, D. Changes in residential satisfaction after home relocation: A longitudinal study in Beijing, China. Urban Stud. 2020, 57, 583–601. [Google Scholar] [CrossRef]
- Henley, A. Residential mobility, housing equity and the labour market. Econ. J. 1998, 108, 414–427. [Google Scholar] [CrossRef]
- Petzold, K. Mobility experience and mobility decision-making: An experiment on permanent migration and residential multilocality. Popul. Space Place 2017, 23, e2065. [Google Scholar] [CrossRef]
- Speare, A. Residential satisfaction as an intervening variable in residential mobility. Demography 1974, 11, 173–188. [Google Scholar] [CrossRef]
- Clark, W.; Deurloo, M.; Dieleman, F. Residential mobility and neighbourhood outcomes. Housing Stud. 2006, 21, 323–342. [Google Scholar] [CrossRef]
- Oishi, S.; Lun, J.; Sherman, G.D. Residential mobility, self-concept, and positive affect in social interactions. J. Pers. Soc. Psychol. 2007, 93, 131. [Google Scholar] [CrossRef]
- Nowok, B.; Findlay, A.; McCollum, D. Linking residential relocation desires and behaviour with life domain satisfaction. Urban Stud. 2018, 55, 870–890. [Google Scholar] [CrossRef]
- Waddell, P. Accessibility and residential location: The interaction of workplace, residential mobility, tenure, and location choices. In Lincoln Land Institute TRED Conference; Lincoln Institute of Land Policy: Cambridge, MA, USA, 1996. [Google Scholar]
- Wu, W. Migrant intra-urban residential mobility in urban China. Hous. Stud. 2006, 21, 74–765. [Google Scholar] [CrossRef]
- Brummell, A.C. A model of intraurban mobility. Econ. Geogr. 1979, 55, 338–352. [Google Scholar] [CrossRef]
- Jiang, W.; Feng, T.; Timmermans, H.; Li, H. A gap-theoretical path model of residential satisfaction and intention to move house applied to renovated historical blocks in two Chinese cities. Cities 2017, 71, 19–29. [Google Scholar] [CrossRef]
- Jia, X.; Lei, J. Residential mobility of locals and migrants in northwest urban China. Sustainability 2019, 11, 3507. [Google Scholar] [CrossRef]
- Hui, E.C.M.; Yu, K.H. Residential mobility and aging population in Hong Kong. Habitat Int. 2009, 33, 10–14. [Google Scholar] [CrossRef]
- Chen, J. Housing tenure, residential mobility and adolescents’ education achievement: Evidence from Sweden. Ann. Reg. Sci. 2013, 50, 275–294. [Google Scholar] [CrossRef]
- Goldscheider, C. Differential residential mobility of the older population. J. Gerontol. 1966, 21, 103–108. [Google Scholar] [CrossRef]
- Government, S.M. Population Trend in Seoul (Resident Registration Population) Statistics. Available online: http://data.seoul.go.kr/dataList/418/S/2/datasetView.do (accessed on 10 March 2020).
- Gyeonggi-do Gyeonggi Statistics. Available online: https://stat.gg.go.kr/statgg/tblInfo/mainStats.html (accessed on 15 July 2020).
- Jang, S.; Oh, J.; Kim, S. The main factors of residential mobility and household characteristics in metropolitan area-focused on Seoul and Gyeong-in area. J. Archit. Inst. Korea Plan. Des. 2020, 36, 125–135. [Google Scholar]
- Jang, J.H.; Kwon, Y.S. Change pattern of residential areas in Seoul: Based on detached houses case studies between 2000 and 2010. Archit. Res. 2017, 19, 35–43. [Google Scholar]
- Rabe, B.; Taylor, M. Residential mobility, quality of neighbourhood and life course events. J. R. Stat. Soc. A. Stat. 2010, 173, 531–555. [Google Scholar] [CrossRef]
- Rossi, P.H. Why Families Move: A Study in the Social Psychology of Urban Residential Mobility; Free Press: New York, NY, USA, 1955. [Google Scholar]
- Winstanley, A.; Thorns, D.C.; Perkins, H.C. Moving house, creating home: Exploring residential mobility. Housing Stud. 2002, 17, 813–832. [Google Scholar] [CrossRef]
- Seek, N.H. Adjusting housing consumption: Improve or move. Urban Stud. 1983, 20, 455–469. [Google Scholar] [CrossRef]
- Morris, T. Examining the influence of major life events as drivers of residential mobility and neighbourhood transitions. Demogr. Res. 2017, 36, 1015–1038. [Google Scholar] [CrossRef]
- Porell, F.W. Intermetropolitan migration and quality of life. J. Regional Sci. 1982, 22, 137–158. [Google Scholar] [CrossRef] [PubMed]
- Liu, A. Residential satisfaction in housing estates: A Hong Kong perspective. Automat. Constr. 1999, 8, 511–524. [Google Scholar] [CrossRef]
- Lee, B.A.; Oropesa, R.S.; Kanan, J.W. Neighborhood context and residential mobility. Demography 1994, 31, 249–270. [Google Scholar] [CrossRef] [PubMed]
- Wang, D.; He, S.; Webster, C.; Zhang, X. Unravelling residential satisfaction and relocation intention in three urban neighborhood types in Guangzhou, China. Habitat Int. 2019, 85, 53–62. [Google Scholar] [CrossRef]
- Heaton, T.; Fredrickson, C.; Fuguitt, G.V.; Zuiches, J.J. Residential preferences, community satisfaction, and the intention to move. Demography 1979, 16, 565–573. [Google Scholar] [CrossRef]
- Gerber, P.; Ma, T.-Y.; Klein, O.; Schiebel, J.; Carpentier-Postel, S. Cross-border residential mobility, quality of life and modal shift: A Luxembourg case study. Transport. Res. Part A Pol. 2017, 104, 238–254. [Google Scholar] [CrossRef]
- Vorel, J.; Franke, D.; Šilha, M. The transportation accessibility and residential mobility in the Prague Metropolitan Area. In 2016 Smart Cities Symposium Prague (SCSP); IEEE: Prague, Czech Republic, 2016; pp. 1–6. [Google Scholar]
- Chen, Y.; Dang, Y.; Dong, G. An investigation of migrants’ residential satisfaction in Beijing. Urban Stud. 2020, 57, 563–582. [Google Scholar] [CrossRef]
- Larson, A.; Bell, M.; Young, A.F. Clarifying the relationships between health and residential mobility. Soc. Sci. Med. 2004, 59, 2149–2160. [Google Scholar] [CrossRef] [PubMed]
- Atkins, M.T. “On the move, or staying put?” An analysis of intrametropolitan residential mobility and ageing in place. Popul. Space Place 2018, 24, e2096. [Google Scholar] [CrossRef]
- Basolo, V.; Yerena, A. Residential mobility of low-income, subsidized households: A synthesis of explanatory frameworks. Housing Stud. 2017, 32, 841–862. [Google Scholar] [CrossRef]
- Fattah, H.A.; Badarulzaman, N.; Ali, K. Neighborhood quality assessment: A view of tenure ownership and mobility decisions in Penang, Malaysia. Plan. Malaysia 2020, 92–101. [Google Scholar]
- Bonaiuto, M.; Fornara, F. Residential satisfaction and perceived urban quality. Enc. Appl. Psychol. 2004, 3, 267–272. [Google Scholar]
- Wang, F.; Mao, Z.; Wang, D. Residential relocation and travel satisfaction change: An empirical study in Beijing, China. Transport. Res. Part A Pol. 2020, 135, 341–353. [Google Scholar] [CrossRef]
- Kwan, M.-P. The limits of the neighborhood effect: Contextual uncertainties in geographic, environmental health, and social science research. Ann. Am. Assoc. Geogr. 2018, 108, 1482–1490. [Google Scholar] [CrossRef]
- Abdullah, M.I.; Abidin, N.Z.; Basrah, N.; Alias, M.N. Conceptual framework of residential satisfaction. Environ.-Behav. Proc. J. 2020, 5, 229–235. [Google Scholar] [CrossRef]
- Crutchfield, R.D.; Geerken, M.R.; Gove, W.R. Crime rate and social integration the impact of metropolitan mobility. Criminology 1982, 20, 467–478. [Google Scholar] [CrossRef]
- Baker, E.L. Public Housing Tenant Relocation: Residential Mobility, Satisfaction, and the Development of a Tenant’s Spatial Decision Support System. Doctoral Thesis, University of Adelaide, Adelaide, Australia, 2002. [Google Scholar]
- Vila, M.; Pujadas, J.P. Land-use and socio-economic correlates of plant invasions in European and North African countries. Biol. Conserv. 2001, 100, 397–401. [Google Scholar] [CrossRef]
- Sheets, D.; Mubayi, A.; Kojouharov, H.V. Impact of socio-economic conditions on the incidence of visceral leishmaniasis in Bihar, India. Int. J. Environ. Heal. R. 2010, 20, 415–430. [Google Scholar] [CrossRef]
- Varady, D.P. Determinants of residential mobility decisions the role of government services in relation to other factors. J. Am. Plann. Assoc. 1983, 49, 184–199. [Google Scholar] [CrossRef]
- Clark, W.A.; Huang, Y.J.E. The life course and residential mobility in British housing markets. Environ. Plann. 2003, 35, 323–339. [Google Scholar] [CrossRef]
- Korea Housing Survey. Available online: http://stat.molit.go.kr/portal/cate/statFileView.do?hRsId=327 (accessed on 10 March 2020).


Publisher’s Note: MDPI stays neutral with regard to jurisdictional claims in published maps and institutional affiliations. |
© 2020 by the author. Licensee MDPI, Basel, Switzerland. This article is an open access article distributed under the terms and conditions of the Creative Commons Attribution (CC BY) license (http://creativecommons.org/licenses/by/4.0/).