Article

Art-Science Collaborative Competencies: A Mixed-Methods Pilot Study for Improving Problem Solving for Sustainability Challenges

by
Edgar Cardenas
1,* and
Sandra L. Rodegher
2
1
Center for Interdisciplinarity, Michigan State University, East Lansing, MI 48824-1032, USA
2
College of Engineering, Boston University, Boston, MA 02215, USA
*
Author to whom correspondence should be addressed.
Sustainability 2020, 12(20), 8634; https://doi.org/10.3390/su12208634
Submission received: 15 September 2020 / Revised: 7 October 2020 / Accepted: 10 October 2020 / Published: 18 October 2020
(This article belongs to the Special Issue Collaboration for Sustainability)

Abstract

:
The complexity and interconnectedness of sustainability issues has led to the joining of disciplines. This effort has been primarily within the sciences with minimal attention given to the relationship between science and art. The exclusion of art is problematic since sustainability challenges are not only scientific and technical; they are also cultural, so the arts, as shapers of culture, are critical components that warrant representation. Hence, it stands to reason that understanding art-science integration will benefit sustainability’s focus on use-inspired basic research. In this paper, we focus on artist-scientist team dynamics and the impact of those team dynamics on the quality of their outputs, in service of gleaning insight into how interdisciplinary teams can better work together to address sustainability challenges. In other words, we ask the question “How do art-science teams reason together, validate ideas, and produce robust outcomes when facing a task related to complex socio-ecological systems, which sit at the crux of sustainability challenges?” To address this question, we conducted a small-group pilot study of artist-scientist teams tasked with developing interpretive signage for the Tres Rios wetland site. We collected survey and ethnographic data to account for intra- and interpersonal interactions in teams. Specifically, this study focuses on variables we call barriers or carriers, which aid or hinder the collaborative interactions of deeply diverse teams. We found that successful art-science collaborations appear to result in improved communication skills, better problem articulation, more creative problem solving, and the questioning of personal and disciplinary mental models.

1. Introduction

Interdisciplinarity has become a cornerstone of sustainability. However, the focus of interdisciplinary collaboration has remained firmly rooted in the sciences, rarely integrating artistic or humanist perspectives [1,2]. However, there is widespread recognition that sustainability challenges require scientific, technical, and cultural solutions [2,3,4,5]. Since these solutions must account for the complexity of sustainability problems, we have to look beyond solely scientific approaches [6] and focus on solutions that couple empirical and cultural approaches to tackle the challenges we are facing [7]. Additionally, the arts should not only be characterized simply as reflectors and shapers of culture [2,7], but acknowledged as catalysts for scientific breakthroughs and social change [8,9,10,11,12]. This call for joining the arts and sciences to address sustainability challenges has been occurring for decades, with the idea of bridging this art-science divide going back even farther. One of the most commonly cited examples is the physical chemist and novelist C. P. Snow’s highly influential, Two Cultures, an extended essay about the reintegration of the sciences with arts and humanities, one of the most widely discussed examples regarding this cultural divide [13]. Sitting in both worlds, he noted the fact that scientists and humanists lived and worked in different academic cultural contexts. Bridging this gap, he argued, would enrich both communities. However, this intersection will not only enrich sustainability, it is necessary for addressing the complex challenges we face [5].
Indeed, what makes the worlds of artists and scientists complementary is the differing ways they interrogate, explore, and understand the world; intersecting the two increases the explanatory power of their findings. Specifically, art-science collaborations lead to: more robust idea translation [9]; contribute to hot cognition [14], problem engagement that incorporates both the affective and empirical nuances of the challenge; and problem identification, generation, and framing [15,16,17]. However, the differences that make their collaborations fruitful also contain a collaborative and integrative challenge, yet the methods for bridging these epistemological and ontological divides have received minimal attention in sustainability [18]. Attention must be placed on these collaborative and integrative challenges that these diverse teams face. Specifically, we must understand the collaborative mechanisms that help art-science teams reason together, validate ideas, and produce robust outcomes for sustainability challenges. Programs like the National Science Foundation’s Convergence Accelerator, which aims at intersecting scientists in academia with the business sector in an effort to have a positive impact on society [19] have taken collaborative capacity building seriously. All awardees must enroll in curriculum that places team dynamics at the center of their training. If they are to have a positive impact, first they must understand how to collaborate and how to intersect and ultimately integrate the diverse perspectives held by team members. Likewise, sustainability is about having a positive impact on the world. It follows that these interdisciplinary collaborators must understand how to work together and that attention must be paid to that process so that they may be successful at tackling the sustainability challenges they are addressing.
The foundation of this study aims at this goal by attending to the challenges artists-scientists collaboratives may face when working to address sustainability challenges. In what follows, we first present a framework from which to understand art-science collaboration and then test its efficacy via a pilot study that employs three-person artist-scientist teams tasked with the development of informational signage for the Tres Rios wetland site in Phoenix, Arizona. Ultimately, this study explores how specific enabling conditions and collaborative characteristics and dynamics can be critical to the production of creative outcomes by teams.

1.1. Components and Conditions for Creative Collaborations

One of the main goals for encouraging artists and scientists to collaborate on sustainability challenges is to emphasize creative approaches that work to reframe problems and elicit creative ideas that increase the robustness and resilience of socio-ecological solutions. This team-oriented approach to creativity aligns with sociocultural models which are characterized by their collaborative approaches to their generation of creative products [20,21,22]. Unlike individual creativity, team creativity is compounded by the interactions members engage in to produce an outcome. These complex and emergent interactions [23,24] require that research account for enabling collaborative conditions, individual member characteristics, and member interactions. This means that when studying creative teams: (1) you have to facilitate a collaborative environment that promotes team engagement, and (2) you must account for the intra- and interpersonal interactions that unfold in these teams. In this paper we divide these characteristics into enabling conditions for collaboration and barriers or carriers for successful interactions. These variables ultimately aim at increasing integration between diverse knowledge sets and, most importantly, fostering creative perception, which is characterized as the act of finding connections between ideas and concepts that may appear disparate and unconnected at first glance [20,25]. This is particularly important for artist-scientist collaborations since their expertise and working methods differ dramatically. Hence, finding ways to connect artistic and scientific perspectives becomes imperative.

1.1.1. Enabling Conditions for Collaboration

Enabling conditions for collaboration help facilitate group processes at the onset of their formation. Ideally, condition settings at the beginning of a collaboration provide fertile ground for member engagement. In this study, we manipulate three key enabling conditions that are critical to art-science collaborations: team diversity, boundary objects, and the establishment of group norms. Though these variables are often set organically within groups, we facilitated these at the onset of the project due to the abridged time frame in this project. Diversity, boundary objects, and group norms push the group to create positive momentum in the early phases where investment is low and group cohesion is tenuous.
Team Diversity. Team diversity refers to the inclusion in the team of differing perspectives, ideas, expertise, experiences, and epistemologies. These elements fall into 2 categories: (1) domain-relevant skills and (2) creativity-relevant processes. Domain-relevant skills include factual knowledge of a particular domain, technical skills (laboratory or studio art skills), and “talents” [26]. Creativity-relevant processes are the mechanisms by which the group synthesizes ideas and uses its diversity of domain-relevant skills to produce novel outcomes.
Boundary Objects. Boundary objects are physical or metaphorical objects that all group members can engage with. The use of these objects is a productive method for creating conversation in service of bridging the interdisciplinary divide, especially between artists and scientists [27]. For example, the University of Arizona used the Rillito River as a boundary object, inviting scientists and artists to respond to the river in their own ways. The result was a collection of perspectives all related but unique in outlook that created a richer dialogue about water in the desert [28]. Because boundary objects are flexible enough to adapt to different contexts and users but rigid enough that they facilitate shared meaning, they can help in “developing and maintaining coherence across intersecting social worlds” [29]. Halpern notes that these objects serve as “visual metaphors” that bridge the fields of art and science and that they “can indicate a set of ideals, rules, or principles shared across disciplinary boundaries.” [30] (p.14). Ultimately, through orienting shared group tasks around boundary objects, collaborators create a meeting place for diverse perspectives to come together.
Group Norms for Collaboration. Finally, the establishment of group norms and goals are critical for working collaboratively. Team members may have high, problem-relevant expertise but, in the absence of agreed upon working norms, they can perform more poorly than teams with less expertise [31,32]. Providing a framework of group norms can lessen ambiguity and minimize the drain on cognitive capacity during the early parts of group formation, allowing the group to focus on more productive interactions.

1.1.2. Barriers or Carriers to Success

Once enabling conditions are established and teams begin working together, dynamics related to their interactions and the goals of the collaboration continue to evolve. We identify four key variables that must be accounted for in group interactions: participation, collective efficacy, conflict, perspective taking. These variables we characterize as barriers or carriers. They operate as barriers to creative interdisciplinary collaboration when they hinder collaboration, i.e., low levels of participation, low collective efficacy, high conflict, or lack of perspective taking. They operate as carriers when they foster collaboration, i.e., high participation, high collective efficacy, appropriate conflict, and consistent perspective taking. Additionally, these variables have a high degree of interplay. For instance, a group with a high degree of participation can generally withstand a higher degree of conflict than a group with lower levels of participation [33].
Participation. Active participation signals to group members the level of commitment and intention by individuals. We measure it in two ways: (1) curiosity questions (questions team members ask each other motivated by interest in each other’s work) and (3) task motivation. Acts of curiosity have been positively correlated with job performance [34], and although the literature is split on this finding [35], curiosity may be particularly important to art-science collaborations as a mechanism for signaling interest in each other’s research. Task motivation is defined as the reason people undertake and stick with a task through completion [26].
Collective Efficacy. Perhaps the most crucial component woven into the entire process is the trust exhibited by the group (e.g., Golembiewski and McConkie, 1975; Kramer, 1999). We focus specifically on a expert trust that occurs within groups, called collective efficacy. Collective efficacy is the belief that team members have the necessary capabilities required for accomplishing a goal [36].
Perspective Taking. A significant challenge for interdisciplinary teams is catalyzing perspective taking, which entails understanding the thoughts, motivations, assumptions, and feelings of fellow members [37]. Perspective taking in teams can increase creativity, especially if it emerges through continual interactions and dialogue [38]. When working with individuals who do not share our perspectives, we often adopt simplistic and inaccurate assumptions about their perspectives [39,40]. Explicit attention to the differing perspectives of team members helps clarify those differences which is beneficial for team performance [41]. Two explicit mechanisms that aid in surfacing differing perspectives is the use of clarifying questions, or questions that seek further elaboration from the speaker about their ideas, and analogies, or acts of comparison between concepts in an effort to transfer information or meaning from a familiar concept and apply it to a new concept. Given the nuanced nature of analogies we categorized them as local (LA) or long-distance (LDA), each serving a different purpose [42]. Local analogies are often used when there is a specific (and often technical) problem. Long-distance analogies are used for explaining ideas more as an educational tool for broad understanding, like wetlands are the sponges of the natural world. In effect analogies are tools to leapfrog potential barriers to ongoing dialogue, create common ground, and open new pathways.
Conflict. Central to this study is understanding how team members work through the idea generation and validation process to produce creative ideas. The outcomes of these interactions are heavily influence by how teams manage interpersonal and task-oriented conflict, which affects how smoothly they move toward productive consensus [43,44]. Interpersonal conflict relates to tensions between individuals in the group. There is an inverse relationship with interpersonal conflict and creativity, so this form of conflict should be minimized. In task-oriented conflict the tension is directed and associated with specific project tasks in service of improving upon the project. There is a curvilinear relationship with task-oriented conflict and creativity, so moderate levels of this form of conflict support diverse perspectives and alternative pathways that lead to creative outcomes [44,45,46,47]. A central characteristic of dissenting views associated specifically with task-oriented conflict is the delaying of consensus and forcing a re-examination of the problem which aids in detecting novel solutions [48,49]. This is critical since one of the reasons teams fail to perform well on projects is a premature movement to consensus on a group task [33,50]. Hence, conflict is not inherently problematic but should focus on tensions associated with the work versus team members.

1.1.3. Ongoing Creative Negotiations: Creative Perception and Consensus

Ongoing creative negotiations oscillate between eliciting acts of creative perception or aiding teams in making decisions that help foster consensus. Creative perception refers to the ability to connect seemingly disparate ideas in novel ways [25,26]. This allows groups or individuals to take unrelated situations, events, or concepts and join them or, alternatively, join familiar items in new and unexpected ways [26]. Hence, creative perception is a critical skill throughout the collaborative process for artist-scientist teams that are working to connect disparate ideas in multifaceted and layered ways. Furthermore, it is a skill that helps teams identify when it is a good time to reach consensus, helping to manage the tension between reaching premature consensus that leads to mediocre outcomes or delaying consensus longer than necessary.
Taken in its entirety our approach ultimately looks to create opportunities for developing novel approaches to intersecting the cultural and empirical (art-science) and discernment around when ideas have been compellingly integrated. We believe that enabling conditions set the stage and barriers and carriers provide the interactions that lead to acts of creative perception and collective consensus, thus leading to creative outcomes.

1.2. The Present Study

Experimental or quasi-experimental evaluations of artist-scientist collaborations are a new, desirable, and promising direction for investigating the interactions, outcomes, and unintended outcomes of interdisciplinary teams [51,52]. These interactions are so complex that controlled studies lose their ability to give us an understanding of how emergent interactions unfold [21,42]. Given this complexity, researchers have expressed the need for in vivo studies that can help us better understand working dynamics [21,47,53]. We use a mixed-methods approach, collecting survey and ethnographic data to help us account for the intrapersonal perspectives of team members (surveys) and interpersonal interactions team members engage in during meetings (ethnographic observation).

1.3. Project Focus: Tres Rios Wetlands Signage

Sustainability research is “defined by the problems it addresses rather than by the disciplines it employs.” [6] (p. 1737). As such, these socio-ecologically complex challenges are often context-dependent and place-based. This requires researchers to be flexible and creative as they adjust their approaches to the uniqueness of the challenges they are addressing. Given these facts, this study was designed to address a complex but measurable sustainability-related task. Specifically, the City of Phoenix was seeking to create engaging signage for Tres Rios, a constructed urban wetland in the Sonoran Desert (Phoenix, Arizona) (See Figure 1). Tres Rios captures water from the 91st Avenue Wastewater Treatment Plant and then empties into the Salt and Gila River. As a result of the ecosystem services it provides—such as nutrient regulation, flood control, and wildlife habitat—it is a heavily researched site. Studies at Tres Rios involve biogeochemistry, ecohydrology, ecosystem ecology, information and ecosystems theory, sustainability science, urban ecohydrology, and wetland ecosystem ecology [54].
Recently, the City of Phoenix opened Tres Rios as a recreational area for the public and, as a result, was interested in developing interpretive signage for the site that educated visitors on the flora and fauna, the wetland ecosystem they were visiting, and the engineering involved in developing the site, which began in 1994.
The goal of this project was to develop a mockup of the signage that extended beyond education by helping visitors appreciate the space and learn about the broader ecological context. Kindergarten through 12th grade students were the target audience, but adults (and birders, in particular) visit the site often so the signs would ideally be of interest to a range of public audiences. The signage could include interactive, educational, aesthetic, and empirically focused designs that engaged visitors in dynamic ways.
Tres Rios contains unique characteristics that made it a suitable study site for this project. The site was built in response to a sustainability problem, waste creation and treatment, and the location contained complex socio-ecological factors that are a hallmark of sustainability problems. Additionally, the diversity of users who interacted with the space created a need for developing signage with an eye toward pluralism. Finally, the physical space provided artist-scientist teams with a boundary object, which provided space for interdisciplinary discussions that required each member’s expertise.

2. Materials and Methods

2.1. Study Participants

This study included 9 graduate students from Arizona State University (ASU). There were 3 male and 6 female participants. Study participants were recruited via convenience sample and selected based on three criteria: (a) enrollment in a graduate program, (b) interest in sustainability or environmental issues, and (c) identification as an artist or scientist. These criteria were meant to identify participants with domain-expertise and a diversity of perspectives related to the site. For example, we recruited ecologists who conducted research on aquatic systems. All four artists had worked on environmentally oriented projects and, therefore, were suited for grappling with the concepts they could develop for signage. Participants were split into three interdisciplinary triads, which are summarized below. Participants are described in terms of their specific discipline below. For the sake of clarity and simplicity, they are referred to in abbreviated terms in terms of gender and discipline (e.g., “FS” refers to female scientist, “FA” refers to female artist, etc.)
  • Team one (T1): two ecologists (FS and MS) and a ceramicist (FA)
  • Team two (T2): a ceramicist (FA), an intermedia artist (MA), and an ecologist (FS)
  • Team three (T3): two ecologists (FS and MS) and a printmaker (FA).
Two of the teams have scientists in the majority and one has artists in the majority. Each team consisted of two female and one male participant.

2.2. Procedures

Prior to team assignments, participants were given a 150 min tour of the Tres Rios site by a liaison from the city of Phoenix. This allowed them to orient themselves to the site and the project. After this initial orientation, participants were assigned to a group based on two criteria: (1) the need to have at least one scientist and one artist on each team, and (2) availability for scheduling meetings. Over the course of six months, each team met a total of four times for a period of one to three hours. With the exception of the site visit, all meetings were held on the ASU campus. Participants were given a suggested timeline and a variety of office supplies (e.g., easel, post-it notes, markers, pens) to facilitate their discussions. Participants were provided with a two-page document that contained an overview of Tres Rios, tips for collaboration, and suggested outcomes for each meeting. These primers were meant to accelerate progress and maintain group focus on advancing ideas. Beyond that, participants had complete autonomy in scheduling and facilitating their meetings and work flow. (A protocol for these meetings is provided in Appendix A) Survey and ethnographic data was collected for every group meeting.

2.3. Measures: Survey and Ethnographic Data

Survey. The survey data used for this study consisted of 7 collective efficacy questions (adapted from Schwarzer and Jerusalem [55]) scored on a 7-point Likert scale (1 = strongly disagree to 7 = strongly agree), and 7 open-ended questions (The survey questions are provided in Appendix B). The efficacy inventory assessed perceptions of competence for successfully accomplishing the project, e.g., the level of trust members had in each other’s expertise (“We can always manage to solve difficult problems”). The open-ended questions were meant to extract rich data on individual-level perception of team dynamics and contributions. Individuals completed the survey at the end of each meeting.
Ethnographic observations. Ethnography, as a method, began in anthropology but has been broadly adopted across the social sciences. Ethnography combines observation with comparative analysis in service of creating a rich, contextualized understanding of sociological events and phenomena [56]. This study uses a “purer” form of participant observation in that the researchers sought to simply observe rather than engage alongside other participants. The exception to this was when participants asked for clarification from the researchers. Participant observations for each meeting was captured via fieldnotes. Video recordings were taken at each meeting to support ethnographic field notes, allowing for reanalysis of data to account specifically for participation, perspective taking, conflict, consensus, and creative perception events.

2.4. Analytical Plan

Our principle goal was to understand how teams reasoned together, validated ideas, and ultimately produced a creative conceptual signage design for the Tres Rios Wetland site. We observed every meeting the teams held (12 in total), and collected surveys at the end of every meeting as well. Additionally, we video recorded every meeting, so that we could code for each variable of interest. For some variables, the data in the video was used for event counts. For example, “curiosity” was assessed via the number of times curiosity questions were asked. Video, alongside real-time observations, were also used to create rich descriptions, chronological narratives, and capture direct quotes from participants. Survey data was used in two ways. First, the open-ended questions were important to further providing context into participants thoughts and experiences, and getting information that they might have been uncomfortable stating out loud to the group. The collective efficacy was averaged at the individual and team level to obtain an overall “perception of collective efficacy score.” See Table 1 for additional detail on variable analysis methodology.
In what follows, we provide ethnographic summaries of each team’s performance over their four meetings. Second, we provided results for each variable that relates to team interactions. We aggregated many findings at the team level, but we also drilled down into individual results and across meetings to get a better understanding of the dynamics at play.

3. Results

3.1. Project Design Outcomes

The focus of this paper is on the interactions that lead to creative outcomes. However, in order to address who performed most successfully we must provide a ranking of team outcomes relative to the goal of disseminating interpretive signage. 
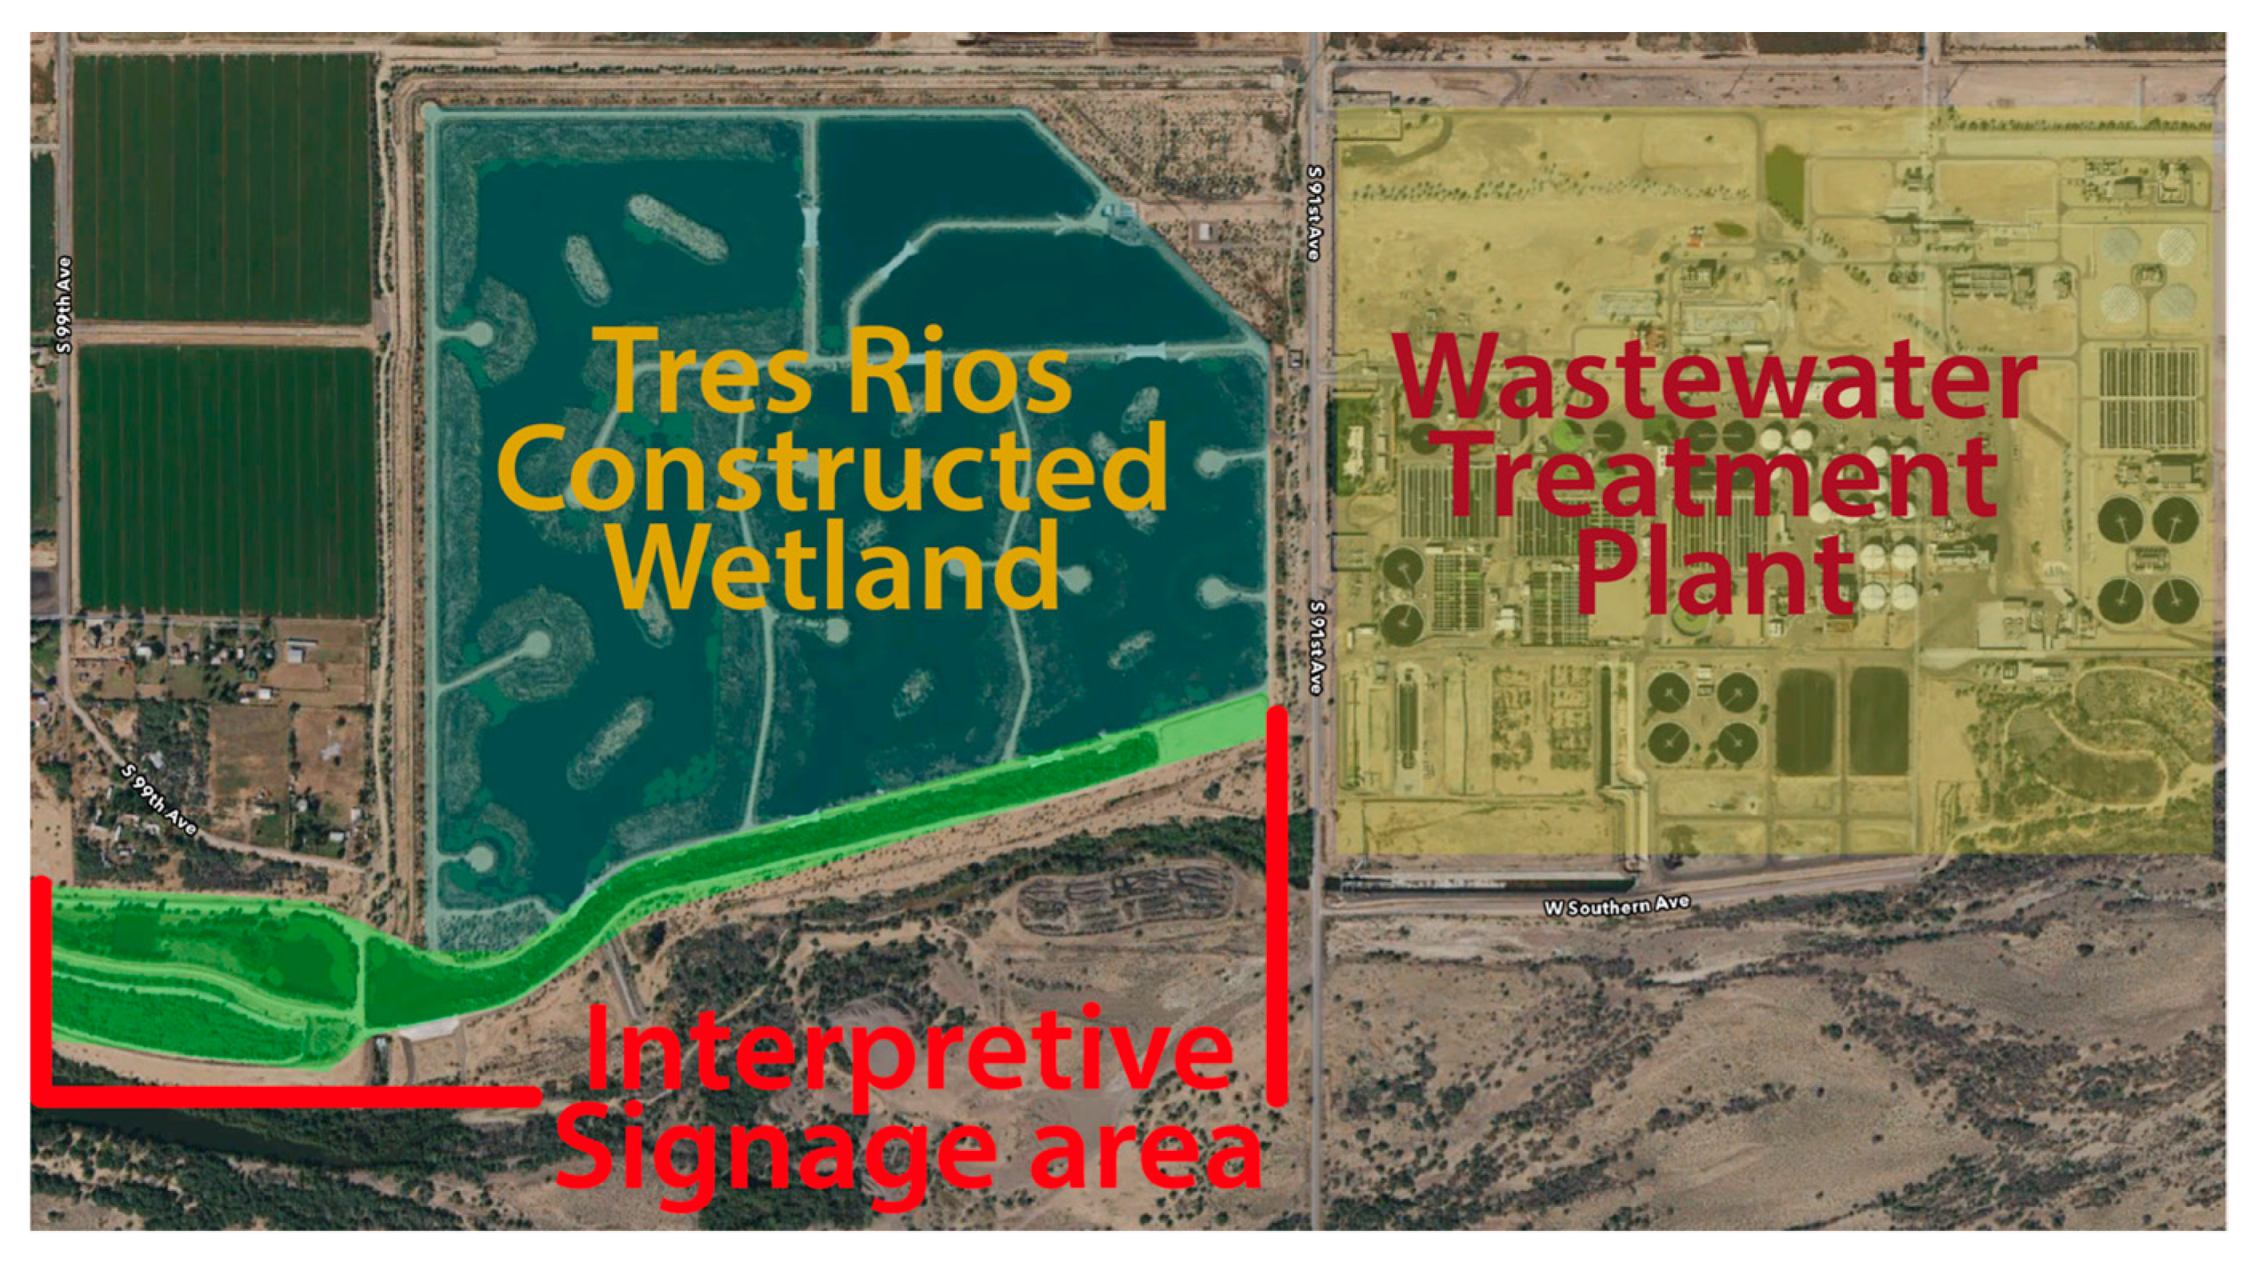
Interpretive signage refers to signs that provide visitors with site-specific information to enhances their direct experience with the landscape. In the case of the Tres Rios Wetland site, the only requirement was communicating how the wetland further ‘cleans’ the water that is discharged from the 91st Avenue Wastewater Treatment Plant. Our criteria for judging the creativity of the projects was based on the interdisciplinary complexity of each design and whether they (a) were scientifically correct (ecological accuracy (b) engaged artistic components beyond idea illustration (aesthetically compelling), and (c) extended the science and art beyond their disciplinary components (disciplinary integration). Rather than provide absolute scores, teams were assessed by the degree to which their signage met each of the three criteria—ecological accuracy, aesthetically compelling, and disciplinary integration—and then ranked accordingly. Team performance on the three criteria is reported in Table 2.
As noted in Table 2, all teams met the criteria of ecological accuracy. This is likely because every team had at least one wetland ecologist. As a result, all teams were able to clearly communicate the ecological dynamics at play at the wetland site, hence fulfilling the criteria of ecological accuracy. As such the following descriptions of team ranking focuses on their performance across the other two variables.
T3 ranked first. Their designs were ecologically informed, interactive, and connected to social components of the system. It was also the most refined project of the three. The team mocked up a 10-panel water narrative (see Figure 2 for a sample panel). They articulated the ecological component by focusing on the manner in which water arrives, is treated, and then departs Tres Rios—beginning in the White Mountains, traveling into Phoenix, and then exiting. Social science components were articulated via signs containing audio recordings of people connected to water at those specific locations in the narrative. The sign would potentially have a portrait for the person; a visitor could hear the interview by pressing a button on the sign.
T2 ranked second. They were good at connecting ecological, social, and interactive components as well. Instead of focusing on one location they designed for five locations along the trail. Each sign would have sections for flora/fauna, biogeochemical process/chemistry, past/future/present, why here/desert section, and an overhead map with a location marker. Additionally, the signs would have QR codes that would connect visitors to a site-specific Instagram or Twitter account so they could post their visit to the area. They produced excellent content for the signage but aesthetically they were very straightforward. While they did best with content, they missed the opportunity to develop compelling signage that would draw visitors into the rich content.
For T2’s interpretive signage mock-up, please see Figure 3. It should be noted that their mockup does not include written content. This is a common design practice where the framework for the design is built out first and then content is filled in based on client feedback. Thus, their ranking on this metric incorporates their meeting discussions of the ecological components they planned to incorporate alongside the conceptual framing provided in their mock up.
T1 ranked last out of the 3. They produced signage for a single location and focused on the ecosystem processes of the site (see Figure 4). They produced some interactive components like binoculars positioned at key areas for viewing birds in the wetland and a movable knob that visitors could move along the sign as they read about the processes water goes through as it travels from Phoenix to Tres Rios. However, the team did not engage in any culturally compelling components and the artistic components were simply illustrative, in service of adding to the ecology narrative.

3.2. Team Summaries

The purpose of this section is to provide rich descriptions of interactions in teams. As this paper argues for contextualized understanding of art-science team interactions, these chronological narratives, derived from analysis of video and ethnographic fieldnotes, provide a picture of the general arc and flow of the teams meetings and overall dynamics. This picture provides context for the variables that are discussed in great detail in Section 3.3. In what follows, meetings are abbreviated with “M” plus the meeting number, e.g., M1 is meeting 1, M2 is meeting 2, etc.

3.2.1. Team 1: Female Artist (FA), Female Scientist (FS), Male Scientist (MS)

M1: T1 take turns introducing themselves with the majority of the time dedicated to the MS and FS discussing their respective research projects. They then quickly transition into discussing Tres Rios. The group exhibits a dynamic early in M1 that repeats over the course of the remaining interactions as well. Specifically, the two scientists attempt to engage the artist early in the meeting but seem to have pre-conceived notions of what each member’s role is, with themselves as “expert” and her as “layperson.” This seems to influence how they engage her, often asking her pointed questions and then “correcting” her answers. For example, when they ask what she noticed as a first-time visitor to the Tres Rios site, she responds that it is the water in-flow site and they quickly correct her stating that it is not “technically” the actual wetland. This seems exacerbated by work styles: the FA exhibits a slower, reflective way of thinking through the project, while the FS and MS exhibit a style that focuses on rapid-paced decision-making, likely as a result of shared style and research backgrounds. The FS and MS slowly transition towards interacting primarily with each other and focus on the ecosystem processes they believe most relevant to the signage design.
M2 (+28 days): the two scientists move quickly to developing a plan of action, discussing where the water is coming from, types of plants, and habitat. Although they do not entirely ignore the FA, they tend to state the work they’d like her to do (e.g., aestheticize the concepts or illustrate the science) rather than elicit her input on conceptual development. This is also embodied, with the MS and FS taking turns sketching ideas on the whiteboard about system processes, which makes it difficult for the artist to participate. This activity is not malicious, but they appear over-eager to make the process work. For example, they would ask the FA simple questions such as “what was your first thought visiting the wetlands?” but they would not afford her the time to reflect and answer. By the end of the meeting, the two scientists formulate an idea they find creative and sketch out a design with minimal input from the FA.
M3 (+30 days): the FA brings in some of her plant cell inspired ceramic sculptures to share with the team during M3. The FS and MS spend a few minutes commenting about how interesting they are but do not ask any questions about the sculptures. For the rest of the meeting the two scientists work to draw consensus on the content they previously developed, with the MS primarily providing affirmation for the ideas the FS is putting forward. The FA continues to take a backseat to the FS and MS. For example, while looking at the system map the FS and MS designed as part of the process, they ask the FA questions such as: Does the order look good? Is there anything missing? Could anything be simplified? The FA mentions that the system map “is necessary” but she doesn’t elaborate. The MS and FS quickly move on.
M4 (+44 days): six weeks pass between M3 and M4. This delay causes them to use ¼ of the meeting to reorient themselves to the project. The meeting becomes stressful for each member as they struggle to make final decisions on who will design the final mockup. While the FS has led the project development and she and the MS have worked together to conceptualize the project, she now asks the FA to complete the design since she has artistic skills. After leaving room for minimal contribution from the FA over the course of the project, they now lean heavily on her at the end of M4 to complete the aesthetic design of the project.

3.2.2. Team 2: FA, MA, FS

M1: T2 worked to engage all members in active discussion. After introductions the MA took on a facilitative role. The FS asks if it is worth thinking about what the story of Tres Rios is. This sparks a conversation on what the multiple stories of the site might be. They discuss the history of water in the area, the waste treatment plant, and ideas about how water quality is interpreted. They continue sharing ideas regarding the ecological, social, and historical components of the area. Each member asks for clarification on ideas from team members, both to illuminate ecological and art-making processes. The FA comments that the signage should raise questions for visitors, both the FS and MA find it to be an interesting direction, and the MA adds that it would be good if it motivated visitors to contemplate water in the desert even as they were driving home. The team continues to engage in rich dialogue working off each other’s ideas and asking questions that push those ideas forward. They capture these ideas on Post-it notes and place them on the whiteboard in an effort to organize the ideas they are generating.
M2 (+7 days): the FA begins by placing the post-it notes from M1 back on the whiteboard, allowing them to quickly re-orient themselves and begin generating more ideas. They explore how technology could mediate the experience, what experiential components could be included, sound and colored lights, that communicate particular functions of the system like water temperatures and water cleanliness. They interact well as they generate ideas, going back and forth, asking clarifying questions, and building on each other’s ideas. The FS does not speak often but the quality of her interactions serves the team well. She is able to connect the artistic components the artists discuss to the ecological relationships at the site. There are often long pauses lasting minutes, which they appear to use to (a) think more deeply about the responses they have generated and (b) oscillate between generating new ideas and validating existing ones they want to move forward on. They build out the elements they want to include in the signage, into 10 main points, covering ecological processes, history, interactivity, and the purpose of the site. Once they have settled in on these elements the MA asks, “Does everyone feel good about this list?” The other two members agree it’s a good list and then begin reassessing in an effort to pare down and further flesh out the list.
M3 (+28 days): as members revisit information from the previous meeting, they populate the whiteboard framing out how they feel the signs will be situated at each site and what each sign will entail. The FS continues to drill down on ecological processes in the system. The discourse is still rich with ideas and questions, however they are quicker at evaluating ideas as they move forward. They have decided on a list of five elements to populate each sign with, their design consisting of multiple signs spread across the site. These include, (1) process/chemistry, (2) flora/fauna, (3) past/present/future, (4) you are here, and (5) why here/desert/water cycle. They understand they only have one more meeting so they streamline their idea selection process. The idea is kept if it (a) can be communicated coherently and (b) fits their 5-part framework, otherwise it is discarded. Despite this selection process, they continue to introduce a number of new ideas such as the nitrogen fixation process of the wetland system versus desert system. To elaborate, the Tres Rios wetland system contains ample nitrogen because the wetland was constructed to remove nitrogen from treated water before releasing it into the Salt and Gila River. Conversely, desert systems lack nitrogen. The team discusses the contrast between these two systems that sit in such close proximity to each other and what that might communication about urban ecological systems. They also explore topics such as mosquito larva eating fish and the potential use of wetland biomass as fertilizer and it not being used because it is currently cost prohibitive. Though they created the 5-part structure, this deep discussion of new ideas towards the end of their meeting seems to create difficulty for committing to a cogent final design.
M4 (+58 days): nearly two months pass between M3 and M4. It appears that they have lost some momentum and spend time getting reacquainted with what they were working on in April. The FS mentions that she will not have the time to continue working on the project but can advise via email. As they continue working, they seem cordial, but the dynamic has changed. The FA takes the lead on the whiteboard to organize ideas and the MA takes notes on his computer, a role reversal from previous meetings. Consensus comes quickly on ideas but they are still introducing new ideas making it difficult to focus. A significant challenge for this team has been conflict avoidance. They have worked so diligently to be inclusive of everyone’s perspectives that it becomes difficult for them to make final decisions on signage design. They end the meeting having worked out content but still have not made resolute decisions on how the signs should look.

3.2.3. Team 3: FA, FS, MS

M1: T3 begins with each member describing their work. During this process, they appear genuinely interested in each other’s work, asking questions and finding intersections between their work. For example, after the FA shares her work, the MS comments that it is interesting to see how her art practice parallels his research practice. Once introductions are completed, they begin discussing Tres Rios observations. They regularly express diverse but complementary viewpoints which allows them to piggyback off each other, combining their unique insights to generate the project’s focus. For example, when the MS notes the ecological importance of water in the desert, the FA acknowledges his point and draws in the social and cultural significance of water in the desert. This discussion brings about the idea that a narrative around water appreciation in the desert both in terms of ecology and cultural significance could be a useful direction. They use this narrative as scaffolding to bound their brainstorming, thinking through which layouts like multiple signs, multiple sites, or selecting a specific area might best represent the story of water appreciation. The FS mentions that a vantage-point sculpture from another site was interesting to her. The FA starts sketching out what a similar structure that would look out on to the wetland might look like with changeable inserts representing different relevant topics, such as ecological processes or engineering blueprints of the constructed wetland; the FS piggybacks off this idea, suggesting that the inserts could also discuss the system over time as well. This type of exchange helps them integrate ideas that can be represented through signage in compelling ways.
M2 (+18 days): they spend the first 20 min playing with how ideas from the previous meeting can be structured at the site. The FA expresses a concern about the feasibility of all the ideas the team is proposing, the FS notes they should concentrate on the water narrative first and go from there, the other two members agree. From here, they focus exclusively on continuing to delineate the content of their project with the FA capturing their discussion in a sketch on the whiteboard. Ultimately, they sketch out 10 panels, each addressing a component of the narrative relating to the geographic points in the water system and featuring a stakeholder story. The MS asks if panels could use audio that relays ecological facts. They are tentative about it simply providing facts but pivot off this idea and identify other uses for audio, landing on interviews of the meaning of water according to different community members including: farmers, hydrologists, engineers, and Gila River Indian community members. All members are visibly excited by this development, and regularly check in with each other by asking “Is this too much?” being cognizant of staying anchored to their water narrative.
T3′s group dynamic is characterized by open expression of likes and dislikes, and equal openness to receiving feedback. For example, MS asks about the use of QR codes. The FA comments that she strongly dislikes QR codes because she feels they are annoying to use and unattractive; the FS concurs. The MS counters that QR codes would allow visitors to access additional information and experiences even after they step away from the sign. The FA and FS acknowledge this as a valid point and places it on the list of potential options. The meeting concludes with each member taking on specific tasks that need to be accomplished.
M3 (+21 days): as per their agreement in M2, each member has completed tasks in preparation for this meeting, which is focused on planning for the development of a physical mockup. They discuss the scale of the mockup and number of panels it will contain. Though they disagree during this process, they always reach an amicable agreement. For example, the FA suggests making the entire 10 panel signage mockup, the MS disagrees, mentioning that building 2 signs will allow them time to better refine their ideas, the FA concedes. The FS expresses dissent more gently in her interactions. For example, when championing a “water infrastructure” panel option, she does not openly state a desire to keep it. Instead, she draws attention to how a subterranean panel amidst the other nature-focused panels adds aesthetic diversity. The FA and MS originally planned to discard it but agree to keep it. They have established a clear dynamic; the FA leads the team as a facilitator, the MS often expresses strong opinions, and the FS rarely interjects but when she does her input significantly enhances the ideas. They complete the meeting by finalizing what a mockup will look like as a physical object and assign tasks to complete for the final meeting.
M4 (+19 days): T3 uses their final meeting to build a mockup of one of the signs. The FS has spent nearly half the meeting preparing materials for the design to be pasted to. At the same time, the MS and FA work through the sign design with decisions focused on specific product outcomes. At one point the MS suggests a couple of new ideas; the FA and MS then agree: no more new ideas. They stick to the plan, focusing exclusively on refining text, imagery, and building the mockup. The team spends the rest of their time constructing a physical mockup, expressing visible pride in the final product.

3.3. Barriers and Carriers to Success Variables

The purpose of this section is to communicate key findings from the survey and ethnographic data as they relate to the variables we discuss in this paper.

3.3.1. Participation

As previously noted, this study focuses on two specific facets of participation: (1) curiosity questions, because curiosity is linked to interest in collaborators, and (2) task motivation, because it is linked to individuals’ willingness to invest in and commit to a task. We used ethnographic observations to identify curiosity questions, and survey data to measure task motivation by the amount of time spent working on the project both during and outside meeting times.
Curiosity Questions (CurQs). CurQs relate to members expressing interest in topics not immediately related to the project, such as wanting to more know about another’s work or areas of expertise. These are measured through observational data.
T1 has the least CurQs with a single recorded event. The MS asked the FA if it was possible to paint the ceramics. T2 has 8 instances of CurQs. The CurQs were more in-depth in this group. For example, when the FS is discussing how a wetland cycles phosphorus the FA asks how plants take up phosphorus and how large amounts of phosphorus effect water systems. T3 had the most with a total of 11 CurQs. Interestingly, all CurQs occurred in M1 and spanned a wide variety of topics from personal to more project-focused. For example, in T3 after the FA introduction the MS asks, “What are you motivated and inspired by?” She explains that she focuses in on dominance and difference as it relates to barriers between people. Both the MS and FS follow up with more questions about how her vision is realized through her work. This seemingly tangential line of inquiry ultimately shapes the end project, informing the inclusion of pluralistic perspectives on water appreciation in the desert.
In contrast to T3′s front loaded CurQs (occurring all in M1), T2 asks 3 (37.5%) of their CurQs in M3. Another difference between T2 and T3 is that most of T3 CurQ events last under 2 min, whereas T2 engages in longer events, with one event lasting more than 5 min. See Table 3 for full CurQ counts.
Taking time to engage each other in open inquiry surfaced ideas that at first appeared disparate to the project but proved useful for acts of creative perception, such as T3′s incorporation of FA’s interest in exploring barriers between people. The longer events created deep engagement between team members and opened up multiple potential pathways for signage design. However, timing and duration appear to matter. For example, CurQs created a dynamic of open exploration for T2 when they should have been working towards achieving consensus on design components before their final meeting. In effect, CurQs are important for helping teams think in divergent ways, but when time is a limiting factor, failing to limit CurQs can hamper consensus.
Task Motivation. T3 spent the most time working on their project followed by T2 and T1 coming in last. The difference in time spent outside of meetings is substantial, with T3 doubling the amount of time T1 spent. There was also a disparity between how much time artists spent (630 min) outside meetings versus scientists (210 min). When we split outside meeting time between gender, women spent 112 min on average per team and men spent 57 min (see Table 4).
The FS and FA in T1 spent an equal amount of time on the project outside of meetings. In T1, the FS took on the task of developing the conceptual design of the signage, whereas in T2 and T3, the artists took on this task. These data appear to suggest that, in general, scientists lacked motivation because they spent significantly less time than artists outside of meetings working on the project. This raises questions about how team members internalized the tasks for which they were responsible. Developing the conceptual design required dedicated time and energy to synthesize ideas and produce a visual mockup for review. Internalization may have been affected by (1) the level of members’ commitment to realizing the project, but also (2) how roles were defined implicitly and explicitly throughout the project. Scientists primarily viewed their role as wetland experts, so their contributions to meetings came out primarily in explanations of the ecology of Tres Rios.
Working cultures across the sciences and arts may also have contributed to these issues. Often the scientists treated Tres Rios as an interesting side project that provided a diversion from the “real work” they were conducting. Artists treated the project as potential fodder for ideas they may want to incorporate into their own projects and often expressed an intrinsic desire to produce compelling signage. This is not to say that scientists did not care about anything but their research, but the pressure to direct attention to specific projects may have differed across the arts and sciences.

3.3.2. Collective Efficacy

Group collective efficacy scores, the average of the survey responses to the seven collective efficacy questions, were primarily above average for all three teams. Average group scores for T1 began at 4.89 out of 7 total points. Their scores then trended upward, increasing 0.39 points in M2 and an additional 0.05 in M4, before dropping 0.67 in the M4. Average scores for T2 stayed fairly steady over the 4 meetings, and T3 begins with the lowest score of all but continues to trend upward finishing with the highest score of all teams. Additional information is provided by looking at the range between individual scores within groups. For example, the range in T1 in M4, with scores ranging from 6 to 2 signals a misalignment regarding their perceptions of the group’s collective efficacy. This is confirmed via qualitative survey responses, whereby both MS and FS acknowledge their doubts and frustrations. The MS states he is unhappy with the FS’s inability to be flexible with working methods, while the FS feels frustrated that members seem to be misaligned with what the end product should look like and how each member should contribute. T2 and T3 scores range are less than 1-point apart signaling strong alignment with individual perceptions regarding their ability to complete the project. See Table 5 for more detailed team efficacy ratings.
As stated previously, collective efficacy, is “a team’s perceived confidence in a particular performance domain” [1], i.e., do they have the knowledge and skills to complete a task? Interestingly, what appears to affect collective efficacy scores is not a loss in confidence around expertise, but rather a perception that team members are displaying low levels of commitment to the project. This is most clearly expressed in specific meetings where members perceive a lack of participation by other members. In M4 for T1, both scientists note the lack of commitment to completing the project tasks. We also see the MA in T2 giving his lowest team efficacy score in M4 where he notes his frustration specifically with FS over her lack of commitment to completing the project tasks. He does not display outright frustration in the meeting; instead, his level of participation drops off. In contrast, the team efficacy scores for T3 rise over each meeting, displaying higher levels of commitment to project tasks both during meetings and outside of meeting times.

3.3.3. Perspective Taking

As noted above, we measure perspective taking in terms of the use of clarifying questions (CQs) and analogies.
Clarifying questions (CQs). T1 had the lowest number of CQs with 3. Notably all 3 were asked by the FA. She asks CQs about design ideas as well as the function of wetlands. T2 and T3 had considerably more with 20 and 17 respectively. For both teams, the highest instance of CQs occurred in M1. T2 had 40% of the total CQs in M1 (n = 8) and T3 had 59% of CQs occur in M1 (n = 10). Unlike T1, all members of T2 and T3 asked CQs.
Analogies. Similar to CQs, T1 had the lowest number of analogies with just two instances of long-distance analogies (LDAs) and no local analogies (LAs). Additionally, one member—the MS—was responsible for both instances of LDAs. In both instances he compared the wetlands to kidneys. All members in T2 used analogies for a combined total of 9 analogies, 5 LDAs and 4 LAs. The LDAs used by T2 were more diverse than T1 and used more commonplace comparisons such as the arc of television shows to describe communication practices and Brita filters to describe wetlands. LAs were used most often, members calling out other interpretive signs they had seen, such as at Joshua Tree, to provide examples of the design directions they could take. T3 had 15 analogies, 3 LDAs and 12 LAs spread out across all members. Similar to T2, they use the more commonplace LDA of likening wetlands to a sponge. LAs used by T3 spanned a variety of topical areas: signage used by the Audubon Society, topographical maps used by a local organization, and background audio used by National Public Radio. See Table 6 for full breakdown of counts by meeting.
While LDAs served as educational mechanisms, providing a simplified understanding of the wetland system function, they did not appear to aid decision making. However, we found that both CQs and LAs helped team members gain perspective on each other’s ideas more quickly, speeding up decision making and consensus. At times, CQs and analogies were used in succession when developing ideas. For example, in M1 as T3 is developing signage ideas, the FA suggests developing one sign with a viewfinder for people to look out onto the wetland. The MS asks if she’s thinking of something like a sliding bar on the sign that can be moved (a CQ), then notes an example of signage at the Rio Salado Audubon Center (an LA). The FS mentions another site that had “binoculars” that pointed the viewer over a scenic scape (an LA). The CQ and analogies help focus their attention on synthesizing ideas and finalizing the conceptual components of the signage.

3.3.4. Conflict

Conflict is divided into two variables: interpersonal conflict and task conflict, Interpersonal and task conflict were measured via ethnographic observation and survey.
Interpersonal Conflict (IC). This occurred infrequently. In M4 for T1 1 member reports an IC event. The MS describes an event he associates with the FS being unreasonably rigid in her working style. He notes, “[FS] made the room feel like if she did not get what she wanted, she could not keep working.”
T2 also experienced interpersonal conflict during M4. In this meeting, the FS notes that she cannot spend any more time outside of meetings working on the project. The MA does not vocalize this frustration to the group, but he does appear to disengage to some degree—in previous meetings he took the lead at the whiteboard, but in M4 lets FA take lead. He confirms a frustration with the disparity of workload via his survey. He notes, “It’s frustrating for others to think that artists have open amounts of time to create designs, doing large amounts of the work while others don’t have to put in the same amount of time, effort, or expertise.”
T3 did not express nor behave in a way that indicated any interpersonal conflict.
Task Conflict. In T1 M4 the FS interprets the same event the MS interpreted as IC as a TC event. FS articulates her frustration relating to a misalignment of perspectives, stating: “I am not sure where the miscommunications were happening or if we all have different expectations of the project that I am not hearing/understanding.” As previously noted TC expresses a curvilinear relationship with creativity. Her expression of frustration indicated that she had exceeded the optimal level of TC.
T2 had 5 instances of task conflict spread out across M2 (1), M3 (1), and M4 (3). They peaked in occurrence in M4 as they made concrete, logistical decisions about sign content such as what information to include, in what order, and how to cluster that information across the signs.
Conversely, T3 experienced the bulk of their conflict earlier in the process, with 75% of events (9) occurring in M2. Interestingly, 8 of the 9 events in M2 were from the FA. Unlike T2 which focused on logistics, T3′s conflicts focused on foundational questions like “what is most exciting for viewers?” and “how do we make sure community members feel represented in imagery?” Although the FA dissented frequently, the MS and FS were receptive and willing to pivot based on her comments as they worked toward finalizing decisions. See Table 7 for addition information on interpersonal and task conflict.
It is acknowledged that on creative projects the desire is always to minimize IC and provide appropriate amounts of TC. While task conflict often delays consensus it also served as a mechanism for reaching consensus by helping teams better articulate ideas. This is most pronounced between T2 and T3. T2 resists conflict in their team. This allows them the opportunity to explore a large number of rich and innovative ideas. However, by delaying most of their TC for the final meeting they made it difficult to reach consensus, running out of time and energy for finalizing their design. T3 has the majority of their task conflict during M2. By working through conceptual ideas early they allow themselves most of M3 to finalize their design and use M4 to build out a physical mockup. Hence, task conflict is critical for realizing the full potential of an idea but when time is a limiting factor teams need to engage in this process early on.

3.3.5. Ongoing Creative Negotiations

The aim of teams engaging in variables identified as barriers and carriers was to produce a creative product which comes about through iterative acts of consensus and creative perception. We recorded acts of reaching or delaying consensus, and acts of creative perception via ethnographic observation.
Consensus. Teams reach consensus when they finalize a decision and delay consensus when they express a desire to keep exploring an idea. T1 reached consensus on their design idea in M2. Once they finalized the design most decisions became about execution. They recorded no events of delayed consensus. T2 recorded 7 events of delayed consensus in their first 2 meetings. Their first event of reaching consensus occurs in M3 and they record 2 more events of delayed consensus in that meeting. During M4 they record 2 events of reaching consensus and 1 more event of delayed consensus. T3 records 1 event of reaching consensus in M1, 8 events of reaching consensus and 1 event of delayed consensus in M2, and1 more event of reaching consensus in M4.
We found that among the most important factors when working towards consensus were (1) being cognizant of the timeline for completing the project and (2) breaking up project components so that teams can move toward consensus through iterative stages. Being mindful of these two factors allows teams to plan out how much exploration they can engage in over the project and helps reduce unnecessary complexity by solidifying components of the project that help guide future decisions. We see this unfold with all 3 teams differently: T1 reaching consensus early, T2 delaying consensus, and T3 moving through multiple stages of consensus.
Creative Perception (CP). T2 had 6 total CP events and T3 had 7. These events most often related to the ability to connect artistic modalities to ecological concepts. For example, the FA in T2 mentions her interest in attributing sound to phenomena like water temperature, eliciting the idea of synesthesia in the space. The FS picks up on it and relates it to the movie “Mr. Holland’s Opus” where music is translated to color. These acts of connection served as frameworks for building out design concepts in T2 and T3. T1 had 3 opportunities to engage in similar ideas of translation presented by the FA in their team. For example, the FA notes that the water release site from the treatment plant and the Environmental Protection Agency testing site before the water returns to the Salt River really stood out to her. Each time the FS points out that these areas are closed off to the public. The FA does not press the idea on how these specific locations could be addressed in the signage and the group moves on rather than looking at opportunities to potentially reveal to the public hidden aspects of the constructed wetlands.
Similar to consensus, CP can be considered an outcome of successful collaboration efforts. We found that the use of CQs, local analogies, and task conflict were critical mechanisms for motivating progress, but most importantly CurQs led to insights that connected disparate ideas. This was particularly evident with T2 who had fewer CurQ than T3 but spent more time engaged in the questions they asked. These moments of CP were also facilitated by the team’s ability to delay consensus and stay engaged with what appeared to be tangential questions. See Table 8 for additional details on consensus and creative perception across meetings.

4. Discussion

As discussed earlier, teams need particular conditions to improve their chances of successful outcomes. Some of these were easier to control for than others and we attempted to improve chances of successful outcomes where possible through the use of enabling conditions, a boundary object, and setting initial group norms. These variables can be considered fairly stable; however, the variables under barriers and carriers are more fluid. Teams struggled with different components of collaboration, requiring more of a systems approach to collaborative capacity building. Due to the complexity of the data, Table 9 takes an infographics approach to simplifying the data, using forced scoring and color coding to provide a visual “snapshot” of team performance across variables.
Every team had a strong desire to perform well on the project but there were often variables that limited or aided project success. Members took on particular roles in the group, that of facilitator, domain expert, or linchpin (picking up slack where necessary, contributing in ways that support the team). For some, strong roles provided the project a consistency that kept them anchored to their visions; for others, it created a project vision that excluded members.
T1 had enthusiastic scientists, and the FS in particular worked hard to create a compelling project. However, their desire for quick consensus hindered their ability to draw in the FA. Without art-based input the team effectively became a science team, dramatically reducing the diversity of ideas. Quick consensus meant they did not engage in task conflict or acts of clarity, effectively reducing their ability to develop robust ideas. With the reduction in knowledge diversity the scientists often reached similar conclusions about the project direction. Creative perception became difficult since divergent ideas were not introduced in the development of the project. Additionally, although they performed “well” on reaching consensus, without some task conflict or negotiation there was no project advancement through interrogation.
T2 performed remarkably well in terms of idea production. They delayed consensus the longest of all teams, allowing for a richer understanding of the project. Of all the teams, we would argue their interactional expertise improved the most. They scored well on the majority of the variables we studied and they worked to include everyone in the conversation. However, that level of engagement came at a cost. This openness created a resistance to task conflict as well, making it difficult for them to reach consensus on their design. By not making some decisions early on they effectively ran out of time, producing a project that lacked the necessary polish.
T3 scored high on most variables as well, signaling a successful collaboration. They had a friendly, high task conflict dynamic, which worked for these three since each member was assertive. In particular, we saw the FA take a strong facilitative role, leading the team towards a particular vision. She had significantly more task conflict events than the other 2 team members, quickly noting her dislikes. Additionally, she dedicated more time (nearly double of any other study participant) to the project outside of the scheduled meeting times. This strong facilitation style, combined with two members who asserted themselves when they had ideas, worked well to build rapport. The team had high task motivation and a clear vision for their project, allowing them to work stepwise through points of consensus. These 2 variables appeared to scaffold their success, allowing them to engage in acts of clarity and task conflict more fluidly than the other two teams. As they grappled with ideas they remained flexible, entertaining different perspectives to produce better designs. This open negotiation of ideas displayed a mutual respect between the members.
Indeed, T3′s collaboration style worked well for this project, which had well defined boundaries. We are led to wonder, however, if problems that are less well defined, as many sustainability problems are, would benefit from a blend of the approaches taken by T2 and T3. The development of interactional expertise is important, and delaying consensus is critical to identifying problems and solutions in a novel way. Teams may benefit from a diagnostically oriented approach, where they use the framework provided by this study to regularly check in collectively to explore their performance across the barriers and carriers and reflection on when they need to be open to more ideas, begin to reach consensus on others, etc. This reflexivity can help them identify which factors may improve their collaborative success or maintain it.

5. Conclusions

Recruiting artists and scientists to co-create a project that required both ecological and artistic modes of production allowed us to investigate the challenges that made working together difficult—and the mechanisms that provided opportunities for the development of creative ideas. Additionally, as a pilot study, it raised questions about creating these art-science teams. For example, how long does it take for team members to become conversationally literate in each other’s practices? What types of incentive structures allow for the creation and maintenance of these teams? Would more time for collaboration increase or decrease successful outcomes in art-science teams? It was clear that the meetings we documented primarily served as an introductory phase to collaboration. However, by providing team members with this interdisciplinary experience, the expectation was that a familiarization with each other’s epistemic cultures would illuminate not only the content in the field but the set of practices that make up each domain, and how each participant could contribute to the team. Furthermore, familiarization with scientific or artistic practice allowed team members to understand what it means to work as a scientist or artist and hopefully created new ways of seeing, approaching, framing, and problem solving in the world.
Our main interest in this study was to develop a better understanding of the collaboration dynamics for artist-scientist teams and the potential conditions that foster those collaborations when addressing complex sustainability challenges. Using survey and ethnographic data allowed for a more holistic analysis of the intra- and interpersonal dynamics that unfold in teams and creates some of the groundwork for building a stronger empirical foundation for collaborations that integrate knowledge in the sciences with knowledge in the arts. This research advances our understanding of collaborative behavior in deeply heterogeneous groups with significantly different social practices focused on finding creative solutions to wicked sustainability challenges.

Author Contributions

Conceptualization, methodology, formal analysis, writing—original draft preparation, and writing—review and editing, E.C., and S.L.R.; investigation, E.C. All authors have read and agreed to the published version of the manuscript.

Funding

This research is based on work supported by the National Science Foundation under grant no. 1242749 with additional support provided by the Center for Interdisciplinarity at Michigan State University.

Acknowledgments

We gratefully acknowledge the feedback provided by Michael O’Rourke and his role in refining the manuscript, input from the editor of the special issue, and the anonymous reviewers who helped to sharpen the argument.

Conflicts of Interest

The authors declare no conflict of interest.

Appendix A

TRES RIOS PROTOCOL
The Tres Rios Project: Outcome Summary
Where
The Tres Rios Restoration site is a constructed wetlands site that is connected to the wastewater plant and provides ecosystem services to the area including habitat formation for fauna. The site will also soon be used as a public park. Additional info will be made available via a shared Dropbox folder.
What
The city of Phoenix would like to share the restoration work they have done via interpretive signage with the public, so we are enlisting artists-scientists teams to develop ideas of what this could look like. They have funding for this project and would like your assistance in conceptualizing the signs. The target age group is 8th graders.
The city is particularly interested in relaying their work in developing the site and the ecological relationships between the various areas. Rather than considering this as the box you must work in, treat it as starting point to developing engaging, novel, and appropriate ideas that express Tres Rios’ social and ecological complexity
Who
We will assign two artists and two scientists per team. This project is about giving equal voice to both artists and scientists. All members should be willing to express their ideas and understand they carry equal weight.
How
Including the field visit, you are expected to have 4 1.5 h meetings though you may choose to meet more. At each meeting, in addition to project work, you should expect to:
-
Agree upon a time for the next meeting;
Be sure to include me in this information, I need to be present at all meetings to collect data;
If possible, please try not to schedule meetings Tuesday between 7:30 am—noon
-
Establish any tasks that need to be completed in the interim (research, brainstorming, etc.)
-
Complete your survey as soon as the meeting is over!
Tips on working together:
  • Show vs. Tell: Favor showing and giving examples over explaining. Even if you think you can’t draw, sketch out ideas, use pictures, models, etc.
  • No cries, analogize: Scientists and artists both use analogies in their work, at times to get unstuck, to communicate ideas to someone outside their field, or to unite ideas that don’t initially seem connected. Feel free to play with analogies when working together.
  • Collaborating with others can be rewarding… but also challenging: Collaborating can be hard even if you work in the same space. Bridging the divide between art and science may be difficult so please be patient with each other. If you don’t understand something ask questions that help clarify ideas or points of view, don’t assume you understand what others are thinking or contributing.
Above all, please have fun and be creative!
The following is intended to serve as a tool. You are not obligated to follow this structure if you feel it is not serving your process.
Meeting One—The site visit
Observe, collect, engage, immerse: You will be getting a site tour and get a chance to explore Tres Rios. Note what you see and experience, how you can imagine people using the area, the questions they might have, things that you find interesting and how to bring others attention to this. Be sure to identify elements that you feel are critical to include in the final product.
Objectives
-
Review the process being undertaken
-
View the area and begin to formulating reactions to the space
-
Meet potential group members
Meeting Two—Initial idea formation
Defining your team point of view: As a group, share out your discoveries from the wetlands. Identify your critical elements and consider how they may be compatible (or not). Develop a statement for WHAT your signs will accomplish (what will it give to people, in terms of: information, experience, feeling, etc.)
Objectives
-
Share experiences and stories about the space
-
Brainstorm on additional realizations/insights that emerged from group discussion
-
Identify specific aspect that you are interested in and how to communicate them.
Meeting Three—Developing your idea
Idea expansion: In your previous meeting you established critical pieces from your experience at the wetlands, now begin to explore the way those conceptual pieces can be built out into an experience for participants.
Objectives
-
Identify a variety of ways that the signage can be executed to give participants your “critical experience.” (Will you find a way for them to interact with the space via made objects? Will something mediate the experience? i.e., QR codes for Internet access)
-
Evaluate each idea in terms of effectiveness, appropriateness, and novelty.
Meeting Four—planning your mock up
Prototype: During this phase you should begin building out your idea so that it can be effectively conveyed to the City of Phoenix administrative team overseeing this project.
Objectives
-
Clearly flesh out your ideas and ensure that there is a shared vision
-
Establish how to present it to best allow the evaluators at the city to fully appreciate and experience this product (storyboard, PowerPoint, other)

Appendix B

Survey Questions
How much total time (in minutes) do you believe each team member has spent on this project?
Briefly describe the major work (if any), you did on the project today, or the major activities you engaged in that were relevant to the project.
How many minutes did you spend working on this project today?
What percentage of your time was spent working with other members of your team? Which members did you work with?
Was there a team member you felt most engaged with? (circle one)  Yes    No
If yes, who was it and why did you feel this way?
Rate the degree to which you agree or disagree with the following statements.
In terms of my team’s ability to complete the project, I feel:
Strongly DisagreeDisagreeSomewhat DisagreeNeither Agree nor DisagreeSomewhat AgreeAgreeStrongly Agree
We can always manage to solve difficult problems.
It will be easy to stick to our aims and accomplish our goals.
We can deal efficiently with unexpected events.
Thanks to our resourcefulness, we know how to handle unforeseen situations.
We can solve most problems if we invest the necessary effort.
When we are confronted with a problem, we can usually think of a solution.
We can usually handle whatever comes our way.
What do you think each team member’s contribution to the group will be/is?
My contribution is:
________’s contribution is:
Briefly describe one event from today that stands out in your mind as relevant to this project (this could include: your feelings, your work, or your perceptions around how your team feels or your team’s work). Remember to specify who was involved and what happened.
The event can be positive, negative, or neutral.
Please describe the event below:

References

  1. Fischer, J.; Manning, A.D.; Steffen, W.; Rose, D.B.; Daniell, K.; Felton, A.; Garnett, S.; Gilna, B.; Heinsohn, R.; Lindenmayer, D.B. Mind the sustainability gap. Trends Ecol. Evol. 2007, 22, 621–624. [Google Scholar] [CrossRef]
  2. Kagan, S. Art and Sustainability: Connecting Patterns for a Culture of Complexity; Transaction Publishers: Piscataway, NJ, USA, 2011; pp. 1–513. [Google Scholar]
  3. Building Resilience and Adaptive Capacity in Social-Ecological Systems; Berkes, F.; Folke, C.; Colding, J. (Eds.) Cambridge University Press: Cambridge, UK, 2002. [Google Scholar]
  4. Ostrum, E. A General Framework for Analyzing Sustainability of Social-Ecological Systems. Science 2009, 325, 419–422. [Google Scholar] [CrossRef] [PubMed]
  5. Root-Bernstein, R.; Siler, T.; Brown, A.; Snelson, K. ArtScience: Integrative Collaboration to Create a Sustainable Future. Leonardo 2011, 44, 192. [Google Scholar] [CrossRef]
  6. Clark, W.C. Sustainability science: A room of its own. Proc. Natl. Acad. Sci. USA 2007, 104, 1737–1738. [Google Scholar] [CrossRef] [PubMed] [Green Version]
  7. Gibbons, M.; Limoges, C.; Nowotny, H.; Schwartzman, S.; Scott, P.; Trow, M. The New Production of Knowledge: The Dynamics of Science and Research in Contemporary Societies; Sage Publications Limited: London, UK, 1994; p. 179. [Google Scholar]
  8. Edwards, D. The Lab: Creativity and Culture; Harvard University Press: Cambridge, MA, USA, 2010. [Google Scholar]
  9. Edwards, D. Artscience: Creativity in the Post-Google Generation; Harvard University Press: Cambridge, MA, USA, 2008; pp. 1–194. [Google Scholar]
  10. Root-Bernstein, R. Art Advances Science. Nature 2000, 407, 134. [Google Scholar] [CrossRef]
  11. Root-Bernstein, R.; Root-Bernstein, M. Sparks of Genius; Houghton Mifflin: New York, NY, USA, 1999; p. 401. [Google Scholar]
  12. Root-Bernstein, R.; Root-Bernstein, M. Artistic Scientists and Scientific Artists: The Link Between Polymathy and Creativity. In Creativity: From Potential to Realization; Sternberg, R.J., Grigorenko, E.L., Singer, J.L., Eds.; American Psychological Association: Washington, DC, USA, 2004; pp. 127–151. [Google Scholar]
  13. Snow, C.P. The Two Cultures and the Scientific Revolution; Cambridge University Press: New York, NY, USA, 1960. [Google Scholar]
  14. Simon, H.A. Creativity in the arts and the sciences. Kenyon Rev. 2001, 23, 203–220. [Google Scholar]
  15. Cardenas, E. Between Two Pines: Ushering in a Sustainable Future Through an Art-Science Practice; MIchigan Publishing: Ann Arbor, MI, USA, 2019; p. 174. [Google Scholar] [CrossRef]
  16. Root-Bernstein, R. Problem Generation and Innovation. In International Handbook on Innovation; Shavinina, L.V., Ed. Elsevier Science Ltd.: Oxford, UK, 2003; pp. 170–179. [Google Scholar]
  17. Whyte, K.P.; Thompson, P.B. Ideas for how to take wicked problems seriously. J. Agric. Environ. Ethics 2012, 25, 441–445. [Google Scholar] [CrossRef] [Green Version]
  18. Wilson, E.O. Consilience: The Unity of Knowledge; Vintage Books: New York, NY, USA, 1999. [Google Scholar]
  19. NSF. NSF Convergence Accelerator. Available online: https://www.nsf.gov/od/oia/convergence-accelerator/ (accessed on 1 October 2020).
  20. Amabile, T.M.; Conti, R.; Coon, H.; Lazenby, J.; Herron, M. Assessing the work environment for creativity. Acad. Manag. J. 1996, 39, 1154–1184. [Google Scholar]
  21. Sawyer, K.; DeZutter, S. Distributed creativity: How collective creations emerge from collaboration. Psychol. Aesthet. Creat. Arts 2009, 3, 81. [Google Scholar] [CrossRef] [Green Version]
  22. Sawyer, K. Explaining Creativity: The Science of Human Innovation, 2nd ed.; Oxford University Press: New York, NY, USA, 2012. [Google Scholar]
  23. Hackman, J.R. From causes to conditions in group research. J. Organ. Behav. 2012, 33, 428–444. [Google Scholar] [CrossRef]
  24. Harrington, D.M. The ecology of human creativity: A psychological perspective. In Theories of Creativity; Runco, M.A., Albert, R.S., Eds.; Sage Publications, Inc.: Newbury Park, CA, USA, 1990; pp. 143–169. [Google Scholar]
  25. Koestler, A. The Act of Creation, 2nd ed.; Hutchinson & Co: London, UK, 1976; p. 751. [Google Scholar]
  26. Amabile, T.M. Creativity in Context: Update to “the social psychology of creativity”; Routledge Press: New York, NY, USA, 1996. [Google Scholar]
  27. Talking Through Objects: Multidisciplinary Dialogues with “Things”; Robbins, P. (Ed.) University of Arizona Press: Tucson, AZ, USA, 2012. [Google Scholar]
  28. Groundwater: The Art, Design, and Science of a Dry River; McMahon, E.; Monson, A.; Weinstein, B. (Eds.) University of Arizona Press: Tuscon, AZ, USA, 2012. [Google Scholar]
  29. Star, S.L.; Griesemer, J.R. Institutional Ecology, ’Translations’ and Boundary Objects. Soc. Stud. Sci. 1989, 19, 387–420. [Google Scholar] [CrossRef]
  30. Halpern, M.K. Across the great divide: Boundaries and boundary objects in art and science. Public Underst. Sci. 2011, 21, 922–937. [Google Scholar] [CrossRef] [PubMed]
  31. Hackman, J.R. Collaborative Intelligence: Using Teams to Solve Hard Problems; Berrett-Koehler: San Fransisco, CA, USA, 2011. [Google Scholar]
  32. Woolley, A.W.; Gerbasi, M.E.; Chabris, C.F.; Kosslyn, S.M.; Hackman, J.R. Bringing in the experts: How team composition and collaborative planning jointly shape analytic effectiveness. Small Group Res. 2008, 39, 352–371. [Google Scholar] [CrossRef] [Green Version]
  33. De Dreu, C.K.W.; West, M.A. Minority Dissent and Team Innovation: The Importance of Participation in Decision Making. J. Appl. Psychol. 2001, 86, 1191–1201. [Google Scholar] [CrossRef] [PubMed]
  34. Kashdan, T.B.; Goodman, F.R.; Disabato, D.J.; McKnight, P.E.; Kelso, K.; Naughton, C. Curiosity has comprehensive benefits in the workplace: Developing and validating a multidimensional workplace curiosity scale in United States and German employees. Pers. Individ. Differ. 2020, 155. [Google Scholar] [CrossRef]
  35. Lewis, T. The Dude Abides, or, Why Curiosity Is Important for Education Today. In Curiosity Studies: A New Ecology of Knowledge; Zurn, P., Shankar, A., Eds.; University of Minnesota Press: Minneapolis, MN, USA, 2020. [Google Scholar]
  36. Marks, M.A. A test of the impact of collective efficacy in routine and novel performance environments. Hum. Perform. 1999, 12, 295–309. [Google Scholar] [CrossRef]
  37. Parker, S.K.; Atkins, P.W.; Axtell, C.M. Building better work places through individual perspective taking: A fresh look at a fundamental human process. Int. Rev. Ind. Organ. Psychol. 2008, 23, 149–196. [Google Scholar]
  38. Hoever, I.J.; Van Knippenberg, D.; Van Ginkel, W.P.; Barkema, H.G. Fostering team creativity: Perspective taking as key to unlocking diversity’s potential. J. Appl. Psychol. 2012, 97, 982. [Google Scholar] [CrossRef] [Green Version]
  39. Eigenbrode, S.D.; O’Rourke, M.; Wulfhorst, J.D.; Althoff, D.M.; Goldberg, C.S.; Merrill, K.; Morse, W.; Nielsen-Pincus, M.; Stephens, J.; Winowiecki, L.; et al. Employing Philosophical Dialogue in Collaborative Science. Think. Biol. 2007, 57, 55–64. [Google Scholar] [CrossRef]
  40. O’Rourke, M.; Crowley, S.J. Philosophical intervention and cross-disciplinary science: The story of the Toolbox Project. Synthese 2012, 190, 1937–1954. [Google Scholar] [CrossRef]
  41. Woolley, A.W.; Chabris, C.F.; Pentland, A.; Hashmi, N.; Malone, T.W. Evidence for a Collective Intelligence Factor in the Performance of Human Groups. Science 2010, 330, 686–688. [Google Scholar] [CrossRef] [PubMed] [Green Version]
  42. Dunbar, K. How Scientists Really Reason: Scientific Reasoning in Real-World Laboratories. In The Nature of Insight; Sternberg, R.J., Davidson, J.E., Eds.; MIT Press: Cambridge, MA, USA, 1995; pp. 365–395. [Google Scholar]
  43. Guetzkow, H.; Gyr, J. An analysis of conflict in decision-making groups. Hum. Relat. 1954, 7, 367–382. [Google Scholar] [CrossRef]
  44. Jehn, K.A. A qualitative analysis of conflict types and dimensions in organizational groups. Adm. Sci. Q. 1997, 42, 530–557. [Google Scholar] [CrossRef] [Green Version]
  45. Barry, A.M.S. Visual Intelligence: Perception, Image, and Manipulation in Visual Communication; State University of New York Press: Albany, NY, USA, 1997; p. 425. [Google Scholar]
  46. Jehn, K.A.; Northcraft, G.B.; Neale, M.A. Why differences make a difference: A field study of diversity, conflict and performance in workgroups. Adm. Sci. Q. 1999, 44, 741–763. [Google Scholar] [CrossRef] [Green Version]
  47. Kurtzberg, T.R.; Amabile, T.M. From Guilford to creative synergy: Opening the black box of team-level creativity. Creat. Res. J. 2001, 13, 285–294. [Google Scholar] [CrossRef]
  48. Nemeth, C.J. Differential contributions of majority and minority influence processes. Psychol. Rev. 1986, 93, 10–20. [Google Scholar] [CrossRef]
  49. Van Dyne, L.; Saavedra, R. A naturalistic minority influence experiment: Effects on divergent thinking, conflict and originality in work-groups. Br. J. Soc. Psychol. 1996, 35, 151–167. [Google Scholar] [CrossRef]
  50. Hackman, J.R.; Morris, C.G. Group task, group interaction process and group performance effectiveness: A review and proposed integration. Adv. Exp. Soc. Psychol. 1975, 8, 45–99. [Google Scholar]
  51. Hall, K.L.; Feng, A.X.; Moser, R.P.; Stokols, D.; Taylor, B.K. Moving the science of team science forward: Collaboration and creativity. Am. J. Prev. Med. 2008, 35, S243–S249. [Google Scholar] [CrossRef] [Green Version]
  52. Stokols, D.; Hall, K.L.; Taylor, B.K.; Moser, R.P. The science of team science: Overview of the field and introduction to the supplement. Am. J. Prev. Med. 2008, 35, S77–S89. [Google Scholar] [CrossRef]
  53. Farrell, M.P. Collaborative Circles: Friendship Dynamics and Creative Work; University of Chicago Press: Chicago, USA, 2001. [Google Scholar]
  54. Childers, D. Wetland Ecosystem Ecology Lab. Available online: http://weel.asu.edu/WEEL/Home.html (accessed on 31 October 2013).
  55. Schwarzer, R.; Jerusalem, M. Generalized self-efficacy scale. Measures in Health Psychology: A User’s portfolio. Causal Control Beliefs 1995, 1, 35–37. [Google Scholar]
  56. Hammersley, M.; Atkinson, P. Ethnography: Principles in Practice, 3rd ed.; Routledge: New York, NY, USA, 2007. [Google Scholar]
Figure 1. Satellite image of Tres Rios Wetland, the 91st Avenue Wastewater Treatment Plant, and the area where interpretive signage will go.
Sustainability 12 08634 g001
Figure 2. An example of a social component included by team 3. The signs couple the importance of water to the people that depend on it and how they have differing reasons for their dependence. These differing reasons may be both physical and cultural.
Sustainability 12 08634 g002
Figure 3. Team 2 planned to build out five designs with an identical framework, but they would all contain different content that would be specific to the location of the site, e.g., a wetland design near the wetland, a desert design with a desert lookout, and a riparian design near the Salt river. In addition to the flora/fauna and process/chemistry, they incorporated cultural components in the past/future/present section.
Sustainability 12 08634 g003
Figure 4. Team 1 provides a mockup that speaks specifically to ecological processes of the wetland but neglects to mention any cultural components that relate to water in the area. The artist is asked to make a series of illustrations, but her conceptual ideas are not incorporated into the design.
Sustainability 12 08634 g004
Table 1. Overview of variable analysis.
Variable NameData SourceMeasured by
I. Participation
 1. Curiosity QuestionsVideo Tally of events where one member asks a question of another out of personal interest, thick description of the event
 2. Task MotivationSurvey: self reportSum of total reported minutes working on project
II. Collective EfficacySurvey: Likert scale questionsAverage score of 7 collective efficacy questions
III. Perspective Taking
 1. Clarifying QuestionsVideoTally of events where one member asks another to elaborate on a statement or idea, thick description of the event
 2. AnalogiesVideoTally of events where a member draws comparisons from an unrelated ideas to enhance understanding, thick description of analogy use
IV.Conflict
 1. Interpersonal ConflictParticipant observation, survey: open-ended questionsTally of event where a conflict occurs due to tension between members, thick description of conflict event
 2. Task ConflictParticipant observation, survey: open-ended questionsTally of events where a conflict occurs due to task-related tension, thick description of conflict event
V. Ongoing Creative Negotiations
 1. ConsensusParticipant observation, videoTally of events where the team reaches or delays consensus on a project component, thick description of the event
 2. Creative PerceptionParticipant observation, videoTally of events where a member draws a connection between seemingly disparate ideas, thick description of the event
Table 2. Project design rating criteria.
T1T2T3
Ecological AccuracyWas the outcome ecologically accurate?YesYesYes
Compelling Aesthetic Did the design move beyond simple illustration?NoNoYes
Disciplinary IntegrationDo the aesthetic and ecological components cohere to each other?NoYesYes
Table 3. Curiosity question (CurQ) counts by meeting.
Curiosity Questions
Team M1M2M3M4
1FS
MS 1
FA
2FA313
MA
FS1
3FS4
MS2
FA5
Table 4. Time spent on project in minutes.
Team Outside Meeting TimeIn-Meeting TimeTotal Project Time
1FS90320410
MS0320320
FA90320410
2FA120390520
MA150390540
FS30390420
3FS70420490
MS20420440
FA270420690
Table 5. Team efficacy rating.
Team Efficacy
Team M1M2M3M4Avg. across Meetings
1FS44.67423.67
MS4.675.17665.46
FA66666.00
Avg. per meeting4.895.285.334.665.04
2FA564.675.835.38
MA6.176655.79
FS4.834.55.835.835.25
Avg. per meeting5.335.55.55.555.47
3FS56.56.56.56.13
MS55.55.8365.58
FA4.3366.676.835.96
Avg. per meeting4,7866.336.445.89
Table 6. Counts for analogy and clarifying question events.
Long-Distance AnalogyLocal AnalogyClarifying Questions
Team M1M2M3M4M1M2M3M4M1M2M3M4
1FS
MS1 1
FA 111
2FA 1 313
MA1 1 2 14 1
FS1 1 1 241
3FS1 1 2 3
MS1 43 4121
FA 21 321
Table 7. Conflict events.
Interpersonal ConflictTask Conflict
Teams M1M2M3M4M1M2M3M4
1FS 1
MS 1
FA
2FA 1 2
MA 1 1
FS 1
3FS 11
MS 1
FA 8 1
Table 8. Consensus and creative perception events.
Consensus
(R = Reached, D = Delayed)
Creative Perception
(- = Missed Opportunity for CP)
TeamM1M2M3M4M1M2M3M4
1 D1 -3
2D4D3R1, D2R2, D1412
3R1R8, D1 R1421
Table 9. Variable performance by team.
Barriers and CarriersT1T2T3
I. Participation
  1. Curiosity Questions
  2. Task Motivation
II. Collective Efficacy
III. Clarity
  1. Clarifying Questions
  2. Analogies
IV. Conflict
  1. Personal Conflict
  2. Task Conflict
V. Creative Negotiations
  1. Consensus
  2. Creative Perception
Green = high performance | Yellow = medium performance | Red = poor performance
Publisher’s Note: MDPI stays neutral with regard to jurisdictional claims in published maps and institutional affiliations.

