1. Introduction
The increasing adverse effects caused by global warming, climate change and waste and air pollution have accelerated the attentiveness of experts, globally. This makes it important to find an effective way to improve environmental quality and sustainability [
1]. Energy-efficient technology is important for today’s environment, because such techniques would significantly help to reduce the damage caused to the environment and the high wastage of energy [
2]. Efficient energy use can lead to a reduction in monetary and social costs, and a reduction in the pollution of greenhouse effects and other contaminants in the atmosphere. This would indirectly increase new production rates, particularly for developing countries such as Malaysia because energy-efficient lighting is one of the most effective strategies for lowering CO
2 emissions [
3]. The Malaysian government encourages the phasing out of incandescent light sources in buildings, and to replace these with more efficient technologies such as light-emitting diodes (LEDs) [
4]. To increase the use of energy-efficient products among organizations, the Malaysian government, under the National Energy Efficiency Action Plan (NEEAP), has developed an initiative to provide free energy audit to those large and medium sized commercial buildings, industries, and large government facilities that are willing to invest an amount of energy saving measures which are equal to the cost of the energy audit. The adoption of energy-efficient technology such as LED, and sustainable consumption and production (SCP) concepts among such organizations could lead to higher environmental and economic impact that reduces inefficiencies in the management of resources [
5].
Being involved in corporate social responsibility activities, showing care for the environment, and following green practices among organizations, is now becoming a source of competitive advantage [
6]. Organizations with high environmental responsibilities not only obtain and manage social and environmental benefits, they also achieve good financial benefits, thereby offering great values to their stakeholders [
7]. Empirically, very few studies have examined the innovative practices of organizations [
8]. There is also a lack of empirical evaluations looking at the impact of green practices and the energy-efficient technology usage of organizations [
9]. In terms of energy-efficient technology, light-emitting diodes (LEDs) offer many advantages over conventional lamps. These include extended duration, lower energy consumption, diverse lighting designs and multitude choice of applications. Nevertheless, the impact of such lighting systems has not yet been thoroughly examined [
10]. Studies have investigated the adoption of LED usage from the individual perspective [
4,
11] but thus far, not many studies have examined LED usage from the organizations’ perspective. Aiming to fill this gap, the current study uses the Belief–Action–Outcome (BAO) framework so as to facilitate the investigation of both the antecedents and the consequences of green practices or green technology adoption by organizations [
9,
12,
13]. Based on this framework which is integrated with the stakeholder and social contract theory, the antecedents of LED usage and its subsequent impact on organizations’ economic and environmental performance is further investigated.
The study findings on the factors that affect LED usage and its impact will guide the managers to plan and implement appropriate strategies to increase the use of LED light sources in various aspects of business operations, such as manufacturing and production units, administrative offices, warehouses, car parks, etc. By doing so, organizations contribute to preserve the environment through energy saving and pollution reduction, thus leading to environmental sustainability.
1.1. Theoretical Background
Numerous theories have been used to study organizations’ adoption of green practices or green technologies. The most commonly used theories include the diffusion of innovation theory (DOI), the institutional theory, the resource-based view (RBV) of the firm, organizational cultural theory, Belief–Action–Outcome framework, and Technology-Organization and Environment (TOE) framework. Bandara and Amarasena [
14] investigated the influence of relative advantage from the DOI theory, perceived ease of use from the Technology Acceptance model (TAM) and perceived behavioral control from the Theory of Planned Behavior (TPB) on intention to adopt solar energy technology. The work of Smerecnik and Andersen [
15] used the DOI theory to study the influence of relative advantage, compatibility, simplicity, trialability, and the characteristics of the adopters such as opinion leadership and innovativeness on environmental sustainability among hotels and resorts. On the other hand, Bose and Luo [
16] integrated the TOE framework, the process-virtualization theory (PVT), and the DOI theory to examine the green IT initiatives and Green IT implementations in organizations. The work of Piaralal et al. [
17] studied the green practice adoption in Malaysia by using the TOE and the DOI theory among small and medium sized logistics firms. Similarly, Weng and Lin [
18] used the TOE framework to examine the technological, organizational and environmental factors that influenced the green innovation adoption of small and medium sized enterprises (SMEs) in China.
Few studies have investigated the impact of green practices or green technology adoption. For instance, using the DOI and the ecological modernization theories, Zhu et al. [
19] studied the adoption of green supply chain management (GSCM) practices among Chinese manufacturers. The study also examined the impact of GSCM practices on organizations’ performance. Similarly, Cai and Li [
20] followed the resource-based view to investigate the impact of organizations’ technological and environmental capabilities on eco-innovation and their subsequent impact on organizational performance. The work of Deng and Ji [
21], however, integrated the theories, such as the DOI, the Institutional theory, the Organizational Culture theory, Resource-Based view, and the Natural Resource-Based view theory, so as to develop a comprehensive research model which was then used to examine organizations’ adoption of green IT. A study by Ainin et al. [
22] used the institutional theory to examine the impact of institutional pressure and other variables, such as consideration of future consequences, and the personality trait of openness, on the adoption intensity of green IT practices and its subsequent impact on firm performance.
The Belief–Action–Outcome (BAO) framework is currently gaining popularity in the field of environmental sustainability related studies. This was endorsed by [
13] who used it as a theoretical base to study the drivers and outcomes of green information system adoption among small and medium-sized enterprises. Conversely, Gholami et al. [
12] used the BAO framework to examine the driving factors for green IS adoption and its consequences among business firms. The work of Loeser et al. [
9] developed a model based on the BAO framework to examine the influence of environmental strategies on the formulation of green IS strategy. The BAO framework offers a holistic theoretical base that helps to identify the antecedents of Green IT adoption, and also its impact following adoption [
12]. Likewise, the current study also uses the BAO framework as a theoretical base to examine the influence of the macro–micro level factors on LED usage, and following this, its impact on organizational outcomes.
1.2. Belief–Action–Outcome Framework
The Belief–Action–Outcome Framework [
23] considers three classes of sustainability phenomena. The first phenomenon is the consideration of the emergence of cognitive states, such as belief, and opportunities about sustainability. The second is the actions of organizations and individuals towards the practices and processes that support sustainability. The third is the outcome in terms of environmental and financial performance. These three phenomena comprise of macro–micro issues which are based on [
24,
25] model. The BAO framework is able to show how the macro-level variables, such as social structure or social pressure affects the psychic states, such as beliefs, desires, opportunities and others, whether of individuals or organizational members. These psychic states affect the actions, for example, the adoption of green practices, the use of green technology, and others. Such actions would then affect the macro-level variable, which is the outcome. The BAO framework was developed for the purpose of examining the information systems, and the environmental sustainability of organizations. This is achieved by taking the macro-micro perspectives into consideration [
23]. Similarly, the current study also uses the BAO framework by integrating it with the social contract and stakeholder theories, so as to examine the LED usage of organizations and its impact on organizational performance.
1.3. Social Expectation
At the macro level of the BAO framework, an understanding of the influence of social expectations on organizations’ belief and its subsequent impact is crucial. To date, there has been an increase in the expectation of society which emphasizes on the responsible role businesses need to play towards the welfare of the society and the environment. Several instruments have been developed for improving, evaluating, and communicating such practices as a symbolization of social responsibility [
26]. An increase in corporate social responsibility highlights the importance of investigating it under the theoretical foundation of the social contract theory [
27]. The social contract theory asserts that businesses operate under an unwritten contract with the society; it requires organizations to act under certain conditions that would benefit the society [
28]. Organizations are expected to be responsible in treating the environment and the society with respect and dignity. This shows that social expectations play a role in influencing organizations’ intention to act in an environmentally responsible manner. For instance, adopting green practices that can reduce carbon emission, practicing green supply chain management, and using energy-efficient products like LED [
6]. The work of Donaldson and Dunfee [
29] viewed social contracts from macrosocial and microsocial perspective. The general expectation of the local community which expects organizations to provide some support to the community is a form of macrosocial contract. In contrast, the specific expectation on certain activities for organizations to do for the wellbeing of the community is categorized as microsocial contract [
30].
Previous studies have found that social expectations have a strong influence on organizations’ green practice. For instance, Lee et al. [
6] found that perceived social expectations of employees and top management had an impact on organizations’ adoption of environment responsible activities and green practices. Despite this, social expectations may vary between developed and less developed countries. High social expectations in developed countries demonstrate organizations’ greater involvement in environment friendly activities, as compared to less developed or emerging economies [
31,
32]. This implies that the investigation of social and environmental responsibilities of organizations in such countries require more scholarly attention [
32]. It had been noted that organizations which operate under the social contract theory may perceive environmental or socially responsible activities as part of social expectations. Claims had also been made that social expectations may be the trigger motivating organizations towards developing more positive environmental concerns. However, social expectations may not explain organizations’ complete involvement [
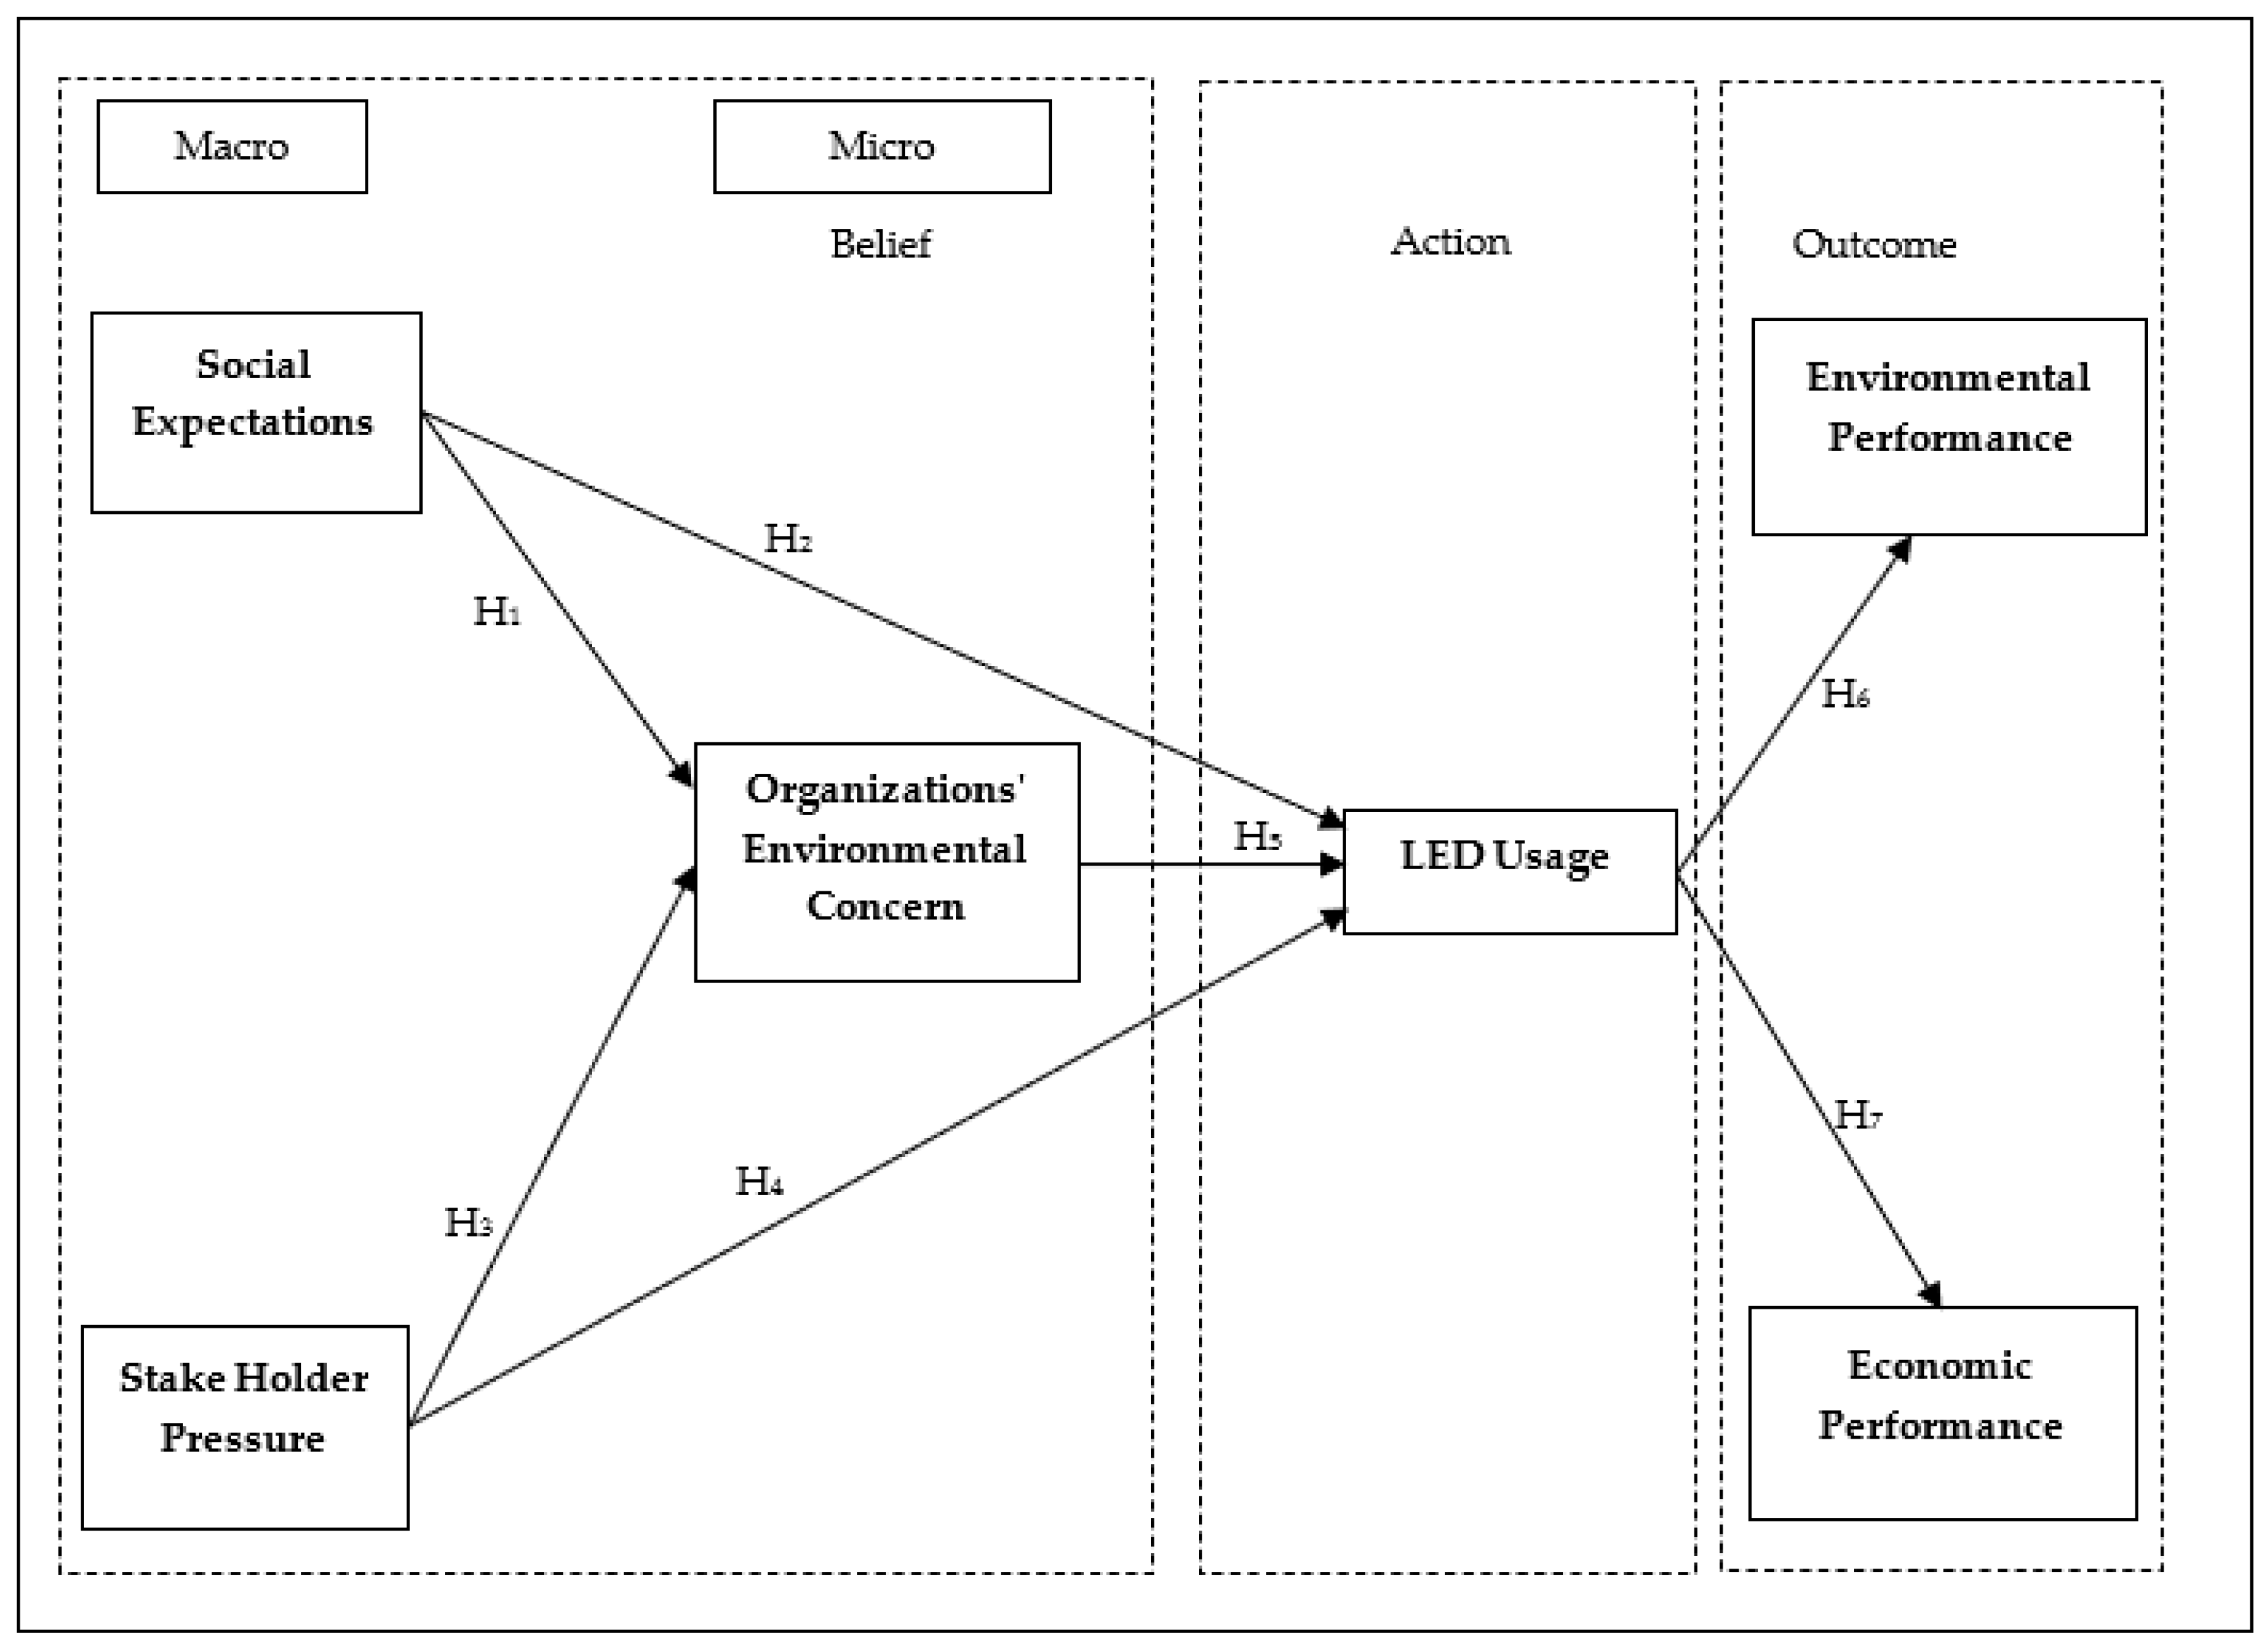
30] which may include actual usage of energy-efficient technology like LED, thereby improving environmental sustainability. Based on the above statements, this study was conducted to empirically examine the role of social expectations on organizations’ environmental concern and organizations’ actual usage of LED. Based on this, the following hypotheses were formulated:
Hypothesis 1 (H1). There is a relationship between social expectations and organizations’ environmental concern.
Hypothesis 2 (H2). There is a relationship between social expectations and LED usage in organizations.
1.4. Stakeholder Pressure
An important variable that is investigated under the macro level of the BAO framework is stakeholder pressure. Organizations’ activities and their decision-making processes are greatly influenced by the stakeholders [
6]. Thus, the stakeholder theory was introduced [
33]. According to the theory, stakeholders are individuals, groups, or organizations which can either affect or be affected by decisions made by corporate organizations [
33]. Many studies [
34,
35,
36] looking at corporate social responsibility and organizational performance have used stakeholder theory as a base. This theory is applied both from the management perspective and ethics perspective (Parmar et al., 2010; [
36]). The theory describes the importance of organizations in serving the community in a social or environmentally friendly manner that supports sustainability [
36,
37]. The stakeholder theory further states that the pressure from stakeholders motivates organizations to get involve in green practices including the adoption of green technologies like LED [
38,
39]. Stakeholder pressure also motivates organizations to implement environmental practices in their production and supply chain activities that reduce negative environmental impacts [
40] have found that higher perceived pressure from stakeholders tend to increase the proactivity of organizations and their response towards the environment. Previous studies [
41,
42] have documented well the relationship between stakeholder pressure and organizational green practices at the macro level [
43,
44].
In the business world, customers, suppliers and business partners are considered to be the most important type of stakeholders who can influence organizations’ environmental strategy and green practice adoption [
45]. The acceleration of customer preference in purchasing from organizations that fulfil environment standards is also another factor that pushes organizations into implementing green practices, which alleviate the negative impact to the environment. This practice simultaneously increases the organizations’ image. Pressure from suppliers and business partners also increases organizations’ environmental concern, thereby motivating them to implement green practices [
46].
To reduce the negative environmental impact, governments are introducing new legislations and environmental standards. It is important for organizations to follow these standards as the failure to follow may incur penalties or fines [
43,
44]. Moreover, pressure surfacing from the introduction of various awareness programs by NGOs may also improve the organizations’ understanding and concerns towards the environment, and influence them to use green technologies like LED in their respective organizations, whether for production, administration, or operation. Based on the above discussion, it can be deduced that stakeholder pressure plays an important role in shaping the organizations’ environmental concern and motivate them to use green technologies. To test this empirically in the context of LED, the following hypotheses were formulated:
Hypothesis 3 (H3). There is a relationship between stakeholder pressure and organizations’ environmental concern.
Hypothesis 4 (H4). There is a relationship between stakeholder pressure and LED usage in organizations.
1.5. Organizations’ Environmental Concern
The BAO framework explains the link between the macro level constructs, such as society, regulations, external pressure and the micro level constructs such as organizations or individuals’ beliefs and commitments towards the environment [
13,
47]. Green technology usage by organizations is not just driven by external macro level factors, but also by individuals, managerial and organizations’ behavior or attitude towards the environment [
48]. Awareness of environmental issues and its impact on the future generations have increased the environmental concerns of consumers. Consequently, these consumers participate by taking steps towards preserving the environment. This is accomplished by purchasing environment friendly products and services [
49,
50]. The increase in the demand for greener products [
51] has further increased organizations’ responsibilities in manufacturing green products [
52]. Due to this, organization are thus driven towards finding ways and strategies to go green [
50], whether for operations, administration or production.
Based on past literature [
53,
54], this study takes into account the concept of organizations’ environmental concern as the concern shown by organizations regarding environmental issues. This understanding also propels organizations towards making efforts to solve those issues. Several studies [
52,
55,
56,
57] had been conducted so as to examine the protection of the environment and for building environmental consciousness (ECO), such as green and responsible manufacturing. Organizations achieve this by implementing strategies related to sustainability and the use of green technologies, etc. [
12], claimed that managers’ attitude and beliefs about the environment, may influence the actions taken by organizations towards green technology usage. Similarly, Loeser et al. [
9] found that environmental orientation of an organization affects the green IS practices.
From the environmental perspective, it was noted that one of the highest shares in terms of electricity consumption in the residential and commercial sector is lighting, which consumes about 20% to 30% of the total electricity consumption [
58,
59,
60]. Higher energy consumption results in excessive gas emission and waste production which affect the environment [
60]. Good design, better installations and appropriate use of LED light source would contribute to environmental sustainability. However, bad choices and poor design of LEDs may lead to light pollution [
61,
62] and might create a rebound effect [
63].
When organizations in the commercial sector switch to energy efficient and good design LEDs, electricity consumption can be reduced [
60,
64]. Organizations that are concerned about the environment would use LED light sources. Thus, to empirically test this relationship, the following hypothesis was formulated:
Hypothesis 5 (H5). There is a relationship between organizations’ environmental concern and LED usage in organizations.
1.6. LED Usage and Organizational Outcome
It was mentioned earlier that the BAO framework states that managerial or organizational beliefs and commitments influence organizations’ actions. This would eventually lead to outcomes [
12]. The organizations’ action in using green technology might provide positive outcomes to the organizations in terms of improvements in environment and economic performance. Practices that have a positive effect on the environment can be divided into several categories. One is environmental activism, which includes organizations’ involvement in activities with environmental organizations, such as NGOs, so as to support the environment. The next one is non-activist behavior in the public sphere, which includes organizations taking steps in protecting the environment by willing to pay higher taxes, etc., This is followed by the private-sphere environmentalism, an example of which is seen in organizational actions of purchasing and using environment friendly products and disposing such products in the right way which has a positive impact on the environment. The last of these is organizations involving in other behaviors such as designing and manufacturing environment friendly products [
65,
66]. This study examines organizations’ private-sphere environmentalism practice by focusing on organizations’ use of environment friendly light source, the LED and its impact on the outcome.
Previous studies have investigated the impact of green practices on organizational performance. For instance, Ainin et al. [
22] found a positive relationship between adoption intensity of green IT practices with economic performance, environment performance and customer satisfaction. Similarly, Baggia et al. [
13] found that green IS implementation that is related to pollution prevention and sustainable development among small and medium enterprises has a positive impact on perceived organizational benefits, including environmental performance. In contrast, Cai and Li [
20] found that eco-innovation behavior of organizations can significantly promote firms’ environmental performance, but not their economic performance. The usage of LED among organizations, will thus, be able to improve the economic and environmental performance of organizations. Economically, although LED installation may be expensive, the operating cost is comparatively cheaper. LEDs are more economical as an option when compared to other products, such as fluorescent lighting. Generally, the lifespan of LED lamps are two to six times more than other options; however, high temperature and poorly designed LED driver may shorten the lifespan of the LED lamps [
67]. LEDs consume lower energy, thereby reducing electricity consumption [
68]. In their study, Khan et al. [
69] emphasized that LED adoption as an organization’s environmental behavior, can create opportunities. New markets can be developed, and more relevant exports can be created for nations that are pro-environmental, such as the United States, the United Kingdom, France and Poland.
In terms of LEDs impact on general environmental performance, previous literature have also investigated LEDs negative impact on plants [
70,
71], animals [
72] and humans [
73,
74]. For instance, flavoproteins such as cryptochromes and photoropins that are present in higher plants are sensitive to blue-rich LED light sources. Similarly LED light sources may also have effect on spring budburst in trees [
70]. Study by Supronowicz and Fryc [
71] have also examined LED light sources impact on botanical light pollution. Irresponsible use of blue LED light sources might negatively affect the circadian cycle which comprises of physical, mental and behavioral changes of human body [
73]. Nevertheless, from organizations’ perspective, the use of LEDs may have positive impact on organizations’ environmental performance. This is because, LED light sources provide significant energy saving, and it also reduces CO2 emissions [
68]. Since the LED light sources that are used under optimum temperature can last longer, the frequent disposal of the used lights is less, thereby leading to a waste reduction and saving the environment.
Very few studies have investigated LED usage in the Malaysian context with many of these studies [
4,
11,
68], focusing mainly on individual consumer adoption only, much less on its impact. This study will, therefore, investigate LED usage from the organizational perspective by examining its impact on organizations’ environmental and economic performance. Based on this, the following hypotheses were formulated:
Hypothesis 6 (H6). There is a relationship between LED usage and organizations’ environmental performance.
Hypothesis 7 (H7). There is a relationship between LED usage and organizations’ economic performance.
Figure 1 illustrates the research framework of the study.
2. Materials and Methods
This study was conducted among commercial organizations located within greater Kuala Lumpur, Malaysia. The area has been identified as the nation’s key economic importance and it comprises of the city of Kuala Lumpur, Putrajaya and all the districts of Selangor, except for Kuala Langat, Kuala Selangor, Sabak Bernam and Hulu Selangor. Over 37% of the nation’s GDP is related to Kuala Lumpur and Selangor; thus, the choice of selecting the commercial organizations that are located within the high growth economic region is crucial. This will ensure that such organizations are aware of the LED light sources and its usage for long-term business sustainability. A list of the commercial organizations was obtained from the Kuala Lumpur Business Directory where only those organizations involved in the primary, secondary and tertiary sectors were selected for sampling. The field workers contacted the organizations using telephone numbers indicated in the directory. A respondent’s name, as the person-in-charge, was requested for each of the organizations contacted. The respondent must be at least, a supervisory level employee who has knowledge about LED, and the organization concerned must also be using LED. Field workers distributed a total of 500 questionnaires over a period of two months. At the end of the period, only 315 questionnaires were returned to the researchers, fulfilling a response rate of 63% only.
The questionnaire developed for the study consists of two sections.
Section 1 includes questions that measure the dependent and independent variables.
Section 2 contains questions related to the organization and the respondents’ background. Since this study aims to identify the impact of LED usage, a screening question was asked, as a measure to verify the organization’s use of LED products. Only organizations that were LED users were allowed to participate in the survey. All the items in
Section 1 were adapted from previous studies. The items for the social expectation variable were adapted from [
6]. The items for stakeholder pressure and organization environmental concerns were adapted from [
75]. The LED usage items were adapted from [
76], while the environmental performance items were adapted from [
12]. Items for economic performance were adapted from [
77]. A five-point Likert scale was used to evaluate the questionnaire items.
Appendix A highlights the list of questionnaire items.
In the initial stage of the analysis, the mean and standard deviation of all the variables were examined. Organizations’ environmental concern variable yielded the highest mean of 3.93 (SD = 0.65), followed by environmental performance, with a mean value of 3.78 (SD = 0.58), and then economic performance, with the value of 3.77 (SD = 0.65). Social expectations carried a lower mean value of 3.43 (SD = 0.83) when compared to other variables although it was still above the average level. Overall, the mean value of all the variables ranged from 3.43 to 3.93. and the standard deviation values are from 0.58 to 0.79. This showed that the respondents’ opinion for all the variables were more towards the positive side and with moderate variation.
Table 1 shows the mean and standard deviation of the variables.
3. Results
Of the 315 questionnaires received, only a total of 300 completed questionnaires were suitable for analysis. The other 15 questionnaires were discarded due to incompleteness.
Table 2 details the organizations’ background, and the characteristics of the respondents. Most of the organizations (53.7%) were from the tertiary sector. About 27.7% of the organizations were in operation for five to 10 years, with 26.3% having more than 20 years. Majority of the organizations (70.3%) operate with less than 100 employees, followed by 11.7% employing 100 to 200 employees. Most of the respondents (42.7%) who represented the organizations were middle level managers, with one to five years of working experience.
The Structural Equation Modelling (SEM) Technique of the Partial Least Squares (PLS) was used to validate the measurement model and the hypothesis testing. Since this study aims to test the relationships between variables that were integrated from various theories, the PLS would be an appropriate method because it is more accurate for analyzing complex models, and when non-convergent or improper results were likely to occur [
78]. Following the recommendation of Hair et al. [
79], the PLS model was assessed in two stages. Stage one involved evaluating the measurement model which was done by looking at details of reliability, convergent validity, and discriminant validity. Stage two involved evaluating the structural model by using the details of R square (R
2), path-coefficients (β) and
t-values.
3.1. Measurement Model Assessment
To test the measurement model, the convergent validity, and internal consistency were accessed by examining the outer loads, Cronbach’s Alpha, composite reliability (CR) and the average variance extracted (AVE). Based on the recommendation of Hair et al. [
79], outer loadings should be above 0.708. However, not all the outer loads were above 0.708, as noted in
Table 3, where ENP1 (0.588), ENP2 (0.671) and ENP8 (0.639) were lower than 0.708. Instead of removing all the three items, they were retained in the study because the removal of these items would not increase the average extracted variance (AVE), or the composite reliability (CR) of the variable. In this study, all the composite reliability (CR) of the variables were found to be above 0.7, and below 0.95. Another similar measurement of internal consistency was traced to the Cronbach’s Alpha and Rho_A, which were greater than 0.70 [
79,
80,
81]. This outcome indicates that the variables have an adequate level of reliability and would not be problematic. It would also not lead to an inflated correlation between the indicators. Last but not least, the metric used to evaluate the converging validity of the construct was the average extracted variance (AVE), which was greater than 0.5 [
79].
Table 3 shows that the AVE surpasses its threshold value of above 0.5, ranging between 0.531 to 0.794. This outcome indicates an adequate and acceptable convergent validity of the reflective measurement model of this study.
The Fornell–Larcker criterion, cross-loadings, and the heterotrait–monotrait (HTMT) criterion were used to evaluate the discriminant validity.
Table 4 demonstrates the findings obtained from the Fornell–Larcker criterion. The square roots of the AVEs on the diagonals (as shown in bold) were found to be greater than those of the construct correlations (respective rows and columns). This is a good indicator of the strong correlations existing between the constructs and their corresponding indicators relative to other constructs within the model [
82,
83].
The HTMT ratio, as shown in
Table 5, was used to increase the accuracy of the discriminant validity. All the HTMT values were within the accepted threshold value of ≤0.85. This fulfils the requirement for the discriminant validity. The final method for assessing the discriminant validity of the measurement model was by examining the cross-loading of each indicator. It can be seen clearly (in
Appendix A,
Table A2) that each indicator loaded the highest on the associated construct (as shown in bold). This can be said to satisfy the discriminant validity requirement.
3.2. Structural Model Assessment and Hypothesis Testing
The structural model was evaluated using the beta (β),
p-value, R square (R
2), and
t-values through the bootstrapping technique. In this study, the R
2 value of the variable, Organizations’ environmental concern was 8% whereas the R
2 value for the endogenous latent variables—LED usage, economic performance and environmental performance was noted to be 20.8%, 15.5% and 23%, respectively. To test the hypotheses, the values of the path coefficients were examined. A strong positive relationship is represented by values close to +1 while a strong negative relationship is represented by values close to −1 [
84]. If the path coefficient value was closer to 0, it would be taken to represent a weaker and usually, insignificant, relationship [
85]. The R
2, path coefficients, and
t-values are shown in
Figure 2.
The results of path coefficient values show that social expectations (0.215) and stake holder pressure (0.098) have a weak positive relationship with organizations’ environmental concern. Similarly, social expectations (0.023), stake holder pressure (0.303) and organizations’ environmental concern (0.252) also have a weak positive relationship with LED usage. In contrast, LED usage (0.480) has a strong positive relationship with environmental performance, but a moderate positive relationship (0.394) with economic performance.
To test the significance of the relationships, the
t-values were examined. The results showed that stake holder pressure (3.913), and organizations’ environmental concern (4.366), with a t-value of more than 1.96 showed a significant relationship with LED usage. Social expectations (2.526) were also noted to carry a t-value of more than 1.96, showing a significant relationship with organizations’ environmental concern. Similarly, LED usage, with t-value of more than 1.96, also showed a significant relationship with economic performance (7.223) and environmental performance (10.413). However, social expectations (0.266) with LED usage, and stake holder pressure (1.141) with organizations’ environmental concern, have t-value of less than 1.96, showing an insignificant relationship. Based on this, it can be said that Hypotheses 1, 4, 5, 6 and 7 were supported while Hypotheses 2 and 3 were not supported.
Table 6 summarizes the results of the hypothesis testing.
To determine the impact of the exogenous latent constructs (as to weak, moderate or significant) on endogenous latent constructs, the effect sizes (f
2) of the variables were also examined [
86]. According to Chin [
82]. F
2 values of 0.02, 0.15 and 0.35, for the latent exogenous variable would represent weak, moderate and substantial effects, respectively. The results of this study showed that stake holder pressure and organizations’ environmental concern have small effects on LED usage whereas social expectations and stake holder pressure have small effects on organizations’ environmental concern. LED usage has a moderate effect on economic performance (0.183), but a large effect on environmental performance (0.299).
Table 7 demonstrate the effect size (f
2) of the variables in this study.
4. Discussion
Considering the growing responsibility of organizations towards the development of sustainable environment, this study investigated the factors that influenced their use of energy-efficient and long-lasting lighting sources (LED products), as well as its subsequent impact on organizational performance. With BAO framework as the theoretical background, the influence of the macro level factors (social expectation and stakeholder pressure), and the micro level factor (organization environmental concern) on LED usage was examined, followed by its subsequent impact on organizations’ environmental and economic performance. Data were collected from 300 Malaysian organizations that are currently using LED products. Majority of the organizations (82%) that responded to the survey were small and medium sized enterprises (SMEs) with less than 200 employees. About 98.5% of the business establishments in Malaysia are SMEs [
87]; therefore, it is obvious to get more response from this group of organizations.
The results generated from this study showed that perceived expectations of the society towards organizations’ environmental activities positively influenced organizations’ environmental concerns, thus supporting H1. The result is consistent with Moir [
30], who stated that an increase in organizations’ motivation towards environmental activities or environmental concerns can be influenced by social expectations. However, the findings showed that social expectations did not have a significant influence on organizations’ use of LED. Thus, H2 is rejected. This outcome contradicted the findings of Lee et al. [
6], who noted that social expectations had a positive influence on the adoption of green practices. However, according to Moir [
30], the initial motivation of the organization may be influenced by social expectation, but the total involvement or the actual action of the organizations towards environmental activities (such as LED usage) may not be influenced by social expectations.
Additionally, the results also showed a non-significant relationship between stakeholder pressure and organizations’ environmental concern, thereby rejecting H3. Although this study had revealed that stakeholder pressure does not influence organizations’ environmental concerns, it appears that stakeholders’ pressure for organizations to be environmentally friendly would directly influence organizations to become involved in sustainable green practices. Hence the outcome of H4 was supported which showed a direct significant relationship between stakeholder pressure, and LED usage. Organizations which do not respond to stakeholders’ pressure may face loss of customers, or the loss of suppliers as well as government support, thereby affecting their sustainability. This forces the organizations to take environmentally friendly actions, such as using LED products. The result is consistent with [
6,
39], who found stakeholder pressure to have a significant influence on organizations’ adoption of green practices.
This study also found a significant positive relationship between organizations’ environmental concerns and LED usage, thereby supporting H5. Previous studies [
52,
75,
88] had found that consumers’ environmental concerns motivate them towards purchasing and using green products. From the organizational perspective, this study found that organizations’ environmental concerns can influence them to use green products like LED. Such practices inevitably, contribute to the sustainability of the environment.
Further to the above, this study also found LED usage to have a significant positive impact on organizations’ environmental performance, thereby supporting H6. The LED usage can provide various environmental benefits, such as reduce energy consumption and waste production. By using environmentally friendly products like the LED, organizations can conserve and protect the environment whilst enhancing their corporate image simultaneously [
12]. The result thus far generated from the current study is consistent with previous studies [
12,
22] which noted a significant positive relationship between green IS practices, and environmental performance. In this regard, H7 was also supported since there was a significant relationship between LED usage and economic performance. Previous studies had been both supportive and contradictory for such a relationship [
22], for instance, found the adoption of green IT practices to have a positive impact on economic performance [
20]; however, found no significant relationship between eco-innovation behavior and economic performance. Despite this being so, it can be affirmed that LED usage can provide economic benefits to organizations. LED light sources consume less energy, thereby reducing electricity consumption and costs for organizations; LED light sources operated under optimum temperature also last longer, thereby reducing the cost of purchasing light bulbs frequently. Both these benefits lessen the frequency of waste disposal and waste treatment. Overall, the present study found that LED usage can improve both the environmental and economic performance of organizations.
From the theoretical point of view, there is a lack of studies examining the use of LED and its impact [
10]. Therefore, the current study has thus contributed to literature by investigating the antecedents of LED usage and its impact to organizations in terms of economic and environmental performance. Secondly, based on social contract theory, this study added the macro level factor “social expectation” under the BAO framework and studied its influence on micro level belief and action. At the micro level, previous studies mostly examined the managers’ or organizations’ general attitude towards environment [
12,
13]. However, this study specifically investigated the organizations’ environmental concern and its impact on organizational action (LED usage). The integration of the BAO framework with specific variables can be used by future studies for investigating various green technology adoption and its impact.
This study has several practical implications. Like many other countries, Malaysia is also taking several initiatives to increase the use of energy-efficient products, such as LEDs, among individuals and organizations [
5]. Similarly, this study also offers a clearer insight of the driving factors that influence LED usage, and its subsequent impact. The outcome derived from this study would motivate organizations to use LED light sources. This study also offers explanations on the importance of the macro and micro level factors that influenced LED usage. This knowledge could help managers to formulate better strategies in building greener climate which supports green technology usage in organizations. Moreover, an improvement in both the economic and environmental performance is important for organizations as it helps organizations to sustain themselves in this competitive landscape. This study confirms that LED usage improves both the economic and environment performance, hence it serves as the motivation and justification for LED investments by organizations. These investments would also increase organizations’ contribution towards preserving the environment.
Limitation and Future Directions
Despite the many theoretical and practical contributions of the study, this study also has some limitations. The first of these is the quantitative method used to collect data. Although some interesting findings were revealed, the qualitative or mixed research method may be used to gain an in-depth understanding of organizations’ adoption of LED and its impact. The next limitation is traced to the perceptual and subjective measures used for assessing the performance. These measures were used due to the difficulty of obtaining objective numeric data from organizations. Future studies may consider using objective metrics to measure the actual performance of organizations. The third limitation is that this study collected data in one period of time, using the cross-sectional method. To understand the impact of LED on the improvement of environmental and economic performance over a period of time, future studies may consider using longitudinal data collection method. The current study included some specific variables, such as social expectations and organizations’ environmental concern to the BAO framework. The outcome clarified its relationship in the context of organizations’ environmental beliefs, actions and outcomes. There may be other interesting macro and micro level factors that can be investigated into the BAO framework. Future studies should identify these factors and examine what influence they may have in the context of organizations’ green technology adoption and its impact.


