Abstract
BodyMetrix™ BX-2000 (IntelaMetrix, Livermore, CA, USA) has been introduced as one of the alternatives and portable methods to estimate body fat percentage. However, inconsistent results between protocols built-in the BodymetrixTM may be compelling the question of its validity. Thus, this study first investigated the possible errors between protocols and evaluated the validity of body fat percentage (BF%) compared to the gold standard method (dual-energy X-ray absorptiometry, DEXA). One hundred and five collegiate males, aged 20.01 ± 2.11 years, body height, 174.81 ± 6.01 cm, body mass, 73.26 ± 13.60 kg, and body mass index, 23.91 ± 3.77 kg·m−2 participated in the present study. Participants’ body fat percentage was estimated by built-in nine different protocols in the BodyMetrix™ BX-2000 using A-MODE ultrasound. Pearson correlation (r), Mean absolute percentage errors (MAPEs), Bland & Altman plots, and Equivalence testing were used to examine the validity of each protocol by comparing it to the criterion measure (i.e., DEXA). The results indicated good potential for almost all of the protocols in correlation (Min: r = 0.79, Max: r = 0.92)., MAPEs (Min: 20.0%, Max: 33.8%), and Bland-Altman (Min diff: 16.7, Max diff: 41.4). Particularly, the estimated BF% from protocol 7 (4-sites by Durnin & Wormersley) and protocol 9 (9-sites Parllo) were completed within the equivalence zone (±10% of the mean). The estimates measured by protocol 7 and protocol 9 identified as the most valid methods for estimating BF% using a BodyMetrix™ BX-2000, compared to the DEXA. Our findings provide valuable information when applying in young male individuals, but future studies with other populations such as female or adolescents may be required to suggest a valid protocol within the instrument.
1. Introduction
The World Health Organization referred to obesity as a “New Infectious Disease of the 21st century” [1], however, complex social structures and dietary changes affect people’ lifestyle, resulting in a steady increase in obesity due to lack of exercise, malnutrition, and stress [2]. Also, obesity is associated with insulin resistance that increases cardiovascular diseases [3], and it makes us suffer from diseases such as metabolic syndrome, coronary artery disease, type 2 diabetes, hyperlipidemia, and cancer [4].
With increasing age, individuals are more easily exposed to the changes that adversely affect individuals’ health and are at an increased risk of gaining weight [5]. In particular, obesity in early adulthood is likely to lead to obesity in adulthood, forming both healthy body weight and healthy body composition is very important [5]. One of the strategies that are promising in preventing obesity is to pinpoint critical periods of weight gain. One such recognized critical period of weight gain is the student transition from high school to college life [6]. Also, Gropper and colleagues said that it is important for young adults to maintain their health with proper weight status because adults aged 18 and 25 show a significant weight gain due to changes in the amount of stored body fat to their weight [7]. Unfortunately, once individuals start gaining weight, it becomes hard to reverse and increases vulnerability to obesity.
Most college student access to obtain information on their body composition using Body Mass Index (BMI) classification charts, however, BMI has demonstrated that it is not a reliable method because it does not clearly classify personal characteristics and it could not accurately measure adipose tissue percentage [8,9,10]. Therefore, it has been recently reported that Dual-Energy X-ray Absorptiometry (DEXA) and BodyMetrix™ BX-2000 (IntelaMetrix, Livermore, CA, USA) are the best way to measure body fat as an alternative method [10,11]. DEXA is a standard method which has high accuracy and reliability with lower error than 2% in measuring body fat percentage (BF%), and the measurements using ultrasound like BodyMetrix™ BX-2000 also is highly evaluated for its utilization because it is portable, easy to use, inexpensive, and accurate in measuring BF%. According to the Smith and his colleagues’ study, they demonstrated that BodyMetrix™ BX-2000 ultrasound device was a valid and reliable standard testing tool for measuring BF% [12]. In addition, there are some recent studies for comparing DEXA and each of the 9 protocols in BodyMetrix™ BX-2000. Lyon and colleagues verified the validity of the 7-sites protocol by Jackson & Pollock using BodyMetrix™ BX-2000 compared to the DEXA [13]. Also, Ulbricht et al. indicated that the 9-sites Parllo protocol and DEXA had high validity [14], and Kang and his colleagues’ study also verified that there was high validity between 3-sites protocol by Pollock of BodyMetrix™ BX2000 and DEXA [15].
However, there were inconsistencies among the available studies on comparing the different protocols using BodyMetrix™ BX-2000. Johnson and his colleagues evaluated between 7-sites by Jackson & Pollock protocol in BodyMetrix™ BX-2000 compared to the DEXA, and they indicated that Jackson & Pollock protocol in BodyMetrix™ BX-2000 were underestimated for the BF% [16]. Loenneke et al. found that 1-point Bicep protocol and 3-sites protocol by Jackson & Pollock in BodyMetrix™ BX-2000 significantly underestimated BF% when compared with DEXA [17]. Therefore, the purpose of the present study systemically investigates possible errors in different protocols and to demonstrate the validity of BF% between each different protocol in BodyMetrix™ BX2000 compared to the criterion method (i.e., DEXA) through the novel statistical analysis (i.e, Equivalence test).
2. Materials and Methods
2.1. Participants
One hundred-five college male students participated in the present study. All participants provided their written informed consent after obtaining a full explanation of the study’s purpose, benefit, risk, and procedure. The present study was approved by the Institutional Review Board of Yongin University (2-1040966-AB-N-01-20-1810-HSR-113-8).
2.2. Anthropometric and Body Composition
The height and body weight were assessed using a stadiomet and a digital scale, respectively. The body mass index (BMI) was calculated as weight (kilogram) divided by the height in square meters. Body fat percentage was measured with a dual-energy X-ray absorptiometry (DEXA; GE Healthcare, Madison, WI, USA). DEXA was performed in barefoot and to remove the metal substance from wearing light clothing and their body for whole-body scan area.
2.3. BodyMetrix™ BX2000
The present study utilized BodyMetrix™ BX2000 as a tool using ultrasound waves (IntelaMetrix, Brentwood, CA, USA). This ultrasound device used the principle of reflection that some waves penetrated, and others reflected the probe when sonic waves move into the border of the two mediums with different acoustic resistances. A-MODE was used by ultrasound imaging method and it is called by amplitude mode compared to the B-MODE which only displays the brightness mode. A-MODE is the most basic form among ultrasound imaging methods that indicate the intensity of the reflected sound in time (distance) and is also an effective method for measuring distances. It transmits high-frequency sound waves to penetrate. Through body tissues with A-Mode 2.5 Mhz portable ultrasound. The differentiation of the body tissue interface is determined based on the return times of ultrasound to reflect though the sound head transducer. In addition, the primary advantage of this device is that it can minimize human measurement errors, unlike the skin fold measure. There are 11 protocols for ultrasound measurements in males, however, the present study used only 9 protocols except for two protocols developed for adolescents (2-site by slaughter 8–17 (yrs), 2-sites by slaughter for children). Table 1 shows 9 protocols and anatomical sites.

Table 1.
Measuring sites of each protocol.
2.4. Data Analysis
Demographic information (i.e., Age) and participants’ body composition (i.e., Height, Weight, and BMI) were examined by descriptive statistics using SPSS 25.0 version. Pearson correlations were used to investigate the association between each protocol and the criterion method (i.e., DEXA). Mean absolute percent errors (MAPE) were calculated to provide the overall measurement error of 9 protocols. The mean absolute percentage errors are widely used performance evaluation indices in prediction. This is a more conservative estimate of error that takes into account both over-and under-estimation because of using the absolute value in the calculation. Repeated measure ANOVA to determine if there were any statistical differences between these 9 protocols and inter-individual differences were controlled for. Furthermore, the novel statistical approach, ‘equivalence testing’, was utilized in this study to examine measurement agreements between the protocols and the DEXA. Unlike traditional testing, the estimate was considered equivalent if the 90% confidence interval (CI) for the mean was included in the proposed equivalence zone (e.g., ±10% of the mean) in the 95% equivalence test (i.e., 5% alpha). The estimated BF% and measured BF% across all protocols and the 90% CI for means of the estimated and measured BF% were obtained from a mixed ANOVA to control for participants’ level clustering. It has also evaluated a novel approach to examine for ‘significantly equivalence’ rather than zero differences between different measurements [18].
3. Results
Table 2 summarizes particpants’ basic characteristics including age, height, body weight and body mass index. The mean ± SD was calculated for age, height, weight, and BMI (20.01 ± 2.11 years, 174.81 ± 6.01 cm, 73.26 ± 13.60, and 23.91 ± 3.77 kg·m−2).
Table 2.
Characteristics and body composition of participants.
Table 3 presents the correlation coefficients (r) between nine protocols and DEXA as a criterion method. Overall, the BF% measured by the nine protocols were highly correlated with the criterion measure (Max: r = 0.92, Min: r = 0.79). The strongest association was seen by protocol 8 (7-sites by Jackson & Pollock) and protocol 4 (3-sites by Pollock) (protocol 8: r = 0.92, protocol 4: r = 0.90), followed by protocols 7 (4-sites by Durnin & Wormersley, r = 0.87) and protocol 5 (4-sites NHCA Formula, r = 0.87).
Table 3.
Correlations between DEXA and each protocol.
Figure 1 presents the MAPE for the nine protocols. Each protocol was calculated as the average absolute value of the errors based on DEXA, and the overall range of the error was from 20.0% to 38.8%. Protocols with the least errors were protocol 1 (1-point Bicep, 20.0%) and protocol 7 (4-sites by Durnin & Wormersley, 22.8%), followed by protocol 4 (3-sites by Pollock, 25.5%) and protocol 6 (4-sites by Forsyth-Sinning, 26.5%).

Figure 1.
Mean absolute percentage error (MAPE) of body fat %.
A 1 × 9 repeated measures ANOVA with a post-hoc Bonferroni analysis showed that there was a significant difference (F [9, 1040] = 28.23; p < 0.001) between protocols, but no significant differences were observed between measured BF% and estimated BF% from Protocol 1 (p = 0.133), Protocol 6 (p = 1.000), Protocol 7 (p = 1.000), and Protocol 9 (p = 1.000). Figure 2 indicated the equivalence testing whether the BF% estimates from the nine protocols were equivalent to the estimate from the criterion measure (i.e., DEXA) and plots indicating the distribution of errors for all protocols. The calculated 90% CI for the estimates from the nine protocols were computed with the calculated equivalence zone for the DEXA. In particular, the estimated BF% from protocol 7 (4-sites by Durnin & Wormersley) and protocol 9 (9-sites Parllo) were significantly equivalent to the DEXA. This result showed that two different protocols (protocol 7 and protocol 9) were completely within the equivalence zone of the BF% measured by the DEXA (lower bound = 16.39%, upper bound = 20.03%).
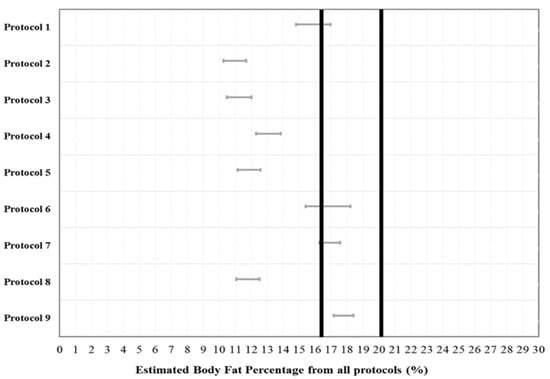
Figure 2.
Dark lines mean equivalence zone (±10% of the mean), Grey lines are the 90% confidence interval for a mean of the estimated each protocol. Only protocol 7 and 9 are included within the equivalence zone.
Figure 3 illustrates the Bland-Altman plot for the extent of agreement between each protocol and the DEXA and assist with testing for proportional systematic bias in the estimates. The plots show mean bias, 95% limits of agreement, and line of best fit. The x-axis is the mean of two different measurements and the y-axis is the DEXA. The narrowest 95% limits of agreement of plots were protocol 8 (7-sites by Jackson & Pollock, difference = 16.4), followed by protocol 4 (3-sites by Pollock, difference = 16.7). Also, values of protocols were still higher for the protocol 1 (1-point Bicep, difference = 16.8), protocol 3 (3-sites by Jackson & Pollock, difference = 17.9), protocol 5 (4-sites NHCA Formula, difference = 18.4), protocol 2 (2-sites by A. W. Sloan, difference = 19.0), protocol 7 (4-sites by Durnin & Wormersley, difference = 19.0), protocol 9 (9-site Parllo, difference = 21.7), and protocol 6 (4-sites by Forsyth-Sinning, difference = 41.4). The clustering points of data in plots were indicated the mean for each protocol, compared to the DEXA and all protocols’ slopes were observed as significant bias. The protocol 1 (intercept = 1.20, slope = −0.20, p = 0.001) and protocol 6 (intercept = 2.87, slope = −0.08, p = 0.002) tended to increase in a negative direction in comparison with the DEXA, however, another slopes for the fitted line showed a tendency to increase in a positive direction for protocol 2 (intercept = −1.90, slope = 0.62, p = 0.001), protocol 3 (intercept = −1.11, slope = 0.54, p = 0.001), protocol 4 (intercept = −3.35, slope = 0.54, p = 0.000), protocol 5 (intercept = −3.01, slope = 0.62, p = 0.001), protocol 7 (intercept = −11.0, slope = 0.70, p = 0.001), protocol 8 (intercept = −2.28, slope = 0.58, p = 0.000) and protocol 9 (intercept = −13.7, slope = 0.78, p = 0.001).
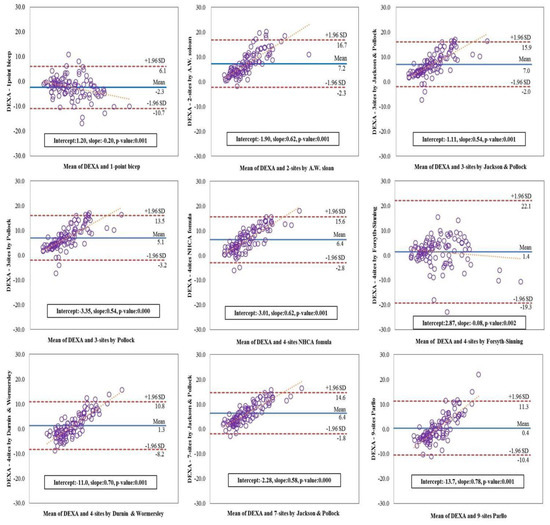
Figure 3.
Bland-Altman plots for body fat percentage measured by each protocol.
4. Discussion
Skin fold thickness measurement is a cheap and non-invasive method to estimate body fat percentage and this method has been widely applied for all age goups. Different numbers of body site measurements with various equations has been introduced up to date, but investgators’ technique plays an important role in obtaining accurate data. To minimize this potential error, advanced techniques using ultrasound such as a BodyMetrix™ BX-2000 has been introduced. This validation study compared the body fat percentage between nine different protocols built-in the BodyMetrix™ BX-2000 and DEXA measurements in collegiate male students. Overall, the estimated BF% from nine different protocols built-in the BodyMetrix™ BX-2000 were favorable compared with a gold standard method. Particulary, protocol 7 (4-sites by Durnin & Wormersley) and protocol 9 (9-site Parllo) have shown the most accurate measurements.
All nine protocols showed a relatively high correlation with the DEXA, in particular, protocol 8 (7-sites by Jackson & Pollock, r = 0.92) and protocol 4 (3-sites by Pollock, r = 0.90) showed the highest correlation. The consistent results have been identified in Kelly and colleagues’ study where protocol 8 (7-sites by Jackson & Pollock) showed a high correlation with the DEXA (r = 0.92) in male collegiate students (n = 35, average BMI = 25.6 kg·m−2) [19]. Also, there was a significat correlation between protocol 3 and BF% measured by DEXA in male collegiate student (n = 93, average BMI = 24 kg·m−2) [20]. However, some differences between the results of MAPE and the correlations were found in the present study. Based on the results of MAPE values, the protocols with an error range below 30% were shown in protocol 1 (1-point Bicep, 20.0%), protocol 7 (4-sites by Durnin & Wormersley, 22.8%), protocol 4 (3-sites by Pollock, 25.5%), protocol 6 (4-sites by Forsyth-Sinning, 26.5%), and protocol 9 (9-site Parllo, 26.7%). There are some possible reasons that could explain the different results between correlation and MAPEs. For instance, the Pearson correlation was used to examine the two variables for each individual in a group, so it examines the group level association for each protocol in this study. When evaluating two variables’ agreement using the correlation, two variables can be associated with each other. But the results may provide very different estimates at a group level. In addition, MAPEs delivers information regarding the individual agreement because it accounts for each participant’s error while avoiding the cancellation of errors from under- and over-estimation. It means that the magnitude of error can be examined by calculating MAPE, but it does not quantify the overall direction (i.e., over- and under-estimation).
In contrast to the MAPE and correlation measures, Bland–Altman plots have clear utility to examine the visual inspection of under- and over-estimation between two variables, but a limitation is that they do not indicate a way to statistically evaluate the agreement. The information helps understand the nature and source of the proportional systematic biases, but it presents a significant challenge for drawing definitive conclusions based on the distributions in Bland-Altman plots. Standard inferential statistics such as t-tests and ANOVA are also often used to compare two measures and assess group agreement. However, these statistical tests are designed to test for differences rather than agreement.
Therefore, the present study used a more appropriate analytical method such as equivalence testing to identify validity. Some studies demonstrated that equivalence testing is a more powerful and reliable method for comparing different assessment measures and evaluating agreement among measurements [21,22,23]. The remarkable findings from this study were that the results of equivalence testing were some seemingly discrepant results based on the results of correlation, MAPEs, and inferential statistics (i.e., repeated-measures ANOVA. Protocol 8 and Protocol 4, for example, showed a high correlation between the BF% estimated by the ultrasound device compared to BF% measured by the DEXA, and Protocol 1, 6, 7, and 9 did not show the statistical differences compared to measured BF% by the DEXA. However, the results of protocol 7 (4-sites by Durnin & Wormersley) and protocol 9 (9-site Parllo) located completely within the proposed equivalence zone (e.g., ±10% of the mean) in the 95% equivalence test, and it means that protocol 7 and protocol 9 had confirmed the validity of the portable ultrasound device.
There are some strength and limitations in the present study. First of all, this is the first study that investigate the validity of the total nine protocols built-in the BodyMetrix™ BX-2000 for estimating BF% through advanced statistical testing, “equivalence testing”. Moreover, this study also exmined that equivalence testing is a reliable statistical method rather than other methods (i.e., correlation, MAPE) when comparing the validity of different measuring devices. Therefore, the study demonstrated that protocol 7 (4-sites by Durnin & Wormersley) and protocol 9 (9-site Parllo) were more adaptable for measuring BF% of male college students with a normal BMI. Also, considering the measurement efficiency, using the values measured Protocol 7 (4-sites by Durnin & Wormersley) would be more compatible to evaluate BF% because it requires fewer measurements. The study provided new insights about the BodyMetrix™ BX-2000, but it does have some limitations. The age range of sample participants is limited to college students, and gender is also limited to only males. Therefore, it is difficult to generalize findings in this study to other age groups or females. Also, our study did not assess the reliability of each protocol even if poor reliability can negatively impact the validity, and except the protocol 1 and protocol 6, proportional systemic biases were observed in Bland-Altman. In terms of equivalent testing in this study, ±10% of the mean of the DEXA was used as a lower and upper boundary of the equivalence zone. However, more supportive research is clearly needed to compare results with diverse populations and criterion measures.
5. Conclusions
The present study evaluated the validity of a commercially available ultrasound device to measure BF%. The study shows that a small, portable, and easy-to-use ultrasound system allows reasonably good estimates of BF%. Furthermore, measuring BF% with the ultrasound BodyMetrix™ BX-2000 rather than measuring it by the expensive and laboratory-based DEXA is shown comparable estimation of BF%. Reasonable estimates of BF% enable health and fitness practitioners to provide better care to their clients or patients regarding healthy body composition.
Author Contributions
Data curation S.K. and J.-M.L.; Formal analysis, S.K., J.-H.P., Y.I.K. and J.-M.L.; Investigation, S.K., Y.I.K. and J.-M.L.; Methodology, S.K., M.-W.S., H.C.J., Y.I.K. and J.-M.L.; Project administration, S.K.; Writing—original draft, S.K.; Writing—review & editing, J.-H.P., M.-W.S., H.C.J. and J.-M.L. All authors have read and agreed to the published version of the manuscript.
Funding
This work was supported by the 2016 Research Fund of the Yongin University.
Acknowledgments
The authors would like to thank all participants who participated in this study.
Conflicts of Interest
The authors no conflict of interest to declare.
References
- World Health Organization. Obesity and Overweight; World Health Organization: Geneva, Switzerland, 2017. [Google Scholar]
- Lee, A.; Cardel, M.; Donahoo, W.T. Social and Environmental Factors Influencing Obesity. In Endotext [Internet]; MDText. com, Inc.: South Dartmouth, MA, USA, 2019. [Google Scholar]
- Valle, M.; Gascón, F.; Martos, R.; Ruz, F.J.; Bermudo, F.; Morales, R.; Cañete, R. Metabolic cardiovascular syndrome in obese prepubertal children: The role of high fasting insulin levels. Metab. Clin. Exp. 2002, 51, 423–428. [Google Scholar] [CrossRef] [PubMed]
- Kumari, M.; Kozyrskyj, A.L. Gut microbial metabolism defines host metabolism: An emerging perspective in obesity and allergic inflammation. Obes. Rev. Off. J. Int. Assoc. Study Obes. 2017, 18, 18–31. [Google Scholar] [CrossRef] [PubMed]
- Thiebaud, R.S.; Abe, T.; Loenneke, J.P.; Fujita, E.; Akamine, T. Body fat percentage assessment by ultrasound subcutaneous fat thickness measurements in middle-aged and older adults. Clin. Nutr. 2019, 38, 2659–2667. [Google Scholar] [CrossRef] [PubMed]
- Hoffman, D.J.; Policastro, P.; Quick, V.; Lee, S.-K. Changes in body weight and fat mass of men and women in the first year of college: A study of the “freshman 15”. J. Am. Coll. Health 2006, 55, 41–46. [Google Scholar] [CrossRef] [PubMed]
- Gropper, S.S.; Simmons, K.P.; Connell, L.J.; Ulrich, P.V. Changes in body weight, composition, and shape: A 4-year study of college students. Appl. Physiol. Nutr. Metab. Physiol. Appl. Nutr. Metab. 2012, 37, 1118–1123. [Google Scholar] [CrossRef] [PubMed]
- Glaner, M.F.; Lima, W.A.; Borysiuk, Z. Body fat deposition and risk factors of cardiovascular diseases in men. Hum. Mov. 2010, 11, 45–50. [Google Scholar]
- Gómez-Ambrosi, J.; Silva, C.; Galofré, J.C.; Escalada, J.; Santos, S.; Gil, M.J.; Valentí, V.; Rotellar, F.; Ramírez, B.; Salvador, J. Body adiposity and type 2 diabetes: Increased risk with a high body fat percentage even having a normal BMI. Obesity 2011, 19, 1439–1444. [Google Scholar] [CrossRef] [PubMed]
- Loenneke, J.P.; Hirt, K.M.; Wilson, J.M.; Barnes, J.T.; Pujol, T.J. Predicting body composition in college students using the womersley and durnin body mass index equation. Asian J. Sports Med. 2013, 4, 153. [Google Scholar] [CrossRef] [PubMed]
- Morrow, J.R., Jr.; Mood, D.; Disch, J.; Kang, M. Measurement and Evaluation in Human Performance, 5E; Human Kinetics: Champaign, IL, USA, 2015. [Google Scholar]
- Smith-Ryan, A.E.; Blue, M.N.; Trexler, E.T.; Hirsch, K.R. Utility of ultrasound for body fat assessment: Validity and reliability compared to a multicompartment criterion. Clin. Physiol. Funct. Imaging 2018, 38, 220–226. [Google Scholar] [CrossRef] [PubMed]
- Lyon, J.; Drew, R.; MacRae, H. Comparison of skinfold thickness measures with ultrasound imaging to determine body composition. In Proceedings of the 26th Annual Meeting of the Southwest Chapter of the American College of Sports Medicine, San Diego, CA, USA, 10–11 November 2006. [Google Scholar]
- Ulbricht, L.; Neves, E.B.; Ripka, W.L.; Romaneli, E.F. Comparison between body fat measurements obtained by portable ultrasound and caliper in young adults. In Proceedings of the 2012 Annual International Conference of the IEEE Engineering in Medicine and Biology Society, San Diego, CA, USA, 28 August–1 September 2012; IEEE: San Diego, CA, USA, 2012; pp. 1952–1955. [Google Scholar]
- Kang, S.; Lee, M.; Kim, Y. Feasibility of Ultrasound Measuring Equipment by Body Fat Percentage Examination. J. Asian Soc. Health Exerc. 2019, 1, 19–29. [Google Scholar]
- Johnson, K.E.; Naccarato, I.A.; Corder, M.A.; Repovich, W.E. Validation of three body composition techniques with a comparison of ultrasound abdominal fat depths against an octopolar bioelectrical impedance device. Int. J. Exerc. Sci. 2012, 5, 205. [Google Scholar] [PubMed]
- Loenneke, J.P.; Barnes, J.T.; Wagganer, J.D.; Wilson, J.M.; Lowery, R.P.; Green, C.E.; Pujol, T.J. Validity and reliability of an ultrasound system for estimating adipose tissue. Clin. Physiol. Funct. Imaging 2014, 34, 159–162. [Google Scholar] [CrossRef] [PubMed]
- Hauck, W.W.; Anderson, S. A new statistical procedure for testing equivalence in two-group comparative bioavailability trials. J. Pharmacokinet. Biopharm. 1984, 12, 83–91. [Google Scholar] [CrossRef] [PubMed]
- Johnson, K.E.; Miller, B.; Juvancic-Heltzel, J.A.; Agnor, S.E.; Kiger, D.L.; Kappler, R.M.; Otterstetter, R. Agreement between ultrasound and dual-energy X-ray absorptiometry in assessing percentage body fat in college-aged adults. Clin. Physiol. Funct. Imaging 2014, 34, 493–496. [Google Scholar] [CrossRef] [PubMed]
- Pineau, J.-C.; Filliard, J.R.; Bocquet, M. Ultrasound techniques applied to body fat measurement in male and female athletes. J. Athl. Train. 2009, 44, 142–147. [Google Scholar] [CrossRef] [PubMed]
- Staudenmayer, J.; Zhu, W.; Catellier, D.J. Statistical considerations in the analysis of accelerometry-based activity monitor data. Med. Sci. Sports Exerc. 2012, 44, S61–S67. [Google Scholar] [CrossRef] [PubMed]
- Hopkins, W.; Marshall, S.; Batterham, A.; Hanin, J. Progressive statistics for studies in sports medicine and exercise science. Med. Sci. Sports Exerc. 2009, 41, 3. [Google Scholar] [CrossRef] [PubMed]
- Dixon, P.M.; Saint-Maurice, P.F.; Kim, Y.; Hibbing, P.; Bai, Y.; Welk, G.J. A primer on the use of equivalence testing for evaluating measurement agreement. Med. Sci. Sports Exerc. 2018, 50, 837. [Google Scholar] [CrossRef] [PubMed]


Publisher’s Note: MDPI stays neutral with regard to jurisdictional claims in published maps and institutional affiliations. |
© 2020 by the authors. Licensee MDPI, Basel, Switzerland. This article is an open access article distributed under the terms and conditions of the Creative Commons Attribution (CC BY) license (http://creativecommons.org/licenses/by/4.0/).