Abstract
Sustainability has become a significant issue for firms and investors throughout the world, although it cannot be attained if policies impact the stability of firms’ dividend policies. In this paper, we use data from the Stoxx Euro 600 firms from 2000 to 2019 and the ESG (environmental, social and governance) scores from Thomson Reuters to assess the relationship between ESG responsibility performances and the firm’s dividend policy. The results indicate that more sustainable firms exhibit a more stable dividend payout. This result is also valid when the ESG pillars are analysed, specifically, the environmental and governance pillars. The findings further suggest that higher ESG scores reveal better long-term alignment with shareholders and other stakeholders due to more proportionally stable profit sharing.
1. Introduction
This paper aims to analyse the relationship between ESG (environmental, social and governance) responsibility performances, both globally and individually, based on each of the three pillars, and the firm’s dividend policy with respect to payment of dividends and its stability. Despite the increasing literature on sustainability and ESG, there is little evidence regarding the effects of such ESG performance scores on a firm’s capacity and decisions concerning dividends.
According to Khan et al. [1], the number of firms undertaking sustainable investments is increasing, and thus, this type of investment has attracted growing attention from investors. For example, BlackRock’s Global Executive Committee, in its 2020 letter to clients [2], highlighted that sustainability would be the new standard for the firm—the world’s largest asset manager—to invest in businesses, construct portfolios and manage risks, thereby heightening its scrutiny of ESG issues. Larry Fink [3], chairman and CEO of BlackRock, also explains that several sources of investment risks, e.g., climate action failure and human caused environmental disasters (for a survey, see [4]) have an enormous impact on the capital market around the world by changing investment patterns and investors’ expectations towards a more sustainable investment perspective.
As firms’ adoption of sustainable practices and principles is on the rise, they are attracting a large number of investors who are more aware of sustainable issues. The sustainability does not end with managers’ messages to the market, but rather, actions have been setting the tone for a more sustainable future. This evidenced by some of the world’s largest institutional investors integrating sustainability into their investment decision processes [5]. According to HSBC UK, in 2019, more than USD 21.4 trillion was sustainably invested in global assets, more than 60% of which was in Europe. Two years earlier, according to McKinsey [5], sustainable investments accounted for approximately 26% of all assets that were professionally managed in Europe, the United States, Canada, Australia, New Zealand and Asia, suggesting that ESG principles are essential in capital markets, both for corporations and investors. More recently, following the onset of the Covid-19 pandemic, leaders began to emphasise the relevance of more sustainable investments. For example, the European Commission already felt the need to integrate sustainable energy investments as a green recovery path from the Covid-19 pandemic [6]. Moreover, the emphasis on ESG appears to have been effective due to changes in several dimensions of firms’ policies (e.g., strategic or financial). Accordingly, this is precisely the focus of our analysis.
In this paper, we use data from the Stoxx Euro 600 firms between 2000 and 2019. To analyse the impact of ESG factors on the dividend policies of those firms, we used several dependent variables and measured whether the firm paid dividends and also the stability of the dividends per share, the payout rates and the dividend yields. Based on logit panel regressions, we control for several factors, such as firm and market variables and year and sector effects. The results indicate that there is some evidence that more sustainable firms exhibit a more stable dividend payout. This result is also valid when the ESG pillars are analysed, specifically the environmental and governance pillars.
Our paper contributes to the literature that addresses the relationship between sustainability and finance policies and performance. More specifically, the focus on the three pillars show that relationships are dissimilar. Furthermore, the paper has managerial implications for both asset managers and regulators.
2. Literature Review
Corporate sustainability is an important concept that covers several dimensions, namely, ethical, social, environmental, cultural, and economic areas [7], and thus, its importance with respect to the business community, policymakers, media and academic community has expanded. The three central non-financial factors in measuring the sustainability and societal impact of a corporation are the environmental, social and governance dimensions, better known by the trending abbreviation ESG. Several organisations have developed this approach, including the Global Reporting Initiative (GRI), the United Nations Environment and Program Finance Initiative (UNEP FI), and the UN Global Compact. Notably, the use of corporate sustainability has increased steadily, not only by sustainable and impact investors but also by more traditional investors and firms. According to Porter and Kramer [8], the financial results involving a social/environmental purpose creates a positive cycle of prosperity for firms and communities, thus ensuring long-term profits. Consequently, corporate sustainability is a priority for all business leaders throughout the world [8].
Several studies have analysed the relationship between corporate sustainability and financial performance (e.g., [9,10,11,12,13]). The majority of these studies conclude that sustainability positively financial performance [9,10,13] and, consequently, they act as value drivers for shareholders. Despite some mixed and contradictory results, the studies mentioned above analysed both corporate social responsibility and sustainability and found a positive relationship with corporate financial performance (for surveys, see [11,14,15,16]), due to increased reputations [17], enhanced relations with stakeholders [18] and decreased risk premiums [19]. Consistent with these perspectives, Wang et al. [20] added essential issues that must be revisited. With no benefits for firms, corporate sustainability programs have not been increasing because these programs are costly and firms have limited resources.
The dividend policy is another perspective from which to examine the distribution of the value created [21,22]. Surprisingly, the impact of sustainability on dividend policies has not yet been well covered in the literature, particularly regarding its importance on the decision to pay dividends, the decision to pay regular dividends and the determination of the amount of dividends. Hence, this is the gap that we propose to contribute.
Preliminary studies with respect to corporate sustainability and dividends indicate that there exists a positive relationship between corporate social responsibility (CSR) performance and dividends [23,24,25], although Samet and Jarboui [26] conclude that high CSR is also associated with more stable dividend policies. These results are consistent with two theoretical perspectives regarding dividend policy and have been adapted to ESG investments and activities.
According to agency theory [27,28], if managers have access to excess cash flow and worthy investment opportunities that exhibit a positive NPV, they are more inclined to overinvest. As a possible result, the investment of these excess cash flows may cause firms to grow beyond their optimal size. Consequently, managers expand assets under control, consistent with empire building theories, and also their potential compensation. Nevertheless, the over investment may project a non-financial perspective. Managers can also overinvest in environmental and social initiatives [29]. The rationale is to obtain personal benefits at the expense of shareholders, as managers enhance their reputation as good stakeholders of society. Brown et al. [30] analysed corporate philanthropy and the associate excess of corporate charity to agency costs due to its non-value maximising consequences. Under this approach, a dividend policy could be an instrument to avoid overinvesting in ESG initiatives and counter agency problems. Consequently, firms with high ESG scores are expected to pay higher dividends.
Another perspective is based on signalling theory [31,32,33]. The theory argues that dividends are a tool for signalling investors the prospects of the firm, and as such, the signal follows a positive association. Therefore, dividend increases signal the market that managers expect growth in future earnings.
As shareholders cannot be dissociated from other stakeholders, our focus on ESG initiatives indicates that high scores in all three components account for both shareholders and stakeholders’ rights and expectations. Thus, a high dividend level combined with higher levels of ESG scores indicates that the corporation is considering all stakeholders [23]. The message sent to the market is positive, as ESG activities are not harming the firm’s cash flows/returns. This perspective also reflects the stakeholder theory [34], which claims that managers’ responsibilities extend beyond the shareholders’ maximising value perspective. The interests of all other partners, i.e., workers, creditors, the community, among others, must be managed as well, thus creating strong relationships among these partners. From the perspective of the stakeholder view, firms are expected to allocate fewer financial resources for their shareholders through the reduction of short-term cash flows available for dividend distribution. However, managers also appear to increase ESG indicators and reduce the cost of equity [35,36,37] and the cost of debt [38,39] are less constrained by financial resources [40] and can, therefore, pay higher dividends.
Few studies address the link between social responsibility and dividend policies. Benlemlih [23] used both of the approaches mentioned above when studying a sample of 3040 US firms from 1991 to 2012 and concluded there exists a positive association between high CSR levels, higher dividends and increased stability of dividend policies, where value is a combination of cash flows, risks, and growth. Cheung et al. [24] also concluded that firms with high CSR scores exhibit higher dividend levels because higher CSR scores increase earnings through lower levels of perceived risk [36,39] and better relationships with stakeholders, especially for non-financial firms. Samet and Jarboui [26] find that firms with high CSR performance increase payout levels. In this research, the sample is composed of non-financial European listed firms and covers the period 2009 to 2014. Rakotomavo [25] findings, based on a sample of US firms for the 1991 to 2007 period, suggest that CSR efforts and dividends tend to increase together. Consequently, the authors argue that CSR does not lower investors’ expected dividends.
Finally, dividends also posed a question regarding short-term issues given that stock market investors and hedge funds are short-term oriented, thereby placing too much weight on current and near cash flows and profitability [41]. These types of investors tend to focus on short-term profits at the expense of long-term value [42]. Therefore, investors may have a bias for underestimating long-term perspectives. In this case, the ESG dimensions may be perceived as lowering dividends in the short term, a situation that may disincentivise investors. Investors with longer horizons tend to prefer higher ESG firms, while short-term investors prefer the opposite [43]. Nevertheless, as mentioned by Pan [44], institutional liquidity investors should encourage their managers to include ESG issues in general credit evaluations and monitor them to improve risk management.
Therefore, in this paper, we aim to understand the impact of sustainability and responsibility policies on the dividend decisions of firms and to assess whether firms that have higher levels of ESG are more likely to pay dividends. Moreover, we seek to determine, for those firms paying dividends, whether the level of ESG affects the stability of the dividend per share, the payout and the yield. To the best of our knowledge, there are no extant studies of this issue that control for factors that can impact dividends, such as firm and market variables and year and sector controls.
3. Materials and Methods
We collected data from Thomson Reuters Eikon for the period 2000 to 2019 for firms listed on the Stoxx Euro 600 index at the end of 2019. The initial sample was narrowed to account for the following issues: recent entry in the index, lack of data on dividends, no data to compute all control variables, and firms in the financial sector. Financial firms should be studied autonomously, as in Crespi and Migliavacca [45] because they are affected by dissimilar value drivers. The final sample represents 1914 firm-year observations.
Thomson Reuters’ ESG scores are used to measure firms’ sustainability performance and are measured as environmental (E), social (S) and governance (G) dimensions. Thomson Reuters’ ESG score [46] is an overall firm score between 0 and 100 that is based on the reported information in the environmental, social, and corporate governance pillars. This score measures a firm’s ESG performance and is based on more than 400 firms reported data on ESG in the public domain. These include corporate websites, annual reports, ESG reports, bylaws, codes of conduct, stock exchange filings, among others, from which is selected a subset of the 178 most comparable data that are then grouped across 10 categories, namely, resource use, emissions, and innovation (environment); workforce, human rights, community, and product responsibility (social); and management, shareholders and CSR strategy (governance). According to Thomson Reuters [46], the count of measures per category determines the weight of each category and the sum of the categories in each pillar, which then reveals the pillar weights, specifically, environmental, 34.0%; social, 35.5%; and governance, 30.5% (see Table 1). These ratings objectively measure a firm’s relative ESG performance and are available on over 7000 publicly listed firms (more than 2900 in North America and 1200 in Europe), with data going back at least to 2002 for smaller firms [46].

Table 1.
Environmental, social and governance (ESG) Score Structure.
The ESG score is a commonly used measure of corporate sustainability in academic empirical research (e.g., [47,48,49,50]), although several other measures are available and used in academic research [51]. Similar to other studies [52], we disentangle the ESG score into sub-indices (E, S, and G) to capture the different perspectives affecting the outcome variable. The ESG score is the primary independent variable, as is each of the three pillars, i.e., environmental, social, and governance. The average ESG score of 60.4% over the period 2000 to 2019 signifies low variability (Figure 1). The individual components track the overall trend, although the governance score exhibits higher relative variability and is positioned at lower levels.
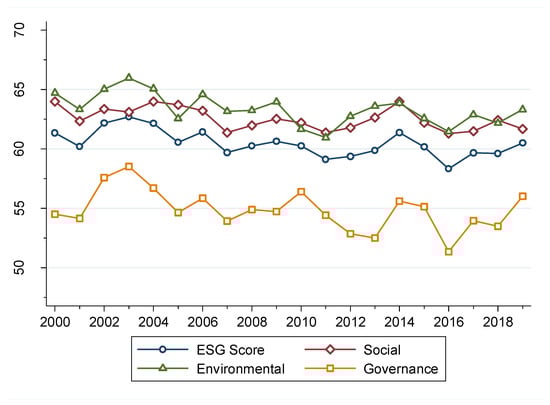
Figure 1.
ESG Evolution. Notes: The graph presents the average ESG score per year for all Stoxx Euro 600 index firms that compose our sample. Source: own figure; data from Thomson Reuters Eikon.
We focus on the payment and stability of dividends, following the works of Barros et al. [53] and Barros et al. [54]. The payment of dividend (Dividend) takes the value 1 for dividend-paying firms i in year t, and 0 otherwise. The stability is proxied by three variables. The first is the stability of the dividend per share from the previous year (DPS regular). This variable captures the yearly cash dividend paid to shareholders. The second is the absolute variation on the payout ratio from the prior year, which is no more than 2% (payout range 2%). This variable captures the stability in the value sharing with shareholders for current cash and future growth. The third is the stability of a market measure through the cash dividend paid over the firm’s year-end stock price (Dividend Yield range 2%). Similar to the previous variable, we allow an absolute deviation of up to 2% for defining stability. The four measures comprise the dividend policy variable (D) in equation (1). As the focus of this research is on the payment decisions and its stability, we do not analyse the dividend amount. Other studies focused on the level of dividends that exist, having computed dividends over earnings [55], sales [56], assets [55,57] and equity [55], although the scope differs from ours.
To answer our hypotheses, we estimate the following model, which takes the specification of panel logit:
The ESG is the score for each firm i in year t, either the ESG score or the score for each sub index. Control variables are drawn from existing empirical evidence:
- -
- Firms’ effective tax rate (ETR), which is a traditional topic in the dividend policy literature (for instance [53,58,59,60,61]);
- -
- The number of sell-side analysts covering each firm (Analysts). The evidence on this control is mixed. While Ham et al. [62] find that analysts affect the likelihood of paying dividends, Barros et al. [53] find mixed results;
- -
- The growth potential (Market/Book ratio) priced by the market, especially for dividend payment firms [63,64,65];
- -
- The firm’s dimension (Size), as the literature points to a negative relationship with dividends [21,66];
- -
- The level of operating profitability (EBT margin), growth in operating profitability (EBT CAGR 3y), and level of profitability to shareholders (ROE), as in other studies [59,67,68];
- -
- The capital structure (Leverage). Most studies suggest that more leveraged firms are less likely to pay dividends (e.g., [66]);
- -
- Firm’s capital intensity ratio (PP&E), which accounts for the need for the investment in fixed assets [53]. The volatility in the dividend payment must be viewed in a setting of CAPEX requirements for fixed assets, replacement and growth.
The variables δ and θ are the fixed effect (FE) specification for the year and economic sectors, respectively. Our sample is composed of large firms headquartered in Europe, most of which are well-known multinational firms. The institutional setting of each European country is, therefore, not addressed explicitly in the econometric context for several reasons. First, the large nature of these firms makes them operationally exposed to a diversified institutional setting that would have to be captured by the firm’s geographical segmentation. Second, the profile of the shareholder structures of these firms does not mimic the idiosyncrasies of the firm’s country of its headquarters.
Nevertheless, we acknowledge that various economic sectors drive the need for better ESG components, specifically, the first two pillars, environmental and social. As more environmentally exposed industries, e.g., oil and gas, contribute differently to the ESG scores, the reaction of the dividend policy may not be driven in a linear form. The social pillar is also industry specific. For instance, the recent KPMG [69] report on the ESG pillars highlights the need for technology firms to mitigate their social and business impacts in challenging times. Our econometric setting uses a fixed effect specification for the economic sector to accommodate the expected variability across these sectors (see Figure 2 for the decomposition of each pillar per industry).
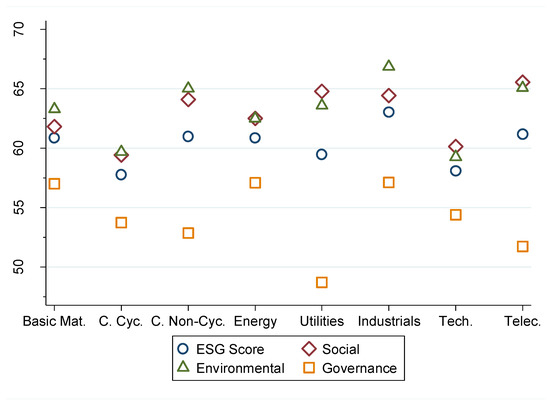
Figure 2.
ESG Evolution per Economic Sector (2000–2019). Notes: The graph computes the average ESG score per economic sector from 2000 to 2019 for all firms in our sample. Economic sectors are as follows: Basic Materials; Consumer Cyclicals; Consumer Non-Cyclicals; Energy; Utilities; Industrials; Technology; and Telecommunications. Source: own figure; data from Thomson Reuters Eikon.
The definitions of the variables are presented in Table 2, while Table 3 presents the descriptive statistics for each variable. Cash dividends are paid in approximately 89% of the firm-year observations, while the stability in the dividend payment reveals characteristics worth exploring. The signalling theory also holds, especially for the stability in the dividends paid. While the clientele effect is primarily absorbed by the DPS regular, most firms in the sample exhibit irregular payments per share (88%). The long-run growth potential jeopardy can be mitigated by profit sharing with shareholders, rather than by the contemporaneously withdrawing of cash that would otherwise compromise a firm’s long-run growth.
Table 2.
Variables definition.
Table 3.
Descriptive Statistics.
Nonetheless, approximately 19% of firms maintain this focus on stable payout. Therefore, the managers of these firms maintain a balance between short- and long-term perspectives on a year-to-year basis, thus avoiding a myopic view. Furthermore, the median dividend yield for the sample period is 2.6% for paying firms, which is within the expected range for these firms (quartile 1: 1.5%; quartile 3: 4.2%). The stability of the yield is 71%, when considering a year over year absolute change up to 2%. While this range may arguably be too broad, it is highly sensitive to stock price movements. Moreover, narrowing the deviation to 1% or 0.5% still produces stability in shareholder market returns in 60% and 44% of observations, respectively.
4. Results, Discussion and Contributions
The results from the panel logit regression of the impact of ESG scores on the payment of dividends and the stability of the policy are presented in Table 4. All specifications are reported with a fixed effect for year and industry, while standard errors are robust for heteroskedasticity. Throughout all specifications, the effect from the ESG scores are only significant for the stability of the dividend payout ratio. More specifically, marginal effects (not reported for the sake of parsimony) indicate that a one-unit increase in the ESG score produces a 2.0% probability of an increase in the likelihood of stable payout ratios. This suggests that higher ESG scores align better with stakeholders’ interests as a result of proportionally stable profit sharing. Traditional controls for the payment of dividends and for stability are consistent with Barros et al. [53] predictions for determinants of the dividend policy, as well as the coefficient of determination. For example, larger firms are more likely to pay dividends (column 1), particularly when accounting for the fact that the sample is composed of the largest firms listed on the European stock exchanges. Furthermore, the payout rate is more stable for more profitable firms in operating terms, as well as for more capital intense firms.
Table 4.
Logit regression on dividend payment and stability: ESG Score.
However, similar to Barros et al. [53], the market measure of dividends captured by the dividend yield is more likely to be predictable by investors from firms exhibiting higher operating performance, greater growth potential and more intense scrutiny by sell-side analysts. That being said, leverage plays an opposing association. For example, more leveraged firms are less likely to sustain a dividend yield, as the ladder of priorities in the financing structure causes more volatility to earnings after covering finance expenses.
We also analyse the environmental performance by decomposing the ESG score into each of the three pillars. Table 5 presents a similar understanding, albeit lower in magnitude, when compared with the global ESG score. The marginal effects indicate a sensitivity of 1.0% between the environmental score and the stability of the payout ratio. The analysis of the social score is presented in Table 6. Surprisingly, the payout stability is not statistically sensitive to changes in the ESG score concerning social issues. However, the results suggest a positive association with the dividend yield, which leads to the question of whether socially motivated firms are more concerned about the stability of the market returns collected by shareholders. Finally, Table 7 presents the analysis of the third pillar of the ESG score, i.e., governance. The positive effect of the payout identified in the overall ESG score and in the environmental pillar score is also verified in the governance score. Nevertheless, our results are not insensitive with respect to whom prevails in setting the stability measures used in the empirical analysis. In columns (2) and (3) of each result table, the proxy is directly set by the managers, whereas in column (4), there is evidence of more direct influence from shareholders.
Table 5.
Logit regression on dividend payment and stability: E (Environmental).
Table 6.
Logit regression on dividend payment and stability: S (Social).
Table 7.
Logit regression on dividend payment and stability: G (Governance).
While the social pillar appears to drive the dividend policy in ways different from the other two pillars, the results should be viewed from the same theoretical perspectives as those highlighted in Section 2. Although the signalling theory is more likely to hold for more stable amounts, there may be some compensation when other governance mechanisms are in place. Additionally, the information asymmetry issue in which analysts play a role. For example, higher coverage from sell-side analysts pressures managers to be transparent and to meet targets. Deviations from analysts’ targets are frequently heavily penalised by market participants, thus calling for more predictability. A predictable payout policy may take two main forms, namely, stability in the dividend per share and stability in the profit-sharing that encompasses both payout ratios and dividend yields. When a firm’ pricing in efficient markets follows the firm’s prospects, higher dividends when establishing stable profit sharing should yield greater positive outlook potential.
Stable dividend amounts may yield opposing views. One the on hand, maintaining the amount at a predictable level is welcome by shareholders as participants in the stock market tend to penalise negative news that could be attached to unstable dividends. Hence, the clientele effect is primarily built around such assumptions. On the other hand, managers may put growth potential at risk to ensure the predictability of the dividend. During uncertain times, this behaviour is particularly relevant for a firm’s growth potential. That said, firms often position themselves such that they must set a dividend that exceeds earnings to fill the clientele effect. In such cases, short-term behaviours may occur.
Our results suggest higher stability in the payout ratios is increased by ESG scores. One argument in favour of this conclusion concerns the temporal perspective of managers. Stability in the payout ratio is more likely to account for a long-run perspective of a firm’s value growth as opposed to other perspectives on the dividend. However, the social pillar follows a different perspective. These results suggest that the higher scores for the social pillar are associated with more stable returns for shareholders, a result that is not captured by other stability indicators. Moreover, investors may be more sensitive to social issues regarding the pricing of a firm’s shares. Accordingly, the analysis of the social pillar suggests an unstable DPS (dividend paid) and unstable payout ratio, but more stable dividend yields.
Less stability in the DPS may be followed by more volatile stock prices [70], reacting to repricing under the expected return from the cash component. The other component of returns comes from capital appreciations, that should be lower in an environment of higher payout ratios, also depending on payout taxes [71]. The results also suggest that lower Social score can be penalised by the market, thus not pricing firms along with the expected yield.
Our findings yield a twofold contribution to practitioners. First, to investment managers concerned about sustainable investments. The concerns of investors over sustainability and the dissemination of investment funds dedicated to sustainability are on the rise. BlackRock [2] recently highlighted that sustainability would be the new standard for the world’s largest asset management firm. Fink [3] highlighted that ESG investment patterns and investor’s expectations are moving towards a more sustainable investment perspective. While the sustainable investment funds aim to fill a demand of investors with sustainability concerns, the long-term investment returns may be a concern for these practitioners. Our results suggest that firms with better ESG scores appear to do not jeopardise future growth potential, thus fading up the risk of dividend policies capturing value towards a short-term perspective. The higher ESG scores reflect on better long-run alignment with shareholders and other stakeholders due to a more proportionally stable profit sharing. Therefore, investors in these firms should expect more stable payout ratio, not putting at risk growth potential by short-term adjustments in dividends towards a stable dividend yield and per share. The second main contribution to practice is for regulators. The new wave of investments towards sustainable practices is expected to bring to the table more refined regulation and guidelines for non-financial reporting standards. The attention of regulators may be drawn from increasing trends [72], which eventually lead them to carry on well-crafted regulation as they gather appropriate visibility over the issue, if any is required. For instance, definitions of investments that qualify for green bonds, criteria for setting funds as compliant with the three pillars of ESG, and many other activities. We highlight that securities market commissions worldwide are responsible for protecting, among others, all investors. Our results suggest that firms may have been autoregulating themselves concerning how ESG scores affect the dividend policy. Specifically, high ESG scores are not affecting the stability of the DPS and are associated with a more proportionally stable profit sharing, thus not compromising the long-term growth potential.
Future research should further explore our research design. Furthermore, our analysis focuses primarily on larger European firms, but it is acknowledged that lesser renamed firms and those experiencing different degrees of exposure to the institutional setting of each country, as well as smaller firms and non-listed firms, may be impacted differently by ESG scores. The different ratings may also be confusing to investors and thus present different outcomes [73]. Therefore, a cross-comparison of other ratings of ESG scores should enhance understanding of our findings. Furthermore, the growing importance of investment funds with a focus on sustainability may promote the study of other finance related decisions and implications such as M&A, IPO, cost of capital [36], capital structure, and market returns [52]. Finally, future research should account for potential differences among European countries and between developed and developing economies. We could expect, in developing countries, less impact of sustainability in affecting the stability of dividends and the dividend policy overall.
Author Contributions
Conceptualization, P.V.M. and V.B.; methodology, P.V.M., V.B. and J.M.S.; software, V.B.; validation, P.V.M., V.B. and J.M.S.; formal analysis, P.V.M., V.B. and J.M.S.; investigation, P.V.M., V.B. and J.M.S.; resources, P.V.M., V.B. and J.M.S.; data curation, V.B.; writing—original draft preparation, PV.M. and V.B.; writing—review and editing, J.M.S.; visualization, P.V.M., V.B. and J.M.S.; supervision, P.V.M., V.B. and J.M.S.; project administration, P.V.M., V.B. and J.M.S.; funding acquisition, P.V.M., V.B. and J.M.S. All authors have read and agreed to the published version of the manuscript.
Funding
The authors acknowledge financial support via ADVANCE-CSG from the Fundação para a Ciência and Tecnologia (FCT Portugal) through research grant number UIDB/04521/2020.
Conflicts of Interest
The authors declare no conflict of interest.
References
- Khan, M.; Serafeim, G.; Yoon, A. Corporate sustainability: First evidence on materiality. Account. Rev. 2016, 91, 1697–1724. [Google Scholar] [CrossRef]
- BlackRock. Sustainability as BlackRock’s New Standard for Investing (2020 Client Letter); BlackRock Global Executive Committee: New York, NY, USA, 2020. [Google Scholar]
- Fink, L. BlackRock’s Chairman Letter to Shareholders; BlackRock: New York, NY, USA, 2020. [Google Scholar]
- WEF. The Global Risks Report 2020, 15th ed.; World Economic Forum: Davos, Switzerland, 2020. [Google Scholar]
- McKinsey. From ‘Why’ to ‘Why Not’: Sustainable Investing as the New Normal; Private Equity & Principal Investors Practice; McKinsey & Company: New York, NY, USA, 2017. [Google Scholar]
- European Commission. COVID-19 and Green Recovery: How Member States Integrate Sustainable Energy Investments into Their Recovery Plans; Webinar Series; Sustainable Energy Investment Forums; European Commission: Brussels, Belgium, 2020. [Google Scholar]
- Lankoski, L. Alternative conceptions of sustainability in a business context. J. Clean. Prod. 2016, 139, 847–857. [Google Scholar] [CrossRef]
- Porter, M.E.; Kramer, M.R. Creating shared value. Harv. Bus. Rev. 2019, 1, 62–77. [Google Scholar]
- Chen, R.C.Y.; Hung, S.-H.; Lee, C.-H. Does corporate value affect the relationship between Corporate Social Responsibility and stock returns? J. Sustain. Financ. Investig. 2017, 7, 188–196. [Google Scholar] [CrossRef]
- Friede, G.; Busch, T.; Bassen, A. ESG and financial performance: Aggregated evidence from more than 2000 empirical studies. J. Sustain. Financ. Investig. 2015, 5, 210–233. [Google Scholar] [CrossRef]
- Lu, W.; Chau, K.W.; Wang, H.; Pan, W. A decade’s debate on the nexus between corporate social and corporate financial performance: A critical review of empirical studies 2002–2011. J. Clean. Prod. 2014, 79, 195–206. [Google Scholar] [CrossRef]
- Santis, P.; Albuquerque, A.; Lizarelli, F. Do sustainable companies have a better financial performance? A study on Brazilian public companies. J. Clean. Prod. 2016, 133, 735–745. [Google Scholar] [CrossRef]
- Velte, P. Does ESG performance have an impact on financial performance? Evidence from Germany. J. Glob. Responsib. 2017, 8, 169–178. [Google Scholar] [CrossRef]
- Orlitzky, M.; Schmidt, F.L.; Rynes, S.L. Corporate social and financial performance: A meta-analysis. Organ. Stud. 2003, 24, 403–441. [Google Scholar] [CrossRef]
- Van Beurden, P.; Gössling, T. The worth of values–a literature review on the relation between corporate social and financial performance. J. Bus. Ethics 2008, 82, 407. [Google Scholar] [CrossRef]
- Wu, M.L. Corporate social performance, corporate financial performance, and firm size: A meta-analysis. J. Am. Acad. Bus. 2006, 8, 163–171. [Google Scholar]
- Fatemi, A.; Glaum, M.; Kaiser, S. ESG performance and firm value: The moderating role of disclosure. Glob. Financ. J. 2018, 38, 45–64. [Google Scholar] [CrossRef]
- Clarkson, P.M.; Li, Y.; Richardson, G.D.; Vasvari, F.P. Revisiting the relation between environmental performance and environmental disclosure: An empirical analysis. Account. Organ. Soc. 2008, 33, 303–327. [Google Scholar] [CrossRef]
- Godfrey, P.C.; Merrill, C.B.; Hansen, J.M. The relationship between corporate social responsibility and shareholder value: An empirical test of the risk management hypothesis. Strateg. Manag. J. 2009, 30, 425–445. [Google Scholar] [CrossRef]
- Wang, M.; Qiu, C.; Kong, D. Corporate social responsibility, investor behaviors, and stock market returns: Evidence from a natural experiment in China. J. Bus. Ethics 2011, 101, 127–141. [Google Scholar] [CrossRef]
- Ahmad, N.G.; Barros, V.; Sarmento, J.M. The determinants of dividend policy in Euronext 100. Corp. Ownersh. Control 2018, 15, 8–17. [Google Scholar] [CrossRef]
- Nguyen, H.M.; Vuong, T.H.G.; Nguyen, T.H.; Wu, Y.C.; Wong, W.K. Sustainability of Both Pecking Order and Trade-off Theories in Chinese Manufacturing Firms. Sustainability 2020, 12, 3883. [Google Scholar] [CrossRef]
- Benlemlih, M. Corporate social responsibility and dividend policy. Res. Int. Bus. Financ. 2019, 47, 114–138. [Google Scholar] [CrossRef]
- Cheung, A.; Hu, M.; Schwiebert, J. Corporate social responsibility and dividend policy. Account. Financ. 2018, 58, 787–816. [Google Scholar] [CrossRef]
- Rakotomavo, M.T. Corporate investment in social responsibility versus dividends? Soc. Responsib. J. 2012, 8, 199–207. [Google Scholar] [CrossRef]
- Samet, M.; Jarboui, A. Corporate social responsibility and payout decisions. Manag. Financ. 2017, 43, 982–998. [Google Scholar] [CrossRef]
- Jensen, M.C. Agency costs of free cash flow, corporate finance, and takeovers. Am. Econ. Rev. 1986, 76, 323–329. [Google Scholar]
- Jensen, M.C.; Meckling, W.H. Theory of the firm: Managerial behavior, agency costs and ownership structure. J. Financ. Econ. 1976, 3, 305–360. [Google Scholar] [CrossRef]
- Barnea, A.; Rubin, A. Corporate social responsibility as a conflict between shareholders. J. Bus. Ethics 2010, 97, 71–86. [Google Scholar] [CrossRef]
- Brown, W.O.; Helland, E.; Smith, J.K. Corporate philanthropic practices. J. Corp. Financ. 2006, 12, 855–877. [Google Scholar] [CrossRef]
- Benartzi, S.; Michaely, R.; Thaler, R. Do changes in dividends signal the future or the past? J. Financ. 1997, 52, 1007–1034. [Google Scholar] [CrossRef]
- Miller, M.H. The Modigliani-Miller propositions after thirty years. J. Econ. Perspect. 1988, 2, 99–120. [Google Scholar] [CrossRef]
- Miller, M.H.; Rock, K. Dividend policy under asymmetric information. J. Financ. 1985, 40, 1031–1051. [Google Scholar] [CrossRef]
- Freeman, R.E. Strategic management: A Stakeholder Approach; Cambridge University Press: Cambridge, UK, 1984. [Google Scholar]
- Dhaliwal, D.S.; Li, O.Z.; Tsang, A.; Yang, Y.G. Voluntary nonfinancial disclosure and the cost of equity capital: The initiation of corporate social responsibility reporting. Account. Rev. 2011, 86, 59–100. [Google Scholar] [CrossRef]
- Ould Daoud Ellili, N. Environmental, Social, and Governance Disclosure, Ownership Structure and Cost of Capital: Evidence from the UAE. Sustainability 2020, 12, 7706. [Google Scholar] [CrossRef]
- El Ghoul, S.; Guedhami, O.; Kwok, C.C.; Mishra, D.R. Does corporate social responsibility affect the cost of capital? J. Bank. Financ. 2011, 35, 2388–2406. [Google Scholar] [CrossRef]
- Menz, K.M. Corporate social responsibility: Is it rewarded by the corporate bond market? A critical note. J. Bus. Ethics 2010, 96, 117–134. [Google Scholar] [CrossRef]
- Goss, A.; Roberts, G.S. The impact of corporate social responsibility on the cost of bank loans. J. Bank. Financ. 2011, 35, 1794–1810. [Google Scholar] [CrossRef]
- Kim, C.S.; Mauer, D.C.; Sherman, A.E. The determinants of corporate liquidity: Theory and evidence. J. Financ. Quant. Anal. 1998, 33, 335–359. [Google Scholar] [CrossRef]
- Black, A.; Fraser, P. Stock market short-termism—An international perspective. J. Multinatl. Financ. Manag. 2002, 12, 135–158. [Google Scholar] [CrossRef]
- Harford, J.; Kolasinski, A. Do private equity returns result from wealth transfers and short-termism? Evidence from a comprehensive sample of large buyouts. Manag. Sci. 2014, 60, 888–902. [Google Scholar] [CrossRef]
- Starks, L.T.; Venkat, P.; Zhu, Q. Corporate ESG profiles and investor horizons. SSRN 2017. [Google Scholar] [CrossRef]
- Pan, L. Demystifying ESG Investing Considerations for Institutional Cash Investors. J. Portf. Manag. 2020, 46, 153–156. [Google Scholar] [CrossRef]
- Crespi, F.; Migliavacca, M. The Determinants of ESG Rating in the Financial Industry: The Same Old Story or a Different Tale? Sustainability 2020, 12, 6398. [Google Scholar] [CrossRef]
- Thomson Reuters. Thomson Reuters ESG Scores; Thomson Reuters: New York, NY, USA, 2019. [Google Scholar]
- Del Giudice, A.; Rigamonti, S. Does Audit Improve the Quality of ESG Scores? Evidence from Corporate Misconduct. Sustainability 2020, 12, 5670. [Google Scholar] [CrossRef]
- Drempetic, S.; Klein, C.; Zwergel, B. The influence of firm size on the ESG score: Corporate sustainability ratings under review. J. Bus. Ethics 2019, 1–28. [Google Scholar] [CrossRef]
- Duque-Grisales, E.; Aguilera-Caracuel, J. Environmental, Social and Governance (ESG) Scores and Financial Performance of Multilatinas: Moderating Effects of Geographic International Diversification and Financial Slack. J. Bus. Ethics 2019, 1–20. [Google Scholar] [CrossRef]
- Rajesh, R. Exploring the sustainability performances of firms using environmental, social, and governance scores. J. Clean. Prod. 2020, 247, 119600. [Google Scholar] [CrossRef]
- Diez-Cañamero, B.; Bishara, T.; Otegi-Olaso, J.R.; Minguez, R.; Fernández, J.M. Measurement of Corporate Social Responsibility: A Review of Corporate Sustainability Indexes, Rankings and Ratings. Sustainability 2020, 12, 2153. [Google Scholar] [CrossRef]
- Torre, M.L.; Mango, F.; Cafaro, A.; Leo, S. Does the ESG Index Affect Stock Return? Evidence from the Eurostoxx 50. Sustainability 2020, 12, 6387. [Google Scholar] [CrossRef]
- Barros, V.; Matos, P.V.; Sarmento, J.M. What firm’s characteristics drive the dividend policy? A mixed-method study on the Euronext Stock Exchange. J. Bus. Res. 2020, 115, 365–377. [Google Scholar] [CrossRef]
- Barros, V.; Matos, P.V.; Sarmento, J.M.; Vieira, P.R. Do Shareholders Activists influence manager’s decisions on firm’s dividend policy: A mixed-method study. J. Bus. Res. 2021, 122, 387–397. [Google Scholar] [CrossRef]
- Romano, G.; Guerrini, A. Paying Returns to Shareholders of Water Utilities: Evidence from Italy. Sustainability 2019, 11, 2033. [Google Scholar] [CrossRef]
- Choi, J.H.; Kim, S.; Yang, D.-H. Do Managers Pay CSR for Private Motivation? A Dividend Tax Cut Case in Korea. Sustainability 2019, 11, 4041. [Google Scholar] [CrossRef]
- Lee, N.; Lee, J.R.D. Intensity and Dividend Policy: Evidence from South Korea’s Biotech Firms. Sustainability 2019, 11, 4837. [Google Scholar] [CrossRef]
- Pérez-González, F. Large Shareholders and Dividends: Evidence from U.S. Tax Reforms; Working paper; Columbia University: New York, NY, USA, 2002. [Google Scholar]
- Poterba, J. Taxation and corporate payout policy. Am. Econ. Rev. 2004, 94, 171–175. [Google Scholar] [CrossRef]
- Brav, A.; Graham, J.; Harvey, C.; Michaely, R. Payout policy in the 21st century. J. Financ. Econ. 2005, 77, 483–527. [Google Scholar] [CrossRef]
- Chetty, R.; Saez, E. Dividend taxes and corporate behavior: Evidence from the 2003 dividend tax cut. Q. J. Econ. 2005, 120, 791–833. [Google Scholar]
- Ham, C.G.; Kaplan, Z.; Leary, M.T. Do dividends convey information about future earnings? J. Financ. Econ. 2019, 136, 547–570. [Google Scholar] [CrossRef]
- Dewenter, K.; Warther, V. Dividends, asymmetric information, and agency conflicts: Evidence from a comparison of the dividend policies of Japanese and U.S. firms. J. Financ. 1998, 53, 879–904. [Google Scholar] [CrossRef]
- Anderson, R.C.; Reeb, D.M. Founding-family ownership and firm performance: Evidence from the SP 500. J. Financ. 2003, 58, 1301–1328. [Google Scholar] [CrossRef]
- Seida, J. Evidence of tax-clientele-related trading following dividend increases. J. Am. Tax. Assoc. 2001, 23, 1–21. [Google Scholar] [CrossRef]
- Farinha, J. Dividend policy, corporate governance, and the managerial entrenchment hypothesis: An empirical analysis. J. Bus. Financ. Account. 2003, 30, 1173–1209. [Google Scholar] [CrossRef]
- Henry, D. Ownership structure and tax-friendly dividends. J. Bank. Financ. 2011, 35, 2747–2760. [Google Scholar] [CrossRef]
- Almeida, L.; Tavares, F.; Pereira, E. Efeito subprime na distribuição de dividendos em Portugal. FUMEC/FACE J. Belo Horiz. 2015, 14, 9–25. [Google Scholar]
- KPMG. The ESG Imperative for Technology Companies; KPMG LLP: Delaware, DE, USA, 2020. [Google Scholar]
- Lee, B.S.; Mauck, N. Dividend initiations, increases and idiosyncratic volatility. J. Corp. Financ. 2016, 40, 47–60. [Google Scholar] [CrossRef]
- Becker, B.; Jacob, M.; Jacob, M. Payout taxes and the allocation of investment. J. Financ. Econ. 2013, 107, 1–24. [Google Scholar] [CrossRef]
- Ju, L.; Lu, T.; Tu, Z. Capital flight and bitcoin regulation. Int. Rev. Financ. 2016, 16, 445–455. [Google Scholar] [CrossRef]
- Berg, F.; Kölbel, J.; Rigobon, R. Aggregate Confusion: The Divergence of ESG Ratings; Working Paper; MIT Sloan School: Cambridge, MA, USA, 2020. [Google Scholar]


Publisher’s Note: MDPI stays neutral with regard to jurisdictional claims in published maps and institutional affiliations. |
© 2020 by the authors. Licensee MDPI, Basel, Switzerland. This article is an open access article distributed under the terms and conditions of the Creative Commons Attribution (CC BY) license (http://creativecommons.org/licenses/by/4.0/).