Article

Comparison of Product Sustainability of Conventional and Low-Carbon Apples in Korea

1
SMaRT-Eco Consulting Firm, 2F Gongik Building., 630 Gaepo-ro, Gangnam-gu, Seoul 06338, Korea
2
Department of Climate and Environment, Sejong University, 209 Neungdong-ro, Gwangjin-gu, Seoul 05006, Korea
*
Author to whom correspondence should be addressed.
Sustainability 2020, 12(22), 9364; https://doi.org/10.3390/su12229364
Submission received: 14 September 2020 / Revised: 31 October 2020 / Accepted: 5 November 2020 / Published: 11 November 2020
(This article belongs to the Section Sustainable Food)

Abstract

:
Apple is Korea’s most representative fruit. This study calculated absolute and relative product sustainability through environmental and cost assessments on apples by cultivation farming. The ISO 14040 life cycle assessment (LCA) methodology was used as a method of environmental assessment. Primary data for one year, 2018, were collected for the environmental assessment of conventional and low-carbon farming. The eco-points of apples cultivated by conventional and low-carbon farming using the LCA 2.07 × 10⁻³ and 1.17 × 10⁻³, respectively. The environmental impact of conventional apples was 78% higher than that of low-carbon apples. Cost assessment results show that every 1 kg of conventional and low-carbon apples costs USD 1.93 and USD 3.17, respectively, and their profits were USD 0.20 and USD 1.00, respectively. The total cost of conventional apples was lower than that of low-carbon apples, but its profit was one-fifth that of low-carbon apples. The UN Economic and Social Commission for Asia and the Pacific (UN ESCAP)’s eco-efficiency method was used to calculate absolute sustainability, and the concept of factor X was introduced to evaluate relative sustainability. Absolute sustainability for conventional and low-carbon apples was 96.01 (USD/eco-point) and 853.03 (USD/eco-point), respectively. Low-carbon apples’ relative sustainability was computed in factor 8.89. Finally, if all farms that grow conventional apples shift to cultivating low-carbon apples, they can save 58,111 tons of carbon dioxide. This amount is at least 3.4% of the nation’s greenhouse gas reduction in the agricultural and livestock sectors. This study provides a clear reason for the agricultural sector to shift its cultivation method from conventional to eco-friendly farming, including low-carbon farming.

1. Introduction

The Sustainable Development Goals (SDGs) were adopted in September 2015 following the Millennium Development Goals (MDGs), which provided an important framework from 2000 to 2015. The SDGs comprise 17 goals and 169 detailed goals and have a human-centered value orientation. They encompass three main branches: social engagement, economic growth, and sustainable environment. The 12th is “responsible consumption and production”. According to the United Nations Development Programme (UNDP), achieving economic growth and sustainable development requires urgent ecological footprint reduction by changing goods and resources’ production and consumption [1]. Now the world’s population is increasing due to the development of medical technology and the increase in income, and total food consumption is increasing rapidly. In fact, the United Nations (UN) predicts that the global population, having reached approximately 7.3 billion in 2015, will increase to 8.5 billion in 2030, 9.7 billion in 2050, 11.2 billion in 2100 [2]. The Food and Agriculture Organization of the United Nations also predicts that the world average daily calorie intake per capita was 2435 kcal in 1975, 2940 kcal in 2015, up to 3050 kcal in 2030 [3]. A lot of energy, water and chemicals are needed to grow and process. Agriculture consumes much water worldwide, and irrigation now claims approximately 70% of freshwater for human use [4]. The European Commission Joint Research Centre (EC JRC) announced that three product groups such as food and drink, private transport, and housing are responsible for 70% to 80% of the environmental impact of consumption, and account for some 60% of consumption expenditure. Food and drink, in particular, cause 20% to 30% of the various environmental impacts [5]. In addition, the EC presented a Farm to fork strategy to achieve a circular economy in the European Green Deal published in 2019. The EC introduced the environmental footprint as a new way to provide consumers with information on environmental impacts generated throughout the life cycle of the food [6].
The Republic of Korea is also increasingly interested in eco-friendly agriculture and eco-friendly agricultural products with the recognition of the importance of environmental impacts on food products. In fact, the “Act on the Promotion of Environment-Friendly Agriculture and Fisheries and the Management of and Support for Organic Foods, etc.” was enacted in December 1998 to promote the production and consumption of sustainable eco-friendly agricultural products. Based on this law, Korea implemented an eco-friendly agricultural products certification system. This system is similar to organic agricultural product certification in many countries worldwide. According to a 2018 survey by the Korea Agro-Fisheries & Food Trade Corporation (AT), 83.0% of Korean consumers purchase eco-friendly agricultural products every year [7]. Their purchase rate is extremely high given that eco-friendly agricultural products are considered healthy and eco-friendly. Thus, in Korea, the Lifestyles of Health and Sustainability (LOHAS) is leading the purchasing power of food as it considers health and the environment simultaneously. Furthermore, Korea’s Ministry of Agriculture, Food and Rural Affairs launched the world’s first low-carbon agricultural product certification system in 2014 to achieve the greenhouse gas (GHG) reduction target in the agricultural sector based on the Framework Act on Low Carbon, Green Growth. Certain agricultural products obtain the eco-friendly agricultural product certification. These products are granted the low-carbon agricultural product certification system when their life cycle carbon emissions are lower than the reference emission level for agricultural products in general. Thus, the low-carbon agricultural product certification evaluates product sustainability by considering safety, environmental, and climate issues. This study used the concept of eco-efficiency for evaluating product sustainability of agricultural products. The UN Economic and Social Commission for Asia and the Pacific (UN ESCAP) published an eco-efficiency guideline titled “Eco-efficiency Indicators: Measuring Resource-use Efficiency and he Impact of Economic Activities on the Environment”. ESCAP defined eco-efficiency as a key element of fundamentally changing societies’ resource production and consumption and measuring green growth progress in 2009. ESCAP also addressed eco-efficiency indicators (EEI) and is particularly envisioned to respond to different sustainability challenges to attain economic and ecological goals [8,9,10,11,12,13]. This paper presents a relational equation for EEI that can be used in the business sector. The denominator of EEI is defined as the products’ environmental impacts, whereas the numerator is the product’s economic value. Thus, the lower the product’s environmental impact, the higher the EEI, the product’s economic value, and the EEI.
So, this study aims to evaluate product sustainability of eco-efficiency concept through environmental and economic assessments of certified low-carbon agricultural products. Then, we compare the sustainability and climate change effect of agricultural products grown through conventional farming.

2. Materials and Methods

2.1. Research Subject Selection

According to the Korea Rural Economic Institute in 2018, 25.3% of Koreans ranked apple as their first favorite fruit, followed by watermelon with 16.8% and grapes with 9.4% [14]. Moreover, according to the Foundation of Agricultural Technology, Commercialization and Transfer (FACT), 830 agricultural products are low-carbon certified until 2019. FACT operates a low-carbon agricultural product certification system. Among these products, the number of fruits is the highest with 630, followed by 126 vegetables, 58 grains, such as rice, and 16 special crops. Among the fruits, 154 apples (18.6% of the total number certifications) were certified, followed by 143 grapes (17.2%) [15]. In 2020, the National Statistical Office announced that among the 400,000 farms that produce fruits, 44,806 grew apples [16]. These farms accounted for 11.2% of the total fruit farms. Park M.S. et al. (2018) announced that apples had the largest cultivation area (33,646 ha) among fruits’ total cultivating area. Such area was 1.66 times that of the second largest grape-growing area (20,281 ha) [17]. Therefore, this study selected apples as the most representative item for evaluating the sustainability of low-carbon agricultural products and thus were designated as the research subject.

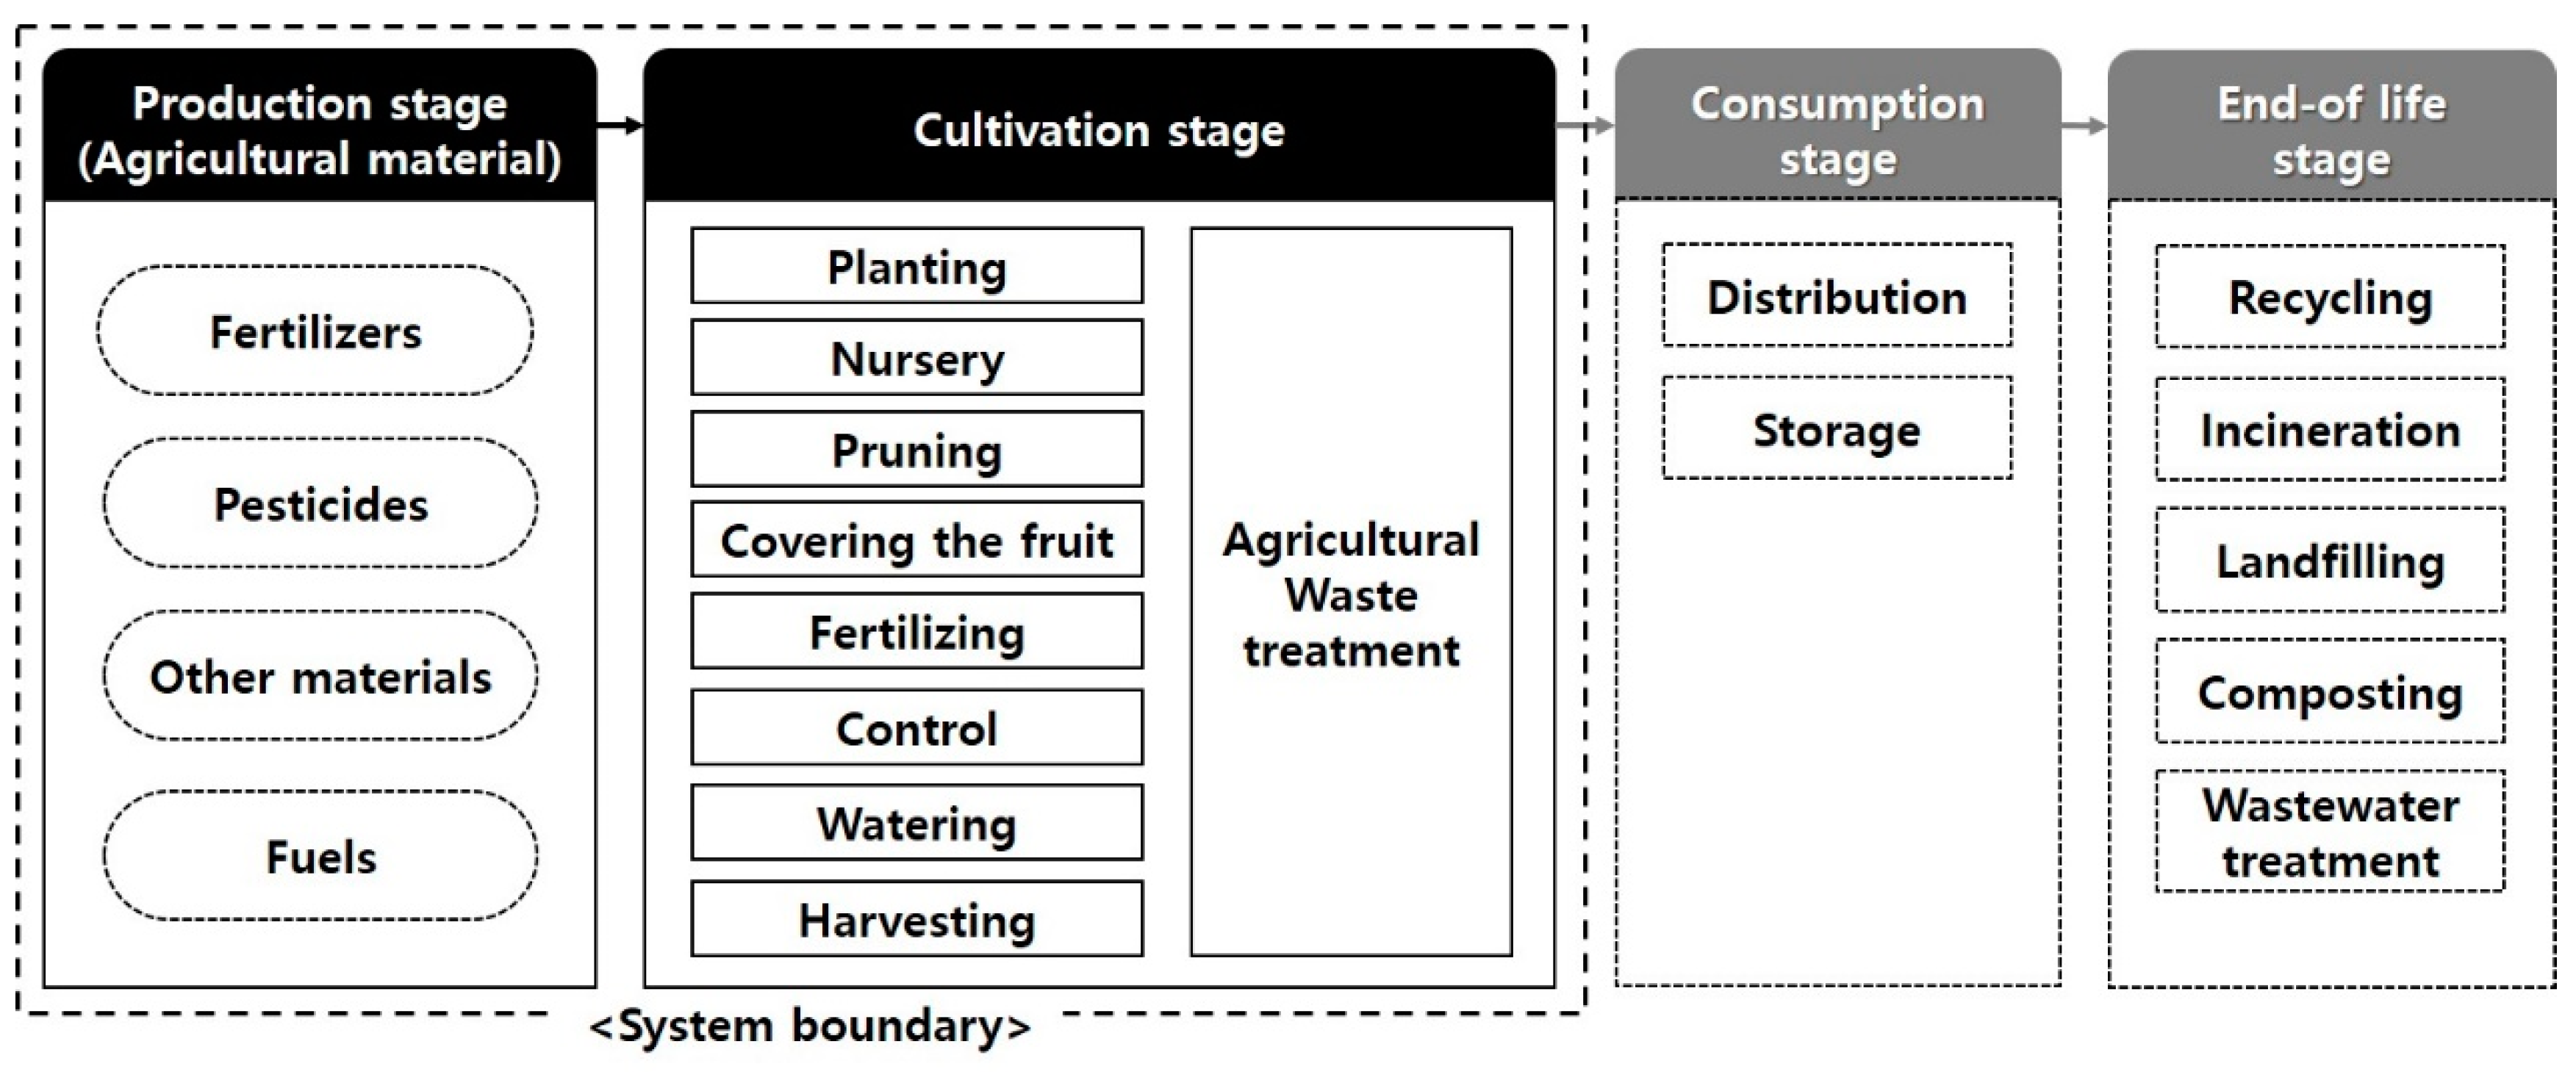
2.2. Environmental Assessment of Apples

A life cycle assessment (LCA) technique was used to assess apples’ environmental assessment. ISO 14040 and ISO 14044 were used as methodology for the LCA of apples [18,19]. In addition, the ENVI-Food Protocol’s representative guidelines for carrying out LCAs on agricultural products, published in the European Food Sustainable Consumption and Production Round Table, were analyzed [20,21]. In particular, it is suggested that the functional unit for B2C (business to consumer) food should be expressed in weight or volume in the ENVI-food protocol [20]. By applying the requirement, the functional unit was defined as the production of 1 ton of apples for the comparison of equal sustainability in consideration of the production yield of the two cultivation methods. This unit quantifies a product system’s performance as a reference unit. Figure 1 shows the system boundary of apple’s product system. The system boundary included the production stage of agricultural materials and the apple cultivation stage, excluding the distribution stage and end-of life stage. In other words, the system boundaries include the scope of “cradle to gate”. In detail, the wastewater treatment process in the agricultural farming system was excluded from the system boundary in Korea because wastewater was not considered to be generated during the cultivation. CO2 uptake in the apple cultivation process was included in the system boundary. This study did not take human labor into account because human energy input to processes is excluded from the system boundary as addressed in Chapter 6.5 of PAS 2050:2011 (system boundary exclusions) [22].
Data quality requirements considered geographical, time-related, and technology coverage based on ISO 14044 [19]. The primary data were collected from the apple cultivation site for a year within the recent five years. The secondary data used less than ten years of data embedded in GaBi LCA software. Primary data for the period of apple cultivation were collected in 2018 in accordance with the requirements for the time boundary of ISO 14067 [23]. In fact, primary conventional farming data were based on the data in 2018 crop income report. This report is the dataset collected from 136 apple farms and compiled by the Rural Development Administration (RDA) [24]. Primary data for low-carbon farming were the average value obtained from 30 farms among 136 farms with low-carbon apple certification. We also used secondary data to calculate the emissions and environmental impacts from the supply chain of apple cultivation such as seedling cultivation, planting, agricultural material production, etc. We compiled the life cycle inventory results using the primary and secondary data collected according to the calculation modelling presented in the PEF (product environmental footprint) guide [25].
For impact assessment, 14 category indicators and evaluation models of impact categories recommended by the European Commission’s Product Environmental Footprint guide were used. The impact categories considered in this study are acidification, climate change (including biogenic carbon), eco-toxicity (freshwater), eutrophication (freshwater), eutrophication (marine), eutrophication (terrestrial), human toxicity (cancer effects), human toxicity (non-cancer effects), ionizing radiation (human health), land use, particulate matter/respiratory inorganics, photochemical ozone formation, resource depletion (water), resource depletion (mineral, fossil, renewables) [25]. Direct land use change was excluded because it was not possible to accurately identify the year of change to cropland. For reference, ISO 14067 presented the GHG emissions, and removals occurring as a result of direct land use change within the last 20 years shall be assessed in accordance with internationally recognized methods [23]. The impact assessment was carried out in accordance with the procedure in ISO 14044, the process of measuring category indicator results (characterization), the phase of calculating relative magnitudes of each impact category (normalization), and the step of measuring relative significance based on value-choices (weighting). The environmental performances were compared for each of the two cultivation methods [19].

2.3. Cost Analysis of Apples

A price list of agricultural materials and fuel was collected to evaluate the cost of apples produced through conventional and low-carbon farming. Cost items include inorganic and organic fertilizer, crop protection agents, fuel, electricity, other agricultural materials, land, and rent, among others. The unit costs for conventional and low-carbon farming were based on the income report data and actual farms and literature.

2.4. Product Sustainability Assessment of Apples

This study applied UN ESCAP’s methodology as a product sustainability indicator as follows:
P S I i = P r o f i t i E c o p o i n t i
where i is an apple cultivated from i cultivation farming. The result of Equation (1) is the absolute product sustainability. It shows that the higher the profit of the numerator and the smaller the eco-point denominator, the greater is the apples’ sustainability. Moreover, the factor X concept was introduced to compare the sustainability of two types of apples as follows:
Factor   X = P S I t a r g e t P S I r e f
where ref is the reference apples, such as conventional apples. Thus, factor X in Equation (2) evaluates the sustainability of conventional and low-carbon apples as a denominator and molecule, respectively. The result is the relative product sustainability, indicating that the sustainability of low-carbon apples is X times that of conventional apples.

3. Results and Discussion

3.1. Comparing Primary Data between Conventional and Low-Carbon Farming

Table 1 shows the amounts of fertilizer, crop protection agent, fuel, and agricultural material inputs in the process of cultivating apples through two farming methods. For environmental assessment of two types of apples, primary data on wastes and emissions from the farms should be collected. However, related data could not be collected due to limitations in collecting primary data from farms. These amounts are based on harvesting 2173 kg of apples from an area of 10a (0.1 ha) using two cultivation methods. In total, 2173 kg is the average apple production harvested from an area of 10a of apple farms certified as low-carbon agricultural product in Korea [15]. Table 1 shows that conventional farming had more input than low-carbon farming. Crop protection agents used in conventional farming were up to 26 times higher than those in low-carbon farming. The reason is because low-carbon apples are eco-friendly agricultural products. Moreover, an analysis of the process of cultivating low-carbon apples shows that it uses less oil and energy and agricultural materials than that of conventional farming. On the contrary, it was analyzed that low-carbon farmers used more liquid fertilizers directly manufactured and used less chemical fertilizer than conventional farmers.

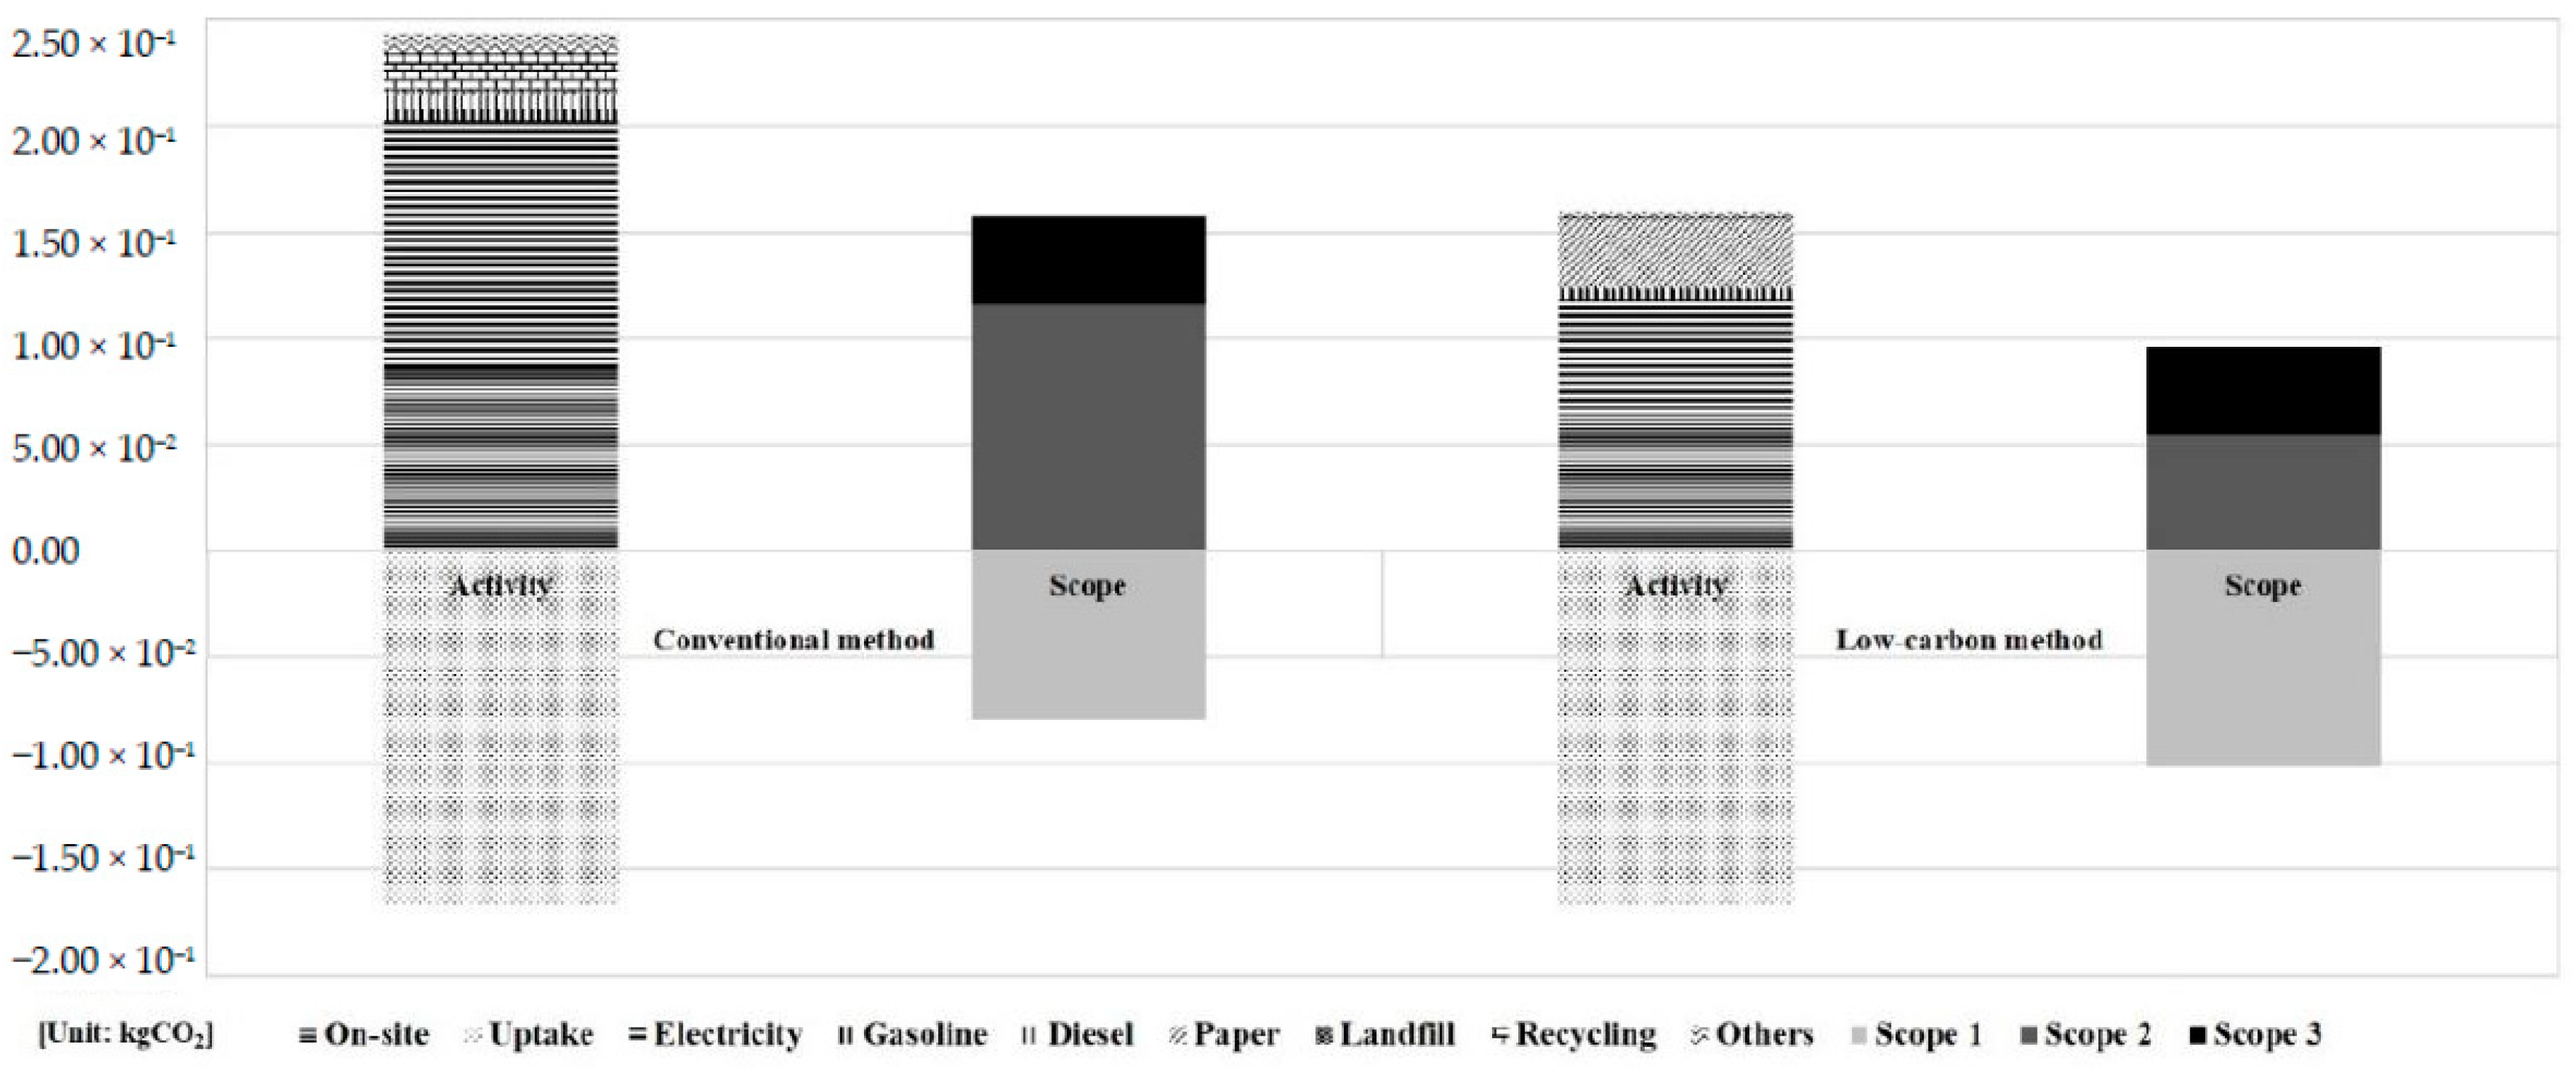
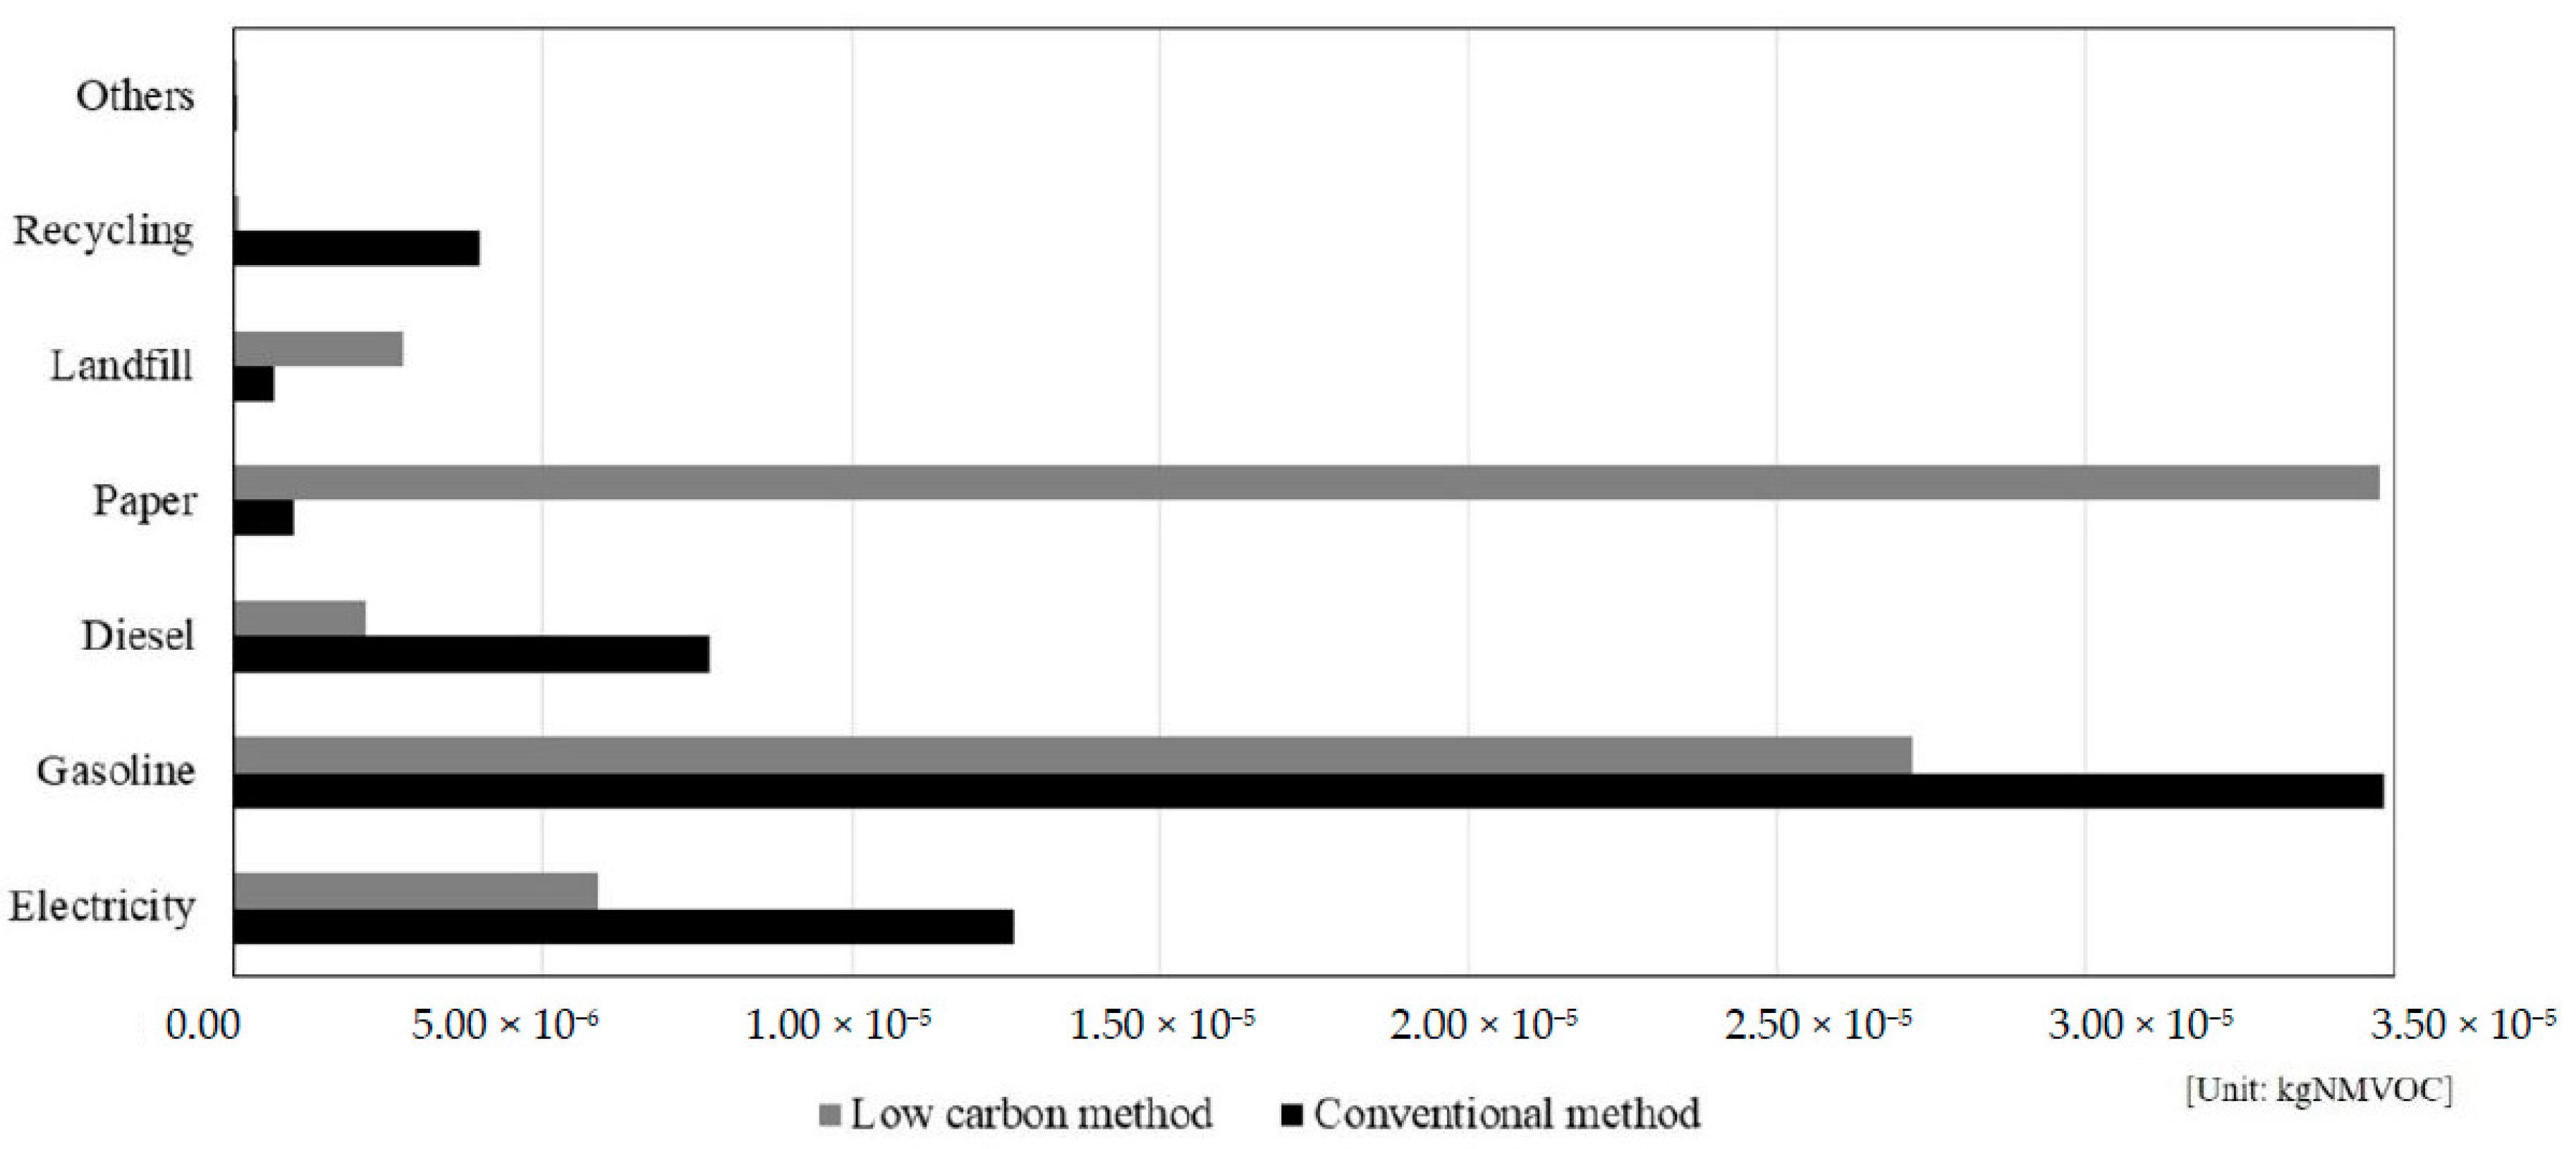
3.2. Environmental Assessment between Conventional and Low-Carbon Farming

The input (activity) data for fertilizers, crop protection agents, oil and energy, and agricultural materials presented in Table 1 were converted to life cycle inventory (LCI) results per functional unit using GaBi LCA software. The LCI dataset was selected based on the data quality requirements previously defined. Table 2 shows a list of secondary data used in this study. Here, a dataset other than electricity data is the LCI dataset embedded in GaBi software [26]. Moreover, to enhance the reliability of the research, the electricity dataset was developed in consideration of the ratio of power sources that reflected the Korean situation in 2018.
The LCI results comprise a dataset of various elementary flows and were calculated using Equation (3) as follows:
L C T j = i = 1 n ( A i × L C I i j )
where A is an intermediate flow indicating activity data, such as electricity, fertilizer, and pesticide; LCI is the aggregate of elementary flows per functional unit, such as EU ILCD (international life cycle data) and eco-invent dataset; i is an intermediate flow, such as A; j is a specific elementary flow, such as carbon dioxide (CO2) [27].
Table 3 and Table 4 present the LCI results of apples cultivated through conventional and low-carbon farming. The inputs and outputs of 28 main elementary flows were presented for various activity data. Thus, the sum of inputs or outputs for each activity data for a specific elementary flow is the environmental load by such elementary flow.
The carbon dioxide presented in Table 3 and Table 4 is the most representative substance causing climate change. Figure 2 shows and compares the cumulative graph of carbon dioxide emissions per functional unit for each of the two cultivation methods. The CO2 emissions generated throughout the life cycle of the two types of apples were 244 g CO2 and 160 g CO2, respectively. Conventional apples discharged 1.6 times more CO2 than low-carbon apples. For conventional farming, CO2 emission from electricity use was the most dominant, followed by plastic recycling and diesel combustion. The order of CO2 emissions in low-carbon farming was the highest in electricity use, followed by the use of apple cover and gasoline combustion. In addition, the CO2 uptake per 1 kg of apples in the two apples was the same at 166 g CO2. Here, the CO2 uptake per 1 kg of apples is the annual CO2 absorption of 4.2 ton CO2 per 1 ha of apple farm divided by the yield per 1 ha [28]. So, the data appear to net-emit 77.5 g CO2 and −6.1 g CO2 per 1 kg of conventional apples and low-carbon apples, respectively. Direct CO2 emissions from fuel combustion on the farm were 8.60 × 10⁻² and 6.40 × 10⁻², respectively. Next, we analyzed GHG emissions and removals according to the three areas of GHG emission sources presented in the GHG protocol published by the World Business Council for Sustainable Development (WBCSD) and the World Resource Institute (WRI) [29]. First, Scope 1 emissions by direct GHG emission and removals in the farms of conventional apples and low-carbon apples were −8.00 × 10⁻² and −1.02 × 10⁻¹, respectively. Scope 2 emissions, indirect emission by electricity, were 1.16 × 10⁻¹ and 5.44 × 10⁻². Finally, Scope 3 emissions, indirect emissions from other sources, were 4.15 × 10⁻² and 4.15 × 10⁻². The methane emission generated per 1 kg of conventional and low-carbon apples was also 4.58 × 10⁻⁴ and 2.63 × 10⁻⁴, respectively. Conventional farming emitted 74% more CH4 than low-carbon farming.
Non-methane volatile organic compound (NMVOC) affects respiratory diseases. Figure 3 shows that the amount of NMVOC generated by the low-carbon farming and the conventional farming is 7.28 × 10⁻⁵ kg and 6.07 × 10⁻⁵ kg, respectively. The reason why the amount of NMVOC emitted from low-carbon farming is 20% higher than that of conventional farming is because low-carbon farming used an excessively thick unbleached apple paper cover to enhance the quality of the low-carbon apples during the cultivation process. The amount of unbleached paper used per 1 kg of low-carbon apples is also 8.5 times that of conventional apples. While the NMVOC generated per 1 kg of unbleached paper is 4.72 × 10⁻⁴ kg, NMVOC emitted in the life cycle of other papers, such as printing paper, is about 10% of the unbleached paper.
Table 5 presents 14 category indicator results of apples of conventional and low-carbon farming and compares two category indicator results of each impact category. Equation (4) below shows that the category indicator result, that is, the characterization result (CR), on k impact category is the sum of the results that multiply the LCI result (LCR) of j parameter, that is, the elementary flow, affecting k impact category with characterization factor (CF), equivalency factor, of j parameter on k impact category.
C R k = j = 1 n ( L C R j k × C F j k )
According to Table 5, the environmental impacts of conventional farming were higher than those of low-carbon farming in 10 impact categories, including acidification and climate change and so on. In particular, the impact of climate change on conventional apples was 27.8 times higher than that of low-carbon apples and the effects of eco-toxicity (freshwater) and human toxicity (cancer effects) were relatively high, which was attributed to the excessive use of crop protection agents. On the other hand, the reason why the effects of land use (indirect) and resource depletion (water) are 21 times and 3 times higher than the conventional farming was analyzed as excessive use of apple paper cover.
The normalization step was performed for a relative magnitude between the characterization results of each impact category presented in Table 5 [30]. The normalization result (NR) of k impact category is the value obtained by dividing its characterization result by its normalization reference (NRe) as follows:
N R k = C R k N R e k
The units of NR for 14 impact categories are the same as “per person”. The normalization references applied in this study were based on “Global normalization factors for environmental footprint” published in EC Joint Research Center (JRC) [30]. Figure 4 shows NR for 14 impact categories of apples cultivated by conventional and low-carbon farming. In conventional farming, the highest environmental impact was human toxicity (cancer) followed by human toxicity (non-cancer). Both of the two relatively large environmental impacts were analyzed as environmental impacts caused by the use of crop protection agents. Similar to conventional farming, the low-carbon farming also had a relatively higher effect of human toxicity (cancer) than other impact categories. The cause is that even if the amount of crop protection agent is low, the effect of this is relatively high. Eutrophication (freshwater), the second highest environmental impact of low-carbon farming, was analyzed as a result of excessive use of liquid fertilizer.
The weighting results (WRs) for each cultivation farming of apples, as in Equation (6), was calculated by multiplying the NR of the k impact category by the weighting factor (WF) of the k impact category and then summed as follows [31]:
WRs = k = 1 14 ( N R k × W F k )
The WF of each impact category applied the WF published by EC JRC [31]. Table 6 shows the WR for each impact category and the sum of the WR for each impact category using Equation (6). The sum of the weighting result of each impact category referred to as “eco-point” was 2.07 × 10⁻³ and 1.17 × 10⁻³, respectively. The eco-point of conventional farming was 78% higher than that of low-carbon farming. The weighting result indicates that the highest priority among the environmental impacts due to conventional apples was climate change, followed by human cancer, particulate matter, acidification, and eutrophication. Climate change had the greatest impact on low-carbon apples, followed by human cancer, eutrophication, ionizing radiation, and human non-cancer. Climate change and human cancer were found as the greatest environmental impacts during the cultivation of conventional and low-carbon apples.

3.3. Economic Assessment between Conventional and Low-Carbon Farming

An economic assessment should be conducted, in addition to the environmental assessment, to evaluate the sustainability of apples. Cost assessment was the first step in the economic assessment. In addition to the costs of fertilizers, crop protection agents, and agricultural materials among others in Table 1, the cost assessment included costs of farm equipment, rental, depreciation, land, and labor as shown in Table 7. For a reliable cost assessment, the unit cost of each cost item was collected from the income report of the RDA and actual costs from low-carbon apple farms [23]. Table 7 shows the actual costs for cost items and total costs per 1 kg of conventional and low-carbon apples. In conclusion, the total cost of a conventional apple was USD 1.93 per kg of apple, whereas a low-carbon apple cost USD 3.17 per kg of apple. Thus, the cost of low-carbon apples is 1.6 times higher than that of conventional apples. In addition, low-carbon apples had higher operating, fertilizer, agricultural material, farm equipment, maintenance, land rental costs, and consigned farming than conventional apples. Additionally, the cost of crop protection agents, fuel and energy costs and labor costs invested in growing low-carbon apples were higher than the cost of conventional apples.
However, the selling price per kg of conventional and low-carbon apples was USD 2.13 and USD 4.17, respectively. Thus, low-carbon apples cost 1.96 times higher than conventional apples as it is recognized as an eco-friendly brand by consumers. The actual profit of subtracting the total cost (c) from the actual selling price (d) was USD 0.20 and USD 1.00 for conventional and low-carbon apples, respectively. Low-carbon apples’ profit was five times that of conventional apples. Equation (7) was used to calculate the return on investment (ROI) in the production of 1 kg apples. The ROI is a performance measure used to evaluate the efficiency of an investment. The ROI is the results of dividing i actual profit (P) by i total cost (C) as follows [32]:
R O I i = P i C i × 100
From Equation (7), the ROI of conventional apples was 10.3% of the total cost, whereas that of low-carbon apple was 31.4%. Thus, the investment efficiency of low-carbon apple was approximately three times higher than that of conventional apple.

3.4. Product Sustainability of Apples Cultivated through Conventional and Low-Carbon Farming

The absolute product sustainability and relative product sustainability of conventional and low-carbon apples were evaluated using Equations (1) and (2). First, the absolute product sustainability of conventional and low-carbon apples was 96.01 (USD/eco-point) and 853.03 (USD/eco-point), respectively. As mentioned, conventional apples’ sustainability is lower than that of low-carbon apples because conventional apples’ profit is significantly low compared with that of low-carbon apples.
Second, relative product sustainability was evaluated using the factor X concept. The x- and y-axis in Figure 5 represents the eco-point and profit, respectively. The bold diagonal line connects the point where the product sustainability is 96.01(USD/eco-point) when the eco-point of x-axis changes from 0.00 to 1.10 × 10⁻². Figure 5 shows the relative sustainability and when the distribution of conventional apple’s sustainability indicated by bold diagonals is 1, it was also the sustainability of low-carbon apples. Here, the gray triangle indicates sustainability greater than 1, whereas the white triangle indicates sustainability less than 1.
The relative product sustainability of low-carbon apples calculated by applying the factor X concept was 8.89. Furthermore, the relative sustainability of eco-friendly apples similar to low-carbon apples was 5.00. Eco-friendly apples are less sustainable than low-carbon apples because the amount of crop protection agents used is the same as that in low-carbon apples. However, fuel and energy consumption are similar to that of conventional apples. Figure 5 provides ways to effectively increase the sustainability of apples grown in a specific way.

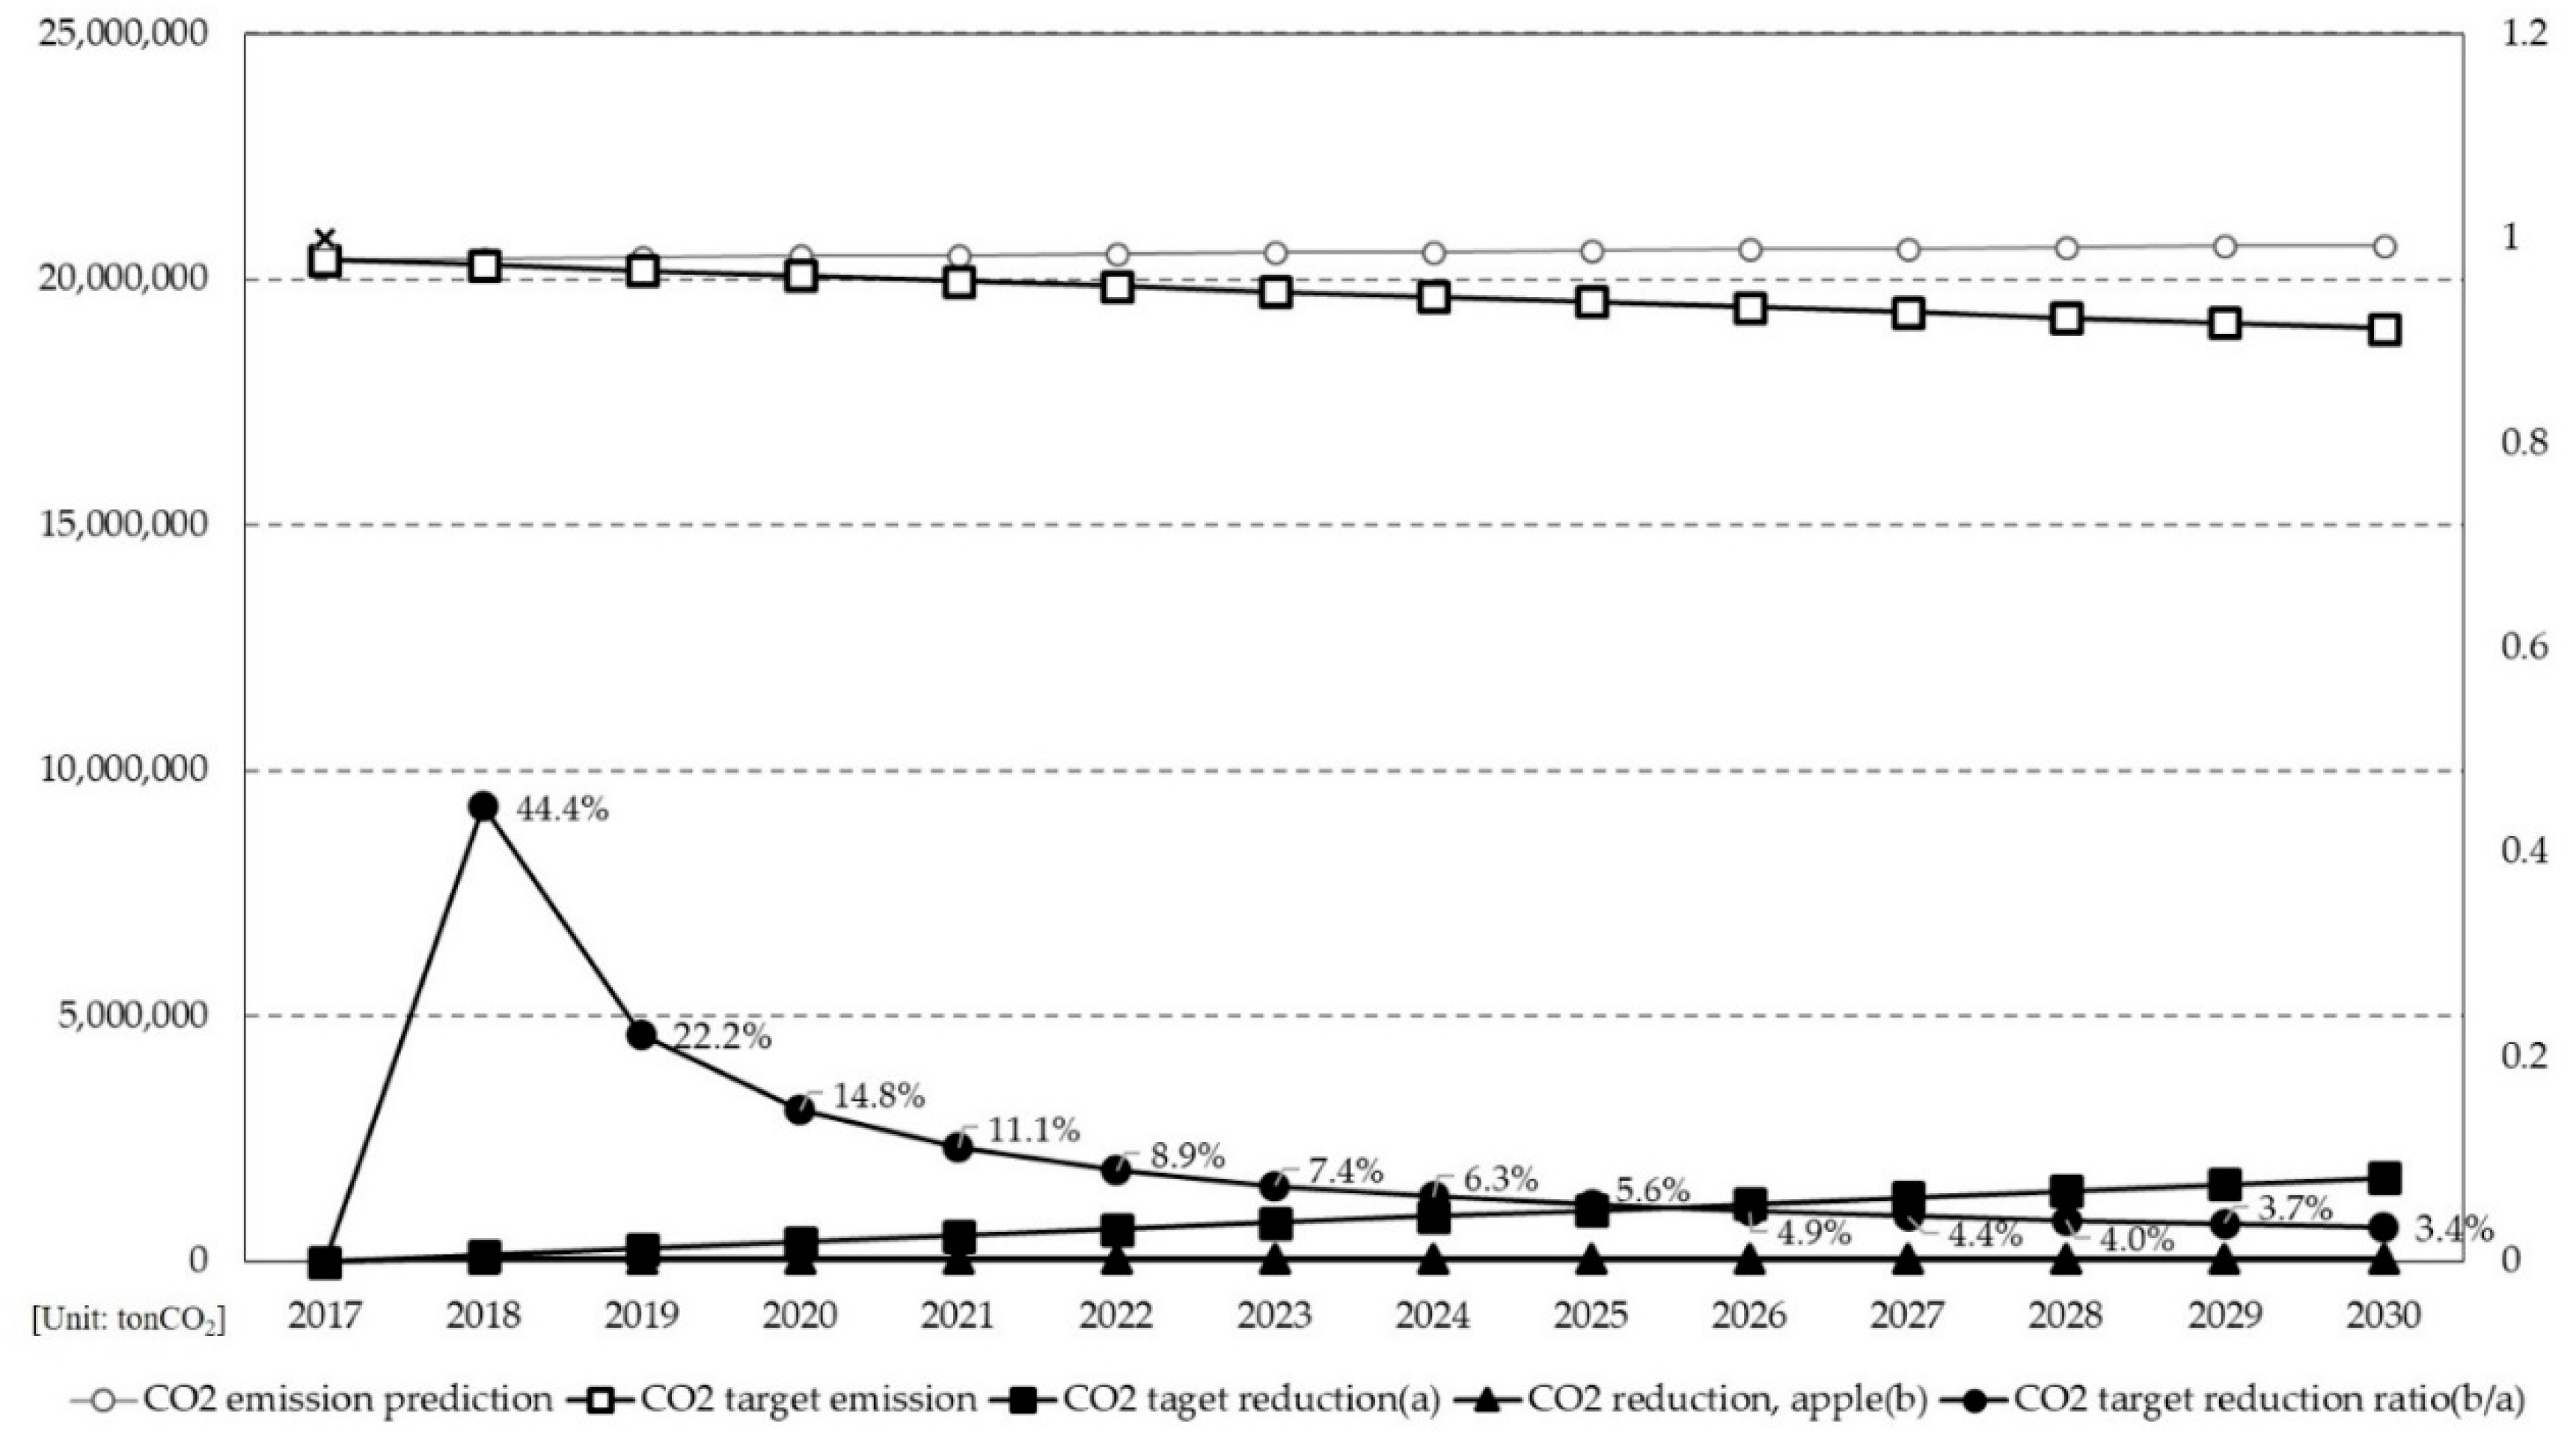
3.5. Product Sustainability of Apples Cultivated through Conventional and Low-Carbon Farming

The Korean government has announced its second basic plan for climate change response. It resets the national GHG reduction targets by sector to respond to Paris’ new climate system. As a result, the national GHG reduction targets in the agricultural and livestock sector containing apples are expected to release 20.7 million tons of CO2, up to 1.6% in 2030, based on 2017 emissions of 20.4 million tons of CO2 (Figure 6). The target was set to emit 19.0 million tons of CO2, which was reduced by 7.9% in 2030 based on the 2030 emission target. The annual reduction in 2030 will increase to 1.7 million tons CO2. This amount is equivalent to 8.94% of the target CO2 emissions in 2030 [33].
CO2 emissions per kg of conventional and low-carbon apples are 0.111 kg and 0.004 kg, respectively. If all conventional apples are replaced with low-carbon apples, then 0.107 kg of CO2 per kg of apples can be reduced. Therefore, assuming that Korea’s average apple yield over the past 5 years, which is announced by the Korean Statistical Information Service (KOSIS), is replaced by low-carbon apples, CO2 can be reduced by 58,111 tons annually [17]. This annual reduction is estimated to decrease annually as it accounted for 44.4% of the 2018 reduction target in agricultural and livestock sector and will drop to 3.4% in 2030. The national GHG reduction targets are set based on direct and controllable indirect emissions. However, the scope of the expected GHG emission reductions due to the transition to low-carbon apples is inconsistent. However, given that uncontrollable indirect emissions from the agricultural and livestock sectors are domestic emissions, the shift to low-carbon apples is considered a significant reduction strategy because it can be included in the total CO2 reduction.
FACT introduced that 51 items, such as food crops, vegetables, fruits, and special crops, can be certified as low-carbon agricultural products. If all farms cultivating 51 items are certified with low-carbon agricultural products, then the GHG emission reduction target in the agricultural and livestock sector is achievable.

4. Conclusions

To avoid the worst climate impacts, global GHG emissions will not only need to drop by half by 2030, then reach net-zero around 2050. Recently, several countries, including South Korea and the EU, declared net-zero CO2. Under the circumstances, this study provides a clear reason for the agricultural sector to shift its cultivation method from conventional to low-carbon farming. Low-carbon farming is an alternative method of farming that can respond to the climate crisis by reducing GHG emissions by minimizing consumption of fuel and energy compared to conventional farming. In fact, the GHG reduction effect of low-carbon apples was 107 g of CO2 per kg of apples. If all conventional apples were shifted to low-carbon apples, then its estimated annual contribution to GHG reduction targets in the agricultural and livestock sector would be at least 3.4%. In addition, low-carbon farming is less harmful to the eco-system by minimizing the use of chemical fertilizer and crop protection agents. According to this study, low-carbon apples had 8.89 times higher sustainability than conventional apples. In addition, the low-carbon farming for apples had more ROI than conventional farming. So, the low-carbon farming for apples had a higher relative product sustainability compared to the conventional farming.

Author Contributions

Conceptualization and methodology, I.K.; analysis and validation, I.K.; resources and original draft preparation, C.-y.S.; writing and editing, I.K.; supervision and administration, E.-c.J. All authors have read and agreed to the published version of the manuscript.

Funding

This research received no external funding.

Acknowledgments

This manuscript is based on Chan-young Song’s doctoral dissertation. We thank the support of Sejong University’s Graduate School, specialized in Climate Change (financially supported by the Ministry of Environment (MOE)), and also the support of the Institute of Planning and Evaluation for Technology in Food, Agriculture and Forestry (IPET).

Conflicts of Interest

The authors declare no conflict of interest.

References

  1. United Nations Development Programme. Goal 12: Responsible Consumption and Production. Available online: https://www.undp.org/content/undp/en/home/sustainable-development-goals/goal-12-responsible-consumption-and-production.html (accessed on 5 November 2020).
  2. United Nations, Population. Available online: https://www.un.org/en/sections/issues-depth/population/ (accessed on 5 November 2020).
  3. Food and Agriculture Organization of the United Nations. Global and Regional Food Consumption Patterns and Trends. Available online: http://www.fao.org/3/ac911e/ac911e05.htm (accessed on 5 November 2020).
  4. Organization for Economic Co-operation and Development. Water and Agriculture. Available online: https://www.oecd.org/agriculture/topics/water-and-agriculture (accessed on 5 November 2020).
  5. Tukker, A.; Huppes, G.; Guinee, J.; Heijungs, R.; Koning, A.; Oers, L.; Suh, S.; Geerken, T.; Holderbeke, M.V.; Jansen, B.; et al. Environmental Impact of Products (EIPRO); European Commission Joint Research Centre: Ispra, Italy, 2006. [Google Scholar]
  6. European Commission. The European Green Deal; European Commission: Brussels, Belgium, 2019. [Google Scholar]
  7. Won, S.H.; Choi, H. The Agricultural Products Consumer Attitude Survey; Korea Agro-Fisheries & Food Trade Corporation: Naju, Korea, 2018. [Google Scholar]
  8. Masakazu, I.; Sangmin, N.; Sophie, B.; Hitomi, R.; Brian, C.; Ying, Q.; Rujira, K. Eco-Efficiency Indicators: Measuring Resource-Use Efficiency and He Impact of Economic Activities on the Environment; UN Economic and Social Commission for Asia and the Pacific (ESCAP): Bangko, Thailand, 2009. [Google Scholar]
  9. Changwichan, K.; Silalertruka, T.; Gheewala, S. Eco-efficiency assessment of bioplastics production systems and end-of-life options. Sustainability 2018, 10, 952. [Google Scholar] [CrossRef] [Green Version]
  10. Putri, W.H.; Sari, N.Y. Eco-efficiency and eco-innovation: Strategy to improve sustainable environmental performance. IOP Conf. Ser. Earth Environ. Sci. 2019, 245, 12049. [Google Scholar] [CrossRef]
  11. Thu, T.L.; Jan, E.; Gretchen, A.M. Measuring product sustainability: A literature review. In Proceedings of the Industrial and System Engineering Research Conference, Anaheim, CA, USA, 21–24 May 2016. [Google Scholar]
  12. Taeko, A.; Ryoichi, Y.; Toshiharu, I.; Yasuyuki, K. Factor X (eco-efficiency) assessment on global warming for one household in Japan. J. Inst. Energy 2010, 89, 1070–1087. [Google Scholar] [CrossRef] [Green Version]
  13. Rodrigo, C.; Lisiane, V.M.; Raquel, F.D.; Osvaldo, G.Q. Towards sustainable development through the perspective of eco-efficiency: A systematic literature review. J. Clean. Prod. 2017, 165, 890–904. [Google Scholar] [CrossRef]
  14. Misung, P.; Misook, L.; Sungwoo, K. In-Depth Research to Understand the Major Fruits Conditions; Korea Rural Economic Institute: Naju, Korea, 2018. [Google Scholar]
  15. Song, C.Y. Climate & Environmental Analysis and Economic Effect of Low Carbon Agricultural Technology Using LCA and Eco-Effieicncy; Sejong University: Seoul, Korea, 2020. [Google Scholar]
  16. Kim, C.G. Statistical Report on Food Consumption Behavior; Korea Rural Economic Institute: Naju, Korea, 2018; pp. 856–862. [Google Scholar]
  17. KOSIS. Fruit Production, Korean Statistical Information Service (KOSIS). 2018. Available online: htttp://kosis.kr/statHtml/statHtml.do?orgId=101&tblId=DT_1ET0292 (accessed on 21 June 2020).
  18. ISO. ISO 14040: Environmental Management–Life Cycle Assessment–Principles and Framework; ISO: Geneva, Switzerland, 1997. [Google Scholar]
  19. ISO 14044: Environmental Management–Life Cycle Assessment–Requirements and Guidelines; ISO: Geneva, Switzerland, 2006.
  20. Camillo, D.C.; Christian, B.; Urs, S.; Nicolas, M.; Henry, K.; Coen, B.; Jean, C.B.; Lars, L.; Øyvind, V.; Anna, P.; et al. ENVIFOOD Protocol: Environmental Assessment of Food and Drink Protocol; European Food Sustainable Consumption & Production Round Table: Ixelles, Belgium, 2013. [Google Scholar]
  21. EC. Commission Recommendation on the Use of Common Methods to Measure and Communicate the Life Cycle Environmental Performance of Products and Organizations; European Commission: Brussels, Belgium, 2013. [Google Scholar]
  22. BSI. PAS 2050: Specification for the Assessment of the Life Cycle Greenhouse Gas Emissions of Goods and Services; British Standards Institution (BSI): London, UK, 2011. [Google Scholar]
  23. ISO 14067: Greenhouse Gases–Carbon Footprint of Products–Requirements and Guidelines for Quantification; ISO: Geneva, Switzerland, 2018.
  24. Ra, S.Y. Crop Income Report; Rural Development Administration (RDA): Naju, Korea, 2018. [Google Scholar]
  25. Manfredi, S.; Allacker, K.; Chomkhamsri, K.; Pelletier, N.; Souza, D.M. Product Environmental Footprint (PEF) Guide; European Commission: Brussels, Belgium, 2012. [Google Scholar]
  26. Spatari, S.; Betz, M.; Florin, H.; Baitz, M.; Flatenbacher, M. Using GaBi 3 to perform life cycle assessment and life cycle engineering. Int. J. Life Cycle Assess. 2001, 6, 81–84. [Google Scholar] [CrossRef]
  27. Eco-Invent: LCI Datasets & LCIA Results. Available online: www.ecoinvent.org/database/how-to-use-ecoinvent-3-online/lci-datasets-and-lcia-results/lci-datasets-and-lcia-results.html (accessed on 20 June 2020).
  28. Eunjung, C.; Sangwook, S.; Hyunchul, J.; Jongsik, L.; Kunyeup, K.; Gyugo, S. A review on the carbon exchange estimation in fruit orchard. J. Clim. Chang. Res. 2014, 5, 339–348. [Google Scholar]
  29. Ranganathan, J.; Corbier, L.; Bhatia, P.; Schmitz, S.; Gage, P.; Oren, K. The Greenhouse Gas Protocol: A Corporate Accounting and Reporting Standard; World Business Council for Sustainable Development and World Resource Institute: Geneva, Switzerland, 2004. [Google Scholar]
  30. Serenella, S.; Eleonora, C.; Michela, S.; Rana, P. Global Normalization for the Environmental Footprint and Life Cycle Assessment; EC JRC Technical Report; Publications Office of the European Union: Brussels, Belgium, 2017. [Google Scholar]
  31. Sala, S.; Cerutti, A.K.; Pant, R. Development of a Weighting Approach for the Environmental Footprint; European Commission: Luxembourg, 2018. [Google Scholar]
  32. Return on Investment (ROI). Available online: www.investopedia.com/terms/r/returnoninvestment.asp (accessed on 11 October 2020).
  33. Seo, H.W.; Kim, J.H. 2030 Greenhouse Gas Reduction Roadmap Amendment and 2018–2020 Emission Permit Allocation Plan Confirmed; Press Release of Ministry of Environment: Sejong, Korea, 2018.
Figure 1. System boundary for apples’ environmental assessment.
Sustainability 12 09364 g001
Figure 2. Comparison of CO2 emissions of apples cultivated through conventional and low-carbon farming.
Sustainability 12 09364 g002
Figure 3. Comparison of NMVOC emissions generated from the activity data of conventional and low-carbon farming.
Sustainability 12 09364 g003
Figure 4. Normalization results of 14 impact categories of apples cultivated through conventional and low-carbon farming.
Sustainability 12 09364 g004
Figure 5. Comparison of product sustainability of apples cultivated through conventional and low-carbon farming.
Sustainability 12 09364 g005
Figure 6. Annual distribution of contribution to the national greenhouse gas (GHG) reduction due to the transition from conventional to low-carbon apples.
Sustainability 12 09364 g006
Table 1. Input table of apple cultivation through conventional and low-carbon farming.
Input (Activity)UnitAmountsRatio (a/b)
(%)
Conventional Farming (a)Low-Carbon Farming (b)
Organic
fertilizer
Livestock manurekg5.81 × 10−12.34 × 10−1247.9
Oil cakekg4.05 × 10−29.66 × 10−3419.0
Raw strawkg9.20 × 10−40.00-
Liquid fertilizerkg5.06 × 10−31.51 × 10−13.3
Eco-fertilizerkg4.60 × 10−47.82 × 10−35.9
Otherskg0.000.00-
Inorganic
fertilizer
Complex fertilizerkg9.20 × 10−35.52 × 10−3166.7
Ureakg3.68 × 10−31.38 × 10−3266.7
Fused Phosphate fertilizerkg4.60 × 10−44.60 × 10−4100
Potassium chloridekg4.60 × 10−40.00-
Potassium sulfatekg3.22 × 10−34.60 × 10−370.0
Boronkg4.60 × 10−40.00-
Agricultural limekg5.06 × 10−33.13 × 10−216.2
Calcium silicatekg0.000.00-
Magnesium sulfatekg4.60 × 10−41.84 × 10−325.0
Nutrientskg0.005.06 × 10−3-
Otherskg0.000.00-
Crop
protection agent
Pesticidekg2.16 × 10−22.30 × 10−3940.0
Disinfectantkg5.52 × 10−32.76 × 10−3200.0
Herbicidekg1.20 × 10−24.60 × 10−42600.0
Otherskg0.000.00-
Oil and EnergyElectricitykWh2.00 × 10−19.34 × 10−2214.3
DieselL1.43 × 10−28.74 × 10−3163.2
GasolineL1.47 × 10−21.98 × 10−274.4
KeroseneL9.20 × 10−40.00-
Agricultural materialReflective filmkg4.83 × 10−21.01 × 10−2477.3
Drip hosekg5.06 × 10−39.20× 10−4550.0
Apple coverkg3.68 × 10−33.08 × 10−211.9
Vinyl filmkg0.000.00-
Otherskg4.60 × 10−40.00-
Table 2. Life cycle inventory (LCI) dataset used for the environmental assessment of apples.
Activity NameDataset NameSourceYear
ElectricityKorea electricity mixSMaRT-Eco2020
DieselDiesel mix at refineryUS LCI2018
GasolineGasoline at refineryUS LCI2018
Crop protection agentPesticide, corn, 2022US LCI2017
Nitrogen fertilizerNitrogen fertilizer, production mix at plantUS LCI2017
Phosphate fertilizerPhosphate fertilizer, production mix at plantUS LCI2017
Reflective filmAl-foiled plastic filmK-EPD **2019
Drip hoseChlorine, PVC producer average at plantUS LCI2018
Apple coverKraft paper (EN15804-A1-A3)GaBi2018
Steel pinIron and steel, production mixUS LCI2018
Recycling (film)Mixed recyclables, at collectionNREL * US2018
Recycling (plastic)Plastic recycling (unspecified)US LCI2018
Recycling (paper)Mixed recyclables, at collectionNREL * US2018
Recycling (steel)Mixed recyclables, at collectionUS LCI2018
Incineration (paper)Paper waste in waste incineration plantUS LCI2018
Incineration (steel)Ferro metals in waste incineration plantNREL * US2018
Landfill (paper)Paper waste on landfill, post-consumerUS LCI2018
Landfill (steel)Ferro metals on landfill, post-consumerUS LCI2018
* NREL (National Renewable Energy Laboratory), ** K-EPD (Korea EPD certified data).
Table 3. LCI results of 1 kg of apples cultivated through conventional farming.
ParameterUnitOn-SiteUptakeElectricityGasolineDieselPaperLandfillRecyclingOthers
Energy resourceskg 5.98 × 10−21.85 × 10−22.21 × 10−23.19 × 10−41.42 × 10−46.36 × 10−31.83 × 10⁻⁵
Non-renewable energykg 5.98 × 10−21.85 × 10−22.21 × 10−23.19 × 10−41.42 × 10−46.36 × 10−31.83 × 10⁻⁵
Renewable energykg 0.000.000.000.000.000.000.00
Material resourceskg 3.22 × 1013.96 × 10−52.321.351.93 × 10−18.51−7.77 × 10⁻⁴
Non-renewable elementskg 2.63 × 10−50.007.13 × 10−55.31 × 10−78.33 × 10−64.44 × 10⁻⁵−2.53 × 10⁻⁴
Non-renewable resourceskg 2.22 × 10−30.005.38 × 10−31.83 × 10−31.64 × 10−32.73 × 10⁻²−8.84 × 10⁻⁵
Renewable resourceskg 3.22 × 1013.96 × 10−52.311.351.92 × 10−18.49−4.36 × 10⁻⁴
Antimonykg 5.87 × 10−107.03 × 10−122.82 × 10−112.12 × 10−123.72 × 10−131.15 × 10−74.53 × 10−10
Ironkg 7.38 × 10−100.005.44 × 10−93.47 × 10−114.88 × 10−112.23 × 10−99.98 × 10−12
Aluminumkg 1.67 × 10−90.001.94 × 10−123.88 × 10−127.53 × 10−131.24 × 10⁻¹¹−1.28 × 10⁻¹⁴
Ammoniakg 8.93 × 10−83.42 × 10−74.85 × 10−72.78 × 10−82.36 × 10−73.48 × 10−77.42 × 10⁻⁶
Carbon dioxidekg8.60 × 10−2−2.02 × 10−11.16 × 10−16.14 × 10−36.88 × 10−38.49 × 10−46.52 × 10−41.73 × 10−29.71 × 10−3
Carbon monoxidekg 6.64 × 10−52.22 × 10−47.38 × 10−66.74 × 10−67.36 × 10−66.88 × 10−67.62 × 10⁻⁷
Nitrogen dioxidekg 1.03 × 10−80.002.68 × 10−97.31 × 10−98.93 × 10−105.27 × 10−91.85 × 10−11
Nitrogen monoxidekg 8.89 × 10−80.009.13 × 10−88.68 × 10−89.22 × 10−94.64 × 10−81.31 × 10−10
Nitrogen oxideskg 2.83 × 10−44.84 × 10−51.90 × 10−53.67 × 10−61.70 × 10−61.60 × 10−52.94 × 10⁻⁶
Sulfur dioxidekg 8.31 × 10−47.15 × 10−51.28 × 10−51.27 × 10−65.76 × 10−72.66 × 10−56.58 × 10⁻⁵
Sulfur hexafluoridekg 1.21 × 10−160.001.40 × 10−152.24 × 10−161.53 × 10−171.83 × 10−143.43 × 10⁻¹⁷
Sulfur trioxidekg 6.04 × 10−90.001.30 × 10−91.49 × 10−101.60 × 10−113.46 × 10−105.85 × 10⁻¹³
Group NMVOC to airkg 1.26 × 10−53.48 × 10−57.73 × 10−69.62 × 10−76.30 × 10−73.97 × 10−66.38 × 10⁻⁹
Methanekg 3.04 × 10−47.26 × 10−53.43 × 10−51.38 × 10−61.45 × 10−64.08 × 10−54.09 × 10⁻⁶
Dust (> PM10)kg 4.51 × 10−70.001.66 × 10−72.26 × 10−74.62 × 10−81.65 × 10⁻⁶−1.05 × 10⁻⁷
Dust (PM10)kg 6.20 × 10−55.18 × 10−61.36 × 10−91.05 × 10−92.49 × 10−98.72 × 10−95.27 × 10⁻⁶
Dust (PM2.5–PM10)kg 6.46 × 10−61.11 × 10−68.61 × 10−71.90 × 10−73.51 × 10−83.20 × 10−75.02 × 10⁻⁸
Dust (PM2.5)kg 2.59 × 10−70.004.21 × 10−71.19 × 10−75.29 × 10−85.29 × 10−75.36 × 10−9
BODkg 9.57 × 10−61.14 × 10−53.12 × 10−76.43 × 10−81.35 × 10−81.04 × 10−61.37 × 10⁻⁶
CODkg 1.66 × 10−52.17 × 10−57.32 × 10−61.00 × 10−51.62 × 10−71.45 × 10−59.24 × 10⁻⁹
TOCkg 6.89 × 10−100.002.95 × 10−76.63 × 10−99.51 × 10−103.46 × 10⁻⁸−1.86 × 10⁻¹¹
Table 4. LCI results of 1 kg of apples cultivated through low-carbon farming.
ParameterUnitOn-SiteUptakeElectricityGasolineDieselPaperLandfillRecyclingOthers
Energy resourceskg 2.80 × 10−21.44 × 10−26.07 × 10−31.15 × 10−23.09 × 10−41.34 × 10−41.55 × 10⁻⁴
Non-renewable energykg 2.80 × 10−21.44 × 10−26.07 × 10−31.15 × 10−23.09 × 10−41.34 × 10−41.55 × 10⁻⁴
Renewable energykg 0.000.000.000.000.000.000.00
Material resourceskg 1.51 × 1013.09 × 10−56.36 × 10−14.89 × 1013.53 × 10−11.79 × 10⁻¹−7.97 × 10⁻³
Non-renewable elementskg 1.23 × 10−50.001.95 × 10−51.92 × 10−52.28 × 10−59.34 × 10⁻⁷−2.15 × 10⁻³
Non-renewable resourceskg 1.04 × 10−30.001.48 × 10−36.62 × 10−23.86 × 10−35.74 × 10⁻⁴−7.58 × 10⁻⁴
Renewable resourceskg 1.51 × 1013.09 × 10−56.35 × 10−14.88 × 1013.49 × 10−11.78 × 10⁻¹−5.06 × 10⁻³
Antimonykg 2.75 × 10−105.49 × 10−127.73 × 10−127.67 × 10−118.49 × 10−132.42 × 10−93.85 × 10−9
Ironkg 3.46 × 10−100.001.49 × 10−91.25 × 10−91.63 × 10−104.70 × 10−118.45 × 10⁻¹¹
Aluminumkg 7.82 × 10−100.005.31 × 10−131.40 × 10−101.30 × 10−122.61 × 10⁻¹³−1.11 × 10⁻¹³
Ammoniakg 4.18 × 10−82.67 × 10−71.33 × 10−71.01 × 10−61.98 × 10−67.31 × 10−92.40 × 10⁻⁶
Carbon dioxidekg6.40 × 10−2−2.02 × 10−15.44 × 10−24.79 × 10−31.89 × 10−33.07 × 10−27.17 × 10−43.64 × 10−43.05 × 10−3
Carbon monoxidekg 3.11 × 10−51.73 × 10−42.03 × 10−62.44 × 10−43.10 × 10−61.45 × 10−71.23 × 10⁻⁶
Nitrogen dioxidekg 4.81 × 10−90.007.36 × 10−102.64 × 10−72.43 × 10−91.11 × 10−101.57 × 10⁻¹⁰
Nitrogen monoxidekg 4.16 × 10−80.002.50 × 10−83.14 × 10−62.44 × 10−89.76 × 10−101.11 × 10⁻⁹
Nitrogen oxideskg 1.33 × 10−43.78 × 10−55.20 × 10−61.33 × 10−43.10 × 10−63.37 × 10−73.85 × 10⁻⁶
Sulfur dioxidekg 3.89 × 10−45.58 × 10−53.51 × 10−64.59 × 10−51.37 × 10−65.60 × 10−77.46 × 10⁻⁵
Sulfur hexafluoridekg 5.66 × 10−170.003.84 × 10−168.11 × 10−154.43 × 10−173.84 × 10−162.91 × 10⁻¹⁶
Sulfur trioxidekg 2.83 × 10−90.003.57 × 10−105.38 × 10−93.38 × 10−117.28 × 10−124.93 × 10⁻¹²
Group NMVOC * to airkg 5.91 × 10−62.72 × 10−52.12 × 10−63.48 × 10−52.72 × 10−68.35 × 10−82.43 × 10⁻⁸
Methanekg 1.42 × 10−45.67 × 10−59.41 × 10−64.98 × 10−51.62 × 10−68.57 × 10−72.54 × 10⁻⁶
Dust (>PM10)kg 2.11 × 10−70.004.56 × 10−88.16 × 10−61.11 × 10−73.47 × 10⁻⁸−8.97 × 10⁻⁷
Dust (PM10)kg 2.90 × 10−54.04 × 10−63.74 × 10−103.80 × 10−81.94 × 10−81.83 × 10−101.80 × 10⁻⁶
Dust (PM2.5–PM10)kg 3.02 × 10−68.68 × 10−72.36 × 10−76.87 × 10−69.40 × 10−86.73 × 10−9−4.85 × 10⁻⁷
Dust (PM2.5)kg 1.21 × 10−70.001.16 × 10−74.32 × 10−61.00 × 10−71.11 × 10−84.54 × 10−8
BODkg 4.48 × 10−68.91 × 10−68.56 × 10−82.32 × 10−66.15 × 10−92.18 × 10−82.10 × 10⁻⁸
CODkg 7.78 × 10−61.69 × 10−52.01 × 10−63.62 × 10−43.28 × 10−73.04 × 10−77.76 × 10⁻⁸
TOCkg 3.23 × 10−100.008.10 × 10−82.40 × 10−73.11 × 10−97.28 × 10⁻¹⁰−1.66 × 10⁻¹⁰
* NMVOC (Non-Methane Volatile Organic Compound).
Table 5. Comparison of 14 category indicator results of apples cultivated through conventional and low-carbon farming.
Impact CategoryUnitCharacterization ResultsRatio
(a/b)
Conventional (a)Low Carbon (b)
Acidificationmol H+-eq1.63 × 10−31.00 × 10−3163%
Climate change, including biogenic carbonkg CO2-eq1.11 × 10−13.99 × 10−32780%
Eco-toxicity freshwaterCTUe9.87 × 10−11.99 × 10−1496%
Eutrophication freshwaterkg P-eq9.90 × 10−51.13 × 10−488%
Eutrophication marinekg N-eq1.54 × 10−41.40 × 10−4110%
Eutrophication terrestrialmol N-eq1.72 × 10−31.45 × 10−3119%
Human toxicity, cancer effectsCTUh4.38 × 10−92.46 × 10−9178%
Human toxicity, non-cancer effectsCTUh1.98 × 10−81.58 × 10−8125%
Ionizing radiation, human healthkBq U235-eq1.58 × 10−34.38 × 10−336%
Land usekg Cdeficit3.63 × 10−27.53 × 10⁻¹⁵%
Particulate matter/Respiratory inorganicskg PM2.5-eq8.30 × 10−55.04 × 10−5165%
Photochemical ozone formationkg C2H4-eq5.32 × 10−44.58 × 10−4116%
Resource depletion waterm3-eq3.66 × 10−41.16 × 10−332%
Resource depletion, mineral, fossilskg Sb-eq4.85 × 10−72.83 × 10−7171%
Note: CTU (comparative toxic unit), PM (particulate matter), Sb (antimony), Bq (Becquerel).
Table 6. Weighting results of apples cultivated through conventional and low-carbon farming.
Impact CategoryUnitWeighting ResultRatio
(a/b)
Conventional (a)Low Carbon (b)
Acidificationpoint1.82 × 10−41.12 × 10−4163%
Climate change, including biogenic carbonpoint2.91 × 10−41.05 × 10−52780%
Eco-toxicity freshwaterpoint4.44 × 10−58.95 × 10−6496%
Eutrophication freshwaterpoint1.72 × 10−41.97 × 10−488%
Eutrophication marinepoint2.34 × 10−52.13 × 10−5110%
Eutrophication terrestrialpoint3.61 × 10−53.04 × 10−5119%
Human toxicity, cancer effectspoint5.02 × 10−42.82 × 10−4178%
Human toxicity, non-cancer effectspoint1.58 × 10−41.26 × 10−4125%
Ionizing radiation, human healthpoint5.74 × 10−51.59 × 10−436%
Land usepoint1.29 × 10−72.68 × 10−65%
Particulate matter/Respiratory inorganicspoint1.96 × 10−41.19 × 10−4165%
Photochemical ozone formationpoint6.25 × 10−55.38 × 10−5116%
Resource depletion waterpoint2.71 × 10−78.58 × 10−732%
Resource depletion, mineral, fossilspoint5.76 × 10−53.36 × 10−5171%
The sum of weighting result (Eco-point)point2.07 × 10−31.17 × 10−3178%
Table 7. Economic assessment of 1 kg of apples cultivated by conventional and low-carbon farming.
Cost ItemsUnitActual CostRatio (a/b)
Conventional (a)Low Carbon (b)
CostOperatingUSD/kg9.65 × 10−11.5960.9%
Inorganic fertilizerUSD/kg2.37 × 10−21.20 × 10−119.7%
Organic fertilizerUSD/kg3.69 × 10−21.09 × 10−133.9%
Crop protection agentUSD/kg1.37 × 10−14.19 × 10−2326.5%
Fuel and energyUSD/kg3.47 × 10−22.74 × 10−2126.6%
Agricultural materialUSD/kg1.25 × 10−11.62 × 10−177.0%
Small farm equipmentUSD/kg3.96 × 10−39.62 × 10−341.2%
Large farm equipmentUSD/kg1.46 × 10−11.46 × 10−1100.0%
Facility depreciationUSD/kg7.40 × 10−27.40 × 10−2100.0%
MaintenanceUSD/kg1.78 × 10−21.78 × 10−2100.0%
Land developmentUSD/kg1.20 × 10−11.20 × 10−1100.0%
Machine rentalUSD/kg1.73 × 10−31.73 × 10−3100%
Land rentalUSD/kg2.18 × 10−22.4 × 10−289.3%
Consigned farmingUSD/kg3.59 × 10−34.98 × 10−10.7%
Labor costUSD/kg2.02 × 10−11.71 × 10−1118.0%
OtherUSD/kg1.59 × 10−25.35 × 10−229.7%
Total cost (c)USD/kg1.933.1760.9%
Selling price (d)USD/kg2.134.1751.1%
Profit (d–c)USD/kg1.99 × 10−19.95 × 10−120.0%
Publisher’s Note: MDPI stays neutral with regard to jurisdictional claims in published maps and institutional affiliations.

