Abstract
Climate change is a significant challenge for the international community. A significant part of addressing this challenge involves informing people about climate change to try and change behavior. Organizations like Technology, Entertainment, and Design (TED) use social media as a means of disseminating information about the complexities of climate science. In this study, we investigate viewers’ responses to 50 TED videos associated with climate change that are posted on YouTube. We elucidate the opinions of both speakers and viewers through sentiment analysis of 59,023 comments and negative binomial regression techniques of viewers’ reactions. The most frequently mentioned keywords are emission, temperature, environment, nature, renewable energy, and economics. The top three emotions evoked by reviewer are trust, fear, and anticipation. The issue of economics is largely responsible for triggering these emotional responses.
1. Introduction
Social media amplifies the ubiquitous dissemination of information over the Internet. YouTube dominates the online sharing of videos through a platform that is driven by users posting their own videos or sharing existing videos [1]. The platform actively encourages viewers to express their views on these videos. Quick and direct feedback is facilitated through buttons on the platform, while viewers can also leave more extensive thoughts and reactions in a free-response comment space below the video content [2]. A number of platforms are globally significant in sharing information through social networks. These include Facebook, YouTube, Twitter, and Instagram. YouTube is of particular significance in displaying a wide variety of user-generated video content to communicate with viewers [3].
Environmental sustainability awareness is one prerequisite for a change in environmental behavior. The use of social media has been increasing exponentially and has changed the way that people access information. Some environmental groups attempt to raise public environmental sustainability awareness through social media sites, such as YouTube [4]. Technology, Entertainment, and Design (TED) is a not-for-profit organization that records presentations from a wide range of speakers and then shares them online. The TED channel posts videos of short speeches that target “people from every discipline and culture who seek a deeper understanding of the world” [5]. A particularly topical and significant issue is climate change, as it relates to global environmental sustainability [6]. Environmental organizations create videos that are posted on social media sites. We can discern viewers’ opinions on climate change by exploring their reactions to such videos.
While the goal of influencing behavior through social media sharing is important, it is unclear how the mechanism works. Few studies evaluate public perceptions of climate change through posts on social media. The present paper attempts to bridge this knowledge gap. Researchers can collect valuable information by analyzing viewers’ reactions through clicks on the videos they view on social media sites. The unstructured data on social media websites (e.g., in comments under videos) can be analyzed by text mining. This approach extracts significant information about customers’ perceptions of a company’s services. Text mining can handle large volumes of data using such approaches as pattern identification [7].
Counting models have been variously proposed in, amongst other areas, purchase frequency [8], dental epidemiology [9], and hospital visits [10]. Count data are traditionally handled by the Poisson model, in which the variance equals the mean. Over-dispersed count data are usually treated through the use of a negative binomial model [11]. Following the rationale of this approach, we propose a hierarchical negative binomial regression model for predicting users’ evaluations (the difference between like or dislike) and reactions in the semantic features (the differences in positive and negative perceptions) of TED videos posted on YouTube.
2. Related Work
2.1. Social Media and Public Engagement with Climate Change
Public engagement is an important part of combatting climate change. By identifying and changing the specifics of people’s behavior, it is possible to have a positive impact on climate change. There is a clear relationship between what people think and feel—and then do—about climate change. Engagement with climate change reflects an evaluation of the response to climate change, which is comprised of cognitive (thoughts), emotional (feelings), and behavioral (actions) components [12].
Social media provides an opportunity for the some public groups to share opinions and engage with climate change issues [13]. Feygina et al. [14] found that promoting climate change through public media enhances public engagement. Cody et al. [15] used sentiment measurement (Hedonometer) to determine responses to climate change news, events, and natural disasters being shared on Twitter. Uldam and Askanius [16] studied YouTube comments relating to issues raised by the UN COP15 climate conference to understand viewers’ attitudes toward politics and political engagement. Shapiro and Park [17] used network structures to make comparisons between video discussion networks, and found co-comments across multiple video discussions.
2.2. Opinion Mining
Opinions influence not only the behavior of the person expressing the opinion, but also others’ decisions. Opinion leaders can serve as role models who convince their followers to respond or act [18]. Developments of information technology and associated social media networks enable opinion leaders to reach a large audience. Understanding how viewers’ reactions influence others’ opinions is of significant interest [19].
Opinion mining (also called sentiment analysis) is defined as the extraction of valuable knowledge from textual data [20]. Various researchers have applied opinion mining to social media data, such on Facebook and Twitter [21,22]. For example, Mostafa [23] evaluated consumers’ attitudes using their sentiments (positive or negative) toward tweets about well-known brands. In a sentiment analysis, Oksanen et al. [24] elucidated viewers’ emotional reactions to pro-anorexia and anti-anorexia content posted on YouTube. Öztürk and Ayvaz [25] evaluated Twitter posts about the Syrian refugee crisis using sentiment analysis. Ordinary least-squares regression models reveal that video background information is more significantly associated with positive, rather than negative, sentiments. Meire et al. [26] reported a sentiment prediction model using the leading information, lagging information, and traditional post variables of soccer teams’ Facebook posts. Tudoran [27] determined consumers’ opinions in a sentiment analysis of ad-blocking behavior.
Climate change is a global problem that demands universal efforts to protect the environment. In a non-computational sentiment analysis, Jost et al. [28] investigated the climate-related changes in different communities. Their results show that positive sentiments prevail over negative sentiments in terms of transitions of these communities from their current development trajectories.
3. Research Method
3.1. Sample
By inserting the keywords “climate change” and “TED” into YouTube, we retrieved 50 videos (each with more than 100 comments) posted before 14 June 2019 (Appendix A, Table A1). We collected the video contents as well as the viewer responses (likes and comments). Table 1 shows the attributes of the selected videos in each year from 2007 to 2019.

Table 1.
Statistical attributes of the selected videos.
3.2. Data Processing
Social media provides a platform for information sharing about user-generated content (UGC). Content creators use context data to produce engaging content. We set speakers’ dominant keywords in the TED climate change videos as our independent variable. Viewers’ engagement behavior is represented by the “like” or “dislike” clicking frequency and comments [29]. Two dependent variables were evaluated. One is the difference between likes and dislikes. The other is the difference between positive and negative sentiment states (identified from comments). In terms of the antecedents of viewers’ responses, the speakers’ content keywords were treated as independent variables.
In the first stage of data processing, we analyzed both the speakers’ narratives and viewers’ comments. Our sentiment analysis model was carried out using the “tm” [30] and “Rweka” [31] packages in R. After loading the libraries, we analyzed the documents containing the sentimental terms (anger, anticipation, disgust, fear, joy, sadness, surprise, trust, negative perception, and positive perception) in order to construct word clouds of the 50 selected videos and associated comments (59,023). The “tidy text” [32] package in R includes a dataset called “sentiments”, which provides several distinct lexicons (dictionaries of words assigned to sentiment categories or values).
The hierarchical negative binomial regression (NBR) was performed by using a Markov chain Monte Carlo algorithm, namely the “rhierNegbinRw” algorithm in the R package “bayesm”. The parameters were optimized by using the Metropolis–Hastings algorithm, which sequentially generates random samples from a probability distribution [33]. We also evaluated the difference between the high and low sentimental states (positive and negative) of the comments in the hierarchical negative binomial regression. Figure 1 shows our data analysis framework.
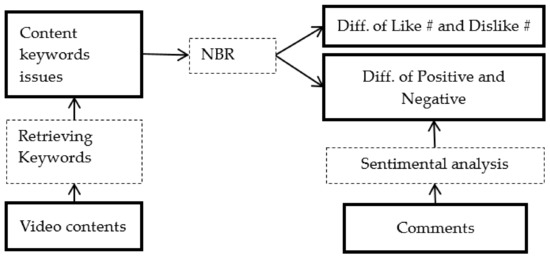
Figure 1.
Data analysis framework (note: NBR: negative binomial regression).
3.3. The Hierarchical Negative Binomial Regression Model
The Poisson regression model describes a fundamental random process, in which a certain number of events occur with a certain probability within a fixed time interval. Suppose that yi is the ith count response variable in an interval of length . Its Poisson distribution is expressed as , where is the mean yi in . In a time-independent Poisson distribution, is set to 1.0. The Poisson model is characterized by identical values of the mean and variance. In practice, the Poisson model is useful for describing the mean, but underestimates the variance in the data. Moreover, the Poisson regression model is not suitable for all applications [34]. Over-dispersion (in which the variance exceeds the mean) biases the parameter estimates and causes failure of the conditional independence problem [35].
We propose a fully parametric method, the negative binomial distribution (NBD), as a variation of the standard Poisson regression model to account for over-dispersed count data. The traditional NBD model is a mixed Poisson–gamma model that replaces the gamma prior with a shape parameter α and a scale parameter on such that and [36]. The probability of this distribution is given by Equation (1):
where α is the nonnegative dispersion parameter, is the probability parameter, and Γ is the gamma function. As α tends to infinity, the NBD approaches the Poisson distribution. The mean is and the variance is Because the variance is larger than the mean, it is usually favored over the Poisson distribution for modeling over-dispersed count data.
4. Results
4.1. Speaker Content Text Analysis
A word cloud was used to represent the keywords drawn from the video captions (Figure 2). The results show speakers persuading viewers to take an action immediately. The top 10 noun keywords appearing in the speakers’ contents are climate, people, word, energy, carbon, warming, plant, emissions, atmosphere, and water. We further use the n-gram, a computational linguistics tool, to evaluate contiguous sequence text as n terms (Figure 3 and Figure 4). The results of bigrams and trigrams show that sea level, global warming, carbon dioxide, fossil fuels, solar panels, and greenhouse gas/gases are most frequently mentioned by speakers. Figure 5 shows the linkages among the speakers’ keywords. For example, the word climate usually accompanies the words change, scientist, and system, while the word emissions is commonly mentioned with carbon, dioxide, and gas. The word gas links with greenhouse. The word ice associates with sea, level, and sheet. The common keyword analysis shows that speakers’ issues cluster around the topics of emission, temperature, environment, nature, renewable energy, and economics (Table 2). Out of the 50 selected videos, the most mentioned topic relates to emissions. The correlation plot, according to the Pearson correlation coefficient, shows that speakers’ contents containing the “emission” issue were usually discussed with the “nature” and “renewable energy” issues (Figure 6).
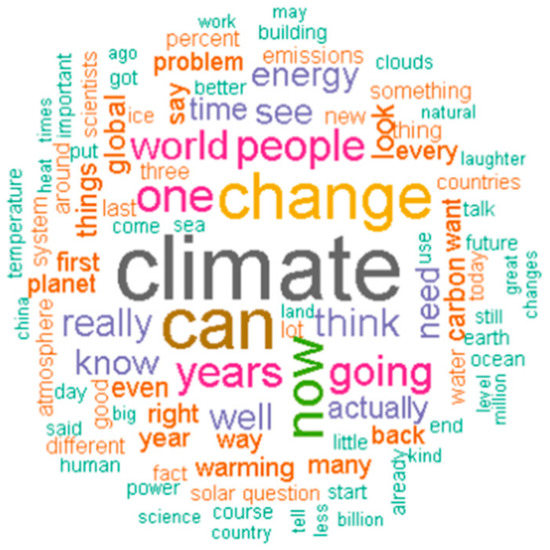
Figure 2.
Word cloud relating to the contents of the 50 videos.
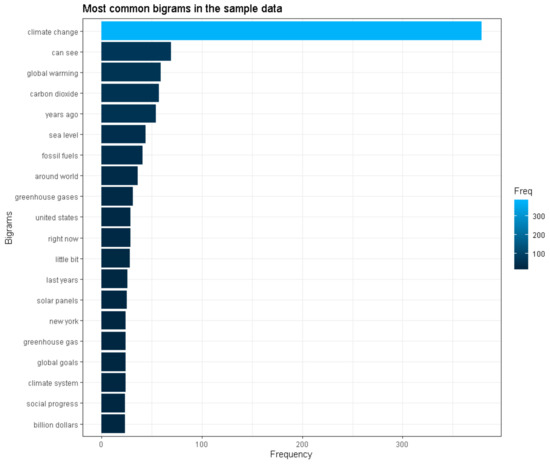
Figure 3.
The most common bigrams in the sample data.
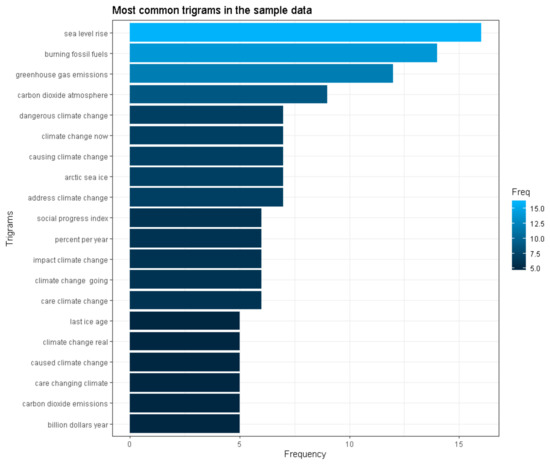
Figure 4.
The most common trigrams in the sample data.
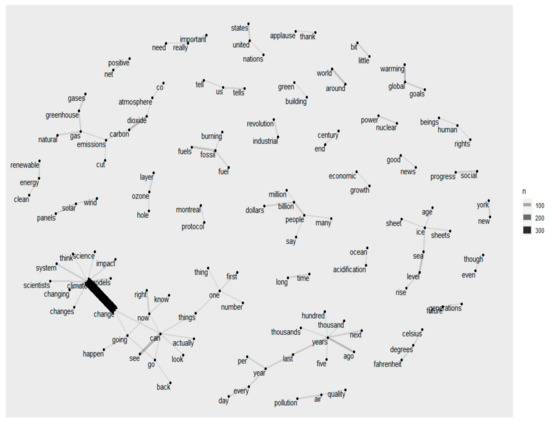
Figure 5.
Word network plot of speakers’ contents using words occurring more than 10 times.
Table 2.
Speakers’ content issues and their correlated keywords.
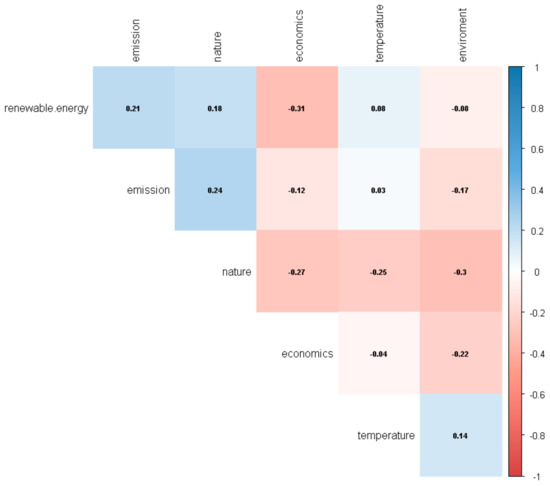
Figure 6.
The correlation plot of hot topics.
4.2. Viewer Sentiment Response
Figure 7 shows the sentimental state of the comments in terms of anger, anticipation, disgust, fear, joy, sadness, surprise, and trust. The sentiment analysis of the viewers’ complete comments reveals an overall positive attitude toward video contents relating to climate change (Figure 8). Trust, fear, and anticipation are the top three emotions that viewers express (Figure 7 and Table 3). The circus plots in Figure 9 and Figure 10 relate the sentiment data to the speakers’ issues. Users refer to trust, fear, and anticipation more frequently for all issues (Appendix A, Table A2). The emotional comments of trust, fear, and anticipation were related to the emission and nature issues. All comments relate more to positive than negative emotions. The top three elements recalled by viewers are nature, renewable energy, and emission (Appendix A, Table A3).
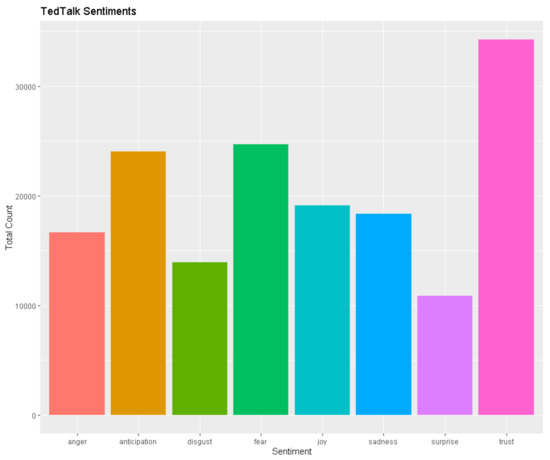
Figure 7.
The emotional sentiment scores of the viewers’ comments.
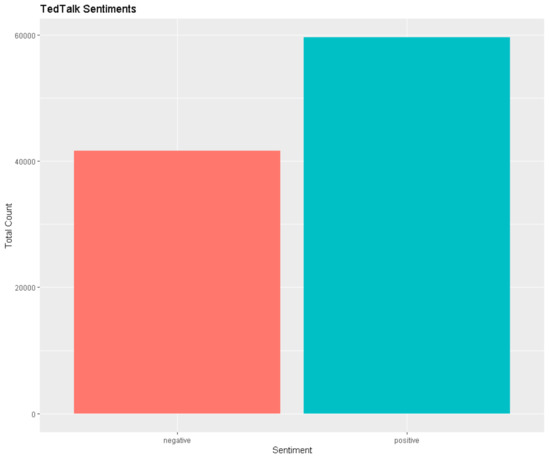
Figure 8.
Positive and negative sentiment scores relating to viewers’ comments.
Table 3.
Sentiment analysis scores summed over all selected videos.
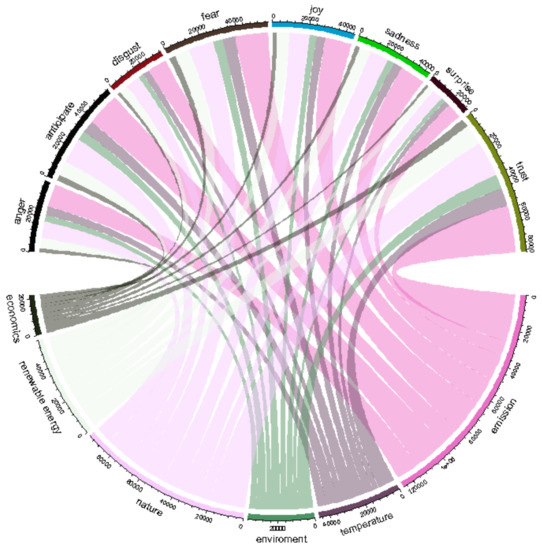
Figure 9.
Circus plot of sentiments in video comments versus issues.
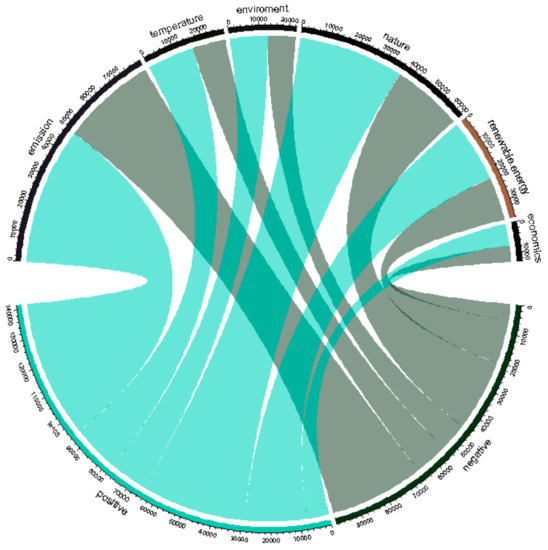
Figure 10.
Circus plot of positive and negative sentiments versus issues.
4.3. Negative Binomial Regression Model
A negative binomial regression model simulates hierarchically. The estimates emerge after 1000 iterations. There are seven words from the climate change videos that lead viewers to click either like or dislike. The associated sentimental reactions (the difference between positive and negative) were simulated in the R package bayesm.
We inferred the posterior parameters from the average values of the final 20% of the 1000 iterations. The retrieved keyword issue data were expressed in binary form (1 = appeared and 0 = did not appear). Table 4 shows the effects of the difference between the like and the dislike frequencies as the predictors, and Figure 11 presents the same analysis in boxplots. The top three keyword topics that influenced the like frequencies are economics (eβ = e4.737 = 114.1), environment (eβ = e3.719 = 41.2), and temperature (eβ = e3.638 = 38.0) (Table 4 and Figure 11).
Table 4.
The 95% confidence intervals of the influential parameters of the difference between like and dislike (n = 50).
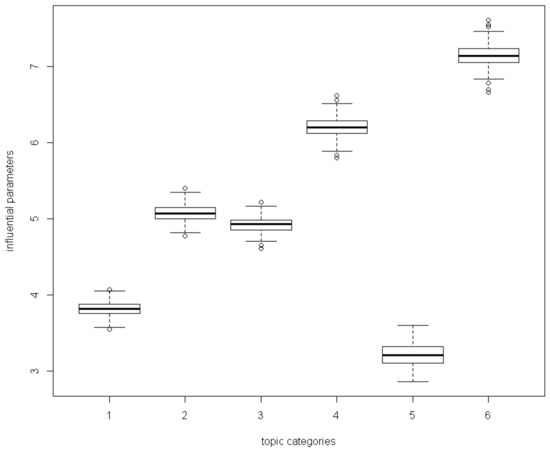
Figure 11.
Boxplot of the influential parameters of the difference between likes and dislikes on climate change videos (note: 1 = emission; 2 = temperature; 3 = environment; 4 = nature; 5 = renewable energy; 6 = economics).
Based on the sentiment responses (positive or negative), the dependent variable is defined as the difference between the positive and negative values (i.e., positive value–negative value). The same hierarchical NBR simulation was used to predict the keywords in the speakers’ content. The top three keyword topics that influenced the like frequencies are economics (eβ = e4.737 = 114.1), environment (eβ = e3.719 = 41.2), and temperature (eβ = e3.638 = 38.0) (Table 5 and Figure 12).
Table 5.
The 95% confidence intervals of the influential parameters of the difference between like and dislike (n = 50).
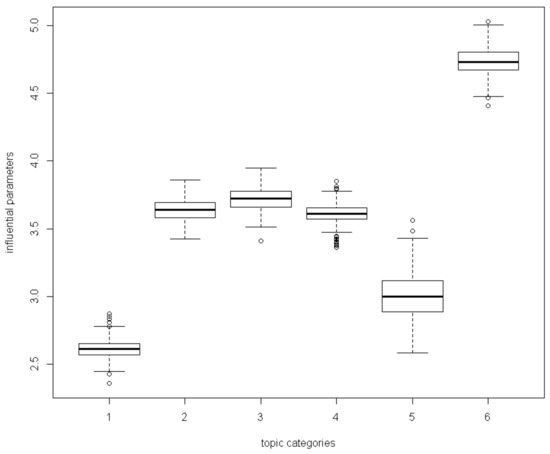
Figure 12.
Boxplot of the influential parameters of the difference between positive and negative likes on climate change videos (note: 1 = emission; 2 = temperature; 3 = environment; 4 = nature; 5 = renewable energy; 6 = economics).
5. Discussion and Conclusions
Climate change involves global warming. Many studies in the literature have discussed the related topics [37]. The increase of Internet users is an opportunity to change public environmental sustainability awareness globally. However, the research dealing with social media data is still very limited.
The sentiment analysis revealed that viewers of climate change videos trust the contents. This points towards TED acting as a powerful tool for the global dissemination of knowledge related to climate change.
There is little research on the association between video contents and viewers’ reactions. Our research has significant implications for understanding the relationship between speakers and reviewers of TED videos. The keywords in the speakers’ contents reveal current trends in climate change. The results show that emissions are a dominant issue in TED videos. Although people need power for convenience and economic growth, there is a demand for the development of carbon-free technology. Therefore, the development of green technologies must be balanced with this demand for power. Since water is an essential element for life, we are duty-bound to reduce our atmospheric carbon emissions in order to prevent particulate adsorption into our water supply. Climate change increases the Earth’s temperature and thus changes global ecosystems. To avoid this imminent threat, governments worldwide must coordinate their energy policies.
The United Nations Framework Convention on Climate Change (UNFCCC) identifies two principal strategies for managing climate change risks—mitigation and adaptation [38]. Learning how to adapt to and mitigate the risk of climate change includes such approaches as renewable energy or developing green technologies [39]. The keyword results for the content show that TED videos focus predominantly on mitigation. Further studies could consider how to provide information on the different facets of adaptation to a changing climate.
Overall, positive emotions are higher than negative emotions with respect to the videos’ contents. The results indicate that while reviewers fear the effects of the climate change, they anticipate steps to mitigate this problem.
The results of the hierarchical negative binomial regression (NBD) indicate viewers’ concerns about climate change issues. The first dependent variable (the difference between likes and dislikes) represents reviewers’ thoughts (cognition). The second dependent variable is the difference between the viewers’ positive and negative feelings (emotion). Most of the cognitive responses relate to economics and nature. The majority of emotional responses are associated with economics and the environment. Stern [40] discussed the effect of global warming on the world economy. An early reaction of public policy to avoid climate change impacts is more important than doing nothing. Every individual can contribute to avoiding climate change.
This research provides a tool for measuring the performances of TED videos relating to climate change that are posted on YouTube. In previous social media studies, researchers focused on viewers’ opinions [23,24,25]. However, the media content is also one important issue affecting viewers’ engagement [41]. We evaluate both the speakers’ content and reviewers’ reactions. The patterns in the speakers’ content were deduced by keyword-retrieval techniques, while the viewers’ comments were analyzed using a sentiment analysis. The NBD simulates the relationship between speakers’ content and viewers’ responses (numbers of likes and dislikes as well as the sentiment analysis scores). Using this model, climate change experts could refine the contents of their presentations to target a specific audience of viewers.
6. Limitations and Further Work
The explosion of social media sites, such as Facebook and Twitter, has great potential in the dissemination of sustainability awareness [42]. This study only considered YouTube viewers. Different social media users’ responses toward climate change issues could also be evaluated in further work.
Climate change is a global matter. People with different cultures have different opinions. The sample only collected English-speaking videos from TED. A cross-cultural evaluation across various social media sites is suggested [13]. It would be useful to compare the opinions of people in different countries or generations towards engagement with climate change problems.
Numerous studies have confirmed that behavioral change may be caused by activities with the objective of raising awareness [5,43]. This suggests that further research could evaluate how reviewers take responsibility for the effects of climate change after watching videos.
The NBD model was implemented in evaluating the count data in this research. Another variant of regression, such as multiple linear regression analysis [44], could be used for continuous dependent variables. The application of the Internet of Things IoT technique for website interaction evaluation is a further trend [45,46]. The use of eye-tracking techniques or facial recognition for understanding viewers’ reactions and content comprehension can be implemented in further research.
Funding
This research received no external funding.
Conflicts of Interest
The author declares no conflict of interest.
Appendix A
Table A1.
List of the analyzed videos.
Table A1.
List of the analyzed videos.
| Case | Title | Year | Speaker | Viewers | Comments (No.) |
|---|---|---|---|---|---|
| 1 | Why Climate Change Is a Threat to Human Rights | 2015 | Mary Robinson | 76,874 | 360 |
| 2 | How to green the world’s deserts and reverse climate change | 2013 | Allan Savory | 3,185,698 | 11,573 |
| 3 | Innovating to zero! | 2010 | Bill Gates | 2,133,376 | 4800 |
| 4 | School strike for climate—save the world by changing the rules | 2018 | Greta Thunberg | 1,400,488 | 3980 |
| 5 | Why renewables can’t save the planet | 2019 | Michael Shellenberger | 954,927 | 8592 |
| 6 | How We Can Make the World a Better Place by 2030 | 2015 | Michael Green | 601,969 | 621 |
| 7 | Climate change: Earth’s giant of Tetris | 2014 | Joss Fong | 468,836 | 378 |
| 8 | The reality of climate change | 2014 | David Puttnam | 441,425 | 2826 |
| 9 | Can wildlife adapt to climate change? | 2016 | Erin Eastwood | 396,526 | 460 |
| 10 | Why I don’t care about ‘Climate Change | 2014 | David Saddington | 380,398 | 1338 |
| 11 | How will we survive when the population hits 10 billion? | 2018 | Charles C. Mann | 598,652 | 2874 |
| 12 | Why I must speak out about climate change | 2012 | James Hansen | 261,191 | 2596 |
| 13 | A simple and smart way to fix climate change | 2014 | Dan Miller | 242,889 | 1371 |
| 14 | Global priorities bigger than climate change | 2007 | Bjorn Lomborg | 240,437 | 842 |
| 15 | The case for optimism on climate change | 2016 | Al Gore | 229,014 | 1047 |
| 16 | Can we stop climate change by removing CO2 from the air? | 2017 | Tim Kruger | 185,667 | 1245 |
| 17 | A Creative Approach To Climate Change | 2017 | Finnegan Harries | 159,141 | 142 |
| 18 | Demystifying Three Climate Lies—The Road to Decarbonization | 2016 | Thomas Stocker | 154,411 | 878 |
| 19 | Climate Change: Fact And Fiction | 2011 | Bruce Wielicki | 150,376 | 551 |
| 20 | The inside story of the Paris climate agreement | 2016 | Christiana Figueres | 125,951 | 415 |
| 21 | The emergent patterns of climate change | 2014 | Gavin Schmidt | 125,483 | 351 |
| 22 | Cloudy climate change: How clouds affect Earth’s temperature | 2014 | Jasper Kirkby | 123,188 | 141 |
| 23 | Cows, Carbon, and Climate | 2016 | Joel Salatin | 121,806 | 247 |
| 24 | How China is (and isn’t) fighting pollution and climate change | 2018 | Angel Hsu | 113,811 | 635 |
| 25 | Why the Arctic is climate change’s canary in the coal mine | 2015 | William Chapman | 113,288 | 117 |
| 26 | A climate solution where all sides can win | 2017 | Ted Halstead | 109,771 | 688 |
| 27 | We need nuclear power to solve climate change | 2016 | Joe Lassiter | 107,128 | 1127 |
| 28 | Climate Change Is Happening. Here’s How We Adapt | 2015 | Alice Bows-Larkin | 102,467 | 589 |
| 29 | The most important thing you can do to fight climate change: talk about it | 2019 | Katharine Hayhoe | 96,102 | 679 |
| 30 | Can we solve global warming? Lessons from how we protected the ozone layer | 2019 | Sean Davis | 78,414 | 514 |
| 31 | How empowering women and girls can help stop global warming | 2019 | Katharine Wilkinson | 73,875 | 216 |
| 32 | A surprising idea for “solving” climate change | 2017 | David Keith | 72,438 | 426 |
| 33 | The state of the climate—and what we might do about it | 2014 | Nicholas Stern | 71,251 | 107 |
| 34 | Forget climate Apocalypse. There’s hope for our warming planet | 2016 | Jelmer Mommers | 131,367 | 607 |
| 35 | Slaying the “zombies” of climate science | 2013 | Dr. Marshall Shepherd | 64,425 | 779 |
| 36 | What if climate change is real? | 2015 | Katharine Hayhoe | 62,750 | 462 |
| 37 | A provocative way to finance the fight against climate change | 2016 | Michael Metcalfe | 59,296 | 487 |
| 38 | The three myths of climate change | 2017 | Linda Mortsch | 50,069 | 151 |
| 39 | How pollution is changing the ocean’s chemistry | 2017 | Triona Joanne Chory | 81,203 | 312 |
| 40 | How supercharged plants could slow climate change | 2019 | Joanne Chory | 40,387 | 450 |
| 41 | Let’s prepare for our new climate | 2012 | Vicki Arroyo | 76,056 | 355 |
| 42 | Climate Change Is Simple | 2012 | David Roberts | 73,124 | 331 |
| 43 | Volcanoes: A Forge for Climate Change | 2015 | Peter Ward | 32,428 | 108 |
| 44 | How the military fights climate change | 2017 | David Titley | 57,250 | 153 |
| 45 | Can clouds buy us more time to solve climate change? | 2017 | Kate Marvel | 55,058 | 291 |
| 46 | The Personal Responsibility Vortex | 2012 | Bret Weinstein | 51,831 | 149 |
| 47 | Climate Change: Simple, Serious, Solvable | 2018 | James Rae | 26,472 | 145 |
| 48 | My Country Will Be Underwater Soon—Unless We Work Together | 2015 | Anote Tong | 42,268 | 223 |
| 49 | Climate Change: Why you should be angry and why anger isn’t enough | 2013 | John Ashton | 37,698 | 738 |
| 50 | A Look Into Our Climate: Past To Present To Future | 2011 | Michael Mann | 37,623 | 556 |
Table A2.
Results of the sentiment analysis.
Table A2.
Results of the sentiment analysis.
| Sentiment | Anger (Odds Ratio) | Anticipate (Odds Ratio) | Disgust (Odds Ratio) | Fear (Odds Ratio) | Joy (Odds Ratio) | Sadness (Odds Ratio) | Surprise (Odds Ratio) | Trust (Odds Ratio) | |
|---|---|---|---|---|---|---|---|---|---|
| Issues | |||||||||
| emission | 12,897 (0.482) | 18,838 (0.704) | 11,055 (0.413) | 18,785 (0.702) | 15,014 (0.561) | 14,267 (0.533) | 8521 (0.381) | 26,772 (1.000) | |
| temperature | 4957 (0.497) | 6870 (0.689) | 3708 (0.372) | 7067 (0.709) | 5070 (0.508) | 4940 (0.495) | 3116 (0.313) | 9971 (1.000) | |
| environment | 3836 (0.468) | 5468 (0.667) | 2964 (0.361) | 5520 (0.673) | 3853 (0.470) | 3868 (0.472) | 2467 (0.301) | 8203 (1.000) | |
| nature | 9492 (0.472) | 14,299 (0.712) | 8393 (0.418) | 14,257 (0.709) | 11,463 (0.570) | 10,784 (0.537) | 6350 (0.316) | 20,095 (1.000) | |
| renewable energy | 5701 (0.496) | 8387 (0.730) | 4954 (0.431) | 8474 (0.738) | 6914 (0.602) | 6627 (0.577) | 3734 (0.325) | 11,486 (1.000) | |
| economics | 2340 (0.491) | 3243 (0.680) | 1726 (0.362) | 3513 (0.737) | 2576 (0.540) | 2406 (0.505) | 1500 (0.315) | 4768 (1.000) | |
Table A3.
Results of the positive and negative sentiment analysis.
Table A3.
Results of the positive and negative sentiment analysis.
| Sentiment | Negative (Odds Ratio) | Positive (Odds Ratio) | |
|---|---|---|---|
| Issues | |||
| emission | 32,557 (0.690) | 47,158 (1) | |
| temperature | 11,606 (0.717) | 16,176 (1) | |
| environment | 9654 (0.745) | 12,966 (1) | |
| nature | 24,498 (0.676) | 36,243 (1) | |
| renewable energy | 14,886 (0.695) | 21,432 (1) | |
| economics | 5579 (0.741) | 7533 (1) | |
References
- Khan, M.L. Social media engagement: What motivates user participation and consumption on YouTube? Comput. Hum. Behav. 2017, 66, 236–247. [Google Scholar] [CrossRef]
- Liikkanen, L.A.; Salovaara, A. Music on YouTube: User engagement with traditional, user-appropriated and derivative videos. Comput. Hum. Behav. 2015, 50, 108–124. [Google Scholar] [CrossRef]
- Bärtl, M. YouTube channels, uploads and views: A statistical analysis of the past 10 years. Convergence 2018, 24, 16–32. [Google Scholar] [CrossRef]
- Hamid, S.; Ijab, M.T.; Sulaiman, H.; Anwar, R.M.; Norman, A.A. Social media for environmental sustainability awareness in higher education. Int. J. Sustain. High. Educ. 2017, 18, 474–491. [Google Scholar] [CrossRef]
- Swaim, J.A.; Maloni, M.J.; Napshin, S.A.; Henley, A.B. Influences on student intention and behavior toward environmental sustainability. J. Bus. Ethics 2014, 124, 465–484. [Google Scholar] [CrossRef]
- Adger, W.N.; Arnell, N.W.; Tompkins, E.L. Successful adaptation to climate change across scales. Glob. Environ. Chang. 2005, 15, 77–86. [Google Scholar] [CrossRef]
- Froelich, J.; Ananyan, S.; Olson, D.L. Business intelligence through text mining. Bus. Int. J. 2005, 10, 43–50. [Google Scholar]
- Jen, L.; Chou, C.H.; Allenby, G.M. A Bayesian approach to modeling purchase frequency. Mark. Lett. 2003, 14, 5–20. [Google Scholar] [CrossRef]
- Böhning, D.; Dietz, E.; Schlattmann, P.; Mendonça, L.; Kirchner, U. The zero-inflated Poisson model and the decayed, missing and filled teeth index in dental epidemiology. J. R. Stat. Soc. Ser. A Stat. Soc. 1999, 162, 195–209. [Google Scholar] [CrossRef]
- Greene, W. Functional forms for the negative binomial model for count data. Econ. Lett. 2008, 99, 585–590. [Google Scholar] [CrossRef]
- Hilbe, J. Negative Binomial Regression; Cambridge University Press: Cambridge, MA, USA, 2007. [Google Scholar]
- Lorenzoni, I.; Nicholson-Cole, S.; Whitmarsh, L. Barriers perceived to engaging with climate change among the UK public and their policy implications. Glob. Environ. Chang. 2007, 17, 445–459. [Google Scholar] [CrossRef]
- Wolf, J.; Moser, S.C. Individual understandings, perceptions, and engagement with climate change: Insights from in-depth studies across the world. Wiley Interdiscip. Rev. Clim. Chang. 2011, 2, 547–569. [Google Scholar] [CrossRef]
- Feygina, I.; Myers, T.; Placky, B.; Sublette, S.; Souza, T.; Toohey-Morales, J.; Maibach, E.W. Localized climate reporting by TV weathercasters enhances public understanding of climate change as a local problem: Evidence from a randomized controlled experiment. Bull. Am. Meteorol. Soc. 2020, 10, 1092–1100. [Google Scholar] [CrossRef]
- Cody, E.M.; Reagan, A.J.; Mitchell, L.; Dodds, P.S.; Danforth, C.M. Climate change sentiment on Twitter: An unsolicited public opinion poll. PLoS ONE 2015, 10, e0136092. [Google Scholar] [CrossRef] [PubMed]
- Uldam, J.; Askanius, T. Online civic cultures? Debating climate change activism on YouTube. Int. J. Commun. 2013, 7, 1185–1204. [Google Scholar]
- Shapiro, M.A.; Park, H.W. Climate change and YouTube: Deliberation potential in post-video discussions. Environ. Commun. 2018, 12, 115–131. [Google Scholar] [CrossRef]
- Nisbet, M.C.; Kotcher, J.E. A two-step flow of influence? Opinion-leader campaigns on climate change. Sci. Commun. 2009, 30, 328–354. [Google Scholar] [CrossRef]
- Marti, S.; Garcia-Molina, H. Taxonomy of trust: Categorizing P2P reputation systems. Comput. Netw. 2006, 50, 472–484. [Google Scholar] [CrossRef]
- Montoyo, A.; MartíNez-Barco, P.; Balahur, A. Subjectivity and sentiment analysis: An overview of the current state of the area and envisaged developments. Decis. Support Syst. 2012, 53, 675–679. [Google Scholar] [CrossRef]
- Anastasiei, B.; Dospinescu, N. Facebook advertising: Relationship between types of message, brand attitude and perceived buying risk. Ann. Univ. Craiova 2017, 1, 18–26. [Google Scholar]
- Anastasiei, B.; Dospinescu, N. Paid product review in social media—Are they effective? In Proceedings of the 34th International Business Information Management Association Conference, Madrid, Spain, 13–14 November 2019. [Google Scholar]
- Mostafa, M.M. More than words: Social networks’ text mining for consumer brand sentiments. Expert Syst. Appl. 2013, 40, 4241–4251. [Google Scholar] [CrossRef]
- Oksanen, A.; Garcia, D.; Sirola, A.; Näsi, M.; Kaakinen, M.; Keipi, T.; Räsänen, P. Pro-anorexia and anti-pro-anorexia videos on YouTube: Sentiment analysis of user responses. J. Med. Internet Res. 2015, 17, 256. [Google Scholar] [CrossRef] [PubMed]
- Öztürk, N.; Ayvaz, S. Sentiment Analysis on Twitter: A Text Mining Approach to the Syrian Refugee Crisis. Telemat. Inform. 2018, 35, 136–147. [Google Scholar] [CrossRef]
- Meire, M.; Ballings, M.; Van den Poel, D. The added value of auxiliary data in sentiment analysis of Facebook posts. Decis. Support Syst. 2016, 89, 98–112. [Google Scholar] [CrossRef]
- Tudoran, A.A. Why do internet consumers block ads? New evidence from consumer opinion mining and sentiment analysis. Internet Res. 2019, 29, 144–166. [Google Scholar] [CrossRef]
- Jost, F.; Dale, A.; Schwebel, S. How positive is “change” in climate change? A sentiment analysis. Environ. Sci. Policy 2019, 96, 27–36. [Google Scholar] [CrossRef]
- Wan, J.; Lu, Y.; Wang, B.; Zhao, L. How attachment influences users’ willingness to donate to content creators in social media: A socio-technical systems perspective. Inf. Manag. 2017, 54, 837–850. [Google Scholar] [CrossRef]
- Feinerer, I.; Hornik, K.; Meyer, D. Text Mining Infrastructure in R. J. Stat. Softw. 2008, 25, 1–54. [Google Scholar] [CrossRef]
- Hornik, K.; Buchta, C.; Zeileis, A. Open-source machine learning: R meets Weka. Comput. Stat. 2009, 24, 225–232. [Google Scholar] [CrossRef]
- Silge, J.; Robinson, D. tidytext: Text mining and analysis using tidy data principles in R. J. Open Source Softw. Process. 2016, 1, 37. [Google Scholar] [CrossRef]
- Rossi, P.E.; Allenby, G.M.; McCulloch, R. Bayesian Statistics and Marketing; John Wiley & Sons: Chichester, UK, 2012. [Google Scholar]
- Hahn, E.D. Bayesian Methods for Management and Business: Pragmatic Solutions for Real Problems; John Wiley & Sons: Hoboken, NJ, USA, 2014. [Google Scholar]
- Gurmu, S.; Trivedi, P.K. Excess zeros in count models for recreational trips. J. Bus. Econ. Stat. 1996, 14, 469–477. [Google Scholar]
- Cameron, A.C.; Trivedi, P.K. Econometric models based on count data. Comparisons and applications of some estimators and tests. J. Appl. Econ. 1986, 1, 29–53. [Google Scholar] [CrossRef]
- Trexler, A.; Johns-Putra, A. Climate change in literature and literary criticism. Wiley Interdiscip. Rev. Clim. Chang. 2011, 2, 185–200. [Google Scholar] [CrossRef]
- United Nations. General Assembly. United Nations Framework Convention on Climate Change: Text. UNEP/WMO Information Unit on Climate Change; United Nations: New York, NY, USA, 1992. [Google Scholar]
- Anderson, A. Climate change education for mitigation and adaptation. Int. J. Educ. Dev. 2012, 6, 191–206. [Google Scholar] [CrossRef]
- Stern, N.H. Stern Review: The Economics of Climate Change; Cambridge University Press: Cambridge, UK, 2006; Volume 30, p. 2006. [Google Scholar]
- Jaakonmäki, R.; Müller, O.; Vom Brocke, J. The impact of content, context, and creator on user engagement in social media marketing. In Proceedings of the 50th Hawaii International Conference on System Sciences, Wailoloa, HI, USA, 4–7 January 2017. [Google Scholar]
- Li, Q.; Wei, W.; Xiong, N.; Feng, D.; Ye, X.; Jiang, Y. Social media research, human behavior, and sustainable society. Sustainability 2017, 9, 384. [Google Scholar] [CrossRef]
- Moser, S.C.; Dilling, L. Making climate hot. Environ. Sci. Policy Sustain. Dev. 2004, 46, 32–46. [Google Scholar] [CrossRef]
- Dospinescu, O.; Anastasiei, B.; Dospinescu, N. Key factors determining the expected benefit of customers when using bank cards: An analysis on millennials and generation Z in Romania. Symmetry 2019, 11, 1449. [Google Scholar] [CrossRef]
- Dospinescu, O.; Percă-Robu, A.E. The analysis of e-commerce sites with eye-tracking technologies. BRAIN Broad Res. Artif. Intell Neurosci. 2017, 8, 85–100. [Google Scholar]
- Dospinescu, O.; Popa, I. Face Detection and Face Recognition in Android Mobile Applications. Inform. Econ. 2016, 20, 20–28. [Google Scholar] [CrossRef]


Publisher’s Note: MDPI stays neutral with regard to jurisdictional claims in published maps and institutional affiliations. |
© 2020 by the author. Licensee MDPI, Basel, Switzerland. This article is an open access article distributed under the terms and conditions of the Creative Commons Attribution (CC BY) license (http://creativecommons.org/licenses/by/4.0/).