How the Covid-19 Pandemic Is Changing Online Food Shopping Human Behaviour in Italy


Abstract
1. Introduction: Research Background
2. Extant Gaps and Research Aim
3. Theoretical Frameworks and Related Literature Review
- perceived social norms that, in line with the theory of planned behaviour proposed by Reference [34], refer to the influence that relatives and friends have in choosing to adopt online food shopping;
- perceived complexity which refers to the degree of difficulty perceived by online food shoppers both with reference to the acquisition of information and the ease of use of the technology to complete the online transaction process;
- perceived compatibility which refers to the perception degree that online grocery shopping is compatible with past lifestyle and personal values;
- perceived relative advantage refers to consumers’ perception of the potential offered by online shopping compared to traditional purchase channels;
- perceived risk refers to the degree of perception of the risks connected to the online process and linked to both the payment method and the quality of the product delivered.
4. Materials and Methods
4.1. Data Description
- demographic data, included age, gender, place of living, household composition, level of education and income [45];
4.2. Methods
- Lipztig test [57]; data are divided into g groups of equal size based on an ordinal response score, calculated by summing the predicted probabilities of each subject for each level of outcome multiplied by equally spaced integer weights. From this partitioning of data, we derive I dummy variables such that, for each group, if the subject is in region g, otherwise . We, then, re-fit the model including these dummy variables: the model has a good fit if the coefficients for all these dummy variables will simultaneously be equal to 0. We indicate with and the log likelihoods of the fitted models with and without the dummy variables, respectively. The Lipsitz test statistic is the likelihood ratio statistic . A p-value is obtained by comparing the observed value of the test statistic with the distribution with degrees of freedom.
- Hosmer-Lemeshow test [58]; it compares observed with expected frequencies of the outcome and computes a test statistic which is distributed according to the distribution. The degrees of freedom depend upon the number of quantiles used and the number of outcome categories. A non-significant p-value indicates that there is no evidence that the observed and expected frequencies differ and this is an evidence of goodness of fit.
- Pulkstenis-Robinson tests [59]; these tests can be used for models with continuous and categorical predictors. The first step is to determine the covariate patterns using only the categorical predictors (ignore any unobserved patterns), to avoid partitioning among an unacceptably high number of covariate patterns. After, we assign an ordinal score to each subject, by summing the predicted probabilities of each subject for each outcome level multiplied by equally spaced integer weights. The covariate patterns are then split into two at the median score within each. Based on this partitioning, observed and expected frequencies are calculated, a contingency table can be constructed and the statistic tests computed. The two Pulkstenis and Robinson test statistics are the Pearson and deviance test statistics on that table. These statistics are distributed by the distribution with degrees of freedom, where I is the number of covariate patterns, J is the number of of response categories and k is the number of categorical variables in the model.
5. Results and Discussions
5.1. Characteristics of the Sample
5.2. Model Estimation
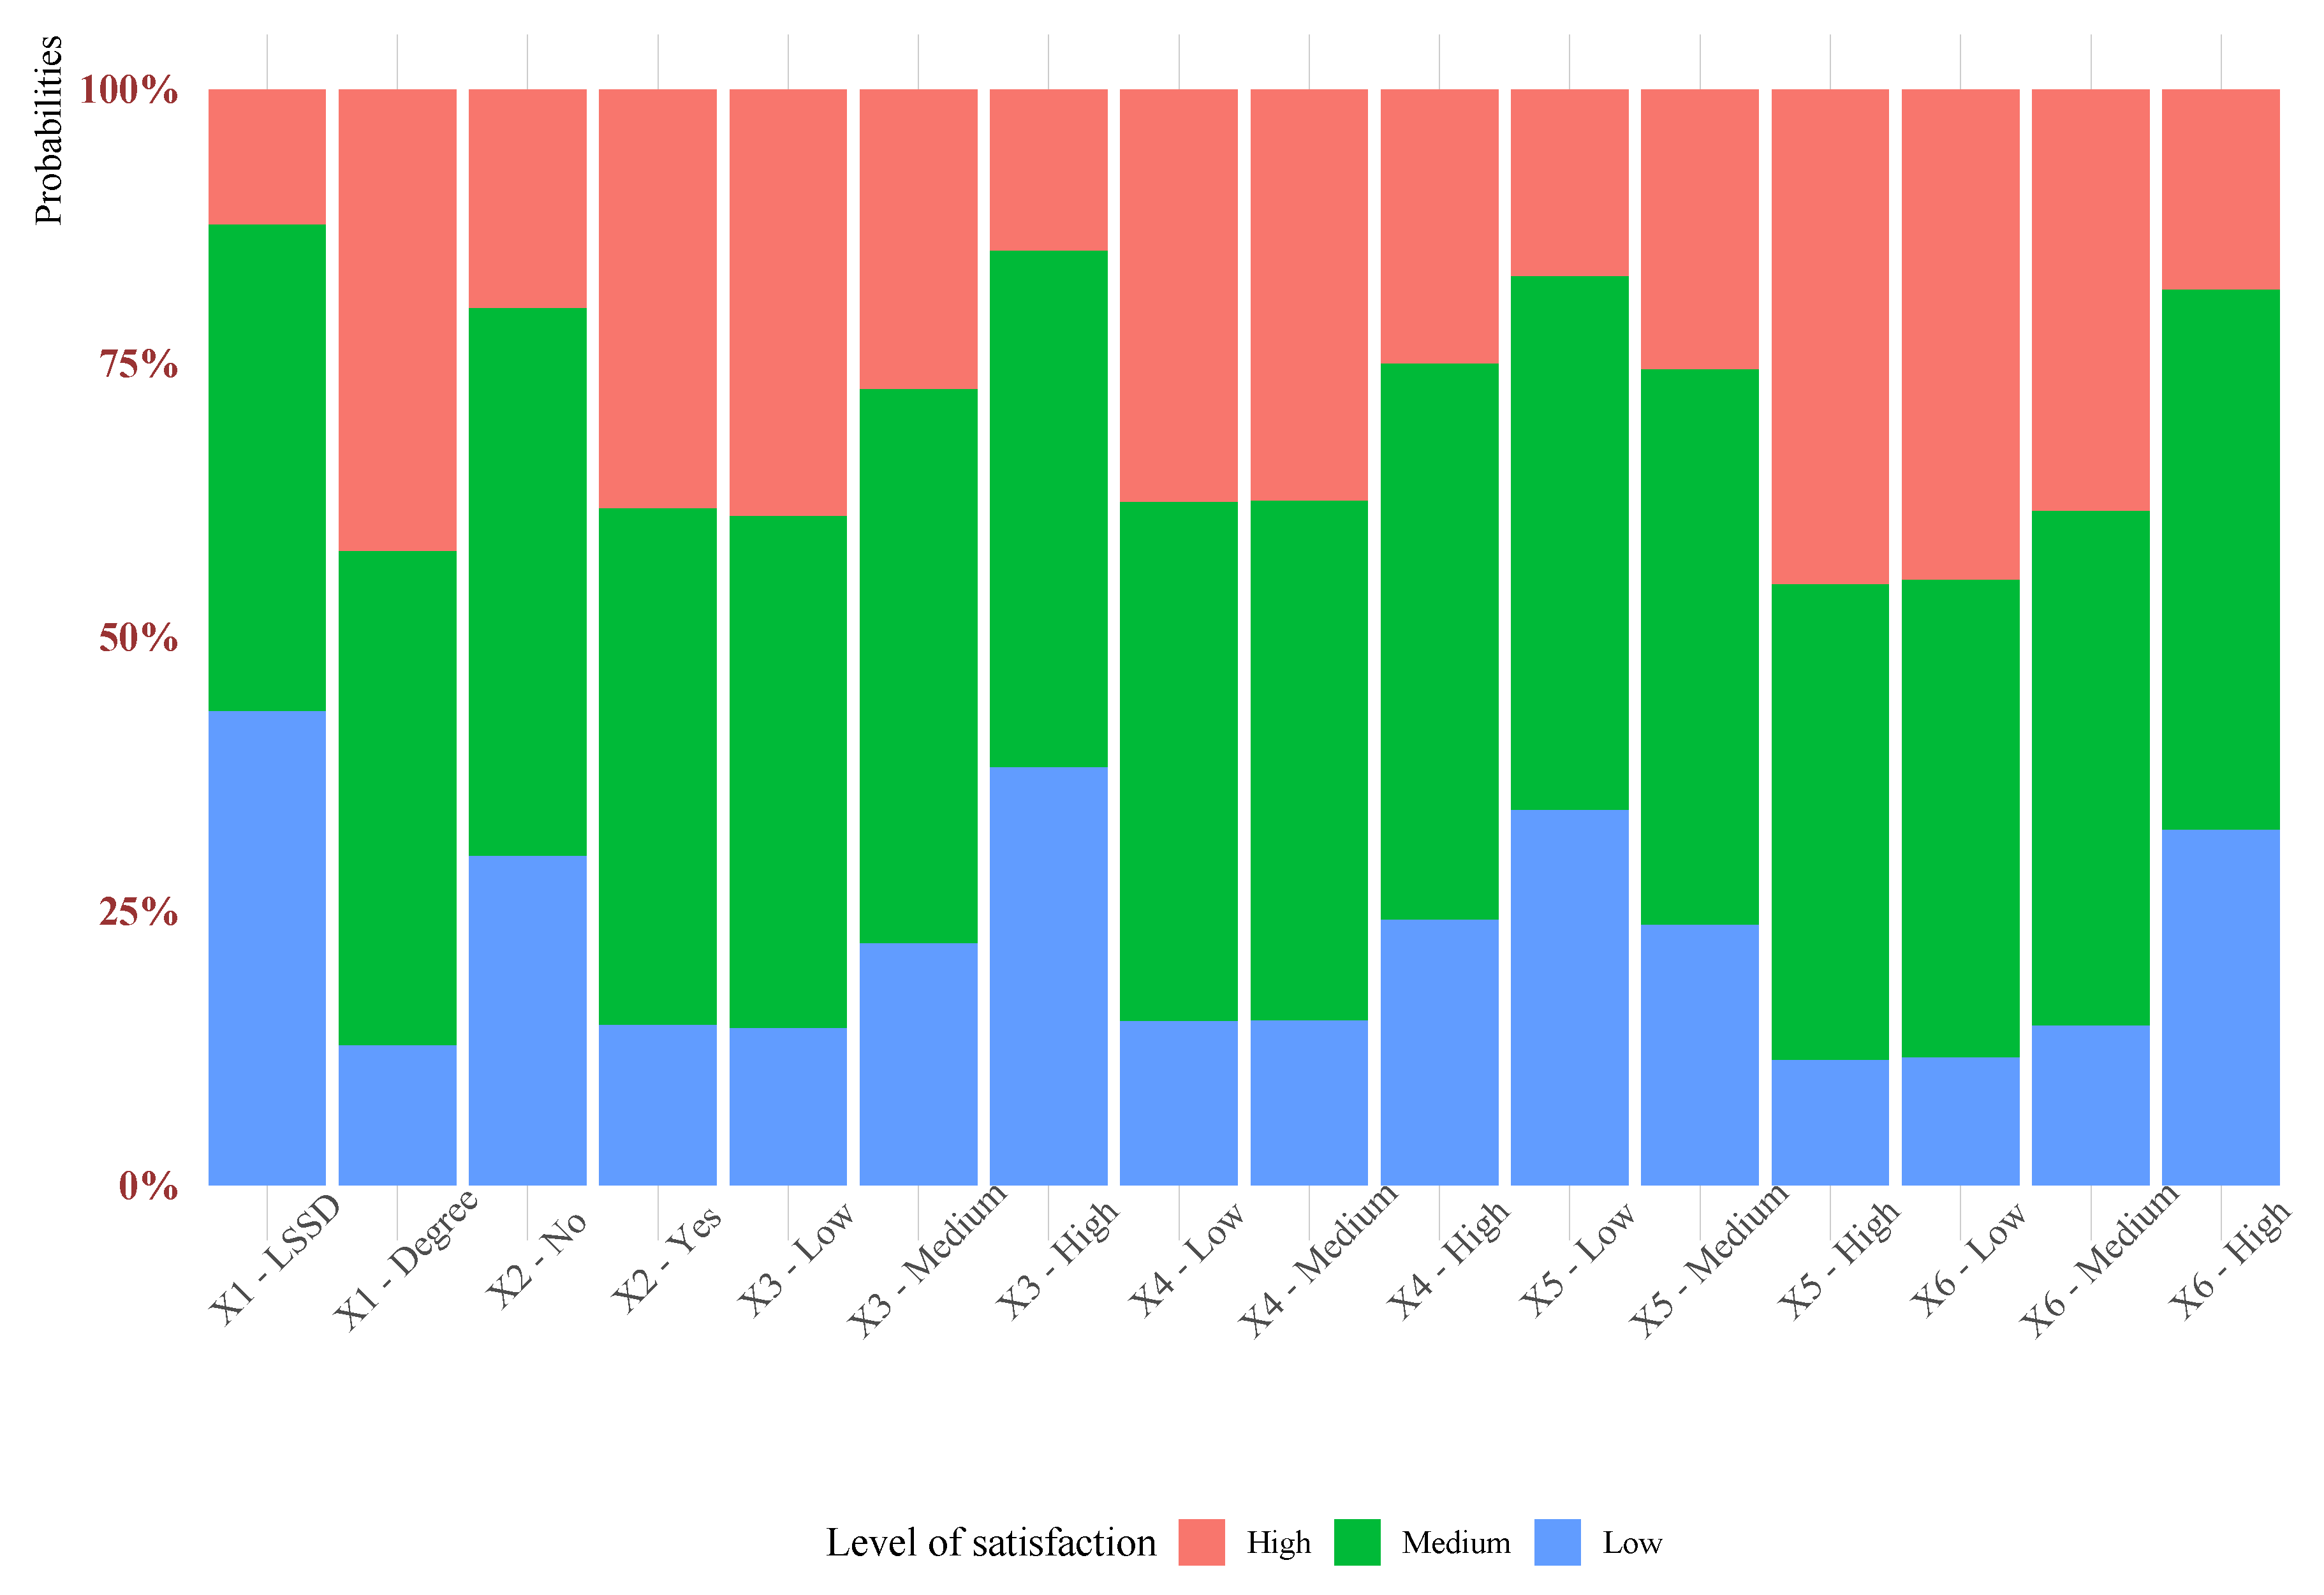
- Education: DegreeThe reference modality is Lower secondary school diploma (LSSD). For people with a degree, the odds of being more satisfied for the food online shopping experience is 5.215 times that of people with a lower secondary school diploma, holding constant all other variables. Several studies suggest that personal characteristics, such as level of education, are important predictors of online grocery shopping [64]. Indeed, better educated consumers may be more likely to shop online, both because they could feel more confident about having the necessary resources, and for time savings and convenience aspects related to this channel [12,65].
- Familiarity with buying food online: yesThe reference modality is Familiarity with buying food online: no. The respondents who claim to be familiar with buying food online have an odds of being more satisfied for the shopping experience 2.494 times that of those who are not familiar with it, holding constant all other variables. This result corroborates what Reference [21] found, according to which consumers who have greater compatibility with these digital technologies are more likely to buy food products online as they are satisfied with their previous experience.
- General complexity of buying food online: medium—lowThe reference modality is General complexity of buying food online: high. In general, people who find it less complex to buy food online tend to be more satisfied for this experience. For respondents who judge the online shopping experience sufficiently or less complex, the odds of being more satisfied is, respectively, 2.174 and 3.685 times that of those who judge it highly complex, with constant all other variables. Several empirical evidence confirm that consumers who have no difficulty in using digital tools for the online purchasing of foods find these tools particularly useful and consequently accept them more easily and tend to use them more frequently [7,21,36]. Conversely, as highlighted by Reference [28], the difficulty of using digital technologies is a deterrent for consumers who, consequently, shift their attention to other easier-to-use solutions.
- Complexity of buying food online (inability to see physically): medium—lowThe reference modality is Complexity of buying food online (inability to see physically): high. We can express some considerations similar to those made for the variable general complexity: people evaluating the online shopping experience sufficiently or less complex due to the inability to see products physically have an odds of being more satisfied, respectively, 1.791 and 1.799 times that of those who judge it highly complex, constant all other variables. This result is in line with the advantages that online grocery shopping offers consumers, giving the opportunity to compare a greater number of products and product characteristics than traditional purchasing methods [12,14].
- Possibility of saving time by purchasing food products online: highThe reference modality is Possibility to save time by purchasing food products online: low. For respondents who state that the possibility to save time by shopping online is high, the odds of being more satisfied is 4.011 times that of those who state that this possibility is low, holding constant all other variables. As numerous empirical evidence show, the opportunity of saving time by purchasing food products online, compared to traditional channels, is perceived as an advantage or an incentive by consumers [21,37]. Above all, this result is in line with the social and organizational changes of the families in which household members spend less time for cooking and consequently for food shopping.
- Problems in buying food products online: medium and lowThe reference modality is Problems in buying food products online: high. We can observe that the lower the problems in buying food products online, the higher the satisfaction in online shopping experience. Respondents who affirm having sufficient or low problems in buying online have an odds of being more satisfied, respectively, 2.817 and 3.656 times that those who declare to have high problems, given constant all other variables. This result is consistent with other empirical evidence [7,36,37], according to which the complexity in the use of digital tools for the purchase of food products, linked also to technical problems, negatively affects consumers by reducing the propensity to use or re-use these modern tools.
6. Concluding Remarks
Author Contributions
Funding
Acknowledgments
Conflicts of Interest
Appendix A

| Degrees of Freedom | p-Value | ||
|---|---|---|---|
| Omnibus | 12 | ||
| Level of Education | 3 | ||
| Familiarity with buying food online | 1 | ||
| General complexity of buying food online | 2 | ||
| Complexity of buying food online (inability to see physically) | 2 | ||
| Possibility to save time by purchasing food products online | 2 | ||
| Problems in buying food products online | 2 |
| Lipsitz Test | Hosmer-Lemeshow Test | ||||
|---|---|---|---|---|---|
| Deviance | Degrees of freedom | p-value | Degrees of freedom | p-value | |
| 8.924 | 9 | 0.444 | 31.094 | 21 | 0.072 |
| Deviance Squared | Degrees of Freedom | p-Value | Degrees of Freedom | p-Value | ||
|---|---|---|---|---|---|---|
| Level of education | 15.842 | 12 | 0.199 | 18.126 | 12 | 0.112 |
| Familiarity with buying food online | 2.467 | 4 | 0.651 | 2.599 | 4 | 0.627 |
| General complexity of buying food online | 1.457 | 8 | 0.993 | 1.440 | 8 | 0.994 |
| Complexity of buying food online, due to the inability to see products physically | 6.295 | 8 | 0.614 | 6.373 | 8 | 0.606 |
| Possibility to save time by purchasing food products online | 5.463 | 8 | 0.707 | 6.430 | 8 | 0.599 |
| Problems in buying food products online | 9.792 | 8 | 0.280 | 9.786 | 8 | 0.280 |
References
- Anesbury, Z.; Nenycz-Thiel, M.; Dawes, J.; Kennedy, R. How do Shoppers Behave Online? An Observational Study of Online Grocery Shopping. J. Consum. Behav. 2016, 15, 261–270. [Google Scholar] [CrossRef]
- Shang, D.; Wu, W. Understanding Mobile Shopping Consumers’ Continuance Intention. Ind. Manag. Data Syst. 2017, 117, 213–227. [Google Scholar] [CrossRef]
- Galati, A.; Tinervia, S.; Tulone, A.; Crescimanno, M. Drivers affecting the adoption and effectiveness of social media investments. Int. J. Wine Bus. Res. 2019, 31, 260–278. [Google Scholar] [CrossRef]
- Galati, A.; Sakka, G.; Crescimanno, M.; Tulone, A.; Fiore, M. What is the Role of Social Media in Several Overtones of CSR Communication? The Case of the Wine Industry in the Southern Italian Regions. Br. Food J. 2019, 121, 856–873. [Google Scholar] [CrossRef]
- Galati, A.; Crescimanno, M.; Tinervia, S.; Siggia, D. Website Quality and Internal Business Factors. Int. J. Wine Bus. Res. 2016, 28, 308–326. [Google Scholar] [CrossRef]
- Mortimer, G.; Fazal e Hasan, S.M.; Andrews, L.; Martin, J. Online Grocery Shopping: The Impact of Shopping Frequency on Perceived Risk. Int. Rev. Retail. Distrib. Consum. Res. 2016, 26, 202–223. [Google Scholar] [CrossRef]
- Driediger, F.; Bhatiasevi, V. Online Grocery Shopping in Thailand: Consumer Acceptance and Usage Behavior. J. Retail. Consum. Serv. 2019, 48, 224–237. [Google Scholar] [CrossRef]
- EuroMonitor International. COVID-19 to Accelerate Online Grocery Shopping Beyond 2021; Technical Report; EuroMonitor International: London, UK, 2020. [Google Scholar]
- Grand View Research. Online Grocery Market Size, Share & Trends Analysis Report by Product Type (Fresh Produce, Breakfast & Dairy, Snacks & Beverages, Staples & Cooking Essentials), by Region, and Segment Forecasts, 2020–2027; Technical Report; Grand View Research Inc.: San Francisco, CA, USA, 2020. [Google Scholar]
- Sreeram, A.; Kesharwani, A.; Desai, S. Factors Affecting Satisfaction and Loyalty in Online Grocery Shopping: An Integrated Model. J. Indian Bus. Res. 2017, 9, 107–132. [Google Scholar] [CrossRef]
- Huang, Y.; Oppewal, H. Why Consumers Hesitate to Shop Online: An Experimental Choice Analysis of Grocery Shopping and the Role of Delivery Fees. Int. J. Retail Distrib. Manag. 2006, 34, 334–353. [Google Scholar] [CrossRef]
- Morganosky, M.A.; Cude, B.J. Consumer Response to Online Grocery Shopping. Int. J. Retail Distrib. Manag. 2000, 28, 17–26. [Google Scholar] [CrossRef]
- Shankar, V.; Smith, A.K.; Rangaswamy, A. Customer Satisfaction and Loyalty in Online and Offline Environments. Int. J. Res. Mark. 2003, 20, 153–175. [Google Scholar] [CrossRef]
- Chu, J.; Arce-Urriza, M.; Cebollada-Calvo, J.J.; Chintagunta, P.K. An Empirical Analysis of Shopping Behavior across Online and Offline Channels for Grocery Products: The Moderating Effects of Household and Product Characteristics. J. Interact. Mark. 2010, 24, 251–268. [Google Scholar] [CrossRef]
- Pei, X.L.; Guo, J.N.; Wu, T.J.; Zhou, W.X.; Yeh, S.P. Does the Effect of Customer Experience on Customer Satisfaction Create a Sustainable Competitive Advantage? A Comparative Study of Different Shopping Situations. Sustainability 2020, 12, 7436. [Google Scholar] [CrossRef]
- Saha, S.K.; Duarte, P.; Silva, S.C.; Zhuang, G. Supporting sustainability by promoting online purchase through enhancement of online convenience. Environ. Dev. Sustain. 2020, 1–22. [Google Scholar] [CrossRef]
- Long, N.N.; Khoi, B.H. An Empirical Study about the Intention to Hoard Food during COVID-19 Pandemic. EURASIA J. Math. Sci. Technol. Educ. 2020, 16, em1857. [Google Scholar]
- Romeo-Arroyo, E.; Mora, M.; Vázquez-Araújo, L. Consumer Behavior in Confinement Times: Food Choice and Cooking Attitudes in Spain. Int. J. Gastron. Food Sci. 2020, 21, 100226. [Google Scholar] [CrossRef]
- Sheth, J. Impact of Covid-19 on Consumer Behavior: Will the Old Habits Return or Die? J. Bus. Res. 2020, 117, 280–283. [Google Scholar] [CrossRef]
- Statista. Online Food Delivery; Technical Report; Statista: New York, NY, USA, 2020. [Google Scholar]
- Hansen, T. Consumer Adoption of Online Grocery Buying: A Discriminant Analysis. Int. J. Retail Distrib. Manag. 2005, 33, 101–121. [Google Scholar] [CrossRef]
- Hansen, T. Consumer Values, the Theory of Planned Behaviour and Online Grocery Shopping. Int. J. Consum. Stud. 2008, 32, 128–137. [Google Scholar] [CrossRef]
- Sheehan, D.; Hardesty, D.M.; Ziegler, A.H.; Chen, H.A. Consumer Reactions to Price Discounts across Online Shopping Experiences. J. Retail. Consum. Serv. 2019, 51, 129–138. [Google Scholar] [CrossRef]
- Zheng, Q.; Chen, J.; Zhang, R.; Wang, H.H. What Factors Affect Chinese Consumers’ Online Grocery Shopping? Product Attributes, E-vendor Characteristics and Consumer Perceptions. China Agric. Econ. Rev. 2020, 12, 193–213. [Google Scholar] [CrossRef]
- Benn, Y.; Webb, T.L.; Chang, B.P.; Reidy, J. What Information do Consumers Consider, and How do They Look for It, When Shopping for Groceries Online? Appetite 2015, 89, 265–273. [Google Scholar] [CrossRef] [PubMed]
- Van Droogenbroeck, E.; Van Hove, L. Intra-household Task Allocation in Online Grocery Shopping: Together Alone. J. Retail. Consum. Serv. 2020, 56, 102153. [Google Scholar] [CrossRef]
- Rogus, S.; Guthrie, J.F.; Niculescu, M.; Mancino, L. Online Grocery Shopping Knowledge, Attitudes, and Behaviors among SNAP Participants. J. Nutr. Educ. Behav. 2020, 52, 539–545. [Google Scholar] [CrossRef] [PubMed]
- Singh, R.; Rosengren, S. Why do Online Grocery Shoppers Switch? An Empirical Investigation of Drivers of Switching in Online Grocery. J. Retail. Consum. Serv. 2020, 53, 101962. [Google Scholar] [CrossRef]
- Hand, C.; Dall’Olmo Riley, F.; Harris, P.; Singh, J.; Rettie, R. Online Grocery Shopping: The Influence of Situational Factors. Eur. J. Mark. 2009, 43, 1205–1219. [Google Scholar] [CrossRef]
- Muhammad, N.S.; Sujak, H.; Abd Rahman, S. Buying Groceries Online: The Influences of Electronic Service Quality (eServQual) and Situational Factors. Procedia Econ. Financ. 2016, 37, 379–385. [Google Scholar] [CrossRef]
- Bhattacherjee, A. An Empirical Analysis of the Antecedents of Electronic Commerce Service Continuance. Decis. Support Syst. 2001, 32, 201–214. [Google Scholar] [CrossRef]
- Venkatesh, V.; Davis, F.D. A Theoretical Extension of the Technology Acceptance Model: Four Longitudinal Field Studies. Manag. Sci. 2000, 46, 186–204. [Google Scholar] [CrossRef]
- Davis, F.D. Perceived Usefulness, Perceived Ease of Use, and User Acceptance of Information Technology. MIS Q. 1989, 13, 319–340. [Google Scholar] [CrossRef]
- Fishbein, M.; Ajzen, I. Belief, Attitude, Intention, and Behavior: An Introduction to Theory and Research; Addison-Wesley: Reading, MA, USA, 1975. [Google Scholar]
- Ajzen, I.; Fishbein, M. Theory of Reasoned Action-Theory of Planned Behavior. Univ. South Fla. 1988, 2007, 67–98. [Google Scholar]
- Oliver, R.L. Effect of Expectation and Disconfirmation on Postexposure Product Evaluations: An Alternative Interpretation. J. Appl. Psychol. 1977, 62, 480–486. [Google Scholar] [CrossRef]
- Wang, O.; Somogyi, S. Consumer Adoption of Online Food Shopping in China. Br. Food J. 2018, 120, 2868–2884. [Google Scholar] [CrossRef]
- Singleton, R.A.; Straits, B.C. Approaches to Social Research; Oxford University Press: Oxford, UK, 1999. [Google Scholar]
- Rukuni, T.F.; Maziriri, E.T. Data on Corona-virus Readiness Strategies Influencing Customer Satisfaction and Customer Behavioural Intentions in South African Retail Stores. Data Brief 2020, 31, 105818. [Google Scholar] [CrossRef] [PubMed]
- Browne, K. Snowball sampling: Using social networks to research non-heterosexual women. Int. J. Soc. Res. Methodol. 2005, 8, 47–60. [Google Scholar] [CrossRef]
- Baltar, F.; Brunet, I. Social Research 2.0: Virtual Snowball Sampling Method Using Facebook. Int. Res. 2012, 22, 57–74. [Google Scholar] [CrossRef]
- Sadler, G.R.; Lee, H.C.; Lim, R.S.H.; Fullerton, J. Recruitment of hard-to-reach population subgroups via adaptations of the snowball sampling strategy. Nurs. Health Sci. 2010, 12, 369–374. [Google Scholar] [CrossRef]
- Waters, J. Snowball sampling: A cautionary tale involving a study of older drug users. Int. J. Soc. Res. Methodol. 2015, 18, 367–380. [Google Scholar] [CrossRef]
- Geldsetzer, P. Use of Rapid Online Surveys to Assess People’s Perceptions during Infectious Disease Outbreaks: A Cross-sectional Survey on COVID-19. J. Med. Internet Res. 2020, 22, e18790. [Google Scholar] [CrossRef]
- Sidor, A.; Rzymski, P. Dietary Choices and Habits during COVID-19 Lockdown: Experience from Poland. Nutrients 2020, 12, 1657. [Google Scholar] [CrossRef]
- Goni Mateos, L.; Aray Miranda, M.; Martínez, A.; Cuervo Zapatel, M. Validación de un cuestionario de frecuencia de consumo de grupos de alimentos basado en un sistema de intercambios. Nutr. Hosp. 2016, 33, 1391–1399. [Google Scholar] [CrossRef] [PubMed]
- Lanham-New, S.A.; Hill, T.R.; Gallagher, A.M.; Vorster, H.H. Introduction to Human Nutrition; Wiley Blackwell: Hoboken, NJ, USA, 2020. [Google Scholar]
- Vittuari, M.; De Menna, F.; Gaiani, S.; Falasconi, L.; Politano, A.; Dietershagen, J.; Segrè, A. The Second Life of Food: An Assessment of the Social Impact of Food Redistribution Activities in Emilia Romagna, Italy. Sustainability 2017, 9, 1817. [Google Scholar] [CrossRef]
- Alaimo, L.S. Demographic and socio-economic factors influencing the Brexit vote. RIEDS Riv. Ital. Econ. Demogr. E Stat. Ital. Rev. Econ. Demogr. Stat. 2018, 72, 17–28. [Google Scholar]
- Alaimo, L.S.; Solivetti, L.M. Territorial Determinants of the Brexit Vote. Soc. Indic. Res. 2019, 144, 647–667. [Google Scholar] [CrossRef]
- Alaimo, L.S. Complexity of Social Phenomena: Measurements, Analysis, Representations and Synthesis. Unpublished. Ph.D. Thesis, University of Rome “La Sapienza”, Rome, Italy, 2020. [Google Scholar]
- McCullagh, P. Regression Models for Ordinal Data. J. R. Stat. Soc. Ser. B (Methodol.) 1980, 42, 109–127. [Google Scholar] [CrossRef]
- Agresti, A. Categorical Data Analysis; John Wiley & Sons: Hoboken, NJ, USA, 2002. [Google Scholar]
- Brant, R. Assessing Proportionality in the Proportional Odds Model for Ordinal Logistic Regression. Biometrics 1990, 42, 1171–1178. [Google Scholar] [CrossRef]
- Hosmer, D.W., Jr.; Lemeshow, S.; Sturdivant, R.X. Applied Logistic Regression; John Wiley & Sons: Hoboken, NJ, USA, 2013; Volume 398. [Google Scholar]
- Dolgun, A.; Saracbasi, O. Assessing Proportionality Assumption in the Adjacent Category Logistic Regression Model. Stat. Interface 2014, 7, 275–295. [Google Scholar] [CrossRef]
- Lipsitz, S.R.; Fitzmaurice, G.M.; Molenberghs, G. Goodness-of-fit Tests for Ordinal Response Regression Models. J. R. Stat. Soc. Ser. C (Appl. Stat.) 1996, 45, 175–190. [Google Scholar] [CrossRef]
- Fagerland, M.W.; Hosmer, D.W. A Goodness-of-fit Test for the Proportional Odds Regression Model. Stat. Med. 2013, 32, 2235–2249. [Google Scholar] [CrossRef]
- Pulkstenis, E.; Robinson, T.J. Goodness-of-fit Tests for Ordinal response regression models. Stat. Med. 2004, 23, 999–1014. [Google Scholar] [CrossRef]
- Fagerland, M.W.; Hosmer, D.W. Tests for Goodness of Fit in Ordinal Logistic Regression Models. J. Stat. Comput. Simul. 2016, 86, 3398–3418. [Google Scholar] [CrossRef]
- Venables, W.N.; Ripley, B.D. Modern Applied Statistics with S, 4th ed.; Springer: New York, NY, USA, 2002. [Google Scholar]
- Schlegel, B.; Steenbergen, M. Brant: Test for Parallel Regression Assumption, R Package Version 0.3-0. 2020. Available online: https://cran.r-project.org/web/packages/brant/brant.pdf (accessed on 18 October 2020).
- Jay, M. Generalhoslem: Goodness of Fit Tests for Logistic Regression Models, R Package Version 1.3.4. 2019. Available online: https://cran.r-project.org/web/packages/generalhoslem/index.html (accessed on 18 October 2020).
- Verhoef, P.C.; Langerak, F. Possible determinants of consumers’ adoption of electronic grocery shopping in the Netherlands. J. Retail. Consum. Serv. 2001, 8, 275–285. [Google Scholar] [CrossRef]
- Van Droogenbroeck, E.; Van Hove, L. Adoption of online grocery shopping: Personal or household characteristics? J. Internet Commer. 2017, 16, 255–286. [Google Scholar] [CrossRef]
- Fox, J.; Weisberg, S. An R Companion to Applied Regression, 3rd ed.; Sage: Thousand Oaks, CA, USA, 2019. [Google Scholar]
- Fox, J.; Hong, J. Effect Displays in R for Multinomial and Proportional-odds Logit Models: Extensions to the Effects Package. J. Stat. Softw. 2009, 32, 1–24. [Google Scholar] [CrossRef]
- Fiore, M. Direct selling in the wine sector: Lessons from cellars in Italy’s Apulia region. Br. Food J. 2016, 118, 1946–1959. [Google Scholar] [CrossRef]
- Fiore, M.; Alaimo, L.S.; Chkhartishvil, N. The Amazing Bond among Wine Consumption, Health and Hedonistic Well-being. Br. Food J. 2019, 122, 2707–2723. [Google Scholar] [CrossRef]
- Alaimo, L.S. Sustainable development and National Differences: An European Cross-national Analysis of Economic Sustainability. RIEDS Riv. Ital. Econ. Demogr. E Stat. Ital. Rev. Econ. Demogr. Stat. 2018, 72, 101–123. [Google Scholar]
- Alaimo, L.S.; Maggino, F. Sustainable Development Goals Indicators at Territorial Level: Conceptual and Methodological Issues—The Italian Perspective. Soc. Indic. Res. 2020, 147, 383–419. [Google Scholar] [CrossRef]
- Alaimo, L.S.; Ciacci, A.; Ivaldi, E. Measuring Sustainable Development by Non-aggregative Approach. Soc. Indic. Res. 2020, 1–22. [Google Scholar] [CrossRef]
- Pantano, E.; Pizzi, G.; Scarpi, D.; Dennis, C. Competing during a Pandemic? Retailers’ Ups and Downs during the COVID-19 Outbreak. J. Bus. Res. 2020, 116, 209–213. [Google Scholar] [CrossRef]


| Characteristics | Total Number | Percentage |
|---|---|---|
| Age 1 (18–34) | 100 | 0.403 |
| Age 2 (35–54) | 119 | 0.480 |
| Age 3 (More than 55) | 29 | 0.117 |
| Apulia: Yes | 96 | 0.387 |
| Apulia: No | 152 | 0.613 |
| Education: Lower secondary school diploma (LSSD) | 7 | 0.028 |
| Education: High school diploma | 41 | 0.165 |
| Education: Degree | 95 | 0.383 |
| Education: Post-graduate degree | 105 | 0.424 |
| One component units | 144 | 0.581 |
| Two components units | 50 | 0.202 |
| More than two components units | 54 | 0.217 |
| Frequency of online purchase of food products: never | 63 | 0.254 |
| Frequency of online purchase of food products: rarely | 72 | 0.290 |
| Frequency of online purchase of food products: at least once a month | 11 | 0.045 |
| Frequency of online purchase of food products: at least once a week | 102 | 0.411 |
| Familiarity with buying food online: yes | 172 | 0.694 |
| Familiarity with buying food online: no | 76 | 0.306 |
| General complexity of buying food online: low | 158 | 0.637 |
| General complexity of buying food online: medium | 53 | 0.214 |
| General complexity of buying food online: high | 37 | 0.149 |
| Complexity of buying food online (inability to see physically): low | 86 | 0.347 |
| Complexity of buying food online (inability to see physically): medium | 56 | 0.226 |
| Complexity of buying food online, (inability to see physically): high | 106 | 0.427 |
| Possibility of low quality or wrong products received: low | 82 | 0.330 |
| Possibility of low quality or wrong products received: medium | 81 | 0.327 |
| Possibility of low quality or wrong products received: high | 85 | 0.343 |
| Possibility to save time by purchasing food products online: low | 51 | 0.206 |
| Possibility to save time by purchasing food products online: medium | 78 | 0.315 |
| Possibility to save time by purchasing food products online: high | 119 | 0.479 |
| Problems in buying food products online: low | 73 | 0.295 |
| Problems in buying food products online: medium | 88 | 0.355 |
| Problems in buying food products online: high | 87 | 0.350 |
| Level of Satisfaction for the Food Online Shopping Experience | ||||
|---|---|---|---|---|
| Estimates | Std. Errors | p-Values | t | |
| X1—Education: High school diploma | 0.894 | 0.862 | 0.300 | 1.038 |
| X1—Education: Degree | 1.651 ** | 0.828 | 0.047 | 1.994 |
| X1—Education: Post-graduate degree | 1.010 | 0.820 | 0.219 | 1.231 |
| X2—Familiarity with buying food online: yes | 0.914 *** | 0.301 | 0.003 | 3.032 |
| X3—General complexity of buying food online: medium | 0.776 * | 0.457 | 0.090 | 1.700 |
| X3—General complexity of buying food online: low | 1.304 *** | 0.409 | 0.002 | 3.187 |
| X4—Complexity of buying food online (inability to see physically): medium | 0.583 * | 0.351 | 0.098 | 1.659 |
| X4—Complexity of buying food online (inability to see physically): low | 0.587 * | 0.337 | 0.082 | 1.742 |
| X5—Possibility to save time by purchasing food products online: medium | 0.512 | 0.380 | 0.178 | 1.349 |
| X5—Possibility to save time by purchasing food products online: high | 1.389 *** | 0.398 | <0.001 | 3.490 |
| X6—Problems in buying food products online: medium | 1.036 *** | 0.317 | 0.002 | 3.262 |
| X6—Problems in buying food products online: low | 1.296 *** | 0.381 | 0.001 | 3.403 |
| (intercept 1: Low/Medium) | 3.273 | 0.954 | 0.001 | 3.432 |
| (intercept 2: Medium/High) | 5.510 | 1.001 | <0.001 | 5.508 |
| Observations | 248 | |||
| Residual Deviance | 432.787 (df = 234) | |||
| AIC | 460.787 | |||
| OR | CI | |
|---|---|---|
| Education: High school diploma | 2.446 | 0.452–13.240 |
| Education: Degree | 5.215 | 1.028–26.441 |
| Education: Post-graduate degree | 2.745 | 0.550–13.691 |
| Familiarity with buying food online: yes | 2.494 | 1.381–4.503 |
| General complexity of buying food online: medium | 2.174 | 0.888–5.321 |
| General complexity of buying food online: low | 3.685 | 1.652–8.217 |
| Complexity of buying food online (inability to see physically): medium | 1.791 | 0.900–3.564 |
| Complexity of buying food online (inability to see physically): low | 1.799 | 0.929–3.483 |
| Possibility to save time by purchasing food products online: medium | 1.669 | 0.793–3.512 |
| Possibility to save time by purchasing food products online: high | 4.011 | 1.838–8.751 |
| Problems in buying food products online: medium | 2.817 | 1.512–5.248 |
| Problems in buying food products online: low | 3.656 | 1.733–7.712 |
| 1-Low | 2-Medium | 3-High | |
|---|---|---|---|
| X1—Education: Lower secondary school diploma-LSSD (reference modality) | 0.433 | 0.444 | 0.123 |
| X1—Education: Degree | 0.128 | 0.451 | 0.421 |
| X2 - Familiarity with buying food online: No (reference modality) | 0.301 | 0.500 | 0.199 |
| X2—Familiarity with buying food online: Yes | 0.147 | 0.471 | 0.382 |
| X3—General complexity of buying food online: low | 0.144 | 0.467 | 0.389 |
| X3—General complexity of buying food online: medium | 0.221 | 0.506 | 0.273 |
| X3—General complexity of buying food online: high (reference modality) | 0.382 | 0.471 | 0.147 |
| X4—Complexity of buying food online (inability to see physically): low | 0.150 | 0.474 | 0.376 |
| X4—Complexity of buying food online (inability to see physically): medium | 0.151 | 0.474 | 0.375 |
| X4—Complexity of buying food online (inability to see physically): high (reference modality) | 0.243 | 0.507 | 0.250 |
| X5—Possibility to save time by purchasing food products online: low (reference modality) | 0.343 | 0.487 | 0.170 |
| X5—Possibility to save time by purchasing food products online: medium | 0.238 | 0.507 | 0.255 |
| X5—Possibility to save time by purchasing food products online: high | 0.115 | 0.434 | 0.451 |
| X6—Problems in buying food products online: low | 0.117 | 0.436 | 0.447 |
| X6—Problems in buying food products online: medium | 0.146 | 0.470 | 0.384 |
| X6—Problems in buying food products online: high (reference modality) | 0.325 | 0.493 | 0.182 |
Publisher’s Note: MDPI stays neutral with regard to jurisdictional claims in published maps and institutional affiliations. |
© 2020 by the authors. Licensee MDPI, Basel, Switzerland. This article is an open access article distributed under the terms and conditions of the Creative Commons Attribution (CC BY) license (http://creativecommons.org/licenses/by/4.0/).
Share and Cite
Alaimo, L.S.; Fiore, M.; Galati, A. How the Covid-19 Pandemic Is Changing Online Food Shopping Human Behaviour in Italy. Sustainability 2020, 12, 9594. https://doi.org/10.3390/su12229594
Alaimo LS, Fiore M, Galati A. How the Covid-19 Pandemic Is Changing Online Food Shopping Human Behaviour in Italy. Sustainability. 2020; 12(22):9594. https://doi.org/10.3390/su12229594
Chicago/Turabian StyleAlaimo, Leonardo Salvatore, Mariantonietta Fiore, and Antonino Galati. 2020. "How the Covid-19 Pandemic Is Changing Online Food Shopping Human Behaviour in Italy" Sustainability 12, no. 22: 9594. https://doi.org/10.3390/su12229594
APA StyleAlaimo, L. S., Fiore, M., & Galati, A. (2020). How the Covid-19 Pandemic Is Changing Online Food Shopping Human Behaviour in Italy. Sustainability, 12(22), 9594. https://doi.org/10.3390/su12229594