Development and Evaluation of the Hydropower Reservoir Rule Curve for a Sustainable Water Supply


Abstract
:1. Introduction
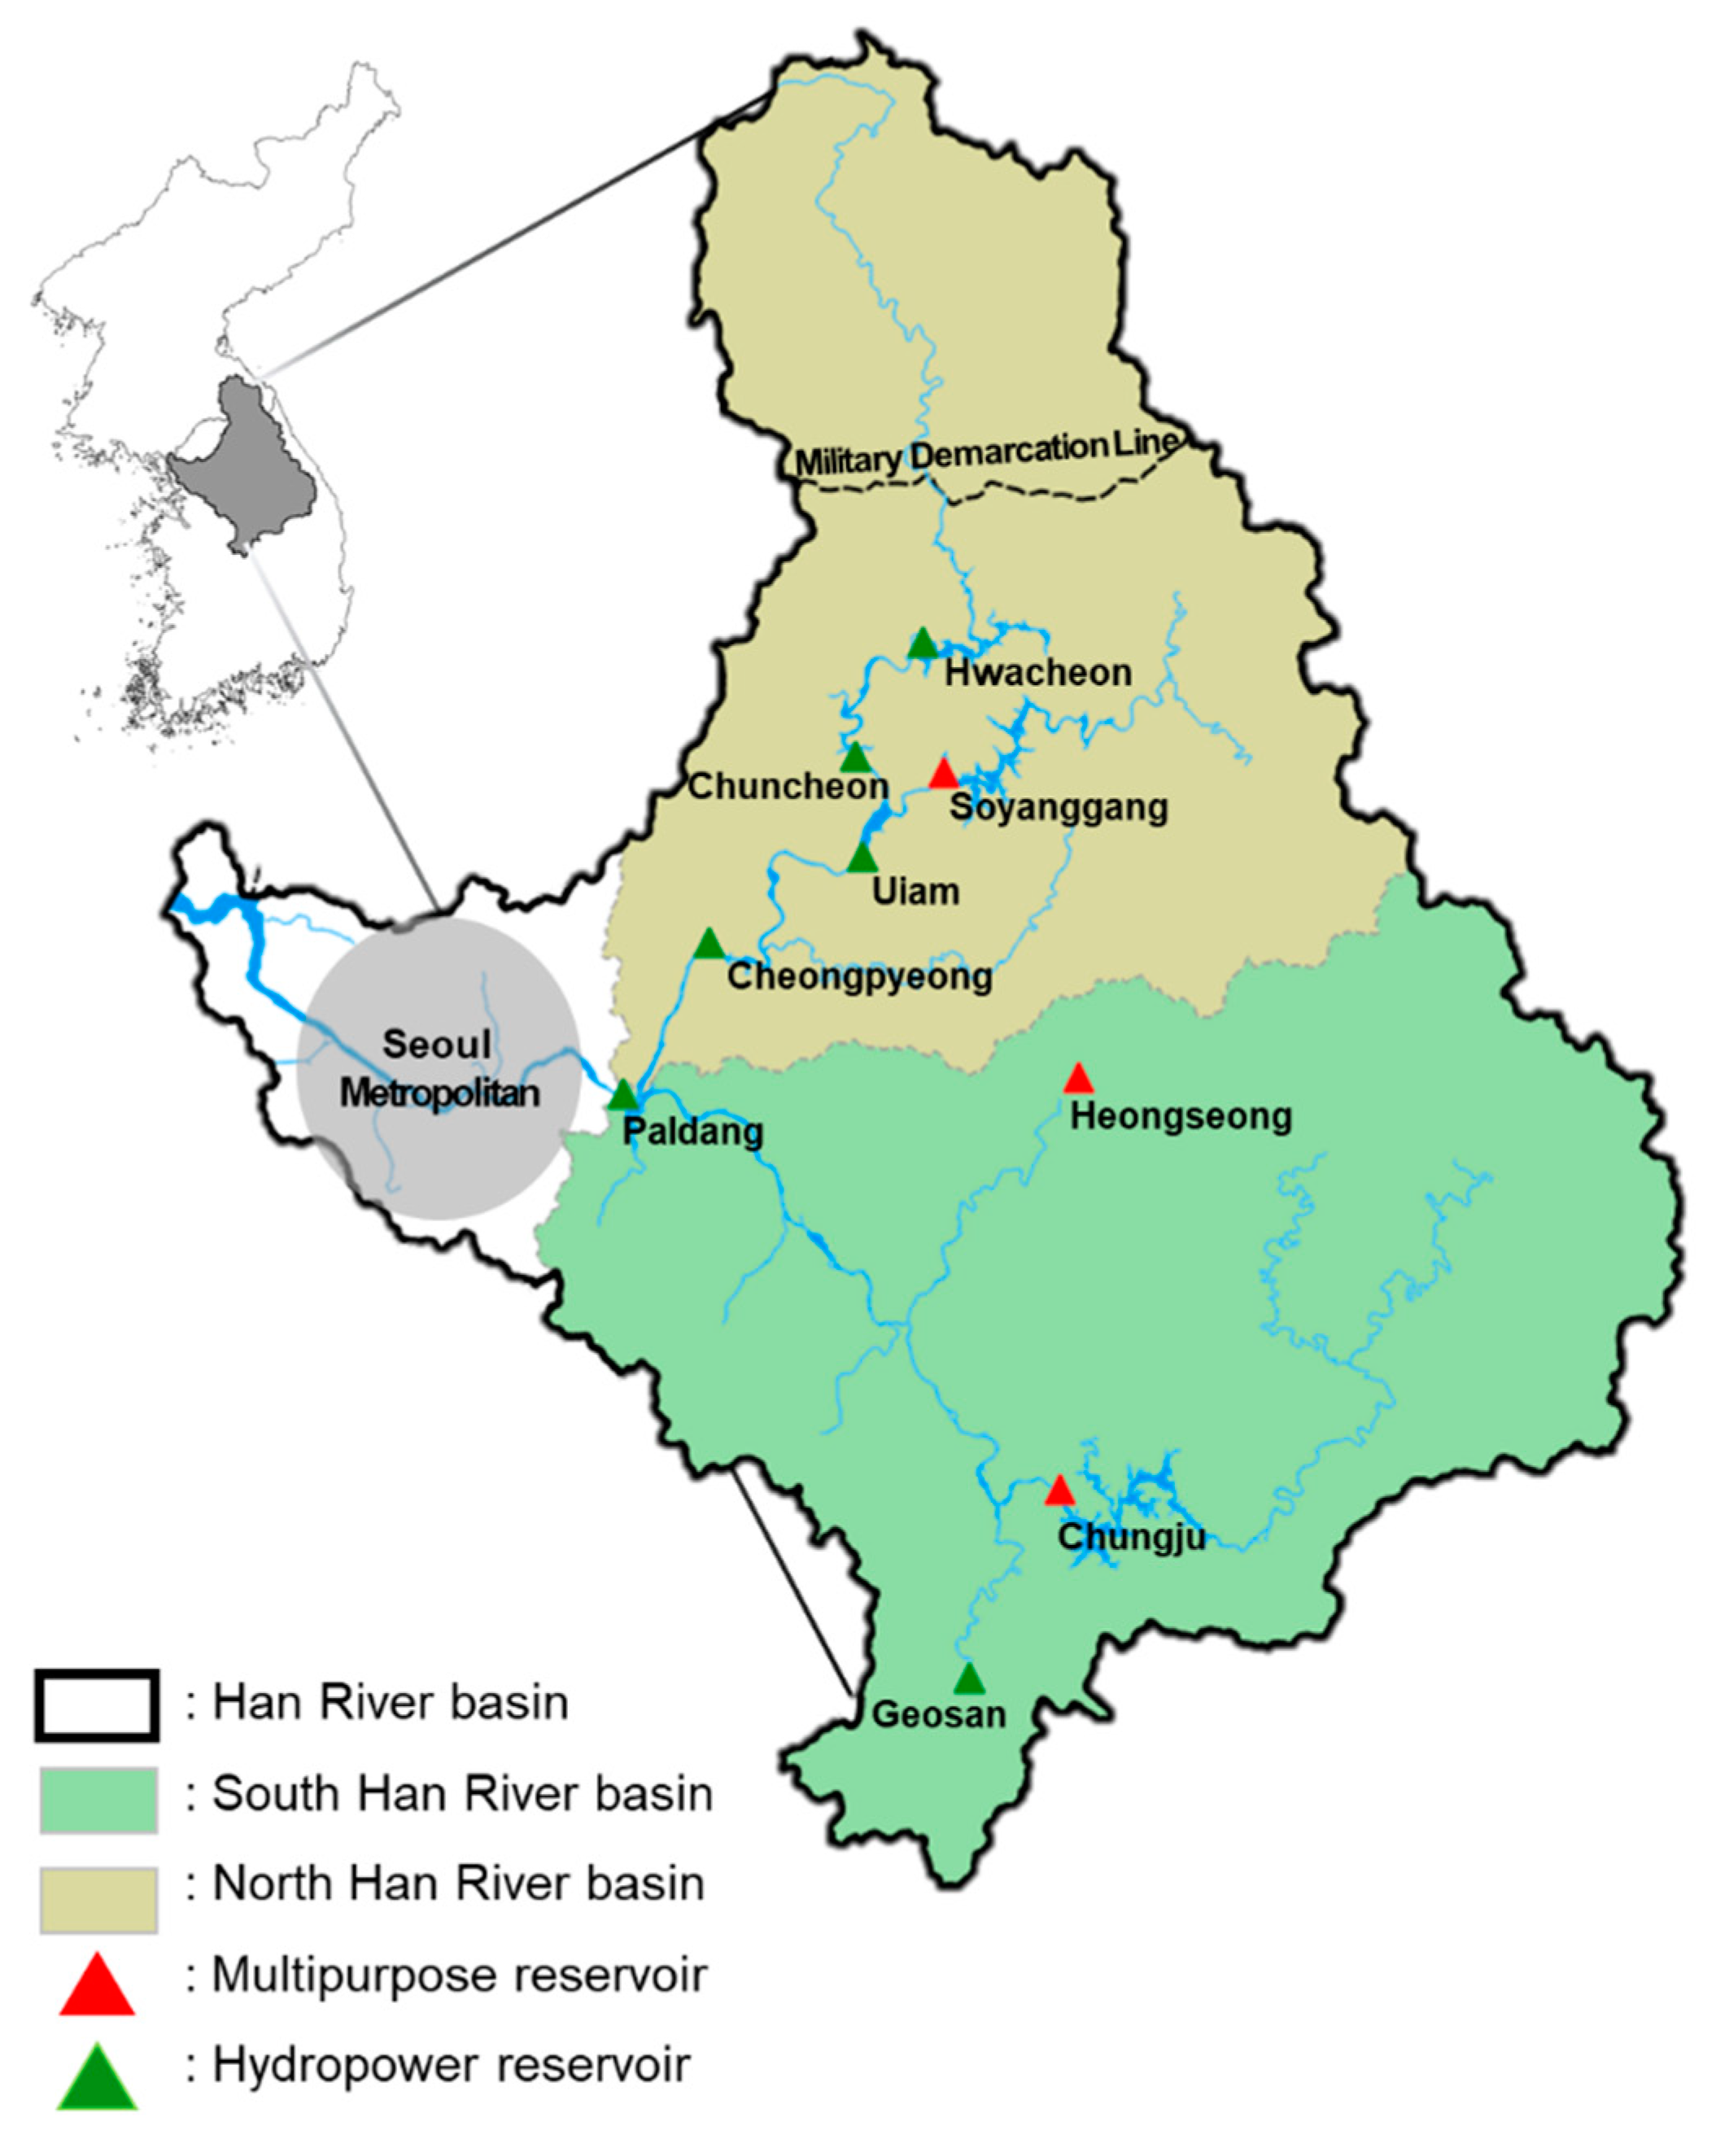
2. Study Area
3. Methodology
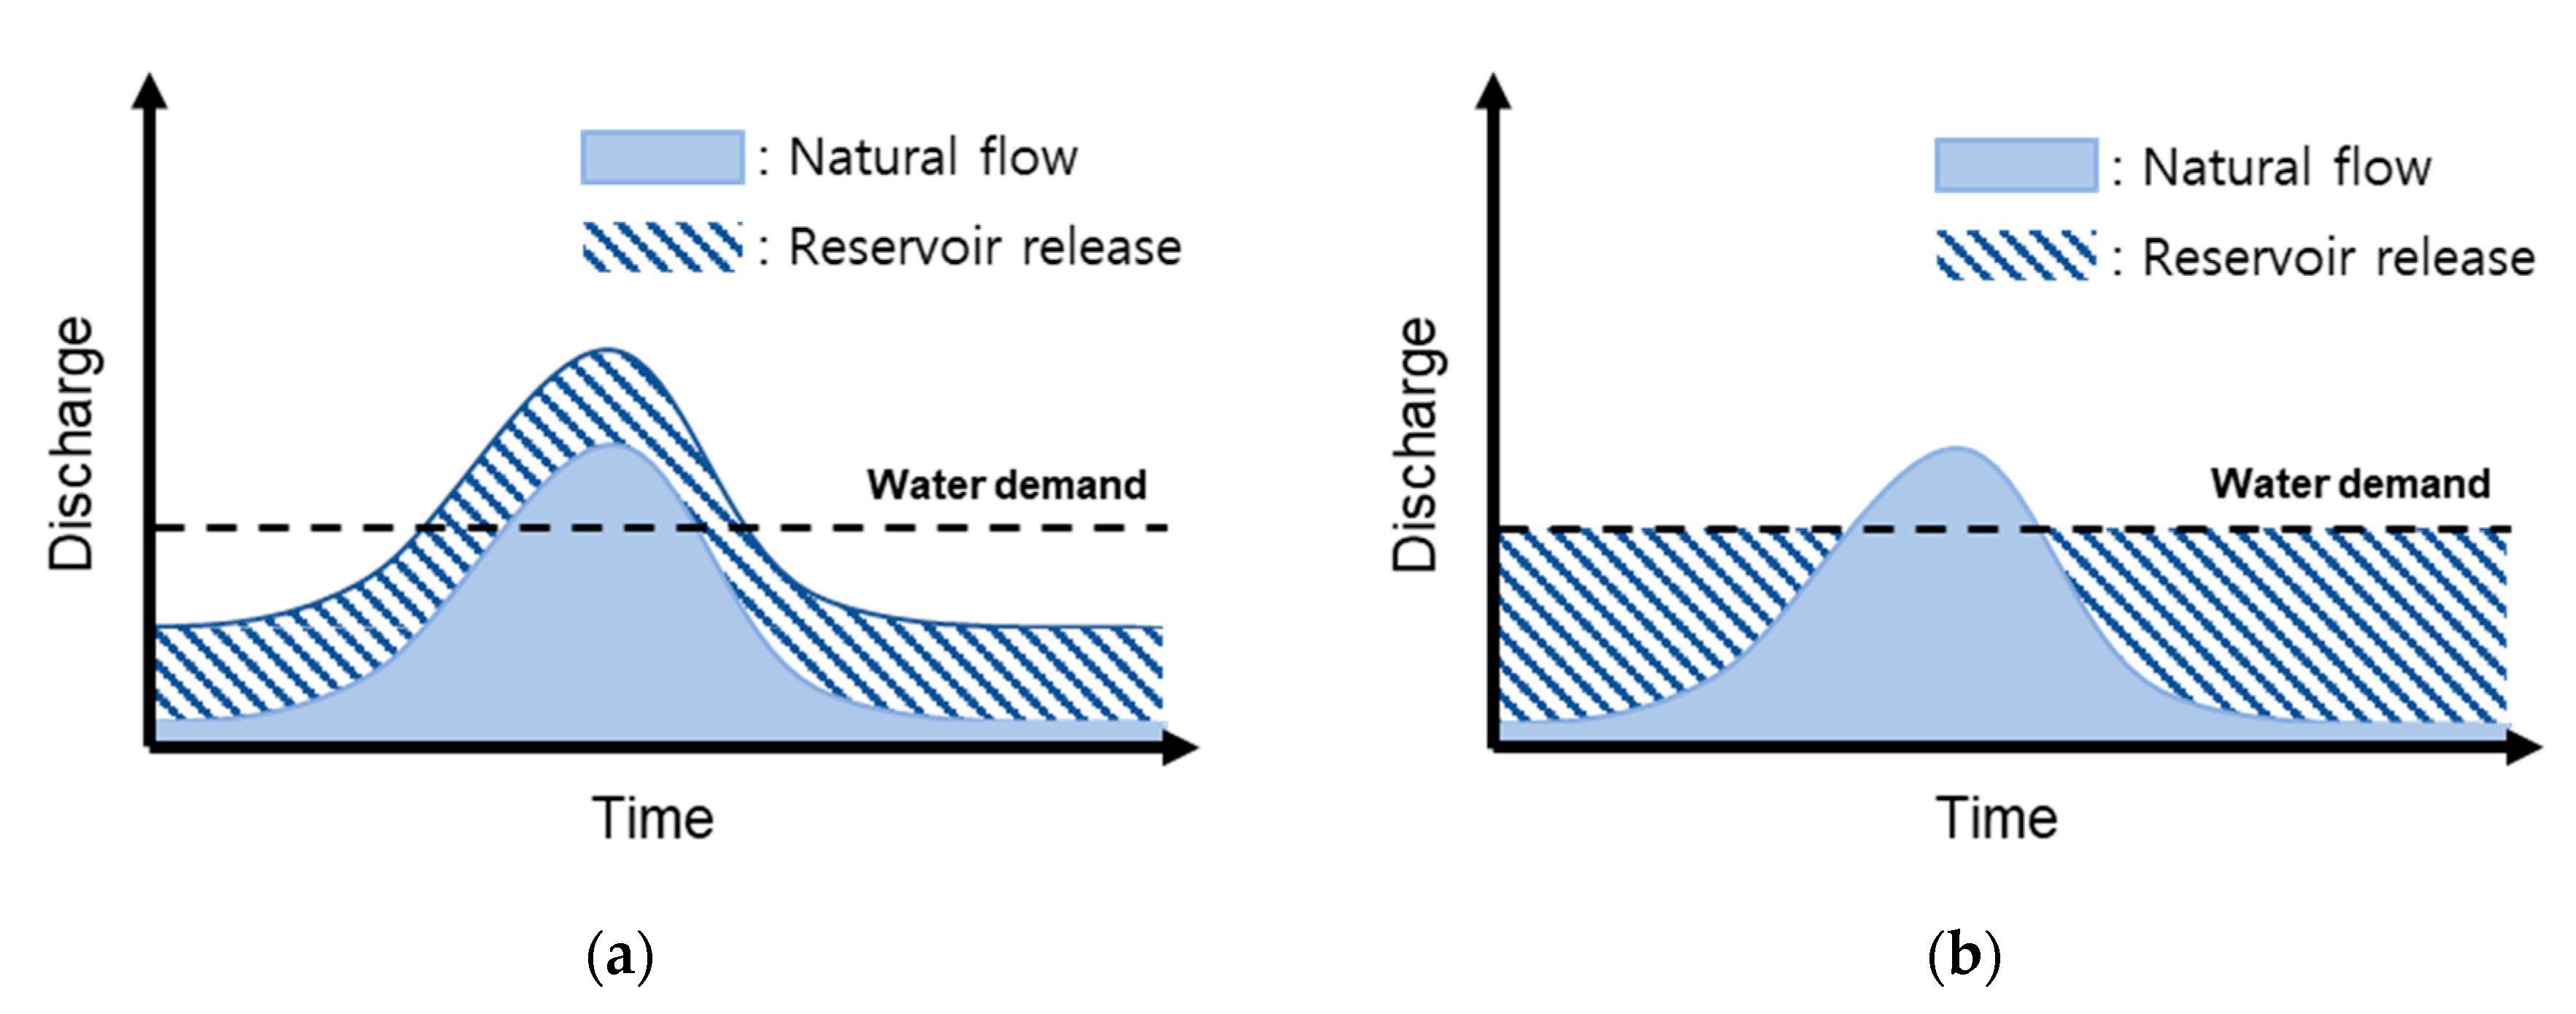
3.1. Simulation for Reservoir Operation
3.2. Evaluation Indexes
4. Results and Discussion
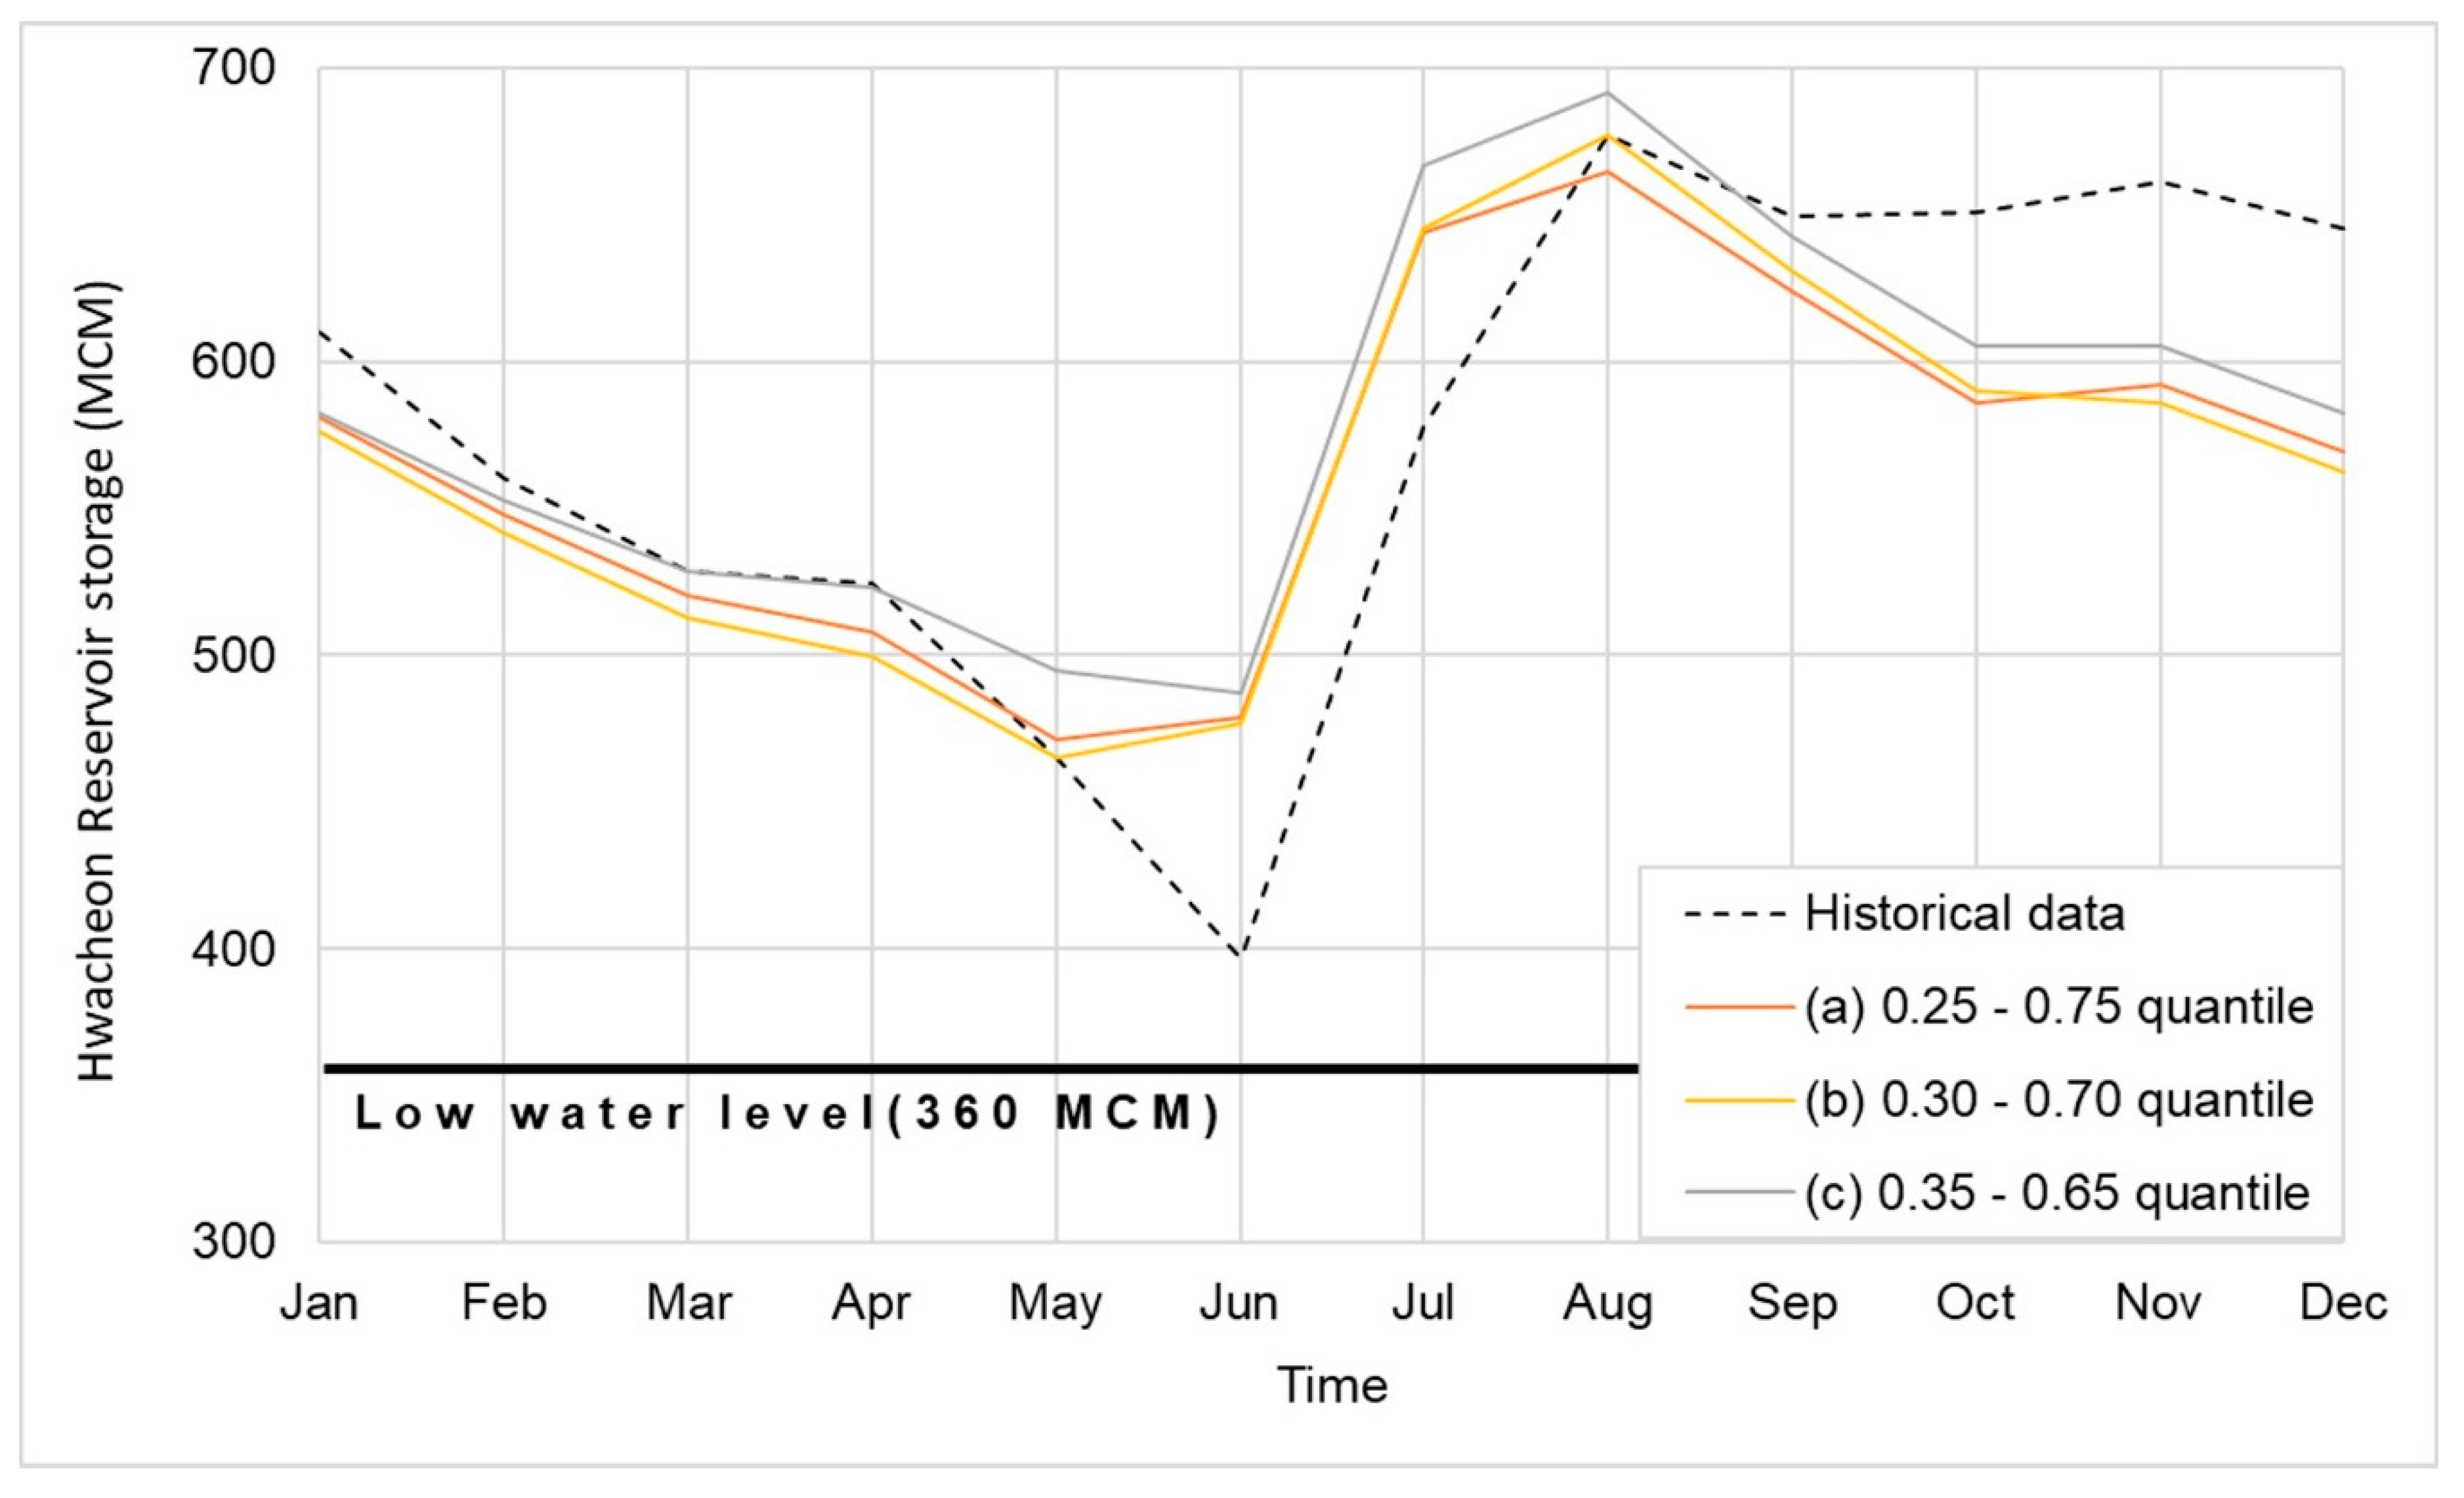
4.1. Scenario 1
4.2. Scenario 2
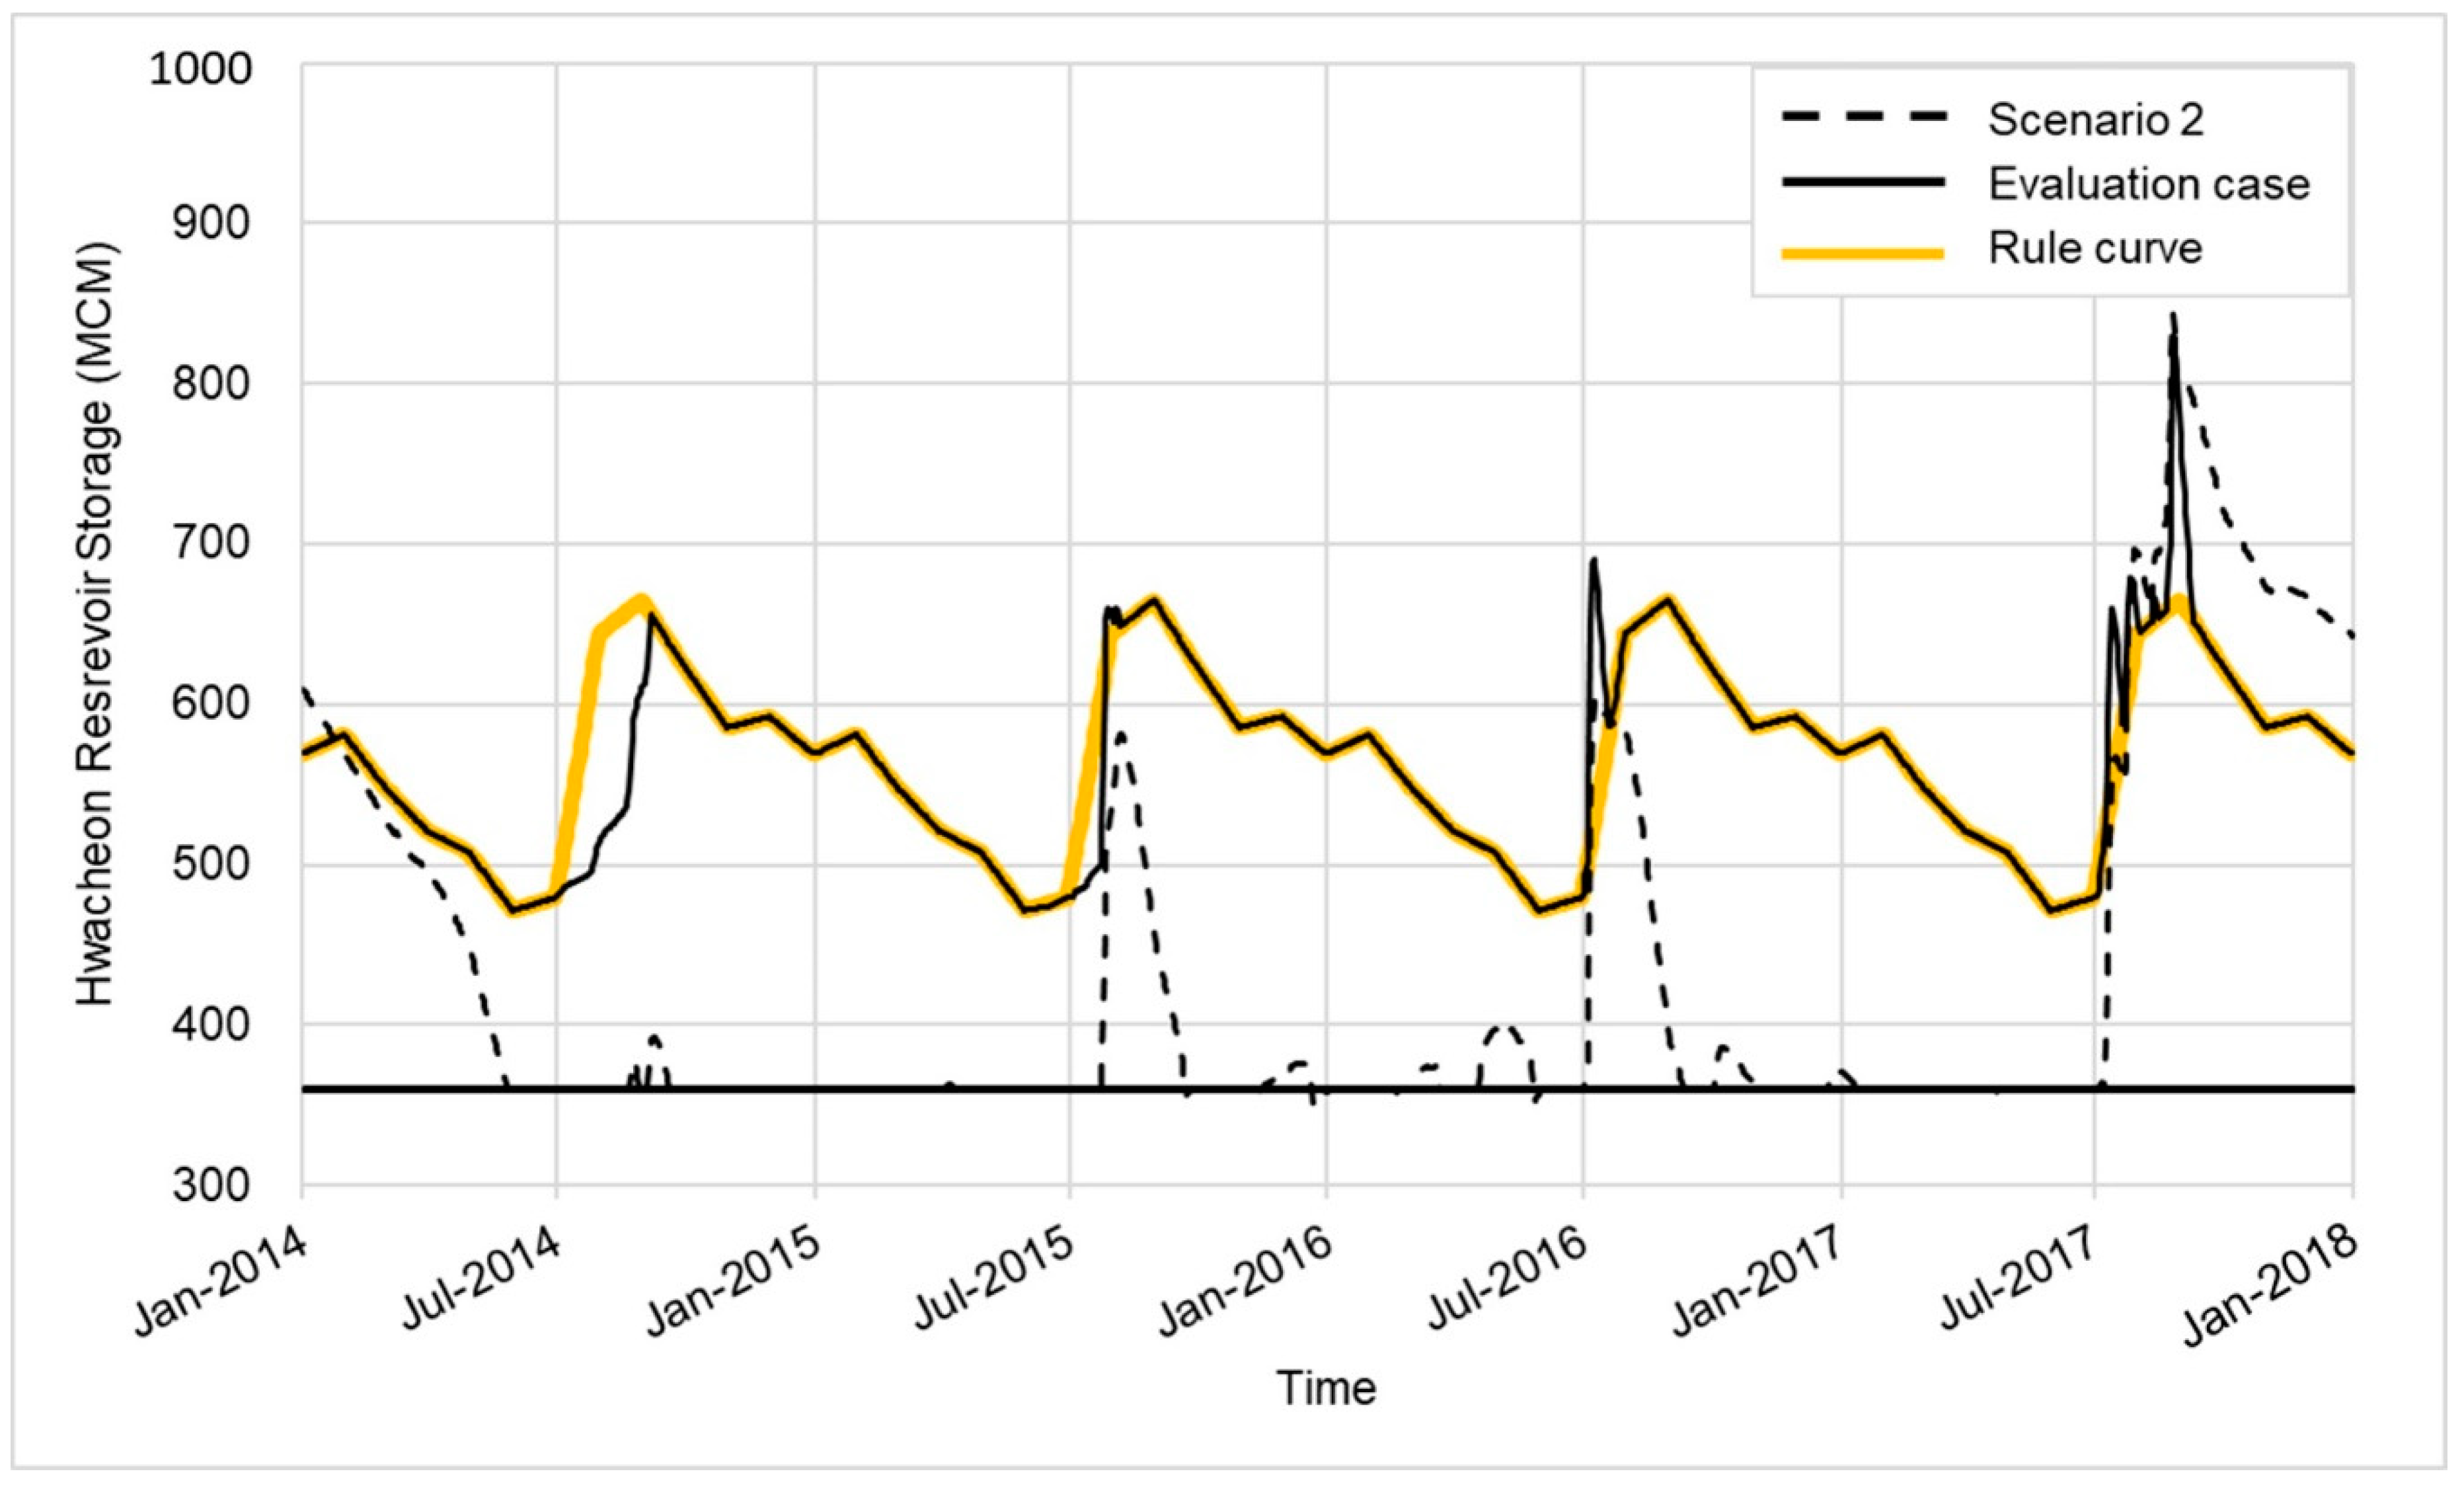
4.3. Evaltuation of the Rule Curve for the Hwacheon Reservoir
5. Conclusions
Author Contributions
Funding
Conflicts of Interest
References
- Dynesius, M.; Nilsson, C. Fragmentation and flow regulation of river systems in the northern third of the world. Science 1994, 266, 753–762. [Google Scholar] [CrossRef] [PubMed]
- Pohl, M. Channel bed mobility downstream from the Elwha dams, Washington. Prof. Geogr. 2004, 56, 422–431. [Google Scholar] [CrossRef]
- Ibanez-Castillo, L.A.; Chávez-Morales, J.; Marino, M.A. A planning model for the Fuerte-Carrizo irrigation system, Mexico. Water Resour. Manag. 1997, 11, 165–184. [Google Scholar] [CrossRef]
- Feder, D. A regionally based energy end-use strategy: Case studies from Centre County, Pennsylvania. Prof. Geogr. 2004, 56, 185–200. [Google Scholar] [CrossRef]
- Le, T.V.H.; Nguyen, H.N.; Wolanski, E.; Tran, T.C.; Haruyama, S. The combined impact on the flooding in Vietnam’s Mekong River delta of local man-made structures, sea level rise, and dams upstream in the river catchment. Estuar. Coast. Shelf Sci. 2007, 71, 110–116. [Google Scholar] [CrossRef]
- Hughes, D.A.; Ziervogel, G. The inclusion of operating rules in a daily reservoir simulation model to determine ecological reserve releases for river maintenance. Water SA 1998, 24, 293–302. [Google Scholar]
- Christy, J.R.; Clarke, R.A.; Gruza, G.V.; Jouzel, J.; Mann, M.E.; Oerlemans, J.; Salinger, M.J.; Wang, S.-W. Observed Climate Variability and Change. In Climate Change 2001: The Scientific Basis; Hallgren, R., Nyenzi, B., Eds.; Intergovernmental Panel on Climate Change: Geneva, Switzerland, 2001; pp. 157–160. [Google Scholar]
- Bates, B.; Kundzewicz, Z.W.; Wu, S.; Palutikof, J. Climate Change and Water, Technical Paper of the Intergovernmental Panel on Climate Change; Intergovernmental Panel on Climate Change (IPCC): Geneva, Switzerland, 2008; pp. 3–4. [Google Scholar]
- Stocker, T.F.; Qin, D.; Plattner, G.K.; Tignor, M.; Allen, S.K.; Boschung, J.; Midgley, P.M. Contribution of working group I to the fifth assessment report of the intergovernmental panel on climate change. In Climate Change 2013. The Physical Science Basis; Cambridge University Press: Cambridge, UK; New York, NY, USA, 2013; p. 25M-20. [Google Scholar]
- Leng, G.; Tang, Q.; Rayburg, S. Climate change impacts on meteorological, agricultural and hydrological droughts in China. Glob. Planet. Chang. 2015, 126, 23–34. [Google Scholar] [CrossRef]
- Piao, S.; Ciais, P.; Huang, Y.; Shen, Z.; Peng, S.; Li, J.; Friedlingstein, P. The impacts of climate change on water resources and agriculture in China. Nature 2010, 467, 43–51. [Google Scholar] [CrossRef]
- Zhang, L.; Li, S.; Wu, Z.; Fan, X.; Li, H.; Meng, Q.; Wang, J. Variation in Runoff, Suspended Sediment Load, and Their Inter-Relationships in Response to Climate Change and Anthropogenic Activities Over the Last 60 Years: A Case Study of the Upper Fenhe River Basin, China. Water 2020, 12, 1757. [Google Scholar] [CrossRef]
- Nash, L.L.; Gleick, P.H. Sensitivity of streamflow in the Colorado basin to climatic changes. J. Hydrol. 1991, 125, 221–241. [Google Scholar] [CrossRef]
- Ougougdal, H.A.; Khebiza, M.Y.; Messouli, M.; Lachir, A. Assessment of Future Water Demand and Supply under IPCC Climate Change and Socio-Economic Scenarios, Using a Combination of Models in Ourika Watershed, High Atlas, Morocco. Water 2020, 12, 1751. [Google Scholar] [CrossRef]
- Rickards, N.; Thomas, T.; Kaelin, A.; Houghton-Carr, H.; Jain, S.K.; Mishra, P.K.; Jenkins, A. Understanding future water challenges in a highly regulated Indian river basin-modelling the impact of climate change on the hydrology of the Upper Narmada. Water 2020, 12, 1762. [Google Scholar] [CrossRef]
- Jones, J.A.A. Climate change and sustainable water resources: Placing the threat of global warming in perspective. Hydrol. Sci. J. 1999, 44, 541–557. [Google Scholar] [CrossRef] [Green Version]
- Raje, D.; Mujumdar, P.P. Reservoir performance under uncertainty in hydrologic impacts of climate change. Adv. Water Resour. 2010, 33, 312–326. [Google Scholar] [CrossRef]
- Stone, M.C.; Hotchkiss, R.H.; Hubbard, C.M.; Fontaine, T.A.; Mearns, L.O.; Arnold, J.G. Impact of Climate Change on Missouri River Basin Water Yield. J. Am. Water Resour. Assoc. 2001, 37, 1119–1129. [Google Scholar] [CrossRef]
- Han, S.Y.; Kwak, S.J.; Yoo, S.H. Valuing environmental impacts of large dam construction in Korea: An application of choice experiments. Environ. Impact Assess. Rev. 2008, 28, 256–266. [Google Scholar] [CrossRef]
- Cha, S.M.; Kang, M.J.; Park, Y.; Lee, S.W.; Kim, J.H. Water quality changes according to the midstream weir construction in the Yeongsan River, Korea. Desalin. Water Treat. 2015, 53, 3066–3071. [Google Scholar] [CrossRef]
- Kim, Y.J. A Comparative case study of dam construction conflicts in terms of policy perceptual framing: Hantan River and Dong River dams. J. Korean Soc. Hazard Mitig. 2013, 13, 107–114. [Google Scholar] [CrossRef]
- Loucks, D.P.; Sigvaldason, O.T. Multiple-reservoir operation in North America. In The Operation of Multiple Reservoir Systems; Kaczmarek, Z., Kindler, J., Eds.; International Institute for Applied Systems Analysis: Laxenburg, Austria, 1982; pp. 4–6. [Google Scholar]
- Chen, L.; McPhee, J.; Yeh, W.W.G. A diversified multiobjective GA for optimizing reservoir rule curves. Adv. Water Resour. 2007, 30, 1082–1093. [Google Scholar] [CrossRef]
- Zhou, Y.; Guo, S. Incorporating ecological requirement into multipurpose reservoir operating rule curves for adaptation to climate change. J. Hydrol. 2013, 498, 153–164. [Google Scholar] [CrossRef] [Green Version]
- Bosona, T.G.; Gebresenbet, G. Modeling hydropower plant system to improve its reservoir operation. Int. J. Water Resour. Environ. Eng. 2010, 4, 87–94. [Google Scholar]
- Mower, E.B.; Miranda, L.E. Evaluating changes to reservoir rule curves using historical water-level data. Int. J. River Basin Manag. 2013, 11, 323–328. [Google Scholar] [CrossRef]
- Lee, D.R.; Moon, J.W.; Choi, S.J. Performance evaluation of water supply for a multipurpose dam by deficit-supply operation. J. Korea Water Resour. Assoc. 2014, 47, 195–206. [Google Scholar] [CrossRef] [Green Version]
- Yeh, W.W.G. Reservoir management and operations models: A state-of-the-art review. Water Resour. Res. 1985, 21, 1797–1818. [Google Scholar] [CrossRef]
- Wurbs, R.A. Reservoir-system simulation and optimization models. J. Water Resour. Plan. Manag. 1993, 119, 455–472. [Google Scholar] [CrossRef]
- Simonovic, S.P. One view of the future. Water Int. 2000, 25, 76–88. [Google Scholar] [CrossRef]
- Ranjithan, S.R. Role of evolutionary computation in environmental and water resources systems analysis. J. Water Resour. Plan. Manag. 2005, 131, 1–2. [Google Scholar] [CrossRef]
- Rani, D.; Moreira, M.M. Simulation–optimization modeling: A survey and potential application in reservoir systems operation. Water Resour. Manag. 2010, 24, 1107–1138. [Google Scholar] [CrossRef] [Green Version]
- Fayaed, S.S.; El-Shafie, A.; Jaafar, O. Reservoir-system simulation and optimization techniques. Stoch. Environ. Res. Risk Assess. 2013, 27, 1751–1772. [Google Scholar] [CrossRef]
- U.S. Army Corps of Engineers (USACE). HEC-ResSim Reservoir System Simulation User’s Manual; US Army Corps of Engineers, Hydrologic Engineering Center: Davis, CA, USA, 2013.
- Hashimoto, T.; Stedinger, J.R.; Loucks, D.P. Reliability, resiliency, and vulnerability criteria for water resource system performance evaluation. Water Resour. Res. 1982, 18, 14–20. [Google Scholar] [CrossRef] [Green Version]


| Reservoir | Type | River | Total Storage (MCM) | Effective Storage (MCM) |
|---|---|---|---|---|
| Chungju | Multipurpose reservoir | South Han River | 2750.0 | 1789.0 |
| Hoengseong | 86.9 | 73.4 | ||
| Soyanggang | North Han River | 2900.0 | 1900.0 | |
| Hwacheon | Hydropower reservoir | 1018.4 | 658.0 | |
| Chuncheon | 150.0 | 61.0 | ||
| Uiam | 80.0 | 57.5 | ||
| Cheongpyeong | 185.5 | 82.6 | ||
| Goesan | South Han River | 15.3 | 5.7 | |
| Paldang | Han River (Junction of South Han and North Han Rivers) | 244.0 | 18.0 |
| Index | Case | Chungju Reservoir | Soyanggang Reservoir | Hoengseong Reservoir | Paldang Reservoir |
|---|---|---|---|---|---|
| Time-based reliability (%) | Scenario 1 | 93.3 | 100.0 | 86.9 | 62.1 |
| Scenario 2 | 92.2 | 95.5 | 86.0 | 96.1 | |
| Evaluation | 95.8 | 85.8 | 92.3 | 95.1 | |
| Volumetric reliability (%) | Scenario 1 | 95.3 | 100.0 | 89.2 | 93.8 |
| Scenario 2 | 94.6 | 97.0 | 88.4 | 97.6 | |
| Evaluation | 97.1 | 88.3 | 94.7 | 97.8 | |
| Average resiliency | Scenario 1 | 0.027 | - | 0.018 | 0.030 |
| Scenario 2 | 0.027 | 0.030 | 0.019 | 0.048 | |
| Evaluation | 0.030 | 0.019 | 0.027 | 0.066 |
| Month | Scenario 1 (m3/s) | Scenario 2 (m3/s) | Evaluation (m3/s) | Historical Data (m3/s) |
|---|---|---|---|---|
| Jan | 3.1 | 19.6 | 4.9 | 24.0 |
| Feb | 3.2 | 19.5 | 21.6 | 23.2 |
| Mar | 5.6 | 20.8 | 23.9 | 23.5 |
| Apr | 12.9 | 24.6 | 27.3 | 27.3 |
| May | 22.3 | 38.6 | 40.1 | 46.6 |
| Jun | 34.4 | 27.3 | 22.1 | 37.9 |
| Jul | 80.1 | 72.4 | 58.7 | 79.2 |
| Aug | 81.2 | 97.3 | 92.5 | 94.2 |
| Sep | 36.2 | 60.1 | 81.4 | 56.6 |
| Oct | 1.0 | 24.1 | 30.6 | 28.1 |
| Nov | 2.6 | 12.9 | 11.9 | 14.1 |
| Dec | 1.6 | 15.4 | 17.2 | 16.9 |
| Average | 23.68 | 36.05 | 36.02 | 39.30 |
Publisher’s Note: MDPI stays neutral with regard to jurisdictional claims in published maps and institutional affiliations. |
© 2020 by the authors. Licensee MDPI, Basel, Switzerland. This article is an open access article distributed under the terms and conditions of the Creative Commons Attribution (CC BY) license (http://creativecommons.org/licenses/by/4.0/).
Share and Cite
Choi, Y.; Lee, E.; Ji, J.; Ahn, J.; Kim, T.; Yi, J. Development and Evaluation of the Hydropower Reservoir Rule Curve for a Sustainable Water Supply. Sustainability 2020, 12, 9641. https://doi.org/10.3390/su12229641
Choi Y, Lee E, Ji J, Ahn J, Kim T, Yi J. Development and Evaluation of the Hydropower Reservoir Rule Curve for a Sustainable Water Supply. Sustainability. 2020; 12(22):9641. https://doi.org/10.3390/su12229641
Chicago/Turabian StyleChoi, Youngje, Eunkyung Lee, Jungwon Ji, Jaehwang Ahn, Taesoon Kim, and Jaeeung Yi. 2020. "Development and Evaluation of the Hydropower Reservoir Rule Curve for a Sustainable Water Supply" Sustainability 12, no. 22: 9641. https://doi.org/10.3390/su12229641