Article

IT Adoption and Sustainable Growth of Firms in Different Industries—Are the Benefits Still Expected?

Department of Advanced Industry Fusion, Konkuk University, Gwangjin-gu, Seoul 143-701, Korea
*
Author to whom correspondence should be addressed.
Sustainability 2020, 12(22), 9689; https://doi.org/10.3390/su12229689
Submission received: 23 October 2020 / Revised: 16 November 2020 / Accepted: 18 November 2020 / Published: 20 November 2020
(This article belongs to the Special Issue ICT Adoption for Sustainability)

Abstract

:
This study uses data from the Korea business activity survey panel from 2008 to 2016 to examine the effects on the sustainable growth of firms that initially adopted Information Technology (IT) applications during 2010 to 2012 compared to those that did not. The effects are examined for four years after adoption and divided into areas such as sales, labor productivity, profitability, increases in male and female employment, wages, and exports. Because the effects of IT adoption are known to vary greatly depending on the industry, the manufacturing industry is divided into traditional, medium-tech, and hi-tech manufacturing, and the service industry is divided into the materials service and information service sectors; the effects on each sector are then observed. In addition, the propensity score matching methodology is used to overcome selection bias arising from a simple comparison between firms that began using IT and firms that did not. The results show that, although there was little impact on productivity, there were impacts on sales and employment and large differences were found between the industrial sectors.

1. Introduction

Many countries have supported the utilization of IT (Information Technology) applications by firms to increase the productivity of economies and to attain sustainable growth [1,2,3,4,5,6]. The Korean (South Korea) government also has implemented a policy for supporting the installation of IT applications such as ERP (enterprise resource planning), CRM (customer relationship management), SCM (supply chain management) and others to increase the informatization and to promote sustainable growth of SMEs (small and medium-sized enterprises). By 2015, the financial input to this policy accumulated about KRW 245.7 billion (Korean Won, 1 US dollar = 1156.4 KRW in 2019) [7,8,9]. The reason for the support on IT uses lies in the belief that the increased use of IT applications of firms will increase firm productivity, and eventually lead to firm growth and job creation [10], which is vital to the sustainable growth of the economy. However, previous literatures are showing that the existence or extent of the effects of adopting corporate IT applications varies by country, industry, firm characteristics and environment, and time of adoption [6,11,12,13].
In the case of Korea, a few studies exist which analyzed the effects of the IT applications adoption by companies using firm-level data in the early 2000s [7,8], and they are showing conflicting results. Shin [7] measured the effect of ERP and CRM adoption by SMEs (small and medium-sized enterprises) using data from 2000 to 2001 and observed insignificant or negative effects on the productivity of firms. Sohn and Yang [8] analyzed a surveyed data on firms in 2004 and found that IT utilization affected positively on the sales and productivity of firms. However, firm-level studies on the effects of IT application adoption after 2010 are difficult to find. Meanwhile, according to Statistics Korea, the percentage of firms using IT applications in Korea increased from 41% in 2006 to 64% in 2014.
This study attempts to fill this research gap. The purpose of this study is to observe the mid- to long-term effects on Korean firms starting to use IT applications in the early 2010s from various perspectives related to the sustainable growth of firms. We tried to observe whether firms starting to utilize IT expanded sales, whether productivity increased, and whether there have been changes in employment. We also observed whether these results are different by industry. The results of this study are expected to have policy implications by providing industry-specific feedbacks to assist in adjusting the support policies.
Using a complete survey database of all Korean firms with more than 50 permanent employees and capital of over KRW 300 million (Korean Won), this study explored whether there were additional impacts for the sustainable growth of firms that first began using IT applications between 2010 and 2012 compared to those that did not. The impacts were examined in terms of firm performances (sales, productivity, profitability, and export) and employment (increases in employment, wage level, and female employment) for four years after the adoption of IT applications (since the firm database was available until 2016, observing the effects of the adoption beyond 2012 was not possible). All industries were classified into five industrial sectors (traditional, medium-tech, and hi-tech manufacturing, and material, and information service), and the effects on each sector are observed and compared. The results show that, although there was little impact in terms of productivity, sales and employment were impacted and large differences were found between industrial sectors. Sales increased in traditional manufacturing and the information service sector through IT adoption. Increased exports and enhanced profitability were observed in the hi-tech manufacturing sector. An increase in employment was observed only in the information service sector. And it was difficult to observe statistically significant changes due to adoption of new IT applications in the medium-high-tech and material service sectors.
From a methodological perspective, it is expected that firms that will adapt IT are differ in many ways from those that will not. Simply comparing such different groups results in a selection bias problem [14], and, in this study, the propensity score matching (PSM) methodology is applied to solve this problem.
The remainder of the study is organized as follows. In Section 2, the research background and literature review are discussed, and, in Section 3, the data and methodology used in the analysis are introduced. In Section 4, the basic statistics and analysis results are described and discussed, and, in Section 5, the research results are summarized and policy implications are derived.

2. Research Background and Literature Review

2.1. IT Utilization of Firms and Supporting Policies in Korea

According to the International Telecommunication Union (ITU) [15,16], Korea had the number one ICT development index in 2010 and was ranked number two in 2017; it has continuously maintained top rankings for IT infrastructure and utilization worldwide. Through the Survey of Business Activities, Statistics Korea investigates the IT applications used by firms by classifying them into seven categories (the seven categories of corporate IT applications are ERP (enterprise resource planning), LMS (learning management system), KMS (knowledge management system), HRMS (human resource management system), CRM (customer relationship management), SCM (supply chain management), and B2BI (business-to-business integration)). Figure 1 shows the proportion of firms that used at least one IT application between 2006 and 2014. The proportion of IT-utilizing firms increased sharply from 41% in 2006 to 61% in 2010 and 64% in 2014.
To increase the productivity of small and medium enterprises (SMEs) with low informatization levels, many governments in developing and developed countries have been implementing policies that support IT application installations for SMEs [1,2,3,4,5,6], since the growth of SMEs is requisite for the sustainable growth of the economy. The Korean government has also been implementing policies that support adoption of IT applications (such as ERPs) to increase the IT utilization level of SMEs. One typical policy is the “IT Support Program for 30,000 SME,” which was conducted from 2001 to 2003 [17]. However, this policy was later much criticized because the program focused only on achieving the numerical objective of supporting 30,000 companies; consequently, cheap standardized and packaged software was supported. In fact, some SMEs that received support from the program could not utilize the software due to lack of capability, while others received packages that were not suitable for the company’s characteristics. Furthermore, the excessive support by the public sector resulted in a collapse of the private IT software vendor industry.
Despite these criticisms and difficulties, the Korean government continues to support the installation of IT applications by SMEs [18]. By 2015, the amount of financial support from the Korean government accumulated to KRW 245.7 billion [7,8,9]. In particular, such support has recently been provided in the goal of SMEs’ job creation as well as productivity growth. The impact of firms’ IT utilization on employment is a matter the government should carefully consider for the sustainable growth of the economy. The employment rate in Korea was lower than the OECD (Organization for Economic Cooperation and Development) average in 2016, and the female and youth employment rates were particularly low [19]. Launched in 2017, the Moon Jae-in Administration views employment growth as an important political objective, and is investigating the impacts of all executed policies on employment [20,21].

2.2. Literature Review

Studies on the impact of IT application on firms’ performance and employment vary according to the analyzed country, analysis period, measurement of companies’ IT application, and performance indicators. Table 1 summarizes recent studies published after 2013.
In terms of analyzed countries, studies on the impact of IT application on companies have mainly been conducted in EU and developing countries [3,11].
The levels of firms’ IT application were usually measured in terms of whether specific applications such as ERP and SCM are used. In the cases of developing countries, basic IT applications such as email communication and corporate websites were also used for the measurement [26]. The effects of adopting IT application were observed mainly from the perspective of productivity [3,11,22,26], and some studies assessed the effects from the perspectives of employment, profitability, and exports [12,24,25].
Meanwhile, IT investment could take some time to cause changes to companies. Brynjolfsson and Hitt [27] claimed that total factor productivity reaches a maximum four to seven years after utilizing IT. Taking this into consideration, the effects of IT should be analyzed by reflecting time-lags between adoption and effect, but it seems that most previous studies, which used regression analysis, observed the same-year correlation without considering time-lags [22,26] or only reflected lagged effects of one to two years [24,25]. Schryen [28] also emphasizes the lack of empirical analyses investigating the long-term effect of IT adoption by organizations. One exception can be found in Das et al. [29] which observed the effect for six years after the adoption. However, the panel data used in Das et al. [29] consists of only 47 hospitals.
Looking at major findings, the positive impact of IT adoption on corporate performance was more notable in developing than in developed countries during the analyzed periods (mainly after the 2000s) [11,26]. In developed countries, IT adoption had no visible effects [30], had positive effects on certain industries [12,23], or had greater positive effects on companies whose size is larger, level of IT utilization is higher, and productivity is higher, consequently increasing productivity dispersion [3].
The present study has incremental value compared to previous studies suggested in Table 1. First, using multi-year panel data of Korean firms, it observed performance changes in firms that began adopting IT in the early 2010s. Many studies have recently observed the impact of IT application on firms in EU (European Union) countries and developing countries [11,12,22,23,24]. This study focused on Korea, an East Asian country, which has rarely been examined in previous studies (except for [7,8]). The effects of IT adoption vary a lot by countries since the organizational culture and degree and characteristics of utilizing IT is different for each country [26,31]. Studies on EU countries revealed large differences between countries in the economic bloc [3]. Paunov and Rollo’s [11] study on 117 developing countries reported no positive effects of IT utilization at the industry level in the East Asia Pacific and South Asia regions as opposed to other regions. Moreover, firms that began using IT applications such as ERP (enterprise resource planning) in the early 2010s may be seen as late adopters. There are few studies focusing on these laggards. In terms of analyzed countries and firms, the present study examined what few previous studies have touched upon.
Second, this study observed the effects of firms’ adoption of IT using various indicators. The effects of adopting IT applications have been investigated mainly from the perspective of productivity, and some studies focused on employment, profitability, and exports [3,11,12,22,24,25,26]. However, the firm panel data used in the present study included detailed qualitative and quantitative indicators, which allowed changes in performance to be examined from diverse perspectives. The present study examined the outcomes of utilizing IT using various indicators such as labor productivity, revenue, profitability, men and women’s employment, wage level, and export, under the same framework. In addition, many studies [7,25,32] claim that a certain period of time is required to achieve performance changes after a firm adopts IT. Considering this, the present study observed the effects for four years after the adoption, which makes it possible to investigate the impact of IT application on companies in the medium term from diverse perspectives.
Third, this study examined the effects of IT adoption by industries that each firm belongs to. Changes in firm performance due to IT utilization are known to vary greatly depending on the firm’s industrial sector [12]. Going beyond previous studies [23,33] that mainly focused on comparing manufacturing and service industries, the present study divided the entire industry into the five industries of traditional, medium-tech, hi-tech manufacturing, material, and information service (as in [12]) and analyzed and observed the impact in each industry.

2.3. Research Questions

Based on the above background of Korea, the present study attempts to answer the following questions related to the sustainable growth of firms by exploring whether there were additional impacts on firms that first began using IT applications between 2010 and 2012 compared to those that did not.
First, what impact did the adoption of IT applications have on the firm’s employment? If employment increased, did it increase more for male or female workers? How did the wage level change? A firm’s IT utilization is known to lead to a skill-biased technological change [34,35]; that is, unskilled labor performing routine tasks is replaced while demand for labor to perform non-routine tasks and problem solve increases. Additionally, flexible working hours and telecommuting facilitated through a firm’s IT utilization creates a female-friendly workplace [36,37,38], which increases women’s participation in the labor market. On the other hand, Atasoy et al. [39] pointed out that, in Turkey, because the proportion of women receiving IT education is small, it is difficult for women to benefit from employment growth led by IT utilization.
If a labor substitution occurred due to the firm’s IT adoption, it could have a negative effect on employment. On the other hand, if firm activities and sales increased because of improved productivity or strengthened marketing capabilities resulting from IT adoption, there could be a positive effect on employment. If skill-biased technology change occurred, higher average wage level could be observed [25]. The newly created jobs might be filled by men since they are more likely to have received IT education at a university. However, if the firm became a more female-friendly workplace due to IT utilization, female employment might increase.
Second, has the firm’s productivity increased due to the adoption of IT applications? According to Alderete [1], IT’s contribution to a firm’s productivity is of critical importance, combined with complementary capital such as human capital, organizational capital, and knowledge stock. However, even when a firm adopts an IT application, it will be difficult to increase productivity if human skills, capacity, and organizational reforms do not also occur. Gal et al.’s study [3] on 19 EU countries found that the adoption of IT increased productivity of companies at the frontier, thereby raising the productivity dispersion of the entire economy. For laggard firms, the adoption of IT did not lead to higher productivity due to lack of complementary capital investment. Furthermore, it suggested that, as the first significant wave of IT adoption and its consequential productivity revolution had occurred before 2000, productivity gains from IT utilization were relatively difficult to be observed afterward. In the present study, the Korean companies, which adopted IT applications such as ERP for the first time after 2010, can be regarded as laggards. It would be interesting to observe how these companies evolve after their IT adoption in terms of productivity gains.
Third, has firm performance (other than productivity) increased due to the adoption of IT applications? This study examined the impacts of IT adoption on firms from multiple perspectives, such as sales, exports, and profitability. Clayton et al. [40] suggested that firms that adopt IT late are more likely to have goals of attracting more customers and expanding their business activity area rather than a goal of increasing productivity. In terms of exports, Hagsten and Kotnik [24] analyzed SMEs in 12 EU countries and found positive impacts of IT capacities in exporting activities of SMEs (although varying across countries). In terms of profitability, Neiroti and Paolucci [12] analyzed 186 large Italian enterprises and observed that there was higher profitability due to competitive advantage when companies in low-information sensitive industries adopted IT and expanded their IT-based capability. In short, the adoption of IT may bring about various forms of outcomes in addition to higher productivity, which this study attempts to discern.
Fourth, are the impacts examined above different among industrial sectors? Neirotti and Paolucci [12] noted that the impact of IT adoption was largely dependent on industrial characteristics (such as complexity of products and production processes), and Neirotti and Paolucci [41] observed a sizeable positive effect from IT adoption when the firm belonged to an industry where the IT adoption rate was relatively low. However, although multiple arguments support the existence of differences in effects by industry, there is still a limited amount of empirical firm-level evidence on industry-specific effects of IT adoption [42,43], and some existing literatures are crudely comparing manufacturing and service sectors [23,33]. This study examined whether the impact of IT adoption is different among the five industrial sectors classified.

3. Data and Methodologies

3.1. Data and Variables

The DB of firms used in this study is the survey of business activities DB of Statistics Korea. The survey of business activities DB includes comprehensive data from a survey that not only collects financial information, such as sales, number of employees, assets, and liabilities, but also business strategies, such as IT application utilization/non-utilization, strategic alliances between companies, outsourcing, existence of a parent or daughter company, and foreign ownership. The survey of business activities began in 2006 and is conducted every year. Since a complete survey is conducted for firms with more than 50 permanent employees and capital of over KRW 300 million, the proportion of firms that enter or drop out of the DB is low, facilitating the long-term observation of panel data. Table 2 shows the descriptive statistics of the survey of business activities for the selected years (monetary values were deflated using the GDP deflator with 2010 as the base year.) In 2013, the total number of firms was 11,572, and each year 5.5% of firms newly entered the DB and 5.3% of firms dropped out. Thus, a relatively stable panel structure was maintained. The average sales of firms in 2016 was about KRW 208 billion and the average firm age was about 22 years. Earnings before tax (EBT) were about 4.9% of sales in 2016 and the average number of employees increased from 290 in 2007 to 357 in 2016. About a half of all firms were conducting R&D, and about half of the firms owned patents or utility model rights.
Neirotti and Paolucci [12] argued that the information intensity of production processes, products and process innovation varied depending on the industrial sector, and, consequently, firm performance due to IT utilization was different between industrial sectors. Consistent with Neirotti and Paolucci [12], all industries were divided; explanations of each industrial sector are provided in Table 3.
In the survey of 2016, the agriculture, forestry, and fishery sectors and mining sector accounted for 0.3% of all firms, while traditional manufacturing accounted for 21.0%; medium-tech manufacturing, 16.4%; high-tech manufacturing, 11.7%; material service sectors, 25.2%; and information service sectors, 25.4%. Since the agriculture, forestry, and fishery sectors and mining sector were less than 0.5% of all firms, they were excluded when the sectoral analysis was conducted.
The seven IT applications related to the utilization/non-utilization of e-business systems in the survey of business activities DB were used to examine the impact of a firm’s IT application utilization on firm performance. Table 4 provides the definitions for the seven applications.
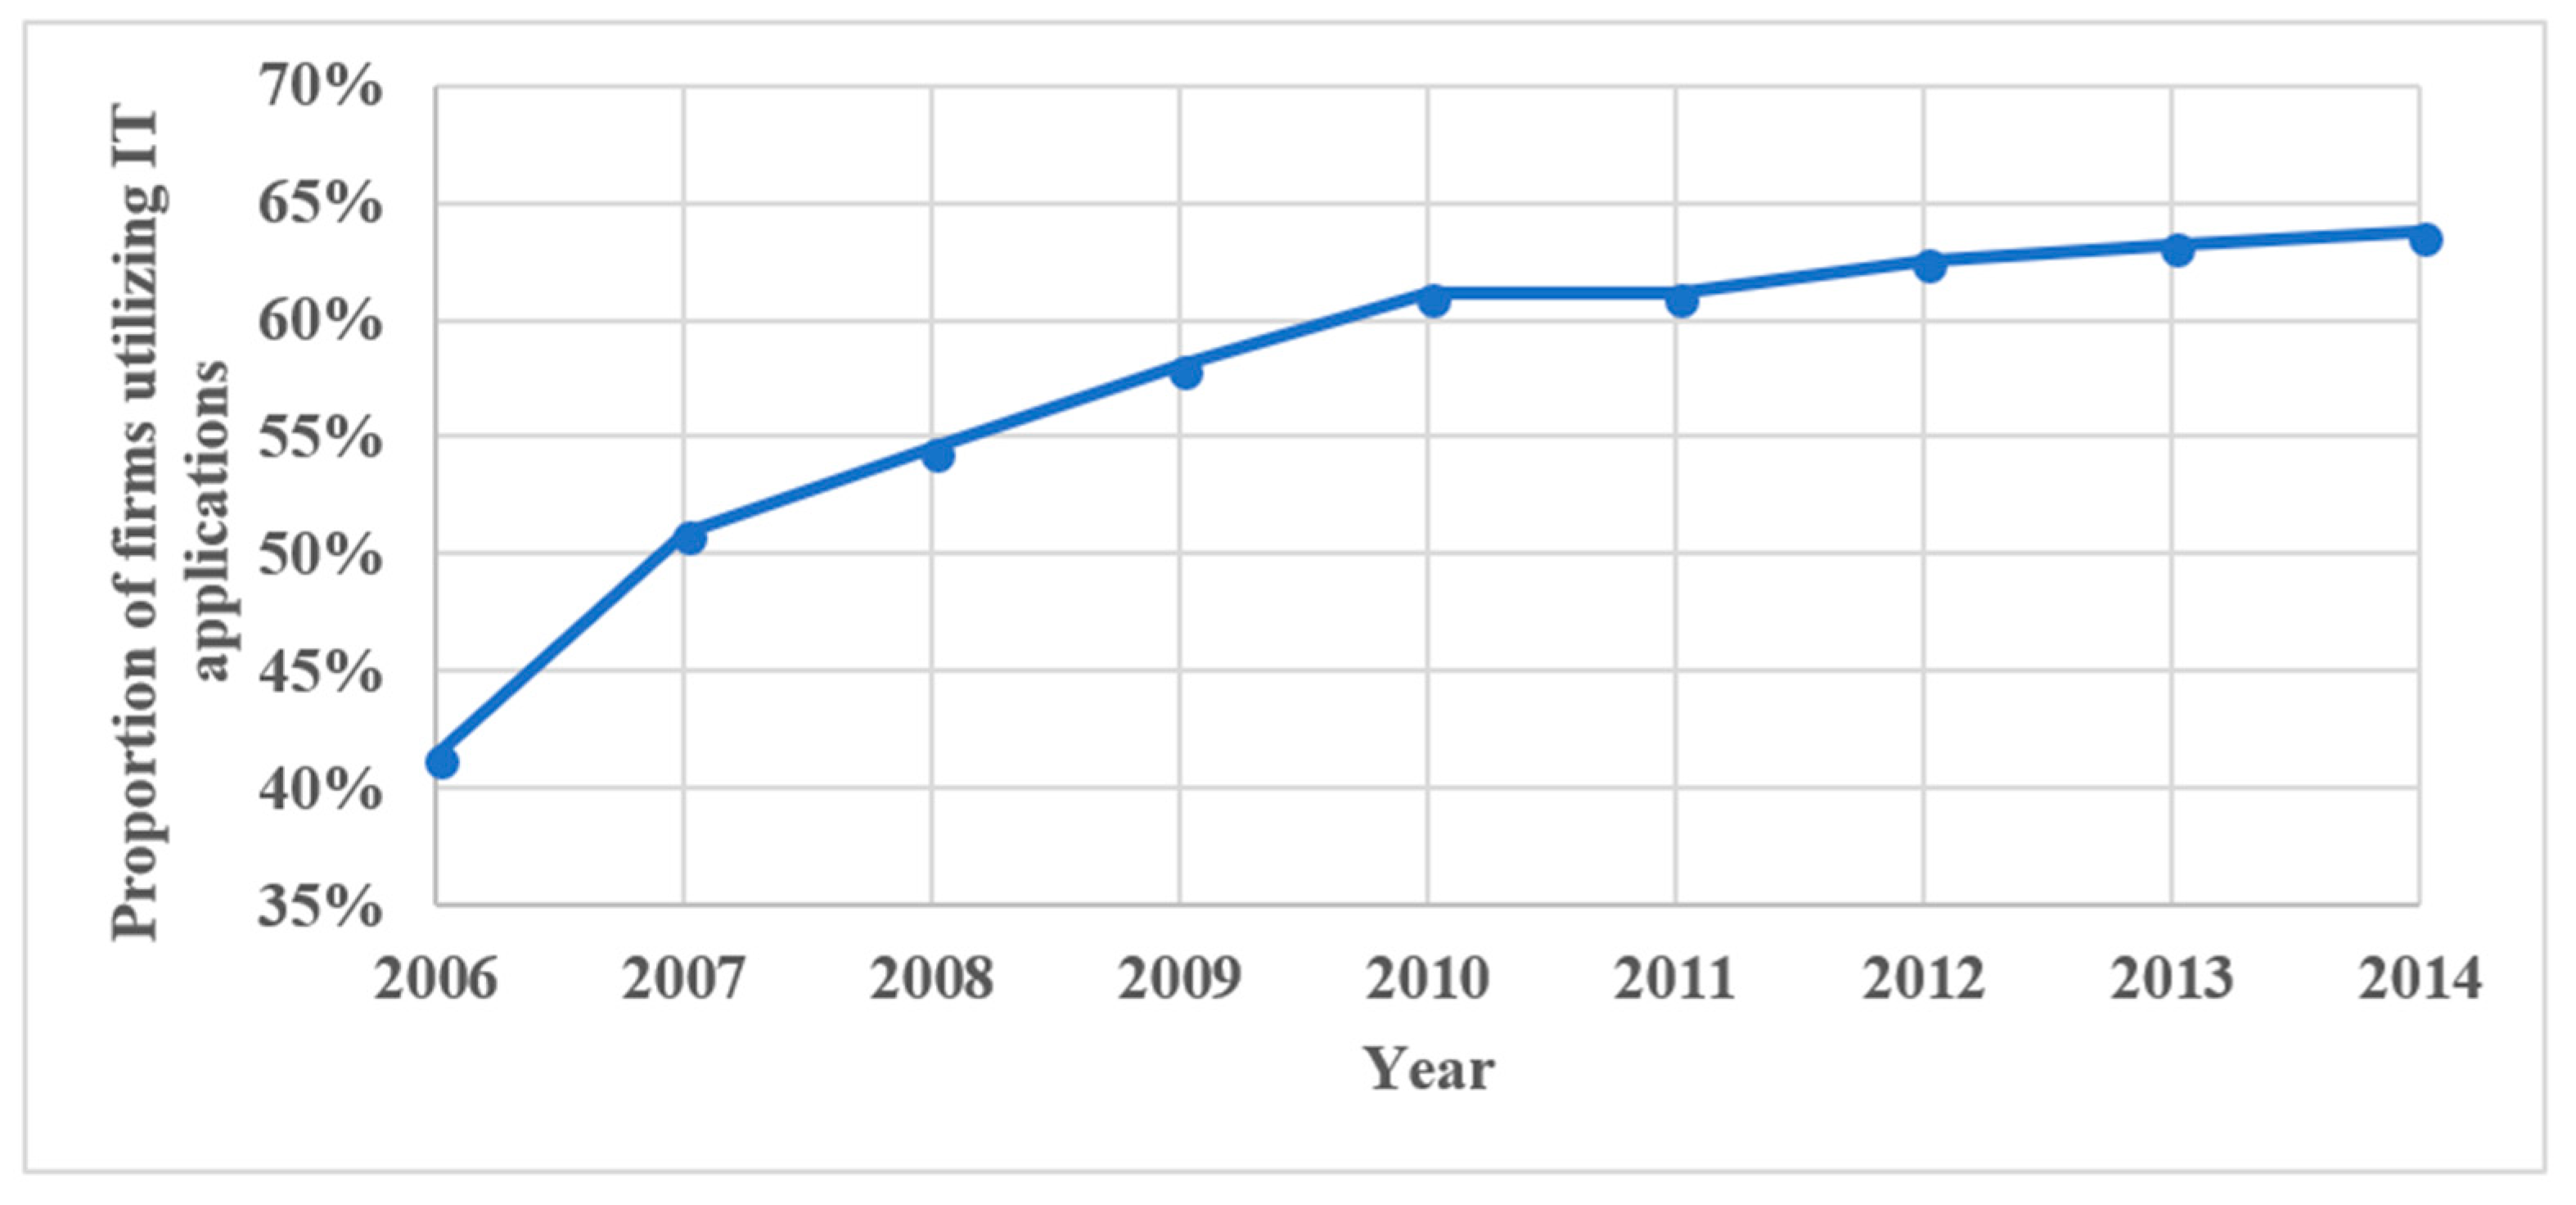
Figure 2 shows the proportion of firms using at least one of the IT applications each year and in each industrial sector. From 2006 to 2014, the proportion of firms using IT applications increased in every industrial sector. In 2014, the proportion using IT was high in the high-tech and medium-tech manufacturing sectors, about 76% of firms. This was followed by the traditional manufacturing sector, where about 70% of firms were using IT in 2014. The proportion of firms in service sectors utilizing IT applications was lower: about 57% for the material service sector and about 51% for the information service sector; the agriculture, forestry, and fishery sectors had the lowest IT application utilization.
Table 5 shows the applications primarily used by IT-utilizing firms in each industrial sector (since there were firms that used two or more applications, the total exceeded 100%.) ERP systems were most used in the manufacturing sector (among manufacturing firms utilizing IT, 94% had adopted an ERP), and applications related to transactions among businesses such as B2BI and SCM were also actively used. In the service sectors, the most utilized application was also ERP (among service sector firms utilizing IT, 78.5% had adopted an ERP) and other applications suitable for the sector’s characteristics were also actively used. Technologies related to customer management or internal human resource management were actively used in the information service sector: CRM, HRMS, and LMS were used by 27.4%, 19.9%, and 5.5% of firms, respectively. Furthermore, 14.2% used KMS to manage the firm’s accumulated knowledge in the information sector. In the material service sector, CRM and HRMS were also important: 20.3% of firms were using CRM and 15.3% of firms were using HRMS.

3.2. Definition of IT-Starting Firms and Non-IT Firms

To examine the changes after the adoption of IT applications is initiated, the present study defined IT-starting firms and non-IT firms as follows. First, companies that indicated they do not use IT applications were selected from the firm panel database. The selected companies (with no IT applications) were divided into those that began to use at least one IT application and those that did not in the following year, and the performances between two groups are compared.
That is, in the actual analysis, the performance of firms that began utilizing IT were compared to firms that continued not to utilize IT. Among the firms not using any of the IT applications (the seven applications are explained in Table 4) in period (t − 1), those that started using at least one IT application in period t were labeled “IT-starting firms,” and firms that still did not utilize any IT applications in period t were labeled non-IT firms. These labels will be used throughout this study.
The rationales for this analysis strategy are as follows. First, it is necessary to clearly define the IT adoption of the companies, of which the study tries to investigate the effectiveness. Companies continuously carried out the investment in and use of IT applications as a type of management activity [31]. Although the same type of IT applications is used, the degree of usage and technological level could be different depending on companies. Therefore, when examining the effects of using IT application across the entire firm list, it is difficult to discern whether the IT applications they are using are being implemented for the first time or for years, whether their technological level is high or low, and whether their IT utilization level is on increasing or decreasing. Moreover, the meaning of changes in performance by year after IT adoption becomes vague. Therefore, instead of analyzing the entire firm list, the current study examined the impact of IT applications after adoption by companies that initially did not use them. This method enables comparison between IT-starting firms and non-IT firms as all companies have no IT applications at the initial stage.
During the analysis period, 83.3% of IT-starting firms began using IT applications by introducing ERP systems. In addition, the ratios of companies that adopted B2BI, CRM, HRM, LMS, SCM, and KMS as their first IT utilization are 13.0%, 9.2%, 8.7%, 5.4%, 4.2%, and 2.0%, respectively. (Since there were firms that began using two or more applications, the total exceeded 100%.)
A total of 80.2% of IT-starting firms initiated their IT utilization by adopting one single IT application, 15.8% chose two at the beginning, and 4.0% introduced more than three.
T-tests were performed by comparing the characteristics of IT-starting firms and non-IT firms before the adoption of IT (year t − 1) for each industrial sector (shown by pooling for t = 2010, 2011, 2012); the results are shown in Table 6. First, comparing firm populations between Table 6 and Table 2, the companies with no IT utilization in Table 6 are much smaller compared to the entire list of companies in Table 2, and have an average of fewer than 200 employees, falling into the category of SME. Meanwhile, looking at Table 6, although there were differences between the industrial sectors, sales and the number of employees of IT-starting firms were larger than those of non-IT firms, and it can be seen that labor productivity was higher, profitability was higher, the debt ratio was lower, and the patent application rate was higher due to more R&D. Furthermore, in many cases, there was a sister or parent company, and the firms provided various incentives to employees. That is, firms that were competitive in size and other financial indices started using IT [24,44].
It can also be seen that the shapes of IT-starting firms and non-IT firms were different even before the use of IT, and a performance evaluation of IT utilization through a simple comparison between the two groups will lead to selection bias. The PSM methodology used in this study is known as appropriate for solving such a selection bias problem [45,46].

3.3. Methodologies

In this section, we introduce propensity score matching, which was adopted to measure the effect of IT utilization. The effect of a certain treatment (such as IT application adoption in this study) on a firm can be measured as the value added created by receiving the treatment. The effect of a treatment on a firm can be described as “What would have happened to those firms who, in fact, did receive the treatment, if they had not received it?” Hence, a mere comparison between a treated firm group and untreated firm group cannot identify the exact additional effect from the treatment, since their characteristics before receiving the treatment were already different (which is generally referred to as selection bias). Modern evaluation methods are focused on estimating this counterfactual [47]. Given the counterfactual problems, the most appropriate measure of effectiveness of a treatment on a firm might be a comparison of the performance of two firms with the same characteristics, where one received the treatment and the other did not. However, it is hard to find an appropriate comparison group to represent the untreated firms so the effect of the treatment can be evaluated. We apply the propensity score matching (PSM hereinafter) methodology in this study, which allows us to construct a comparison group by matching firms based on the propensity score of firms in the population of the untreated firm group. We expect this approach to solve the selection bias problem and to enable a comparison of the factual and counterfactual to estimate the outcome from IT adoption.
The PSM methodology was first introduced by Rosenbaum and Rubin [48]. The concept of PSM requires fulfillment of the conditional independence assumption (CIA). This means that conditioned on the observable characteristics (X variables) of firms, the decision to receive the treatment should be independent of the potential outcome measures. CIA in this respect can be written as follows:
( Y 0 , Y 1 ) T | X
where denotes independence, Y 1 indicates the potential outcome of the treated firm, and Y 0 denotes the potential outcome of the untreated firm. T is an indicator variable denoting receipt of the treatment. If these assumptions are satisfied and a sufficient number of observable variables related to the characteristics of the participants exist, it is theoretically possible to obtain an unbiased estimation of the treatment effect. A propensity score indicates the conditional probability that firms receive a treatment when observable characteristics (covariates) of participating firms are given. In other words,
Propensity   score = P ( X ) = Pr ( T = 1 | X )
Rosenbaum and Rubin [46] proved that under CIA, with the propensity score defined as in Equation (2), all biases due to observable variables can be removed by conditioning solely on the propensity score.
( Y 0 , Y 1 ) T | P ( X )
Based on Equation (3), for a population of firms denoted by i, we can define the effect of a treatment, which is expressed as the difference between real and counterfactual outcomes, as the average effect of the treatment on the treated (ATT) as follows:
A T T = E { Y 1 i Y 0 i | T i = 1 } = E { E ( Y 1 i Y 0 i | T i = 1 , P ( X i ) ) } = CIA E P ( X i ) { E ( Y 1 i | T i = 1 , P ( X i ) ) E ( Y 0 i | T i = 0 , P ( X i ) ) | T i = 1 } ,
where the outer expectation is taken over the distribution of P ( X i ) in the population of treated firms, T i = 1 . ATT is the difference in average outcomes of the treated and untreated firms, where the untreated firm group is formed by matching units based on the propensity score.
The propensity score (PS) is normally obtained through logistic regression, which uses various observable firm variables that affect the treatment assignment prediction as covariates. In recent PS estimations, the importance of the role of the PS in balancing covariates has been emphasized. The covariate balancing condition stipulates that there should be no significant difference in covariate values between the matched treatment firm group and untreated firm group, using the PS as a weight. In this study, we use the covariate balancing propensity score (CBPS) methodology recently developed by Imai and Ratkovic [46]. In the CBPS methodology, the balance condition is incorporated during PS estimation and parameter values are estimated to achieve balance.
According to Imai and Ratkovic [46], using logistic regression, the propensity score is expressed as follows.
π β ( X i ) = exp ( X i T β ) 1 + exp ( X i T β )
Maximizing the log-likelihood function in Equation (5), parameter β is estimated as follows.
β M L E = arg max β i = 1 N T i log { π β ( X i ) } + ( 1 T i ) log { 1 π β ( X i ) }
In Equation (6), if π β ( ) is twice continuously differentiable in β , the following first order condition can be obtained.
1 N i = 1 N s β ( T i , X i ) = 0 , s β ( T i , X i ) = T i π β ( X i ) π β ( X i ) ( 1 T i ) π β ( X i ) 1 π β ( X i )
Here, π β ( X i ) = π β ( X i ) / β T . Equation (7) can also be interpreted as a balancing condition for π β ( X i T β ) , which is a function of covariates. Equation (7) can be rewritten as follows:
1 N i = 1 N T i π β ( X i ) π β ( X i ) = 1 N i = 1 N ( 1 T i ) π β ( X i ) 1 π β ( X i )
In Equation (8), the left-hand side is the weighted average (with a weight of T i π β ( X i ) ) of π β ( X i ) for the treated firm group, and the right-hand side is the weighted average for the untreated firm group.
Meanwhile, the property for covariate balancing can be expressed as follows using the concept of inverse propensity score weighting.
E { T i X ˜ i π β ( X i ) ( 1 T i ) X ˜ i 1 π β ( X i ) } = 0
Here, X ˜ i is a function of covariate X i . Then, Equation (9) becomes a special case for Equation (7), where X ˜ i = π β ( X i ) .
If ATT is to be obtained, then it is recommended that the weighted covariate distribution of the untreated firm group be equal to that of the treated firm group. In this case, covariate balancing can be expressed as in Equation (10). Equation (10) can be interpreted as the average difference of a function of the covariates after standardized mortality ratio weighting.
E { T i X ˜ i π β ( X i ) ( 1 T i ) X ˜ i 1 π β ( X i ) } = 0
The CBPS method uses a generalized method of the moments methodology with an iterative computational procedure to find estimates for β that best optimize the likelihood condition (i.e., specified likelihood function) and the balance condition (i.e., specified balance function) simultaneously. Finally, for each respective covariate, we estimate the PS that is balanced between the treatment firm group and the untreated firm group.
However, estimation of the propensity score alone is not sufficient to estimate the ATT of interest. This is because the probability of observing two firms with exactly the same PS value is in principle zero, since P(X) is a continuous variable. Various matching methods have been proposed in the literature (see Caliendo [14] for reviews), and we applied the recently developed radius matching method with bias adjustment, suggested by Huber et al. [45]. The radius matching method matches a treated firm with all untreated firms within a certain radius, when matching based on the PS. Compared to 1:1 pair matching, in radius matching, one treated firm can be matched with multiple untreated firms, lowering the variance of the estimated ATT and increasing the efficiency of the estimator.
In this analysis, treatment was defined as newly adopting IT applications. The analysis was conducted by pooling IT-starting firms and non-IT firms for 2010, 2011, and 2012 (since the matching procedure requires two years of data before the adoption of IT application, and we observed outcomes up to four years after the adoption, we used firm DB from 2008 to 2016). Pooling was used for two reasons: first, to increase the number of observations, thereby increasing the statistical significance of the results. The second reason is that there were no major policy or macroeconomic changes in the pooled years, leading us to believe that there would not be large differences in the treatment impact across the years. The pooled data were divided into five industry types according to the industry classifications in Table 3, and the CBPS methodology was applied to each respective industry to estimate the PS. Table 6 shows the number of IT-starting firms and non-IT firms in the pooled data by industry. There were 292 and 2169, respectively, in traditional manufacturing, 186 and 1198 in medium-tech manufacturing, 145 and 902 in hi-tech manufacturing, 310 and 3332 in material service, and 228 and 3811 in information service, respectively.
In PS estimation, Li [49] and Steiner et al. [50] recommend including not only the variables related to treatment as covariates, but also the many variables related to a firm’s potential outcome. In addition, when using company data for matching, McKenzie [51] recommends using not only data of the year prior to the treatment year but also data from years as far back as possible. Therefore, in this study, numerous variables related to a firm’s IT adoption and potential outcome were used as covariates in matching, and growth rates before IT adoption (comparing 1 year and 2 years before IT adoption) were also included. The covariates used were selected based on previous literature [25,32,41,52]. Table 7 presents a list of the covariates used in the analysis. Using the estimated PS, the calculated covariate balance between the IT-starting group and non-IT group was examined using the standardized mean difference method proposed in Greifer [53]. Since the difference between the groups was less than the threshold of 0.1 for all covariates, the covariate balance was judged to be appropriate. Additional diagnostic plot and statistics on matching used in the study are summarized in Appendix A.
Using the obtained PS, radius matching employed in Huber et al. [45] was used to obtain the industry-specific ATT. When matching using the PS, IT-starting firms and non-IT firms were forced to match within the same year. Three times the 90% quantile of the PS distance distribution (calculated from 1:1 pair matching of each IT-starting firm to the non-IT firm population) was used for the radius. Non-IT firms within the radius were weighted proportionally to the inverse of their distance to the respective IT-starting firm they were matched to when computing the local mean outcome. The weights obtained from the matching were used in a weighted linear regression to remove biases due to mismatches (see Huber et al. [45] for more detail on the matching protocol).
We observed differences in growth of sales, labor productivity (value added per employee), profitability (earnings before tax per sales), number of employees, number of male and female employment, wage level (total labor cost per employee), and export between the IT-starting firm group and the non-IT firm group. The performance indicator was determined as the difference between firm performance in year t + 1 to year t + 4 and that of year t − 1 to determine the ATT of firms utilizing IT compared to firms that did not.

4. Results and Discussions

4.1. Results

The results of the analysis by industry using the methodology described above are shown in Table 8, Table 9, Table 10, Table 11 and Table 12.
The results of the traditional manufacturing sector are shown in Table 8. Significant effects were seen in sales two years after adoption of an IT application and continued for four years after adoption. On the other hand, there were no large effects related to labor productivity, profitability, exports, or employment growth. There was a significant increase in wage level compared to non-IT firms four years after IT implementation. In the traditional manufacturing sector, firms were able to enjoy competitive advantages through IT adoption, such as increased sales through the expansion of business areas, more connections with consumers, and the like. In addition, the use of IT applications and increase in sales per employee increased demand for higher levels of human capital, resulting in a long-term increase in wages.
The results of the medium-tech manufacturing sector are shown in Table 9. In this sector, there were no significant effects of IT adoption for any of the performance indicators. In the medium-tech sector, where the complexity of products and production processes is relatively low, the benefits from IT adoption are not large. However, considering the nature of this industry, which produces various intermediate products such as basic chemical products and motor vehicle equipment, firms with vertical integration in their value chain might have adopted IT applications such as ERPs or SCM as standardized software packages, depending on their needs. According to Neirotti and Paolucci [12], while the adoption of such packaged IT applications keeps firms from falling into a competitive disadvantage, it is unlikely to result in significant long-term effects such as increased productivity. This study’s results reflect a similar situation.
The results of the hi-tech manufacturing sector are shown in Table 10. For this sector, significant results can be seen in exports and profitability; however, no significant differences were observed in sales, productivity, or employment. The hi-tech manufacturing sector is known for high product and production process complexity and benefits from specializing through IT [12]. The effects of IT adoption in exports were observed for three years after adoption but were not observed in the fourth year. In the fourth year, the ratio of net profit to sales showed a significant difference in growth rate compared to non-IT firms. IT-starting firms in the hi-tech manufacturing sector strengthened integration with overseas firms through IT. It became possible for them to produce and deliver products tailored to the demands of high-complexity overseas products, resulting in short-term export growth. In addition, the production of high value-added products also led to increases in profitability four years after adoption.
The results of the material service sector are shown in Table 11. In this sector, no significant effects were found for any of the performance indicators. Businesses such as hotels and restaurants have low complexity, resulting in low benefits from IT application adoption. While IT is actively used in industries such as retail, wholesale, transport, and logistics, it is limited by the fact that the industry’s output is not informational but physical products. In addition, we believe that, since IT-starting firms in the analysis period of 2010–2012 adopted IT relatively late, the subsequent changes in organizational structure and increase in productivity were not large.
The results of the information service sector are shown in Table 12. Immediate effects were seen in sales, which continued for four years. In addition, this was the only industry that showed effects on employment. The number of employees increased immediately, and four years later showed a significant difference in growth rate compared to non-IT firms. Male workers were the primary beneficiaries of new employment. The information service sector includes scale-intensive information networks (e.g., telecom, financial services, and call centers) and specialized suppliers/science-based services (e.g., most business services and software firms). IT is the core technology for industrializing services because it aids in automating processes and outsourcing commodity tasks. As a result, IT adoption is mainly driven by strategic necessity, leading to changes in organizational structure and human resources. In addition, Table 5 shows that the IT applications utilized in this industry, such as LMS, KMS, HRM, and CRM, are more diverse than in other industries and are used to manage, develop, and utilize firm-level knowledge, customers, and human resources, reflecting high use of technology. It has been shown that there is much opportunity to gain benefits by implementing complex organizational technology.

4.2. Discussions

The present study found that productivity gains of adopting IT were not observed across all industries. Similar results were suggested by Shin [7] in his study on Korean SMEs’ ERP adoption and Gal et al.’s [3] study on EU countries from 2010 to 2015. Both Gal et al. [3] and Shin [7] explain the reasons as follows. When a small/medium firm adopts an IT application, the human capital improvement and process redesign needed for a productivity increase are difficult to achieve in a short period, and the firm may have insufficient organizational capacity to utilize the IT application system. Vial [54], through a literature review, claims that investment on IT infrastructures should accompany changes in value creation paths in firms, such as newly creating value propositions, networks and digital channels, in order to realize changes in organizational performances. Changes in organization structure in terms of culture, leadership and employment skills are also necessary. Conboy et al. [55] argued that enhanced abilities in business analytics should be utilized to increase the dynamic capabilities of firms to sense and seize the opportunities and to transform organizational structures, knowledge, and assets. In terms of the dynamic capabilities view, Mikalef and Pateli [56] argues that the impact of IT enabled dynamic capabilities on competitive performance is mediated by organizational agility, which is a capability to address unexpected changes in the business environment. The importance of the external environment is also emphasized. Mikalef et al. [57] show that IT flexibility (such as level of IT standardization, digital reach and scalability) and IT governance decentralization are important drivers for the enhancement of IT-enabled dynamic capabilities. In terms of the resource-based view, Wade and Hulland [58] emphasized the necessity of complementary human and business resources for better performance of the IT-based resources. Wade and Hulland [58] also point out the role of top management commitment and organization structure as moderators between IT-based resources and firm performances.
To help lagging firms catch up with frontier firms in terms of productivity, it is necessary to provide policy supports such as increasing the supply of IT-skilled workers in the labor market, improving access to financing, and lowering entry barriers where large incumbents have built industry barriers [3].
From the perspective of employment, IT adoption has shown immediate and long-term effects only in the information service sector. Given that IT is a core technology of the information service sector, it can be argued that, as business activities increase, relevant IT applications have been adopted, eventually creating demand for new workers who are able to operate the new tools. In terms of changes in wage level, only the traditional manufacturing sector has seen the effect. It is thought that unskilled workers who have a routine job have been partially replaced with skilled workers who have IT capability, resulting in skill-biased technology change.
In the information service sector, the centering of additional employment around male workers is likely because the supply of labor in Korean society that can meet the demand for the installation and operation of IT applications mostly comprises male workers. According to the World Economic Forum [59], the number of female graduates in ICT-related majors amounted to only 33% of the number of male graduates. Vitalization of IT education for women could help increase the percentage of women benefiting from increases in employment related to firm utilization of IT.
The effect of sales has been seen in the traditional manufacturing and information service sectors. The common factor between traditional manufacturing and information service sectors is a relatively low ratio of companies adopting IT (Figure 2). Companies in the industries with low IT utilization seemed to have leveraged IT applications to gain relatively greater competitive advantages [39] and thus increased sales revenue by expanding their business activity area.
Meanwhile, larger exports and higher profitability through IT adoption have been found only in the high-tech manufacturing sector. Hagsten and Kotnik [24] observed an increase in the export intensity of European companies that began using specific IT applications. A similar phenomenon has been found in the Korean hi-tech manufacturing sector. The Korean hi-tech manufacturing sector is geared toward export and has highly sophisticated products and production process. It seems that companies that adopted IT applications have participated in the global value chain, leading to higher exports and improved long-term profitability.

5. Summary and Conclusions

This study used data from the Korea business activity survey panel from 2008 to 2016 to examine the additional effects on sustainable growth of firms that started using IT applications from 2010 to 2012 compared to those that did not. The effects were examined for four years after adoption and were divided into areas such as sales, labor productivity, profitability, increases in male and female employment, wages, and exports. The effects of IT adoption are known to vary greatly depending on the industry. The manufacturing industry was divided into traditional, medium-tech, and hi-tech manufacturing, and the service industry was divided into material service and information service sectors; each sector’s effects were then observed. In addition, the PSM methodology was used to overcome selection bias arising from a simple comparison between firms that started using IT and firms that did not.

5.1. Research Implications

As a result of the analysis, we gleaned the following from the descriptive statistics: (1) The rate of IT application utilization by Korean firms increased sharply from 41% in 2006 to 61% in 2010, reaching 64% in 2014. By industry, the IT utilization rate of medium-tech manufacturing and hi-tech manufacturing was highest in 2014 at 76%, followed by traditional manufacturing at 70%, and the material service sector and information service sector at 57% and 51%, respectively. (2) Firms that started utilizing IT compared to firms that did not were larger in terms of sales and number of employees. They also had high labor productivity, high profitability, a low debt ratio, high R&D, and a high patent application rate. In other words, it appears that relatively larger firms that were competitive (based on various financial indicators) began to use IT to maintain and enhance their competitiveness.
By analyzing the impact of IT utilization by industry, we were able to learn the following: (1) Sales increased in traditional manufacturing and the information service sector through IT utilization. The level of IT utilization in these industries remains lower than in others, so we believe there are still competitive advantages in sales that can be obtained through IT utilization. (2) Increased exports and enhanced profitability were observed in the hi-tech manufacturing sector. This is likely because IT utilization enables the production of highly complex products, as well as incorporation into a global value chain of higher added value. (3) An increase in employment was observed only in the information service sector. IT utilization in this sector will likely result in substantial changes in organizational and human resources; new employment seems to have expanded to operate and manage these changes. On the other hand, the employment increase was primarily seen in an increase in male workers; we did not observe an increase in female worker employment. (4) It was difficult to observe statistically significant effects due to the adoption of new IT applications in the medium-high-tech and material service sectors. This is probably because IT utilization in these industries was already relatively high; moreover, because of the low complexity of product and production processes, benefits from IT utilization are not expected to be high. It is likely that IT was introduced as standardized software packages in these industries, making it improbable that there would be a significant increase in competitiveness.

5.2. Policy Implications

The present study suggests the following policy implications. First, it could be difficult for late adopters of IT applications to catch up with other companies in terms of productivity. This suggests that financial support for SMEs’ adoption of IT through government policy may not be effective in terms of productivity growth. Complementary capability development should be facilitated to help late adopters achieve productivity catch-up. Gal et al. [3] suggested measures for SMEs such as widening the skill pool, improving access to financing, and reducing entry barriers to certain markets. These policy measures should be simultaneously provided to Korean SMEs to promote the diffusion of IT-driven innovation.
Furthermore, support programs should be tailored according to the characteristics of each industry. In particular, it seems that there is still room to gain the benefits in the case of the supporting industries with a low IT utilization rate. In Korea, since the agriculture, forestry and fishing, and mining industries have the lowest levels of IT utilization (Figure 2), support measures for the industries to adopt IT would bring about a positive impact. In terms of employment, the only sector where the introduction of IT has had a positive effect was the information services sector. If the government tries to implement policies for job creation, it may be desirable to support specific industries selectively.
It was also observed that the increase in employment through IT utilization mainly benefited male workers. A policy to expand IT education targeting women is needed to increase women’s economic activity, which is one of the Korean government’s recent policy objectives. Through programs such as “WE-UP” (Women in Engineering—Undergraduate Leading Program), the Korean Ministry of Education is seeking to expand engineering and IT education for women in universities [60]. Such efforts will need to be continued in the future.

5.3. Limitations and Future Research

This study has some limitations, which also present potentially fruitful directions for future researches. One major limitation is that this study could not identify the differences in the impacts according to the types and the technology level of IT applications.
The Survey of Business Activities used in this study examined whether companies use seven IT applications in a binary fashion. However, the degree of utilizing IT applications such as ERP and the level of technology could be different depending on companies. For this reason, the present study analyzed companies that began adopting IT applications for the first time, given the assumption that there would be no large differences in the degree of utilization and the level of technology between companies that had just started to adopt new tools. However, with the panel data used in the study, future research would be able to use some proxy variables for the degree of IT utilization and the level of technology. For example, indexes measuring the accumulated years of IT utilization and the number of IT applications utilized by a firm can be used as proxy variables.
In addition, differences in performance according to seven IT applications have not been distinguished. However, different types of IT investment can result in differentiated effects, as suggested in Schryen [28]. This is because, first, most companies (83.3%) that started to utilize IT initially chose ERP among seven IT applications. Second, the present study has too many dimensions, such as eight performance indicators, five industries, and a 4-year time horizon after IT adoption already. Adding additional dimensions, such as types of IT applications, will complicate the interpretation of the results further. Future studies will be able to investigate the varying effects of different IT applications targeting some specific industries or firm groups.

Author Contributions

I.O. conducted the formal analyses and wrote the original manuscript. D.S. conducted validation and review on the revised manuscript. All authors have read and agreed to the published version of the manuscript.

Funding

This paper was supported by Konkuk University in 2018.

Conflicts of Interest

The authors declare no conflict of interest.

Appendix A. Diagnostic Plots and Statistics for the Matching Procedures

In this appendix, we are trying to see whether the propensity score (PS) estimated for each industry has the appropriate properties for matching procedures. Heinrich et al. [54] proposes following checklists for ascertaining the quality of matching procedure: (1) following the guidelines for the application of conditional independence assumptions (CIA), (2) balancing tests on covariates, and (3) complying with the common support conditions.
The CIA is an assumption that the selection into the treatment is determined by the observable characteristics of firms. However, there is no statistical test available for the justification of this assumption. Heinrich et al. [61] and Li [49] are suggesting following guidelines in estimating PS to apply the CIA: including all the observable variables which can simulate the selection process and not omitting important observable variables, using values which are not affected by the treatment or values before receiving the treatment, and using the same database source for both the treated and untreated firm groups. This study followed the guidelines in estimating the industry-specific propensity scores. Some studies utilized the matching procedure in estimating the impact of IT adoption on firms [1,25,62]. However, compared to previous studies, this study could utilize far more detailed list of observable characteristics related to the IT adoption (Table 7) and thus we think that the application of the CIA is appropriate in this study.
The characteristics of firm groups which will and will not receive the treatment are different already. The balancing test checks whether there are any significant differences left in covariate values between the treatment firm group and the matched control (untreated) firm group, after matching using PS as a weight. Matching is a quasi-experimental approach which attempts to replicate experimental conditions by ensuring that all covariates (other than treatment status) are similar between the treated group and the matched control group. Thus, post-match balancing tests provide information on how well matching has replicated the experimental benchmark. Table A1 shows the mean differences of selected variables for each industry after matching. And the results show that the differences that existed between the firm groups before matching (as shown in Table 6) have been decreased dramatically, and that the standardized differences between the groups after matching are less than 0.05 for all covariates.
Table A1. Mean values and differences of the selected variables for the treated and control firms after matching.
Traditional ManufacturingMedium-Tech ManufacturingHi-tech ManufacturingMaterial ServiceInformation Service
M.0.AdjM.1.AdjDiff.AdjM.0.AdjM.1.AdjDiff.AdjM.0.AdjM.1.AdjDiff.AdjM.0.AdjM.1.AdjDiff.AdjM.0.AdjM.1.AdjDiff.Adj
Having a daughter company (d)0.3440.342−0.0010.4090.4170.0070.5360.5500.0140.3280.3280.0000.3150.3150.001
Having a parent company (d)0.1390.139−0.0010.2560.2560.0000.0660.0690.0030.2060.2060.0000.2530.2530.000
Having a strategic alliance (d)0.0650.0650.0000.0660.0660.0000.0860.084−0.0020.0480.0470.0000.0960.0950.000
Number of incentive programs for workers1.3051.3080.0041.4811.4820.0011.8141.8240.0111.3481.3480.0001.6311.6310.000
Number of outsourced tasks1.4241.4270.0031.5321.524−0.0061.4571.450−0.0050.9370.937−0.0010.9220.921−0.001
Labor productivity (l)4.2584.2580.0004.3844.384−0.0014.1024.1120.0204.4524.4520.0004.1194.1210.002
Age (l)2.8862.885−0.0022.8902.889−0.0012.7092.704−0.0092.9552.9550.0002.6682.667−0.002
Sales (l)10.56610.5680.00210.82910.8300.00110.18910.2330.04710.55310.552−0.0019.9819.9830.002
Number of employees (l)4.8284.826−0.0034.9694.9710.0034.7574.7900.0494.8674.867−0.0015.1235.1230.000
Labor cost share (r)0.1470.147−0.0040.1450.145−0.0030.1800.178−0.0150.2500.2500.0010.4160.416−0.001
Profit per sales (r)0.0520.051−0.0020.0520.0530.0080.0500.0510.0090.0510.0520.0010.0560.0560.000
Export (d)0.5330.531−0.0020.7100.7140.0040.6120.6180.0070.1660.1660.0000.0750.0750.000
R&D (d)0.6180.615−0.0030.8070.8100.0030.7860.7940.0080.2520.2530.0010.3530.3530.000
Number of patents (d)0.4790.477−0.0020.5970.6010.0040.7300.7330.0030.1700.1700.0000.3190.3200.001
Sales growth0.0540.053−0.0030.0460.0470.0040.0920.0930.0040.0220.022−0.0010.0390.0390.002
Employment growth0.0390.0400.0050.0250.025−0.0020.0830.0860.013−0.017−0.017−0.0010.0280.0290.001
Notes: M.0.Adj: mean of the control (untreated) group after matching. M.1.Adj: mean of the treated group after matching. Diff.Adj: standardized difference in means between the two groups after matching. (d) indicates dummy variable, set to one if the variable has a positive value and zero otherwise. (l) indicates a logged variable, (r) indicates a ratio using sales as a basis. Growth terms are calculated comparing logged value between year (t − 2) and (t − 1).
The common support condition requires that there should be sufficient overlap in the treated and untreated firms to find adequate matches. In general, the condition is inspected visually as shown in Figure A1, Figure A2, Figure A3, Figure A4 and Figure A5, which shows a PS density distribution comparison for the treated and control (untreated) firm groups, before and after the matching procedure for each industry. The distribution after matching is drawn based on the one-to-one nearest matching for each industry. The graphs show that the distributions of two firm groups become almost identical after matching for all industries, and that clear overlapping ranges exists for two firm groups.
Figure A1. Density distribution of the propensity score for the treated and control firms before and after matching (traditional manufacturing sector).
Sustainability 12 09689 g0a1
Figure A2. Density distribution of the propensity score for the treated and control firms before and after matching (medium-tech manufacturing sector).
Sustainability 12 09689 g0a2
Figure A3. Density distribution of the propensity score for the treated and control firms before and after matching (hi-tech manufacturing sector).
Sustainability 12 09689 g0a3
Figure A4. Density distribution of the propensity score for the treated and control firms before and after matching (material service sector).
Sustainability 12 09689 g0a4
Figure A5. Density distribution of the propensity score for the treated and control firms before and after matching (information service sector).
Sustainability 12 09689 g0a5

References

  1. Alderete, M.V. Internet incidence on SME’s sales: A propensity score matching analysis. Inf. Resour. Manag. J. 2013, 26, 40–54. [Google Scholar] [CrossRef] [Green Version]
  2. OECD. Good Governance for Digital Policies: How to Get the Most out of ICT: The Case of Spain’s Plan Avanza; OECD Publishing: Paris, France, 2010. [Google Scholar]
  3. Gal, P.; Nicoletti, G.; Renault, T.; Sorbe, S.; Timiliotis, C. Digitalisation and Productivity: In Search of the Holy Grail–Firm-Level Empirical Evidence from EU Countries; OECD Economics Department Working Papers, No. 1533; OECD Publishing: Paris, France, 2019. [Google Scholar]
  4. Gibbs, J.; Kenneth, L.; Dedrick, J. Environment and Policy Factors Shaping Global E-Commerce Diffusion: A Cross-Country Comparison. Inf. Soc. 2003, 19, 5–18. [Google Scholar] [CrossRef] [Green Version]
  5. Thatcher, S.M.B.; Foster, W.; Zhu, L. B2B e-commerce adoption decisions in Taiwan: The interaction of cultural and other institutional factors. Electron. Commer. Res. Appl. 2006, 5, 92–104. [Google Scholar] [CrossRef]
  6. World Bank. 2006 Information and Communications for Development: Global Trends and Policies; World Bank: Washington, DC, USA, 2006. [Google Scholar]
  7. Shin, I. Adoption of enterprise application software and firm performance. Small Bus. Econ. 2006, 26, 241–256. [Google Scholar] [CrossRef]
  8. Sohn, Y.Y.; Yang, H.W. Information Technology, Corporate Performance and Firm Size. In The Economics of Online Markets and ICT Networks; Contributions to Economics; Cooper, R., Madden, G., Lloyd, A., Schipp, M., Eds.; Physica-Verlag HD: Heidelberg, Germany, 2006. [Google Scholar]
  9. Lee, H.-B.; Lee, O. Study on the Informatization Policy Evaluations and Directions for Small and Medium Enterprises (SMEs). J. Korea Acad. Ind. Coop. Soc. 2016, 17, 655–665. [Google Scholar]
  10. Lehr, W.; Sharafat, A. ICT-Centric Economic Growth, Innovation and Job Creation; International Telecommunication Union: Geneva, Switzerland, 2017; ISBN 978-92-61-24411-8. [Google Scholar]
  11. Paunov, C.; Rollo, V. Overcoming Obstacles: The Internet’s Contribution to Firm Development. World Bank Econ. Rev. 2015, 29 (Suppl. 1), 192–204. [Google Scholar] [CrossRef] [Green Version]
  12. Neirotti, P.; Paolucci, E. Industry and firm effects on IT diffusion processes: Firm-level evidence in Italian enterprises. Ind. Corp. Chang. 2014, 23, 717–757. [Google Scholar] [CrossRef]
  13. OECD. ICTs and Jobs: Complements or Substitutes? OECD Digital Economy Papers, No. 259; OECD Publishing: Paris, France, 2016. [Google Scholar]
  14. Caliendo, M. Microeconometric Evaluation of Labour Market Policies; Springer: Berlin, Germany, 2006. [Google Scholar]
  15. ITU (International Telecommunication Union). Measuring the Information Society Report; ITU: Geneva, Switzerland, 2011. [Google Scholar]
  16. ITU (International Telecommunication Union). Measuring the Information Society Report; ITU: Geneva, Switzerland, 2017. [Google Scholar]
  17. Central Officials Training Institute. Case Study on the Program for Informatization Support Program for Small and Medium Enterprises; Central Officials Training Institute: Gwacheon-si, Korea, 2006. (In Korean) [Google Scholar]
  18. Small and Medium Business Administration. SME Management Innovation Platform 2nd Open: Support Customized Solutions for 14 Industries (9,000 Companies); Document for Press Release, 11 February 2015; Small and Medium Business Administration: Daejeon-si, Korea, 2015.
  19. OECD. OECD Economic Surveys: Korea 2018; OECD Publishing: Paris, France, 2018. [Google Scholar]
  20. Choo, J. South Korean politics and foreign policy in 2017 and 2018. Asian Policy 2018, 10, 123–134. [Google Scholar] [CrossRef]
  21. Cheong, W.D. 100 Policy Tasks-Five-Year Plan of the Moon Jae-In Administration; Korean Culture and Information Service: Sejong-si, Korea, 2017. [Google Scholar]
  22. Colombo, M.G.; Croce, A.; Grilli, L. ICT services and small businesses’ productivity gains: An analysis of the adoption of broadband Internet technology. Inf. Econ. Policy 2013, 25, 171–189. [Google Scholar] [CrossRef]
  23. Ruivo, P.; Robrigues, J.; Johansson, B.; Oliveira, T.; Rebelo, J. Differences in ERP Value between Iberian Manufacturing and Services SMEs. Procedia Comput. Sci. 2017, 121, 701–715. [Google Scholar] [CrossRef]
  24. Hagsten, E.; Kotnik, P. ICT as facilitator of internationalisation in small- and medium-sized firms. Small Bus. Econ. 2017, 48, 431–446. [Google Scholar] [CrossRef]
  25. Atasoy, H.; Banker, R.; Pavlou, P. On the longitudinal effects of IT use on firm-level employment. Inf. Syst. Res. 2016, 27, 6–26. [Google Scholar] [CrossRef]
  26. Jung, J.; López-Bazo, E.; Grazzi, M. Internet and Enterprise Productivity: Evidence from Latin America; IREA Working Papers 201709; University of Barcelona, Research Institute of Applied Economics: Barcelona, Spain, 2017. [Google Scholar]
  27. Brynjolfsson, E.; Hitt, M. Beyond computation: Information technology, organizational transformation and business performance. J. Econ. Perspect. 2000, 14, 23–48. [Google Scholar] [CrossRef] [Green Version]
  28. Schryen, G. Revisiting IS business value research: What we already know, what we still need to know, and how we can get there. Eur. J. Inf. Syst. 2013, 22, 139–169. [Google Scholar] [CrossRef]
  29. Das, S.; Yaylacicegi, U.; Menon, N.M. The Effect of Information Technology Investments in Healthcare: A Longitudinal Study of its Lag, Duration, and Economic Value. IEEE Trans. Eng. Manag. 2011, 58, 124–140. [Google Scholar] [CrossRef]
  30. Ollo-López, A.; Aramendía-Muneta, M.E. ICT impact on competitiveness, innovation and environment. Telemat. Inform. 2012, 29, 204–210. [Google Scholar] [CrossRef]
  31. Biagi, F. ICT and Productivity: A Review of the Literature; JRC-IPTS Working Papers on Digital Economy 2013-09; Institute of Prospective Technological Studies, Joint Research Centre: Seville, Spain, 2013. [Google Scholar]
  32. Dedrick, J.; Gurbaxani, V.; Kraemer, K.L. Information technology and economic performance: A critical review of the empirical evidence. ACM Comput. Surv. 2003, 35, 1–28. [Google Scholar] [CrossRef]
  33. Sohal, A.S.; Moss, S.; Ng, L. Comparing IT success in manufacturing and service industries. Int. J. Oper. Prod. Manag. 2001, 21, 30–45. [Google Scholar] [CrossRef]
  34. Autor, D.; Dorn, D. The growth of low-skill service jobs and the polarization of the U.S. labor market. Am. Econ. Rev. 2013, 103, 1553–1597. [Google Scholar] [CrossRef] [Green Version]
  35. Autor, D.; Levy, F.; Murane, R. The skill content of recent technological change: An empirical exploration. Q. J. Econ. 2003, 118, 1279–1333. [Google Scholar] [CrossRef]
  36. Plantenga, J.; Remery, C.; EU Expert Group on Gender and Employment (EGGE). Flexible Working Time Arrangements and Gender Equality: A Comparative Review of 30 European Countries; Publications Office of the European Union: Luxembourg, 2010. [Google Scholar]
  37. Boden, R.J. Flexible working hours, family responsibilities, and female self-employment. Am. J. Econ. Sociol. 1999, 58, 71–83. [Google Scholar] [CrossRef]
  38. Scandura, T.A.; Jankau, M.J. Relationships of gender, family responsibility and flexible work hours to organizational commitment and job satisfaction. J. Organ. Behav. 1997, 18, 377–391. [Google Scholar] [CrossRef]
  39. Atasoy, H.; Banker, R.; Pavlou, P.A. IT Skills and Employment Opportunities of Workers; NET Institute Working Paper No. 11-24; The Wharton School, The University of Pennsylvania: Philadelphia, PA, USA, 2013. [Google Scholar]
  40. Clayton, T.; Criscuolo, C.; Goodridge, P. E-Commerce and Firm Performance: An Assessment Using Multiple Survey Sources and Linked Data; Office for National Statistics Report for EuroStat, European Commission: Luxembourg, 2003. [Google Scholar]
  41. Neirotti, P.; Paolucci, E. Assessing the importance of industry in the adoption and assimilation of IT: Evidence from Italian enterprises. Inf. Manag. 2011, 48, 249–259. [Google Scholar] [CrossRef]
  42. Chiasson, M.; Davidson, E. Taking Industry Seriously in Information Systems Research. MIS Q. 2005, 29, 591–605. [Google Scholar] [CrossRef]
  43. Bartelsman, E.J. Searching for the sources of productivity from macro to micro and back. Ind. Corp. Chang. 2010, 19, 1891–1917. [Google Scholar] [CrossRef] [Green Version]
  44. Ugrin, J.C.; Morris, J.J.; Ott, R.L. A Study of How Underperforming Firms Follow Industry Leaders When Adopting ERP Systems and the Economic Effects of Their Adoption Decisions. Commun. Assoc. Inf. Syst. 2016, 39, 1–22. [Google Scholar] [CrossRef]
  45. Huber, M.; Lechner, M.; Steinmayr, A. Radius matching on the propensity score with bias adjustment: Tuning parameters and finite sample behavior. Empir. Econ. 2015, 49, 1–31. [Google Scholar] [CrossRef] [Green Version]
  46. Imai, K.; Ratkovic, M. Covariate balancing propensity score. J. R. Stat. Soc. Ser. B 2014, 76, 243–263. [Google Scholar] [CrossRef]
  47. Blundell, R.; Dias, M.C. Evaluation methods for non-experimental data. Fisc. Stud. 2000, 21, 427–468. [Google Scholar] [CrossRef]
  48. Rosenbaum, P.; Rubin, D.B. The central role of the propensity score in observational studies for causal effects. Biometrica 1983, 70, 41–55. [Google Scholar] [CrossRef]
  49. Li, M. Using the propensity score method to estimate causal effects: A review and practical guide. Organ. Res. Methods 2013, 16, 188–226. [Google Scholar] [CrossRef] [Green Version]
  50. Steiner, P.M.; Cook, T.D.; Shadish, W.R.; Clark, M.H. The importance of covariate selection in controlling for selection bias in observational studies. Psychol. Methods 2010, 15, 250–267. [Google Scholar] [CrossRef] [PubMed] [Green Version]
  51. McKenzie, D.J. Impact Assessments in Finance and Private Sector Development: What Have We Learned and What Should We Learn? World Bank Policy Research Working Paper Series, WPS4944; World Bank: Washington, DC, USA, 2009. [Google Scholar]
  52. Fabritz, N. ICT as an Enabler of Innovation: Evidence from German Microdata; IFO Working Paper No. 195; IFO Institute-Leibniz Institute for Economic Research at the University of Munich: Munich, Germany, 2015. [Google Scholar]
  53. Greifer, N. Cobalt: Covariate Balance Tables and Plots. R Package Version 3.4.1; R Foundation for Statistical Computing: Vienna, Austria, 2018. [Google Scholar]
  54. Vial, G. Understanding digital transformation: A review and a research agenda. J. Strateg. Inf. Syst. 2019, 28, 118–144. [Google Scholar] [CrossRef]
  55. Conboy, K.; Mikalef, P.; Dennehy, D.; Krogstie, J. Using business analytics to enhance dynamic capabilities in operations research: A case analysis and research agenda. Eur. J. Oper. Res. 2020, 281, 656–672. [Google Scholar] [CrossRef]
  56. Mikalef, P.; Pateli, A. Information technology-enabled dynamic capabilities and their indirect effect on competitive performance: Findings from PLS-SEM and fsQCA. J. Bus. Res. 2017, 70, 1–16. [Google Scholar] [CrossRef]
  57. Mikalef, P.; Pateli, A.; van de Wetering, R. IT architecture flexibility and IT governance decentralisation as drivers of IT-enabled dynamic capabilities and competitive performance: The moderating effect of the external environment. Eur. J. Inf. Syst. 2020. [Google Scholar] [CrossRef]
  58. Wade, M.; Hulland, H. The Resource Based View and Information System Research: Review, Extension and Suggestion for Future Research. MIS Q. 2004, 28, 107–142. [Google Scholar] [CrossRef]
  59. World Economic Forum. Global Gender Gap Report; World Economic Forum: Cologny/Geneva, Switzerland, 2017. [Google Scholar]
  60. Ministry of Education. Basic Plan for 2016 Women in Engineering-Undergraduate Leading Program; Document for Press Release, 24 May 2016; Ministry of Education: Sejong-si, Korea, 2016. (In Korean)
  61. Heinrich, C.; Maffioli, A.; Vazquez, G. A Primer for Applying Propensity-Score Matching; Impact-Evaluation Guidelines, IDB-TN-161; Inter-American Development Bank: Washington, DC, USA, 2010. [Google Scholar]
  62. Grimes, A.; Ren, C.; Stevens, P. The need for speed: Impacts of internet connectivity on firm productivity. J. Product. Anal. 2012, 37, 187–201. [Google Scholar] [CrossRef] [Green Version]
Figure 1. Proportion of firms utilizing Information Technology (IT) applications. Source: Authors’ calculation.
Sustainability 12 09689 g001
Figure 2. Proportion of firms utilizing IT applications for each industrial sector. Source: Authors’ calculation.
Sustainability 12 09689 g002
Table 1. Recent studies on the effects of IT application on firm performances and employment.
PaperCountryAnalysis PeriodMeasurement of IT UseMeasurement of Firm PerformancesLagged Effects ConsideredFindings
Colombo et al. (2013) [22]Italy1998–200415 broadband applications (virtual private network, data and disaster recovery, SCM, CRM and others) classified into 4 categoriesTotal factor productivityLags not consideredIn general, negligible impacts are found on productivity of SMEs. However, firms adopted specific applications relevant to the industry and undertaking complementary changes benefited from the adoption of IT.
Neiroti and Paolucci (2014) [12]Italy2002–2006Expenditures on IT employees, stock of IT resources, IT enriched capabilitiesProfitabilityLags not consideredIT value depends on industry type (traditional, medium-tech, and hi-tech manufacturing, and material, and information service). The hi-tech manufacturing and information service sectors show lower profit returns than others.
Ruivo et al. (2017) [23] Portugal and Spain2016ERPSurveys on value creation by ERP useLags not consideredFirms with larger size, doing collaboration, utilizing analytical information gain more through ERP use. Firms in service industries received more benefit compared to manufacturing firms.
Hagsten and Kotnik (2017) [24]12 EU countries2001–2010Website, E-transaction, employment ratio with broadband internet access and post-upper IT educationExport decision, export intensityOne-year lagged effects consideredICT capacities of SMEs impact positively on exporting activities of SMEs, although varying across countries. Basic capacities (e.g., corporate website) are linked to the export decision and advanced capacities are related to the export intensity.
Gal et al. (2019) [3]19 EU countries and Turkey2010–2015High-speed broadband, ERP, CRM, cloud computingMulti factor productivityOne-year lagged effects consideredEffects of IT use are stronger in more productive firms, increasing productivity dispersion across firms.
Atasoy et al. (2016) [25]Turkey2007–2011ERP, SCM, CRM, procurement, E-banking, E-government, corporate websiteEmployment, wage levelTwo-year lagged effects consideredIT applications affects positively to firms’ employment growth. Larger firms in high-tech industries with higher level of wage showed higher impact in employment.
Jung et al. (2017) [26]19 Latin American countries2006, 2010High-speed broadband, degree of internet use (website, email, purchase, R&D, service delivery)Total factor productivityLags not consideredIT and firm performance showed positive relationship. IT adoption contributes to decrease productivity differences among firms.
Paunov and Rollo (2015) [11]117 developing and emerging countries2006–2011Email communications with suppliers and clients (industry level)Labor productivityLags not consideredIndustrial IT adoption has positive spillover effects on firms. Most productive firm benefit more from IT utilization at the industrial level.
This paperKorea2008–2016Newly adopting one of IT applications (ERP, LMS, KMS, HRMS, CRM, SCM, B2BI)Sales, labor productivity, profitability, employment (male and female), wage level, exportLagged effects considered up to four yearsImpacts on firms were observed for five industrial sectors (traditional, medium-tech, and hi-tech manufacturing, and material, and information service). Positive impacts were found on sales and employment, differing by industries.
Table 2. Descriptive statistics of firms in a survey of business activities database for selected years.
Year2007201020132016
Variables MeanS.E.MeanS.E.MeanS.E.MeanS.E.
Age17.912.218.912.120.012.221.913.4
Sales (million KRW)175,2241,276,174219,1061,753,844218,1011,959,117208,0081,660,642
Profit (earnings before tax) per sales0.0460.1000.0480.1060.0400.1050.0490.113
Labor productivity (value added per employee, million KRW)8990103126101105103115
Number of employees2901414302150331215573571658
Ratio of female to male employeesn/an/a0.5901.6010.5951.3410.6451.631
Export (d)0.3780.4850.3990.4900.3810.4860.4870.500
R&D (d)0.5220.5000.4780.5000.4990.5000.4850.500
Tangible investment (d)0.9440.2290.9250.2630.8990.3010.9080.289
Number of patents (d)0.3940.4890.4250.4940.4730.4990.4930.500
Utilizing at least one IT application (d)0.5090.5000.6110.4870.6320.482n/an/a
Utilizing ERP (enterprise resources planning) (d)0.4360.4960.5360.4990.5660.496n/an/a
Utilizing LMS (learning management system) (d)0.0370.1890.0540.2250.0550.229n/an/a
Utilizing KMS (knowledge management system) (d)0.0430.2030.0440.2050.0390.195n/an/a
Utilizing HRMS (human resource management system) (d)0.0530.2250.0740.2620.0820.275n/an/a
Utilizing CRM (customer relationship management) (d)0.0730.2600.0940.2910.0810.272n/an/a
Utilizing SCM (supply chain management) (d)0.0360.1860.0490.2170.0510.220n/an/a
Utilizing B2BI (business-to-business integration) (d)0.060.230.070.260.070.25n/an/a
Industry—agriculture, forestry and fishing, and mining (d)0.0030.0580.0030.0550.0030.0530.0030.057
Industry—traditional manufacturing (d)0.2470.4310.2170.4120.2150.4110.2100.407
Industry—medium-tech manufacturing (d)0.1730.3780.1520.3590.1700.3760.1640.370
Industry—hi-tech manufacturing (d)0.1360.3430.1260.3320.1230.3280.1170.321
Industry—material service (d)0.2310.4220.2540.4350.2400.4270.2520.434
Industry—information service (d)0.2100.4080.2470.4320.2490.4330.2540.436
Entrant (d)0.0780.2670.0840.2780.0550.2280.0550.228
Exited (d)0.0960.2950.0710.2570.0530.223n/an/a
Number of firms10211104481157211807
Notes: (d) indicates dummy variable, set to one if the variable has a positive value and zero otherwise. Entrant dummy indicates firms entered the DB during the year and exited dummy indicates firms do not exist in the DB the next year.
Table 3. Industry classification.
Industry ClassificationIndustries IncludedRole of IT
Agriculture, forestry and fishing, and miningAgriculture, forestry, fishing, miningLow co-specialization with product technologies
Traditional manufacturingFood, beverages, textiles, wood products, paper, rubber, plastics, basic metal, metal products, furnitureLow co-specialization with product technologies
Medium-tech manufacturingPetroleum products, chemical products, machinery and equipment, motor vehicle and transport equipmentModerate co-specialization with both product and process technologies
Hi-tech manufacturingPharmaceuticals, electronic components, computers, medical and precision instruments, electrical equipmentHigh co-specialization with both product and process technologies
Material serviceElectricity and water supply, waste treatment, construction, wholesale and retail trades, transport and logistics, hotels and restaurantsLow co-specialization (with focus on scale intensive networks and CRM)
Information serviceMedia/publishing, telecommunications, software and IT services, financial services, professional and business services, education, health careCore technology used to deliver services
Note: modified from Neirotti and Paolucci [12], based on circumstance of Korean economy.
Table 4. IT applications of firms.
IT ApplicationsDefinition
ERP (enterprise resource planning)An integrated system of human resource management, financial information, and production management systems, which were operated independently, across all areas of the firm such as human resources, finance, and production.
LMS (learning management system)A system that can vitalize internal training. It is a solution that integrates with the educational content production system using the Internet, resource management, knowledge management, and human resource management systems.
KMS (knowledge management system)An enterprise information system that systematizes the individual knowledge accumulated by the human resources within the organization and shares them on the Internet.
HRMS (human resource management system)A comprehensive system for human resource management from future human resource demand forecasting, hiring, selection, and deployment to organizational design, development, and training.
CRM (customer relationship management)A system used to build long-term relationships with customers through organization and integration of the technology infrastructure, business strategy, sales, and customer/market information required for customer management.
SCM (supply chain management)A system for organizing, optimizing, managing, and sharing the firm’s supply chain to respond to uncertain market environments.
B2BI (business-to-business integration)A function that integrates systems between businesses, a business and e-marketplace, and e-marketplaces based on the business processes occurring in transactions between companies.
Table 5. Portion of IT applications used in each industry sector.
Industry ClassificationUtilizing ERPUtilizing LMSUtilizing KMSUtilizing HRMSUtilizing CRMUtilizing SCMUtilizing B2BI
Agriculture, forestry and fishing, and mining95.8%1.1%0.0%0.0%1.1%10.5%9.5%
Traditional manufacturing92.6%5.4%4.3%7.6%7.9%6.9%11.6%
Medium-tech manufacturing94.5%6.0%5.0%9.6%6.5%11.0%10.8%
Hi-tech manufacturing94.8%5.4%5.0%8.0%7.6%9.3%9.1%
Material service83.1%9.9%7.1%15.3%20.3%8.5%12.9%
Information service73.9%15.5%14.2%19.9%27.4%3.7%10.3%
Table 6. Comparison between IT-starting firms and non-IT firms for each industry.
IndustryTraditional ManufacturingMedium-Tech ManufacturingHi-Tech ManufacturingMaterial ServiceInformation Service
Variables
Non-IT FirmsIT-Starting FirmsT-TestNon-IT FirmsIT-Starting FirmsT-TestNon-IT FirmsIT-Starting FirmsT-TestNon-IT FirmsIT-Starting FirmsT-TestNon-IT FirmsIT-Starting FirmsT-Test
Having a parent company (d)0.080.15***0.130.25***0.110.07*0.100.22***0.130.26***
Having a daughter company (d)0.270.33**0.330.39*0.340.54***0.190.29***0.160.29***
Having a strategic alliance (d)0.040.07 0.050.07 0.080.08 0.050.05 0.080.10
Age19.018.9 18.518.9 16.416.0 21.719.9**14.614.7
Sales (million KRW)44,245.779,154.5***71,040.4160,038.8**37,215.962,623.5 42,331.2105,725.5**69,176.4119,379.1
Number of employees115.2152.8***133.1227.3***127.6166.3*141193.8**204.7320.3***
Wage level38.42641.088**43.18246.760**36.38937.880 50.15157.387***39.78054.476***
Ratio of female to male employees0.8710.701**0.3080.260 0.7670.591**0.5240.649 0.7370.709
Labor productivity (value added per employee, million KRW)73.388.1***87.6102.0**68.973.1 90.7124.5***74.3103.1***
Debt per sales0.5970.564**0.5800.544*0.5450.525 0.6320.584**0.4910.529
Profit (earnings before tax) per sales0.0370.051***0.0450.054 0.0520.055 0.0340.048**0.0480.059*
Number of outsourced tasks1.3911.366 1.5101.473 1.4721.407 0.8580.881 0.9240.892
Number of incentive programs for workers1.0401.264***1.2061.435***1.6391.807*1.0231.348***1.3421.583***
Export (d)0.4650.500 0.5730.688***0.5380.607 0.1010.148**0.0920.080
R&D (d)0.4800.586***0.6390.796***0.6940.786**0.1540.235***0.2890.340*
Investment (d)0.9440.969**0.9780.973 0.9680.986 0.8560.897**0.7440.830***
Number of patents (d)0.3710.449**0.4930.575**0.6150.710**0.1210.158*0.2460.299**
Sales growth0.0460.053 0.0640.047 0.0590.093 0.0180.022 −0.0050.039**
Employment growth0.0060.040**0.0080.025 0.0300.086**−0.005−0.017 −0.0050.029
Debt growth0.0370.052 0.0730.038 0.0460.142**0.0330.052 0.0460.083
Number of firms2169292 1198186 902145 3332310 3811288
Notes: * significance level of 10%, ** significance level of 5%, *** significance level of 1%. (d) indicates dummy variable, set to one if the variable has a positive value and zero otherwise. Growth terms are calculated comparing logged value between year (t − 2) and (t − 1) (e.g., sales growth: {log (sales t − 1)} − {log (sales t − 2)}.
Table 7. Firm characteristics entered as covariates to estimate the propensity score.
Covariates related to external relationships: Foreign ownership (r), Having a daughter company (d), Having a parent company (d), Having a strategic alliance (d), Number of outsourced tasks, Having overseas business activities (d)
Covariates related to firm characteristics and capabilities: Labor productivity (r, l), Age (l, s), Sales (l, s), Number of employees (l, s), Sales x Age (l), Sales x Number of employees (l), Assets (l), Debt (r), Tangible assets (r), Number of part-timers (r), Payroll (r), Value added (r), Export (r), Profitability (r)
Covariates related to human capital and capabilities: R&D (l), Capital investment (l), Number of female employees (r), Patents (d), Number of incentive programs
Growth rate comparing (t − 1) and (t − 2): Growth in number of employees (l), Growth in sales (l), Growth in payroll (l), Growth in export (l), Growth in profitability (r)
Dummy variables indicating Seoul capital area
Dummy variables indicating year
Note: (d) indicates a dummy variable, (l) indicates a logged variable, (r) indicates a ratio using sales or number of employees as a basis, (s) indicates the squared variable is also included.
Table 8. ATT (average treatment effect on the treated) for firms in the traditional manufacturing sector.
Growth between
(t + 1) − (t − 1)(t + 2) − (t − 1)(t + 3) − (t − 1)(t + 4) − (t − 1)
SalesATT0.0330.0610.0790.083
p-value0.250.03 **0.01 **0.03 **
Labor productivityATT0.0440.028−0.0020.042
p-value0.220.440.970.35
ProfitabilityATT0.002−0.005−0.009−0.002
p-value0.770.460.240.84
Number of employeesATT−0.0030.0020.011−0.005
p-value0.930.940.680.87
Number of male employeesATT−0.022−0.017−0.008−0.007
p-value0.480.520.790.82
Number of female employeesATT−0.008−0.0180.0210.007
p-value0.830.630.620.88
Wage levelATT−0.0060.0320.0170.043
p-value0.790.130.490.07 *
ExportATT0.3350.323−0.147−0.455
p-value0.290.350.670.18
Notes: *, and ** indicate significance at the 10%, and 5% levels, respectively. Growth rates are calculated for logged values (except for profitability, which is earnings before tax per sales).
Table 9. ATT (average treatment effect on the treated) for firms in the medium-tech manufacturing sector.
Growth between
(t + 1) − (t − 1)(t + 2) − (t − 1)(t + 3) − (t − 1)(t + 4) − (t − 1)
SalesATT0.0140.024−0.043−0.013
p-value0.690.530.380.78
Labor productivityATT0.0180.0080.0000.030
p-value0.710.851.000.55
ProfitabilityATT1.7281.008−0.6653.319
p-value0.520.740.830.27
Number of employeesATT−0.0150.025−0.005−0.009
p-value0.530.370.880.81
Number of male employeesATT−0.0150.019−0.023−0.025
p-value0.560.510.510.49
Number of female employeesATT−0.0490.0470.039−0.010
p-value0.350.410.520.87
Wage levelATT0.0250.0020.011−0.005
p-value0.330.950.710.87
ExportATT0.636−0.135−0.511−0.349
p-value0.150.760.260.40
Note: Growth rates are calculated for logged values (except profitability which is earnings before tax per sales).
Table 10. ATT (average treatment effect on the treated) for firms in the hi-tech manufacturing sector.
Growth between
(t + 1) − (t − 1)(t + 2) − (t − 1)(t + 3) − (t − 1)(t + 4) − (t − 1)
SalesATT−0.024−0.0170.0390.048
p-value0.640.750.570.51
Labor productivityATT0.0250.0590.0890.075
p-value0.690.280.200.32
ProfitabilityATT0.0020.0090.0200.033
p-value0.870.430.120.03 **
Number of employeesATT−0.0160.0270.0440.062
p-value0.690.560.400.27
Number of male employeesATT0.0140.0510.0550.047
p-value0.750.290.290.42
Number of female employeesATT−0.099−0.057−0.0190.040
p-value0.150.450.820.66
Wage levelATT0.0210.0220.0240.003
p-value0.600.550.540.94
ExportATT1.2080.9961.0660.058
p-value0.01 **0.05 *0.08 *0.91
Notes: *, and ** indicate significance at the 10%, and 5% levels, respectively. Growth rates are calculated for logged values (except profitability which is earnings before tax per sales).
Table 11. ATT (average treatment effect on the treated) for firms in the material service sector.
Growth between
(t + 1) − (t − 1)(t + 2) − (t − 1)(t + 3) − (t − 1)(t + 4) − (t − 1)
SalesATT−0.010−0.029−0.038−0.031
p-value0.710.430.380.50
Labor productivityATT0.0290.0010.004−0.020
p-value0.450.980.930.68
ProfitabilityATT−0.008−0.003−0.0070.001
p-value0.240.690.420.88
Number of employeesATT−0.042−0.020−0.0400.022
p-value0.130.530.270.61
Number of male employeesATT−0.065−0.023−0.0450.001
p-value0.100.590.340.98
Number of female employeesATT0.049−0.009−0.0160.065
p-value0.290.870.780.25
Wage levelATT0.003−0.0220.005−0.051
p-value0.920.450.880.15
ExportATT−0.449−0.0860.3180.132
p-value0.150.790.300.68
Note: Growth rates are calculated for logged values (except profitability, which is earnings before tax per sales).
Table 12. ATT (average treatment effect on the treated) for firms in the information service sector.
Growth between
(t + 1) − (t − 1)(t + 2) − (t − 1)(t + 3) − (t − 1)(t + 4) − (t − 1)
SalesATT0.0890.0790.1000.086
p-value0.00 ***0.02 **0.01 **0.06 *
Labor productivityATT0.0340.0370.038−0.011
p-value0.410.440.370.82
ProfitabilityATT0.0110.0120.0090.012
p-value0.220.260.290.25
Number of employeesATT0.1080.0810.0910.117
p-value0.00 ***0.04 **0.04 **0.02 **
Number of male employeesATT0.1340.1060.1090.119
p-value0.00 ***0.02 **0.02 **0.02 **
Number of female employeesATT0.0090.0230.0120.062
p-value0.880.680.840.35
Wage levelATT−0.020−0.0170.003−0.049
p-value0.540.670.940.19
ExportATT−0.058−0.006−0.171−0.172
p-value0.790.980.470.47
Notes: *, **, and *** indicate significance at the 10%, 5%, and 1% levels, respectively. Growth rates are calculated for logged values (except profitability, which is earnings before tax per sales).
Publisher’s Note: MDPI stays neutral with regard to jurisdictional claims in published maps and institutional affiliations.

