Article

Changes and Regional Differences in Urban Land Areas on Both Banks of the Strait of Malacca Based on Remote Sensing

1
School of Surveying and Geo-Informatics, Shandong Jianzhu University, Jinan 250101, China
2
State Key Laboratory of Resources and Environmental Information System, Institute of Geographic Sciences and Natural Resources Research, Chinese Academy of Sciences, Beijing 100101, China
3
University of Chinese Academy of Sciences, Beijing 100049, China
4
Jiangsu Centre for Collaborative Innovation in Geographical Information Resource Development and Application, Nanjing 210023, China
*
Author to whom correspondence should be addressed.
Sustainability 2020, 12(22), 9714; https://doi.org/10.3390/su12229714
Submission received: 21 October 2020 / Revised: 17 November 2020 / Accepted: 19 November 2020 / Published: 21 November 2020
(This article belongs to the Section Sustainable Urban and Rural Development)

Abstract

:
Over the past 30 years, both banks of the Strait of Malacca have experienced rapid economic growth and urbanization. Because of the difficulties in obtaining multi-phase urban land information over a large tropical area, spatial-temporal evolution analysis of the urban land areas in this region has been restricted. In this study, we developed an object-oriented retro-updating method for the rapid extraction of multi-phase urban land information to conduct a comprehensive study of the urban land area changes and to investigate the regional differentiation of both banks of the Strait of Malacca from 1990 to 2018, using grid analysis, zoning statistics, and gradient-direction analysis. The results revealed that from 1990 to 2018, the urban land areas on the eastern and western banks of the Strait of Malacca had increased by 1.51 times and 1.76 times, respectively, and in 2018, the urban land areas on the eastern bank were approximately four times greater than those on the western bank. The urban land areas on the eastern bank exhibit clusters centered around large cities and small strips along roads. Furthermore, the development of the urban land on the western bank was slow. As of 2018, the low development intensity areas on the western bank accounted for 98.73% of the total area, with only Medan achieving a higher development intensity. The development speeds of both banks followed the same zonal law (i.e., decreasing with increasing distance from the coastline). In addition, the urban land areas on both banks were mainly distributed within 60 km of the coast. Over the past 30 years, in decreasing order of their expansion scales, the major ports on both banks of the strait are Port Kelang, the Port of Singapore, Malacca Port, Penang Port, Belawan Port, and Dumai Port. In addition to the Port of Singapore and Dumai Port, which are in leapfrog expansion mode, the other ports exhibit edge-expansion patterns. Finally, investigation of the factors influencing the intensity of the urban land development revealed that natural resource conditions, economic and industrial structures, port development, and government policies all have caused the development of the western bank to lag behind that of the eastern bank.

1. Introduction

The Strait of Malacca is located between the Malay Peninsula and Indonesian Sumatra. It is the key link between the Pacific Ocean and the Indian Ocean and it is also the crossroads between Asia and Oceania. The northwestern end of the strait is approximately 233 km wide, and the southeastern end at the Phillips Channel is only 2.8 km wide [1]. Approximately 25% of the world’s traded goods are transported via the Strait of Malacca [2]. From economic and strategic perspectives, the Strait of Malacca is one of the most important shipping lanes in the world. Therefore, it has become a hot research topic for scholars from various countries. Previous studies have mainly focused on economic exchange, navigation safety, environmental pollution, and mangrove degradation [3,4,5]. Because of the economic development, population growth, and other factors, the urban land on both banks of the Strait of Malacca is constantly changing. Few studies, however, have been conducted on the changes in the urban land area in this region. Therefore, the timely and accurate detection of urban expansion on both banks of the strait is urgently needed. The results could help decision makers clarify the process of urban construction and the regional differences to better carry out urban planning, environmental protection, resource allocation, and other projects.
In recent years, with the development of remote sensing techniques, this tool has been widely used in research on urban land areas [6,7,8,9,10,11,12]. The time series mapping methods used to study urban land use can be divided into staged classification and change detection methods [13,14,15,16,17,18]. The staged classification method is used to classify image data in a study area by epoch and to obtain urban land data in each period. Numerous studies have monitored urban land area changes using this method [19,20,21]. Gong et al. mapped the impervious surfaces in China in 1978 and during 1985–2017 at an annual frequency using the Google Earth Engine platform, and they characterized the growth of the impervious surface area [22]. By classifying Landsat thematic mapper/enhanced thematic mapper plus (TM/ETM+) images from the 1990s, 2000s, and 2010s, Wang et al. examined the characteristics and differences in urban expansion in China [23]. Griffiths et al. used a support vector machine classifier and post classification comparison to determine the spatial-temporal patterns of urban land use and land cover changes in the Dhaka megacity region between 1990 and 2006 [24]. Although the staged classification method is direct and effective, it often requires a large number of training samples for the classification process, and all of the images used in each stage need to be interpreted, making it very time consuming and unsuitable for examining changes in large areas [17]. The change detection method identifies the changes in an area by monitoring the differences in the spectrum, texture, and other features of stacked images, and it then updates the urbanized areas in different years based on the initial land use data [25,26]. For example, Wang et al. used the spatial-temporal consistency check method to detect changes in area and mapped global land cover types in 2001 and 2010 using multiple-year time series Moderate Resolution Imaging Spectrometer data [27]. Fu et al. optimized the Cubist tree model to analyze the impervious surface percentage series and investigated the urban renewal between 2000 and 2010 in Guangzhou [28]. The change detection method can effectively solve the complexity and uncertainty of the staged classification method [16]; however, change detection based on pixels is prone to producing fragmented data, which is not conducive to depicting urban forms at the macro level. Moreover, the detection of abrupt changes often leads to error accumulation, thereby reducing the accuracy of urban land information [29]. To solve these problems, this study proposed an object-oriented retro-updating method based on current land use information to obtain urban land data for a historical period.
Although urban expansion has been widely and vigorously studied around the world, relatively little attention has been paid to determining the spatial-temporal characteristics of the urban expansion on both banks of the Strait of Malacca [30]. Urban changes in the developed regions may be more attractive to researchers; however, the vast areas on both banks of the strait and the poor image quality caused by the cloudy and rainy climate increase the difficulty in multi-phase urban land use mapping, which may discourage researchers from studying this region [31]. To date, few studies on the spatial-temporal evolution of urban land area have been conducted on the Strait of Malacca [32,33,34,35,36]. By interpreting Landsat images taken in 2004, 2011, and 2018, Tew et al. used change detection to evaluate the spatial-temporal trends in the urban expansion in Penang [31]. Another similar study was conducted by Samat, who focused on the expansion of built-up areas in the Seberang Perai region. The CA-Markov model was used to predict the spatial pattern of the expansion of the built-up area in 2015. The results revealed that new development is expected to continue encroaching on the existing open space and agricultural areas [37]. For the urban expansion approach, Li et al. used the expansion speed of impervious surfaces and landscape pattern metrics to evaluate the pattern of expansion in Kuala Lumpur and Singapore [38]. In addition, Yao et al. investigated the degree of urban expansion based on land development intensity [39]. These studies were limited, however, to the analysis of single or multiple cities and failed to provide an overall analysis of the changes in urban land use on both banks of the strait. In response to this shortcoming, Yan et al. and Zhang et al. investigated the land development intensity on the landward side within 20 km of the Strait of Malacca and evaluated the characteristics of the land development and utilization patterns in the coastal zone [30,40]. Their studies, however, treated the coastal region as a whole and did not include an in-depth analysis of the key areas. Because the Strait of Malacca is an important maritime channel, ports exert a significant influence on the development of the urban land on both banks. Analysis of the spatial-temporal evolution of port land use could clarify the scope of the influence radiating from the ports and reveal the intensity, process, and direction of the regional development. Nevertheless, the current research on these aspects is relatively incomplete. In addition, Zhang et al. pointed out that it is of great significance to rationally optimize the spatial pattern of land use in the coastal zones by clarifying the differences in the coastal zone development on the vertical gradient of the shoreline [40]. Thus, comprehensive studies that address both the common and regional features of the urban land area changes on both banks of the strait should be highlighted in the next step of study.
The general goal of this study was to analyze urban expansion using the rapid extraction of multi-phase urban land information with special consideration for differences between the two banks and the different ports. In this study, we proposed an object-oriented retro-updating method for time series urban land areas mapping to support the detailed evolution analysis of large regions. We analyzed the changes and regional differences in the urban land areas on the landward side within 100 km of both banks of the Strait of Malacca for the 1990–2018 period from the surface level area (coastal zone) to the point level area (major ports). The results of this study provided reference information for improving urban land planning in this area in the future. The research stages of this study were as follows. (1) The urban land data for both banks of the Strait of Malacca from 1990 and 2018 were extracted using the proposed method. (2) The grid analysis method was used to depict the development intensity on both banks of the strait. (3) The zoning statistics method was used to reveal the differentiation in the urban land use on both banks and the zonality law of urban expansion. (4) We investigated the spatial-temporal characteristics of the land use and the influence scope of the major ports using gradient direction analysis. (5) Finally, we analyzed and compared the factors that affect the intensity of the urban development on both banks of the strait and provided proposals for future urban development. In summary, this study not only analyzed the evolution of the urban land area from a macroscopic perspective but also focused on the comparative analysis of the major ports’ development and the zonality law of urban expansion to establish a foundation for the in-depth identification of the changes and regional differences in the urban land areas on both banks of the Strait of Malacca.

2. Materials and Methods
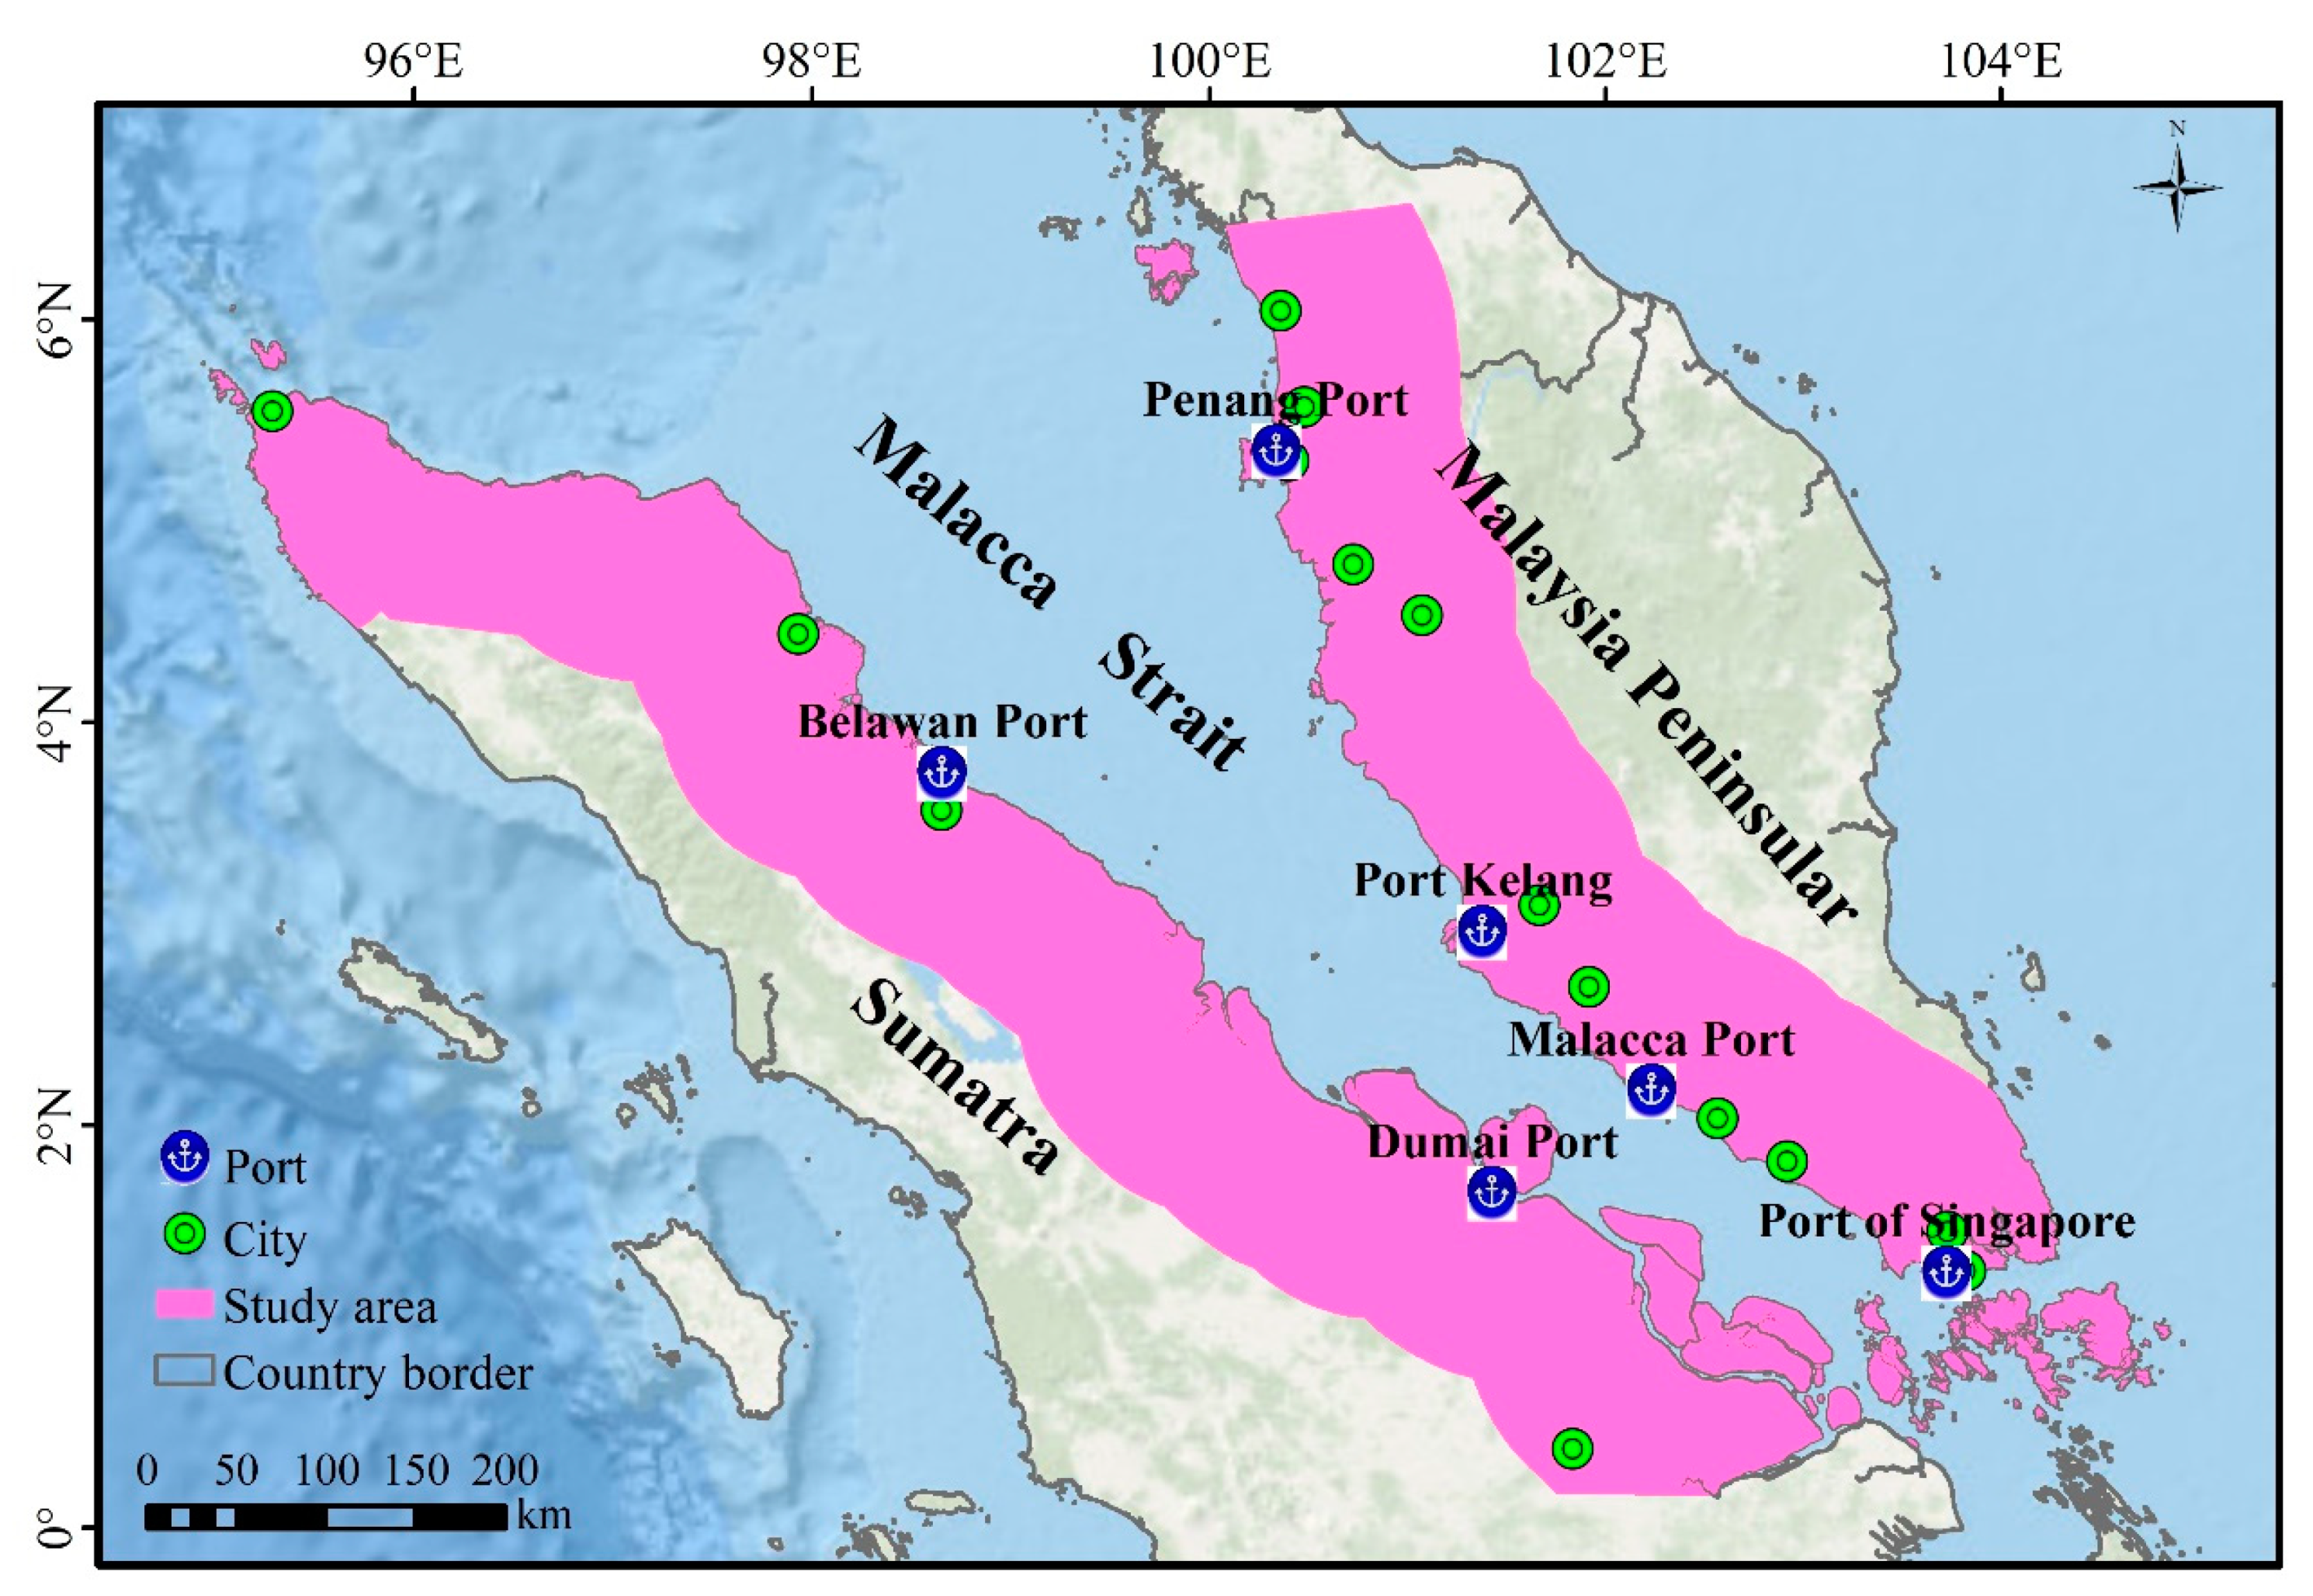
2.1. Study Area

The study area was on the landward side within 100 km of both banks of the Strait of Malacca (Figure 1). On the western bank of the strait is the Indonesian island of Sumatra, which is a vast landmass with a low and flat terrain. Most of the areas on this bank are large swamps, muddy islands, and mangrove beaches, which have been found to produce oil and gas. On the eastern bank of the strait is the Malaysian Peninsula, which is dominated by an alluvial plain, scattered headlands, and rock islands. This is a convenient area for ships to berth. Most of the population of Malaysia resides here [1]. The study area is located in the equatorial windless zone and it has a typical tropical climate, with high temperatures, large amounts of rainfall, and very light winds [41]. The Strait of Malacca has a navigational history stretching back more than 2000 years and is an important part of the global sea route. Busy shipping has accelerated economic development and urban expansion on the two banks of the strait.

2.2. Data Processing

The Strait of Malacca is located in a cloudy tropical area where massive clouds and shadows cause significant challenges in image interpretation [42,43,44]. In this regard, Yang et al. demonstrated that radar images can effectively improve the accuracy of urban land classification in cloudy areas [45]. In addition, it is difficult to distinguish the similar spectral features of different objects from a single remote sensing image [46,47,48,49]. Therefore, in this study, we used Landsat Operational Land Imager (OLI) and Advanced Land Observing Satellite-1 phased array type L-band synthetic aperture radar (ALOS PALSAR) images to extract the urban land information for 1990 and 2018. Filtering and processing of the Landsat images were conducted using the Google Earth Engine (GEE) cloud platform. First, we selected all of the surface reflectance images of the study area taken in 1990 and 2018 and removed the clouds and shadows in each image using the CFMask algorithm [50]. Then, we used the median of the pixels in the images from the same year to synthesize a cloudless and shadowless image.
The ALOS PALSAR images were generated by the Japan Aerospace Exploration Agency. The data included the HH and HV polarization bands, and the spatial resolution of the data was 25 m. The HH band used horizontal transmission and a horizontal receiver while HV used horizontal transmission and a vertical receiver. In this study, we used the 2018 images and converted the digital numbers of the HH and HV bands to gamma naught backscattering coefficients using Equation (1) [51].
γ0 = 10 × log10DN2 − 83
where γ0 is the backscattering coefficient; and DN is the digital number of the amplitude image.
In addition, we used the ratio (HH/HV) and difference (HH–HV) of the HH and HV bands for image classification. In this study, we utilized median filtering to process the PALSAR images and used a 3 × 3 window size to reduce the occurrence of speckles. The four bands (HH, HV, HH/HV, and HH–HV) of the radar image were resampled to 30 m using the nearest-neighbor method and were reprojected onto the Universal Transverse Mercator (UTM) projection and Datum World Geodetic System 1984 (WGS84) for consistency with the Landsat OLI images.

2.3. Methods

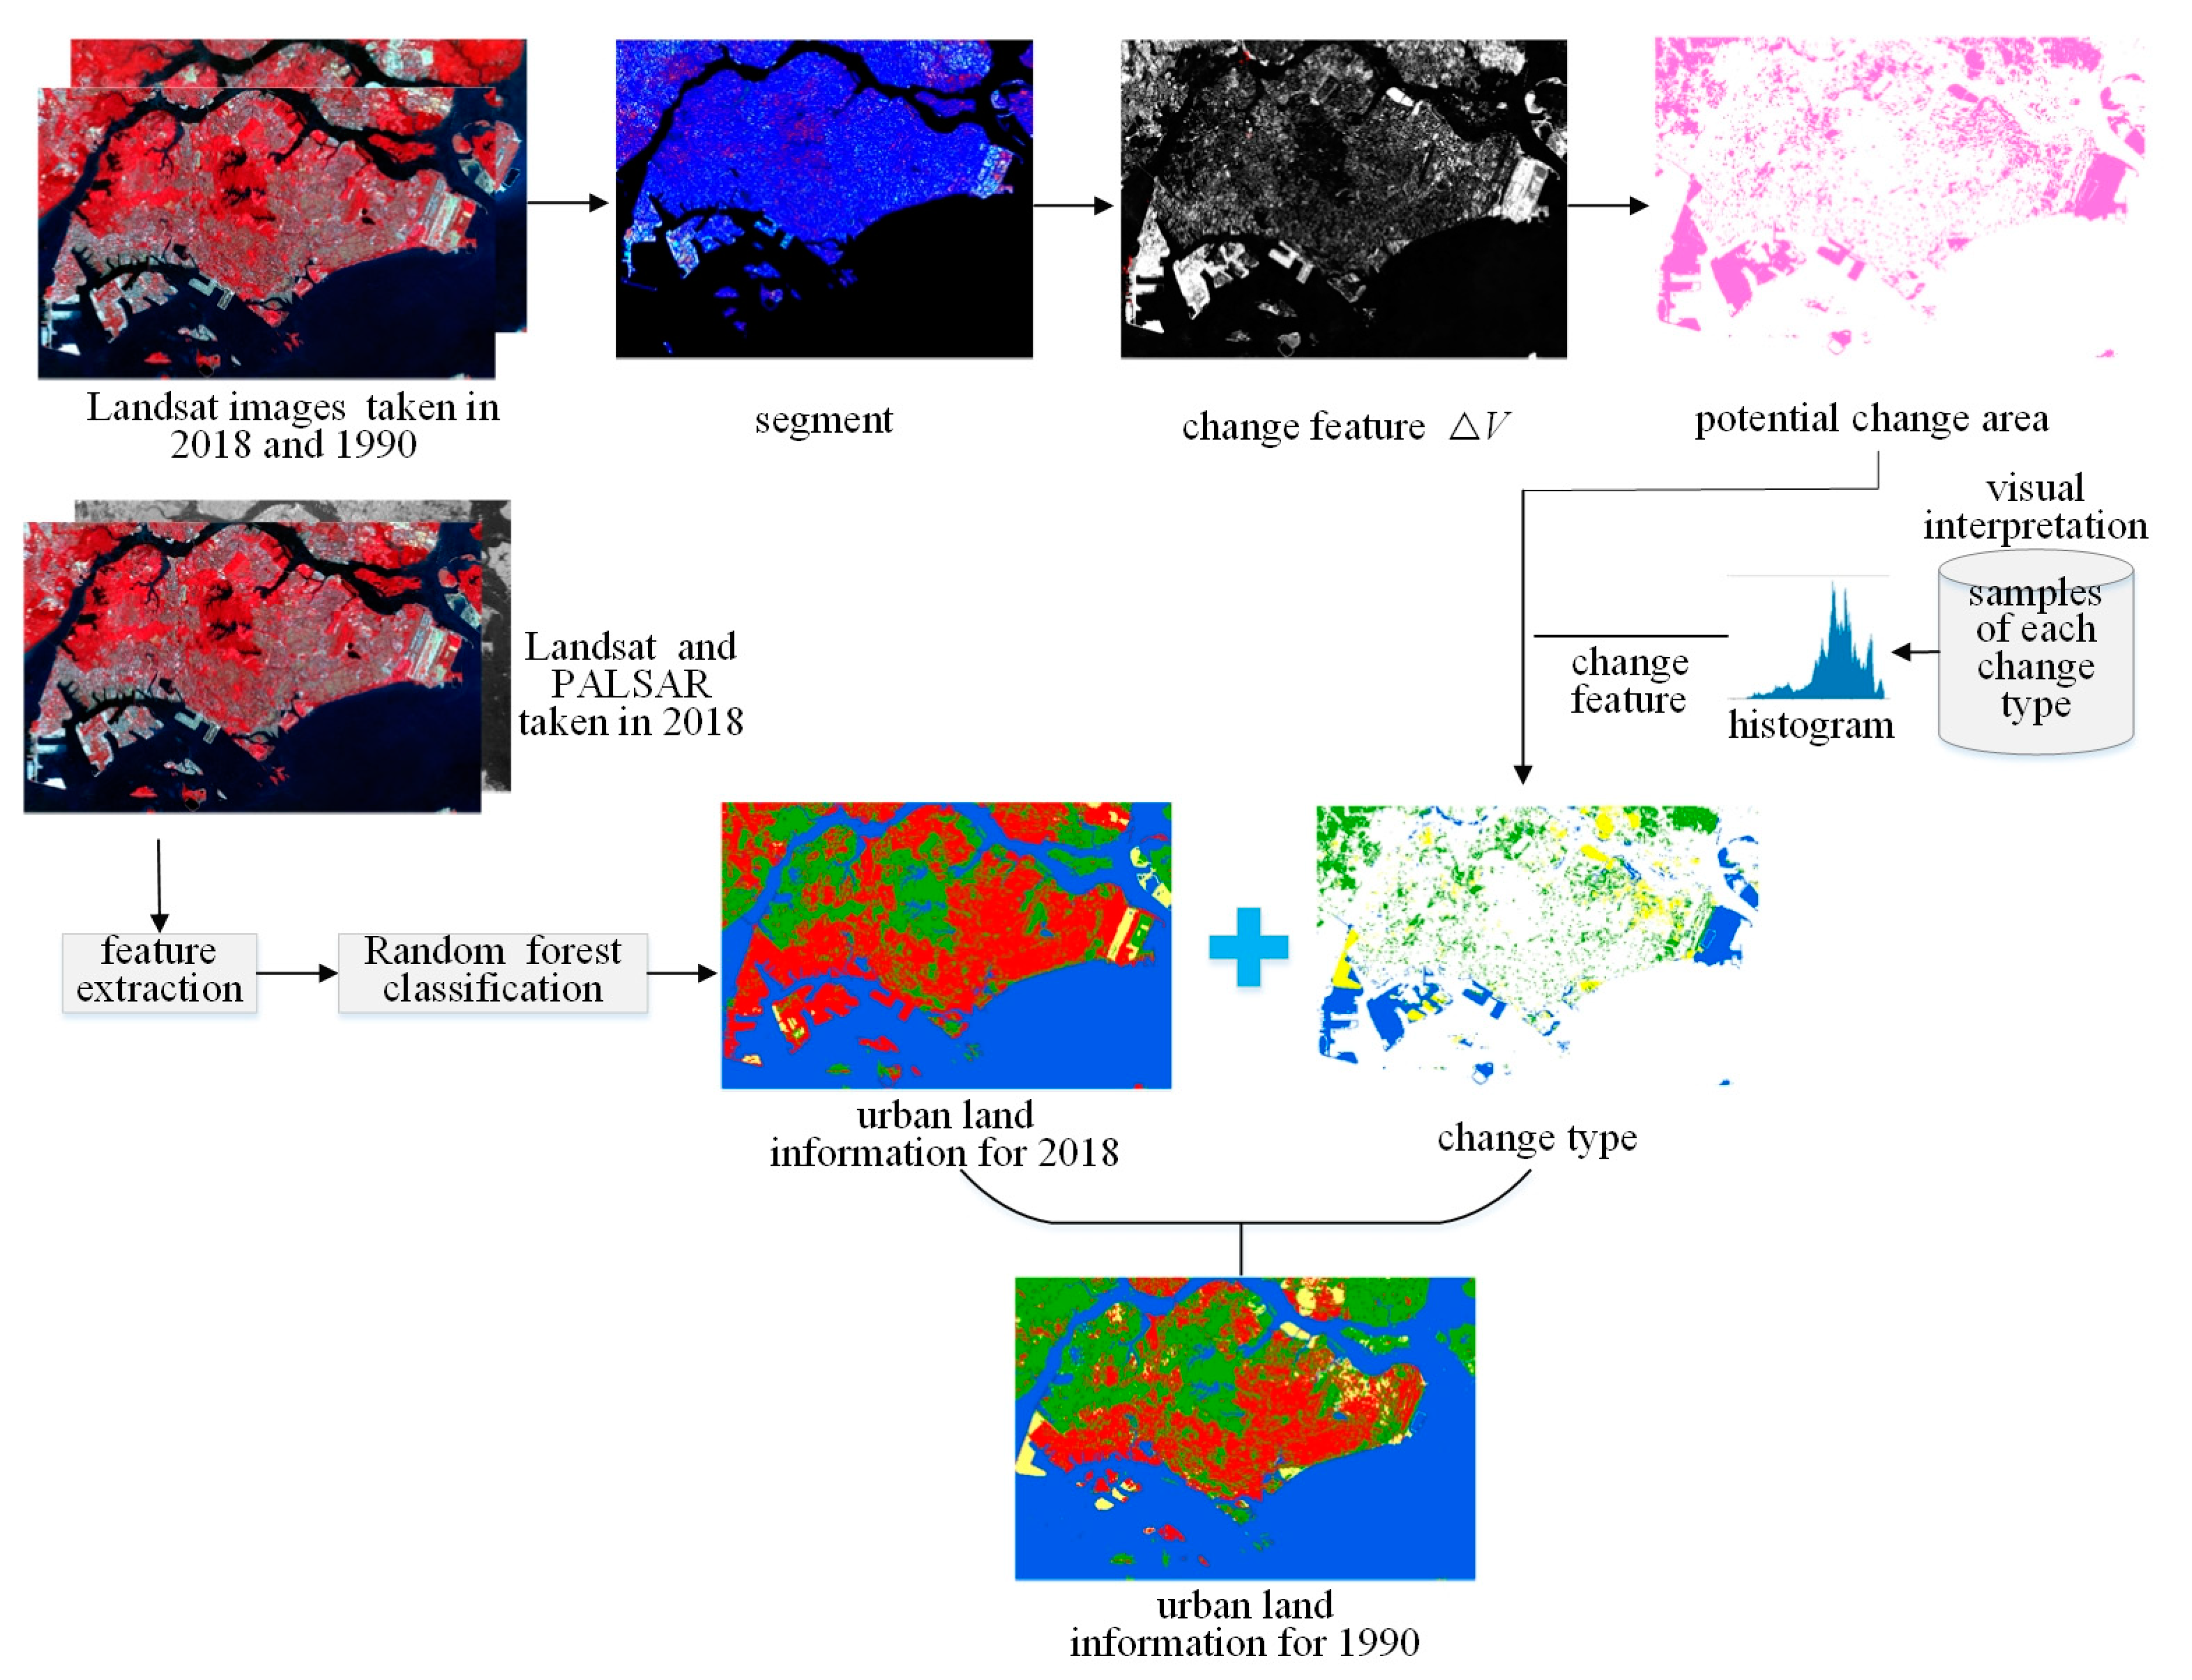
2.3.1. Urban Land Area Extraction

To obtain the urban land area information, in this study, we categorized the land cover types as vegetation, water body, urban land, and bare land. The term “urban land” referred to impervious surfaces—that is, the areas formed by human-made construction, such as roads, buildings, parking lots, and various settlements, excluding contiguous green land and water bodies in residential areas [6,7,52].
The object-oriented retro-updating method included two steps (Figure 2): (1) We used Landsat OLI images and PALSAR images to extract urban land information for 2018 by the object-oriented classification method. (2) Based on the current products extracted in the previous step and the two phases of the Landsat images (1990 and 2018), we updated the urban land data for 1990 according to the change detection.
In this study, we used the seven spectral bands of the Landsat OLI (visible, near-infrared, and short-wave infrared) and the four bands of the PALSAR (HH, HV, HH/HV, and HH–HV). On the basis of previous research, we used the mean and standard deviation of each spectral band and scattering band, the gray-level co-occurrence matrix (GLCM) texture features of the HH and HV bands, the normalized difference vegetation index (NDVI), the modified normalized difference water index (MNDWI), the normalized difference building index (NDBI), the length/width, and the shape and border indices of each segmented object as the classification features [53,54,55].
We used eCognition 9.0 developer software for the classification. After repeated human–computer interaction experiments, by considering the segmentation accuracy and efficiency, we set the segmentation scale to 80 and used the default values for the other segmentation parameters. The random forest classifier operates by constructing a large number of decision trees, which has been demonstrated to have the advantages of a fast learning speed and a high classification accuracy [56,57]. Therefore, in this study, we used the random forest classifier to obtain the land cover information for 2018. In addition, based on previous studies, we set the number of trees to 100 and used the default values for the other parameters [58].
In this study, according to the spectral characteristics of the Landsat images taken in 1990 and 2018, we divided the superimposed two-phase images into homogeneous objects with a segmentation scale of 30. Then, we used the differences in the NDVI, MNDWI, NDBI, and the standardized short-wave infrared of each segmented object to construct the change feature Δ V :
Δ V = d N D V I 2 + d M N D W I 2 + d N D B I 2 + d S W I R 2 ,
where dNDVI, dMNDWI, dNDBI, and dSWIR are the differences in the NDVI, MNDWI, NDBI, and standardized short-wave infrared of each segmented object, respectively. Objects with large values were considered to be potential change areas. The n-times standard deviation method was used to determine the change threshold value and to obtain the change area.
T = V ¯ + n σ ,
where T is the change threshold value; V ¯ is the mean of Δ V ; σ is the standard deviation of Δ V ; and n is a constant, the value of which is usually between −1 and 1. Because of the landscape differences in the different regions or during the different periods, it is difficult to set a universal n value. Therefore, in this study, the n value was selected to be −0.5, 0, 0.5, and 1 based on the specific human–computer interaction.
In the process of urban development, the spatial scope of urban spaces is constantly expanding. Research by Li et al. revealed that this expansion includes not only the transformation of vegetation but also of water body and bare land [17]. Therefore, when tracing back to the historical period, the change area is often the reverse transformation of the previous process—that is, from urban land to vegetation, water body, and bare land. For the change area, the change type needs to be determined from the change in the characteristic index. The four different land use types could form four types of change patterns: other types into vegetation, other types into water body, other types into bare land, and other types into urban land. Theoretically, if the other land use types in 2018 transformed into vegetation in 1990, the value of the NDVI in 2018 should be smaller than that in 1990—that is, the difference between the NDVI in 2018 and that in 1990 should be <0. Similarly, other conversion situations also have similar rules. To clarify the changes in the characteristic indices (i.e., dNDVI, dMNDWI, dNDBI, NDVI, MNDWI, NDBI, and rectangle fit) for various transformation types and to summarize the threshold values of the change types, in this study, we manually selected the change samples and counted the value range of the characteristic indices of the various change samples using histograms. The rectangle fit was mainly used to identify shadows in high-density building areas with similar spectral characteristics to water body to prevent the shadows of tall buildings from being misclassified as water body. On the basis of the statistical results of the histograms, we determined the rules of each transformation type, which are presented in Table 1. According to these rules, the change type of each change object was determined. Finally, we obtained the urban land information for 1990 by updating the change areas of the 2018 data.
To evaluate the accuracy of the results, we divided the classification results into two categories: urban land and non-urban land (vegetation, water body, and bare land). The 193 field survey points assessed in Malaysia in 2018 and in Indonesia in 2019 and the manually labeled verification points were taken as the reference data. To ensure that the 2019 points were consistent with the 2018 data to be verified in this study, we modified the categories of the changed investigation points in 2019 by comparing them with the high-resolution Google images taken in 2018. Then, by combining the investigation points, we encrypted verification points to 3193 to obtain sufficient validation samples using the high-resolution Google images taken in 2018. We labeled the verification points in 1990 using visual interpretation of high-resolution Google images taken in the same year. If the historical Google Earth image of a verification point was not available for the interpretation, we discarded the verification point. Finally, we obtained 3193 verification points for 2018 and 1061 verification points for 1990. The verification results revealed that the overall accuracies of the urban land data for 2018 and 1990 were 91.16% and 86.33%, respectively.

2.3.2. Grid Analysis

The intensity of the land development represents the degree of the land use in a certain area and reflects the intensity of urban development in that area. It is usually expressed as the proportion of construction land area to the statistical unit area:
U L D I = U L A A r e a ,
where ULDI is the urban land development intensity of the statistical region; and ULA and Area are the area of urban land and the total area of the statistical region, respectively.
We used grid analysis to clearly and intuitively characterize the spatial differentiation of the land development intensity on both banks of the Strait of Malacca. Therefore, we selected a 10 km × 10 km grid as the statistical unit to calculate the land development intensities on both banks in 1990 and 2018. We divided development intensity into four grades: low development (<0.1), moderate development (0.1–0.3), higher development (0.3–0.6), and high development (≥0.6) [40].

2.3.3. Zoning Statistics

To explore the differentiation of the urban distribution and the zonality laws of urban expansion, the landward side within 100 km of both banks was divided at intervals of 20 km, starting at the coastline: 0–20, 20–40, 40–60, 60–80, and 80–100 km regions. Then, the urban land area and the average annual expansion rate of each region were calculated as follows:
A A E R = U L A t + n U L A t n ,
where AAER is the average annual expansion rate of the statistical region; and ULAt+n and ULAt are the areas of urban land at time t and time t + n in the statistical region, respectively.
In this study, we divided the urban expansion speed into four categories: very fast expansion (>10 km2/year), fast expansion (6–10 km2/year), moderately slow expansion (2–6 km2/year), and slow expansion (<2 km2/year).

2.3.4. Gradient Direction Analysis

Gradient direction analysis is an effective method of characterizing changes in land use pattern [13,14]. The busy port transportation in the Strait of Malacca has promoted urban development, especially the development of port cities. To investigate spatial-temporal variations in the expansion of the urban land areas around each port, in this study, we used a gradient direction analysis to analyze the expansion of the urban land areas around Port Kelang, the Port of Singapore, Malacca Port, Penang Port, Belawan Port, and Dumai Port. In this method, we first set each port as the center of a ring and drew 10 concentric rings over the urban areas at 2-km intervals. Then, we drew eight fans by extending the rays from the center of the concentric rings at intervals of 45°. Thus, the concentric rings intersecting the fans generated a series of segment zones. Finally, we set the land use type with the largest area in each segment zone as the representative land use type of the area.

3. Results

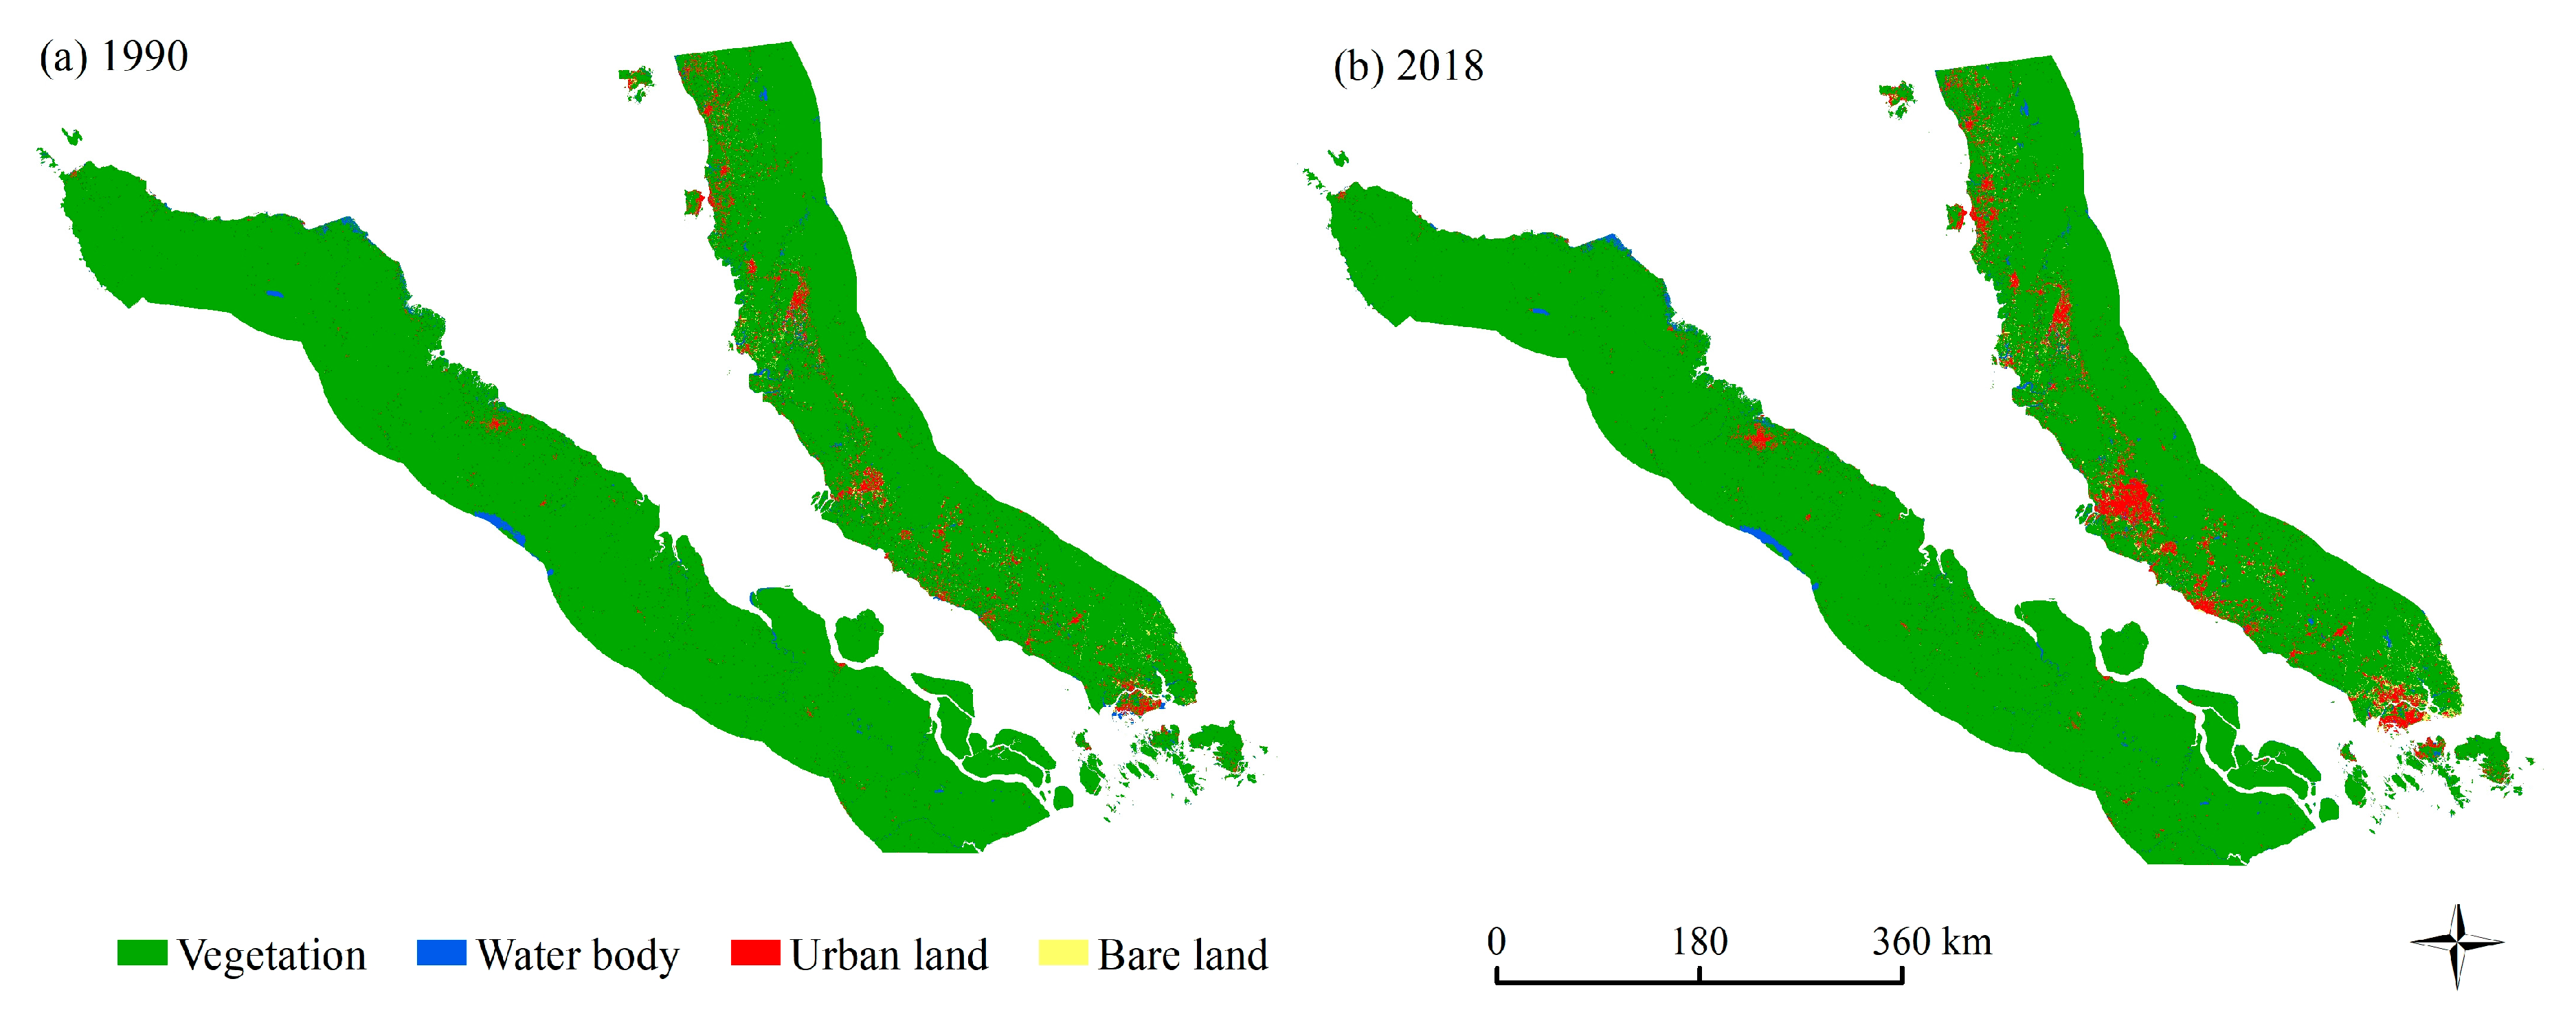
3.1. Results of the Urban Land Area Extraction

Figure 3 shows the results of the urban land area extraction within 100 km of both banks of the Strait of Malacca. As can be seen, in both 1990 and 2018, the scale of the urban land use on the eastern bank was larger than that on the western bank. There were few large cities on the western bank, except for Medan, and the opposite was true on the eastern bank, which contained Singapore, Johor Bahru, Malacca, Kuala Lumpur, George Town, and Ipoh. In 1990, the urban land areas on the eastern and western banks were 4246 and 839 km2, respectively; by 2018, the corresponding urban land areas had increased to 6412 and 1485 km2, respectively. The urban development level of the eastern bank is much higher than that of the western bank. This difference is reflected in the huge difference in economic development between the two banks, with that of the eastern bank being far ahead of the western bank.

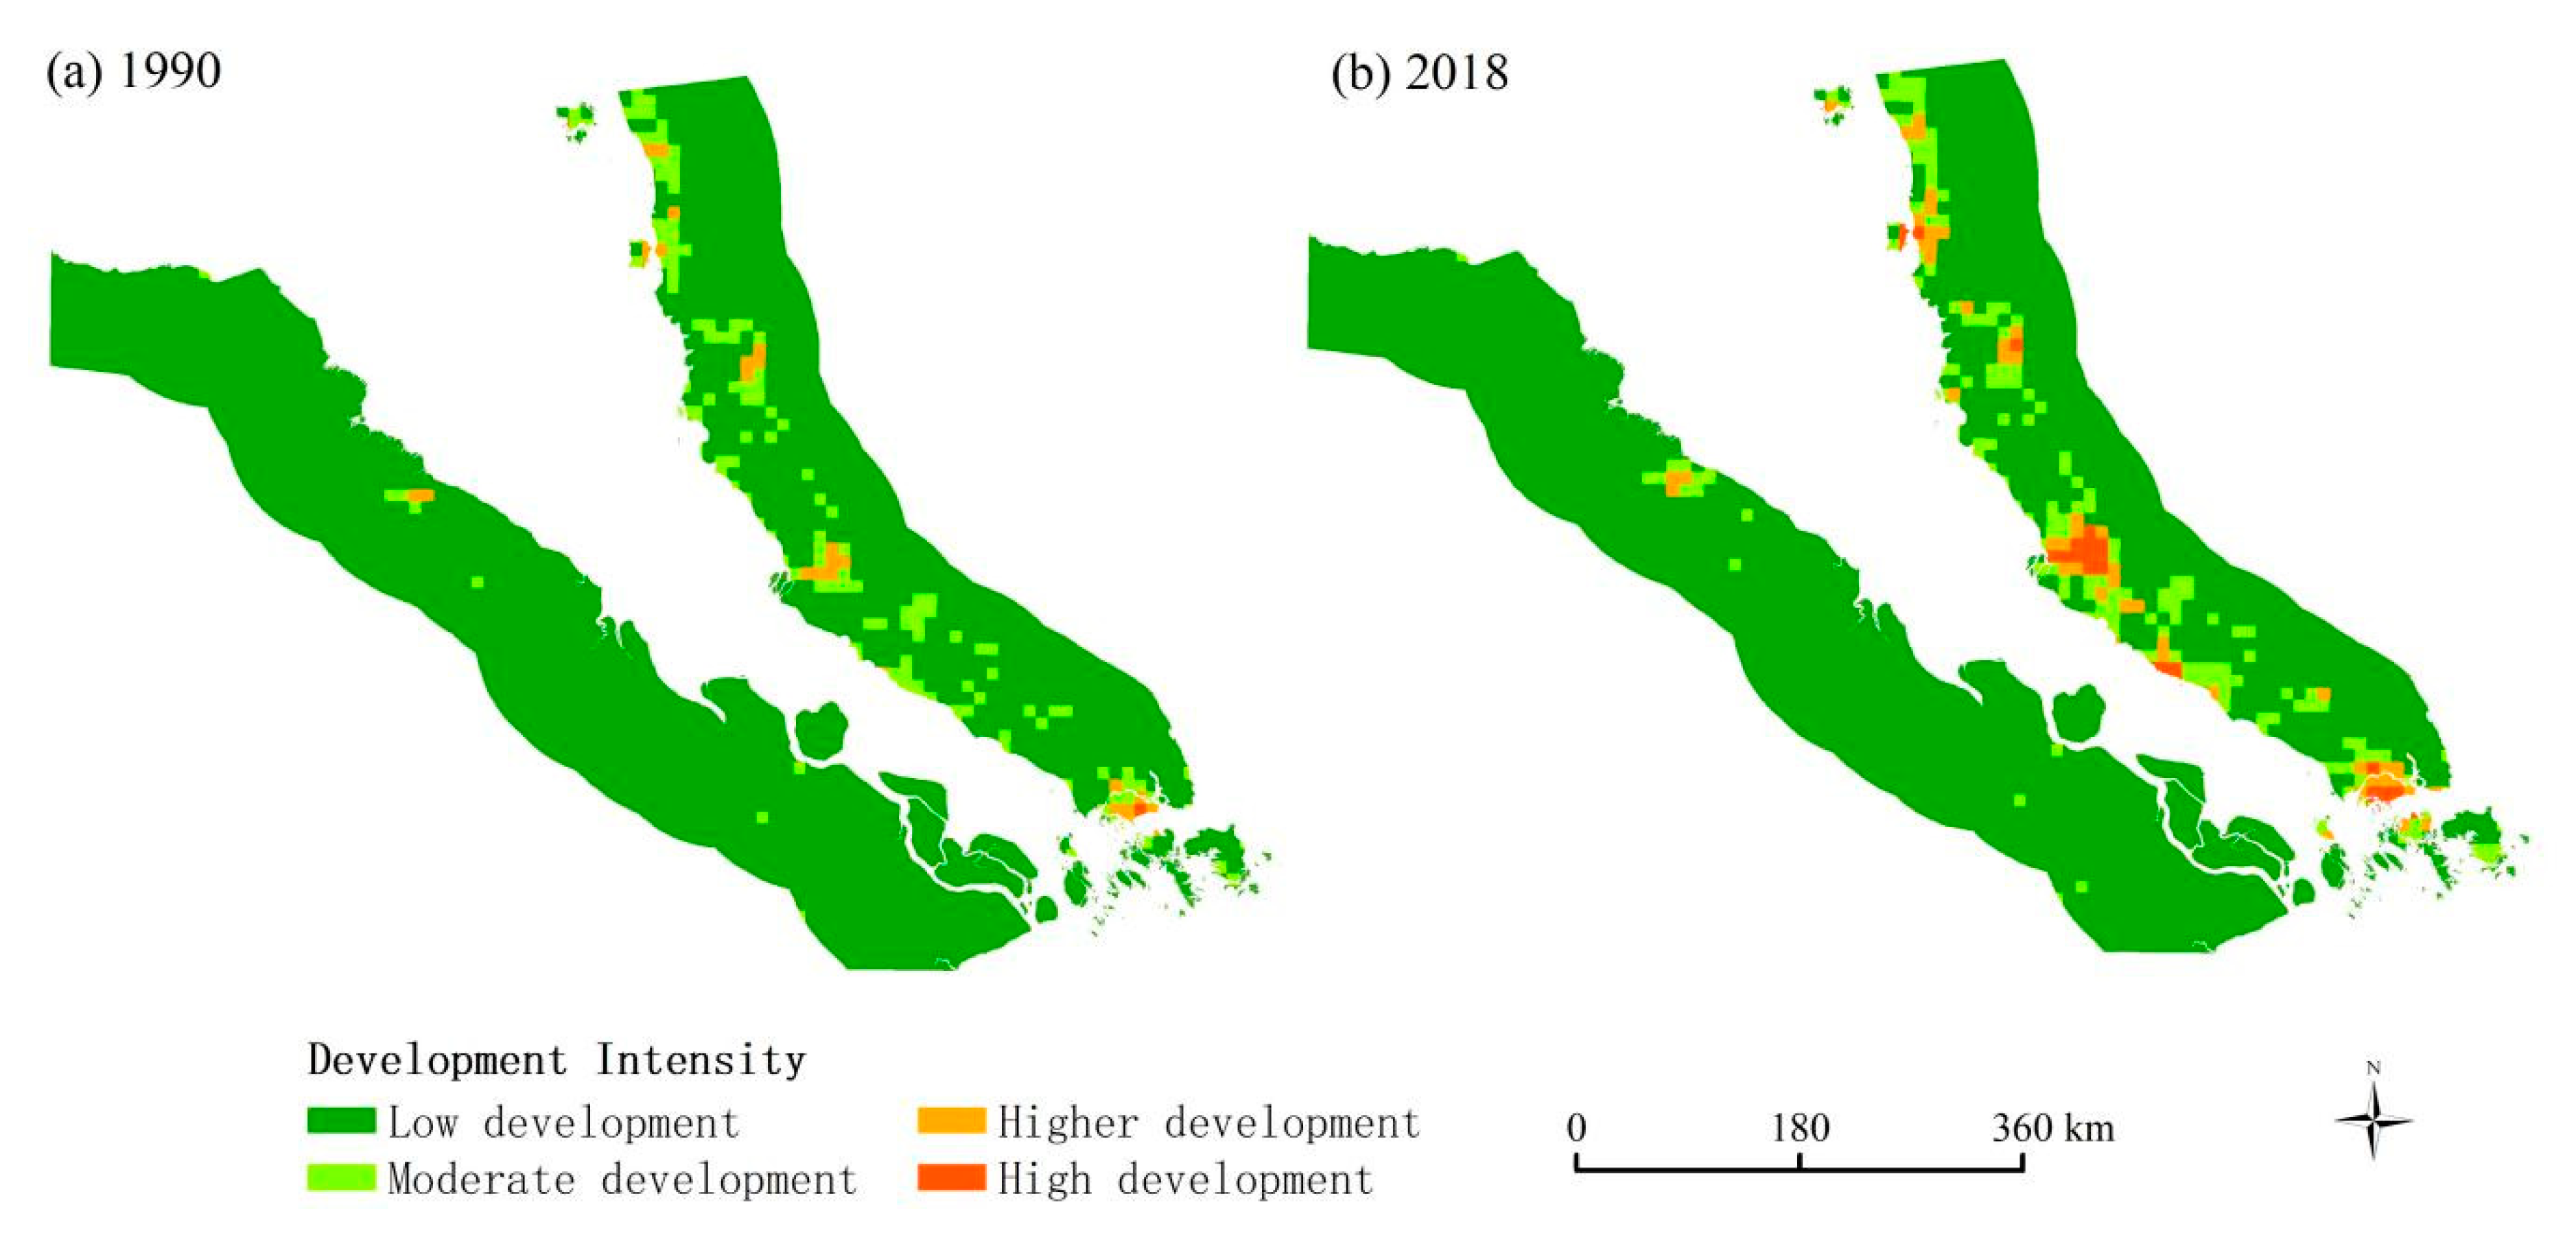
3.2. Urban Land Development Intensity

Figure 4 shows the development intensity of the urban land within 100 km of both banks of the Strait of Malacca. The development intensity of the eastern bank has been higher than that of the western bank over the past 30 years, and the development intensity of the urban land on the western bank has not changed much. In 1990, the lower development intensity area of the western bank accounted for 99.37% of the total area; by 2018, the proportion of the lower development intensity area had decreased to 98.73%. The higher development areas are distributed primarily near Medan.
On the eastern bank, the development intensity of the urban land has changed significantly, and in Kuala Lumpur, Singapore, Malacca, and Ipoh, it has increased significantly. In 1990, the proportion of high development intensity was 0.13%, and only a small area of Kuala Lumpur was highly developed. By 2018, the high development areas were more than 19 times larger. These expanded areas were located mainly around Kuala Lumpur, Singapore, and Malacca.

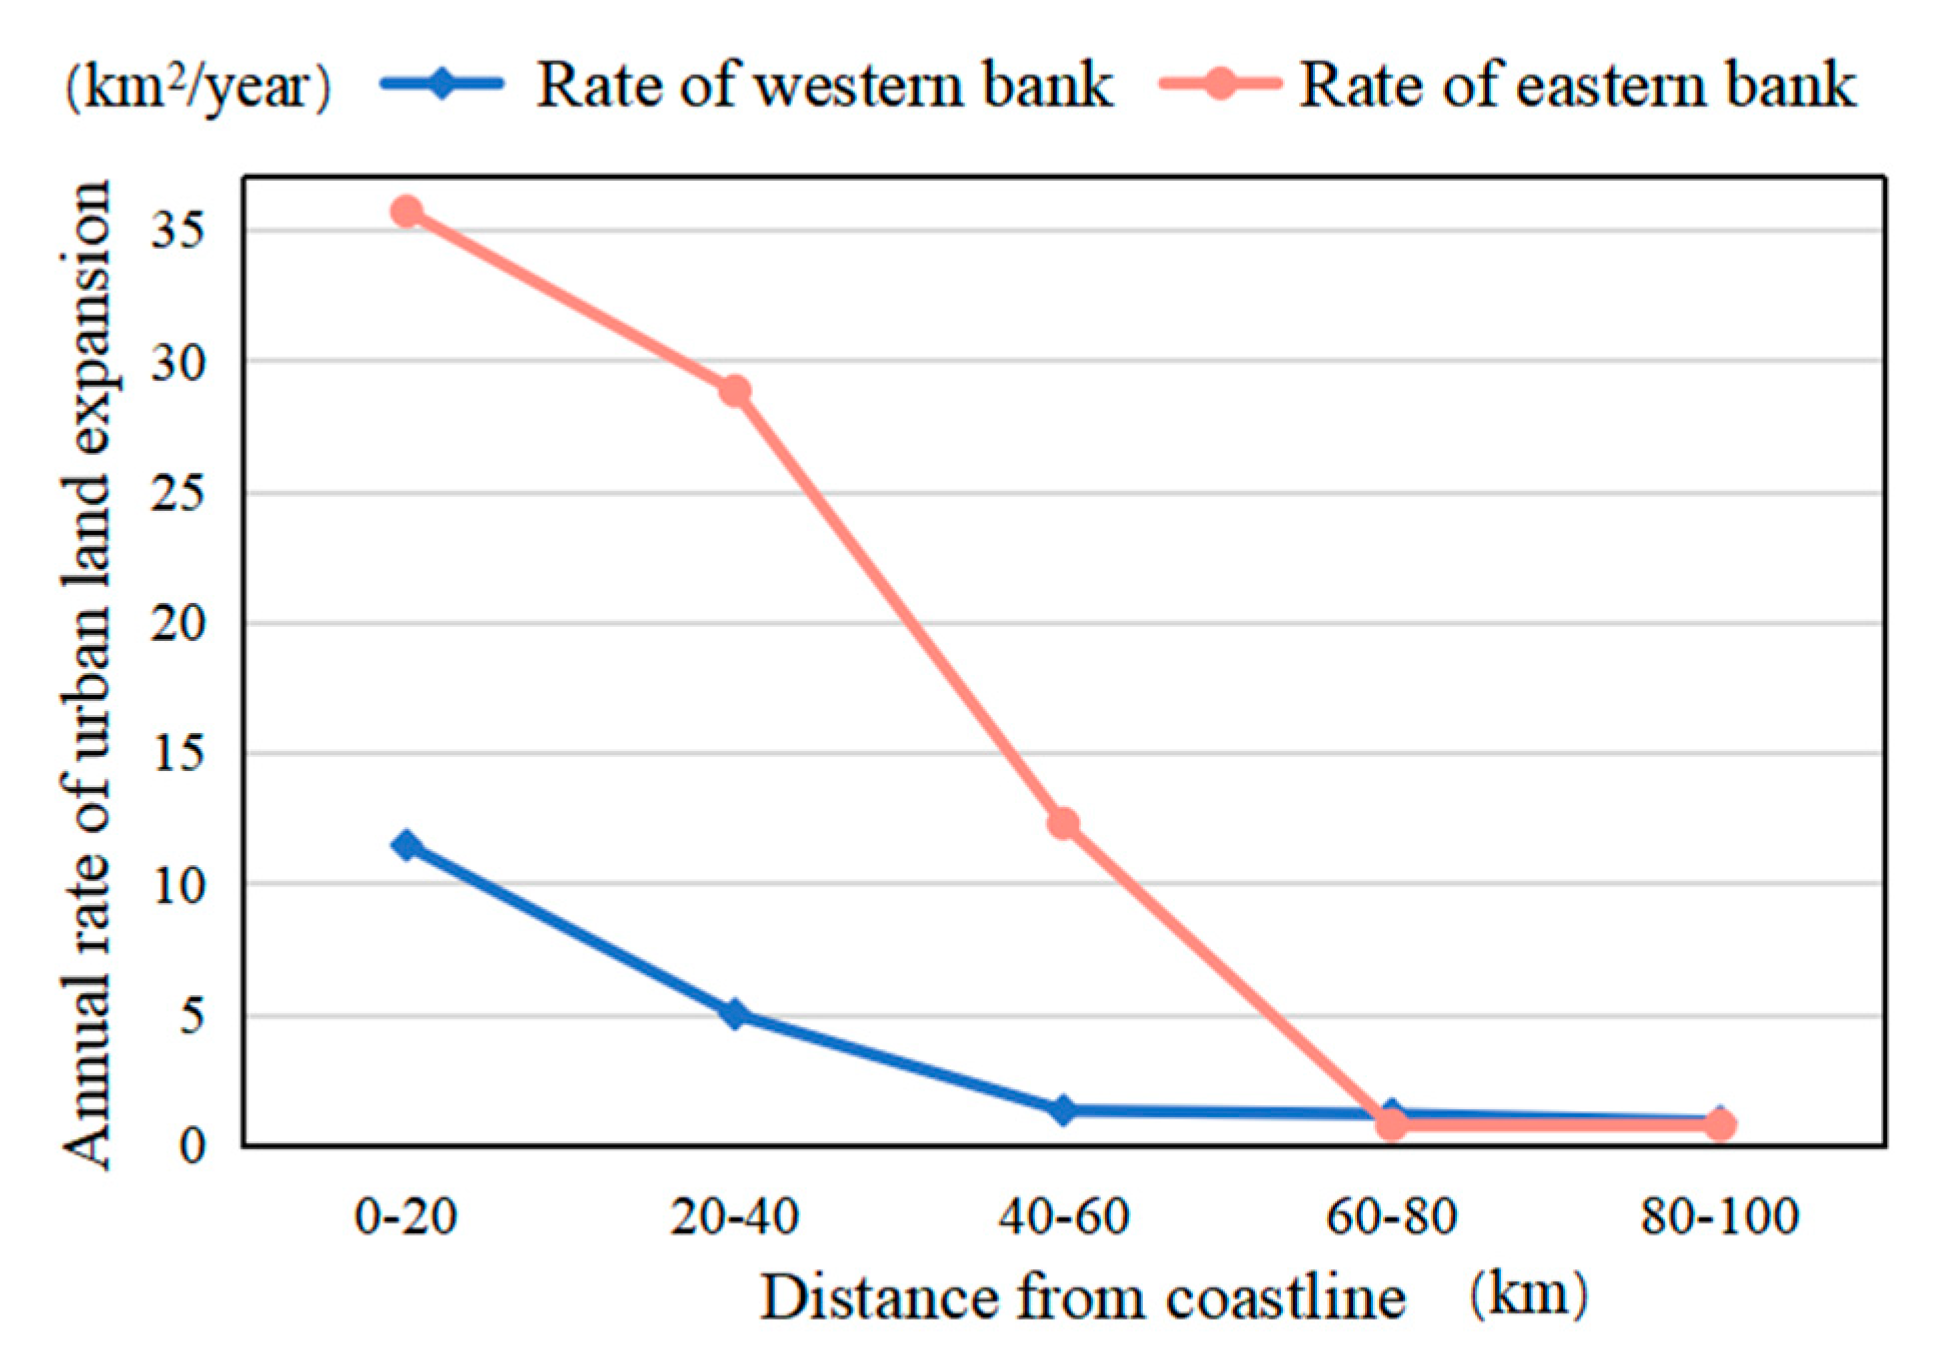
3.3. Zonality Laws of Urban Expansion

To explore the differentiation of urban distribution and the zonality laws of urban expansion, we employed the zoning statistics method to calculate the area of urban land and the average annual expansion rate in each zone. As shown in Figure 5, in all of the coastal zones, the area of urban land on the eastern bank was larger than that on the western bank. In terms of zonality, as the distance from the coastline increased, the area of urban land on both banks gradually decreased, indicating that the coastal areas developed faster than the inland areas over the past 30 years. In 1990, the urban land areas within 60 km of the coastline on the eastern and western banks accounted for 92.88% and 85.68% of the total area of urban land on each bank, respectively. By 2018, the corresponding proportions had reached 94.66% and 87.23%, respectively. Therefore, the urban land areas on both banks were distributed mainly within 60 km of the coast.
As shown in Figure 6, the average annual expansion rate of the coastal area on the western bank was lower than that on the eastern bank. The farther from the coast, the smaller the difference between the expansion rates of the two banks. In the 60–100 km zone, the expansion rate of the western bank surpassed that of the eastern bank. The expansion rates of the urban land on both banks obeyed the same zonality law—that is, the farther away from the coastline, the lower the expansion rate. In the inland area 60 km from the coast, the average annual expansion rate was <1 km2/year. The difference is that the expansion rate of the urban land on the eastern bank decreased continuously in the areas within 100 km of the coast, whereas that on the western bank decreased significantly only within 60 km of the coast. This showed that the urban expansion scope on the eastern bank was wider and extended farther inland, whereas the western bank was developed mainly in the coastal areas.

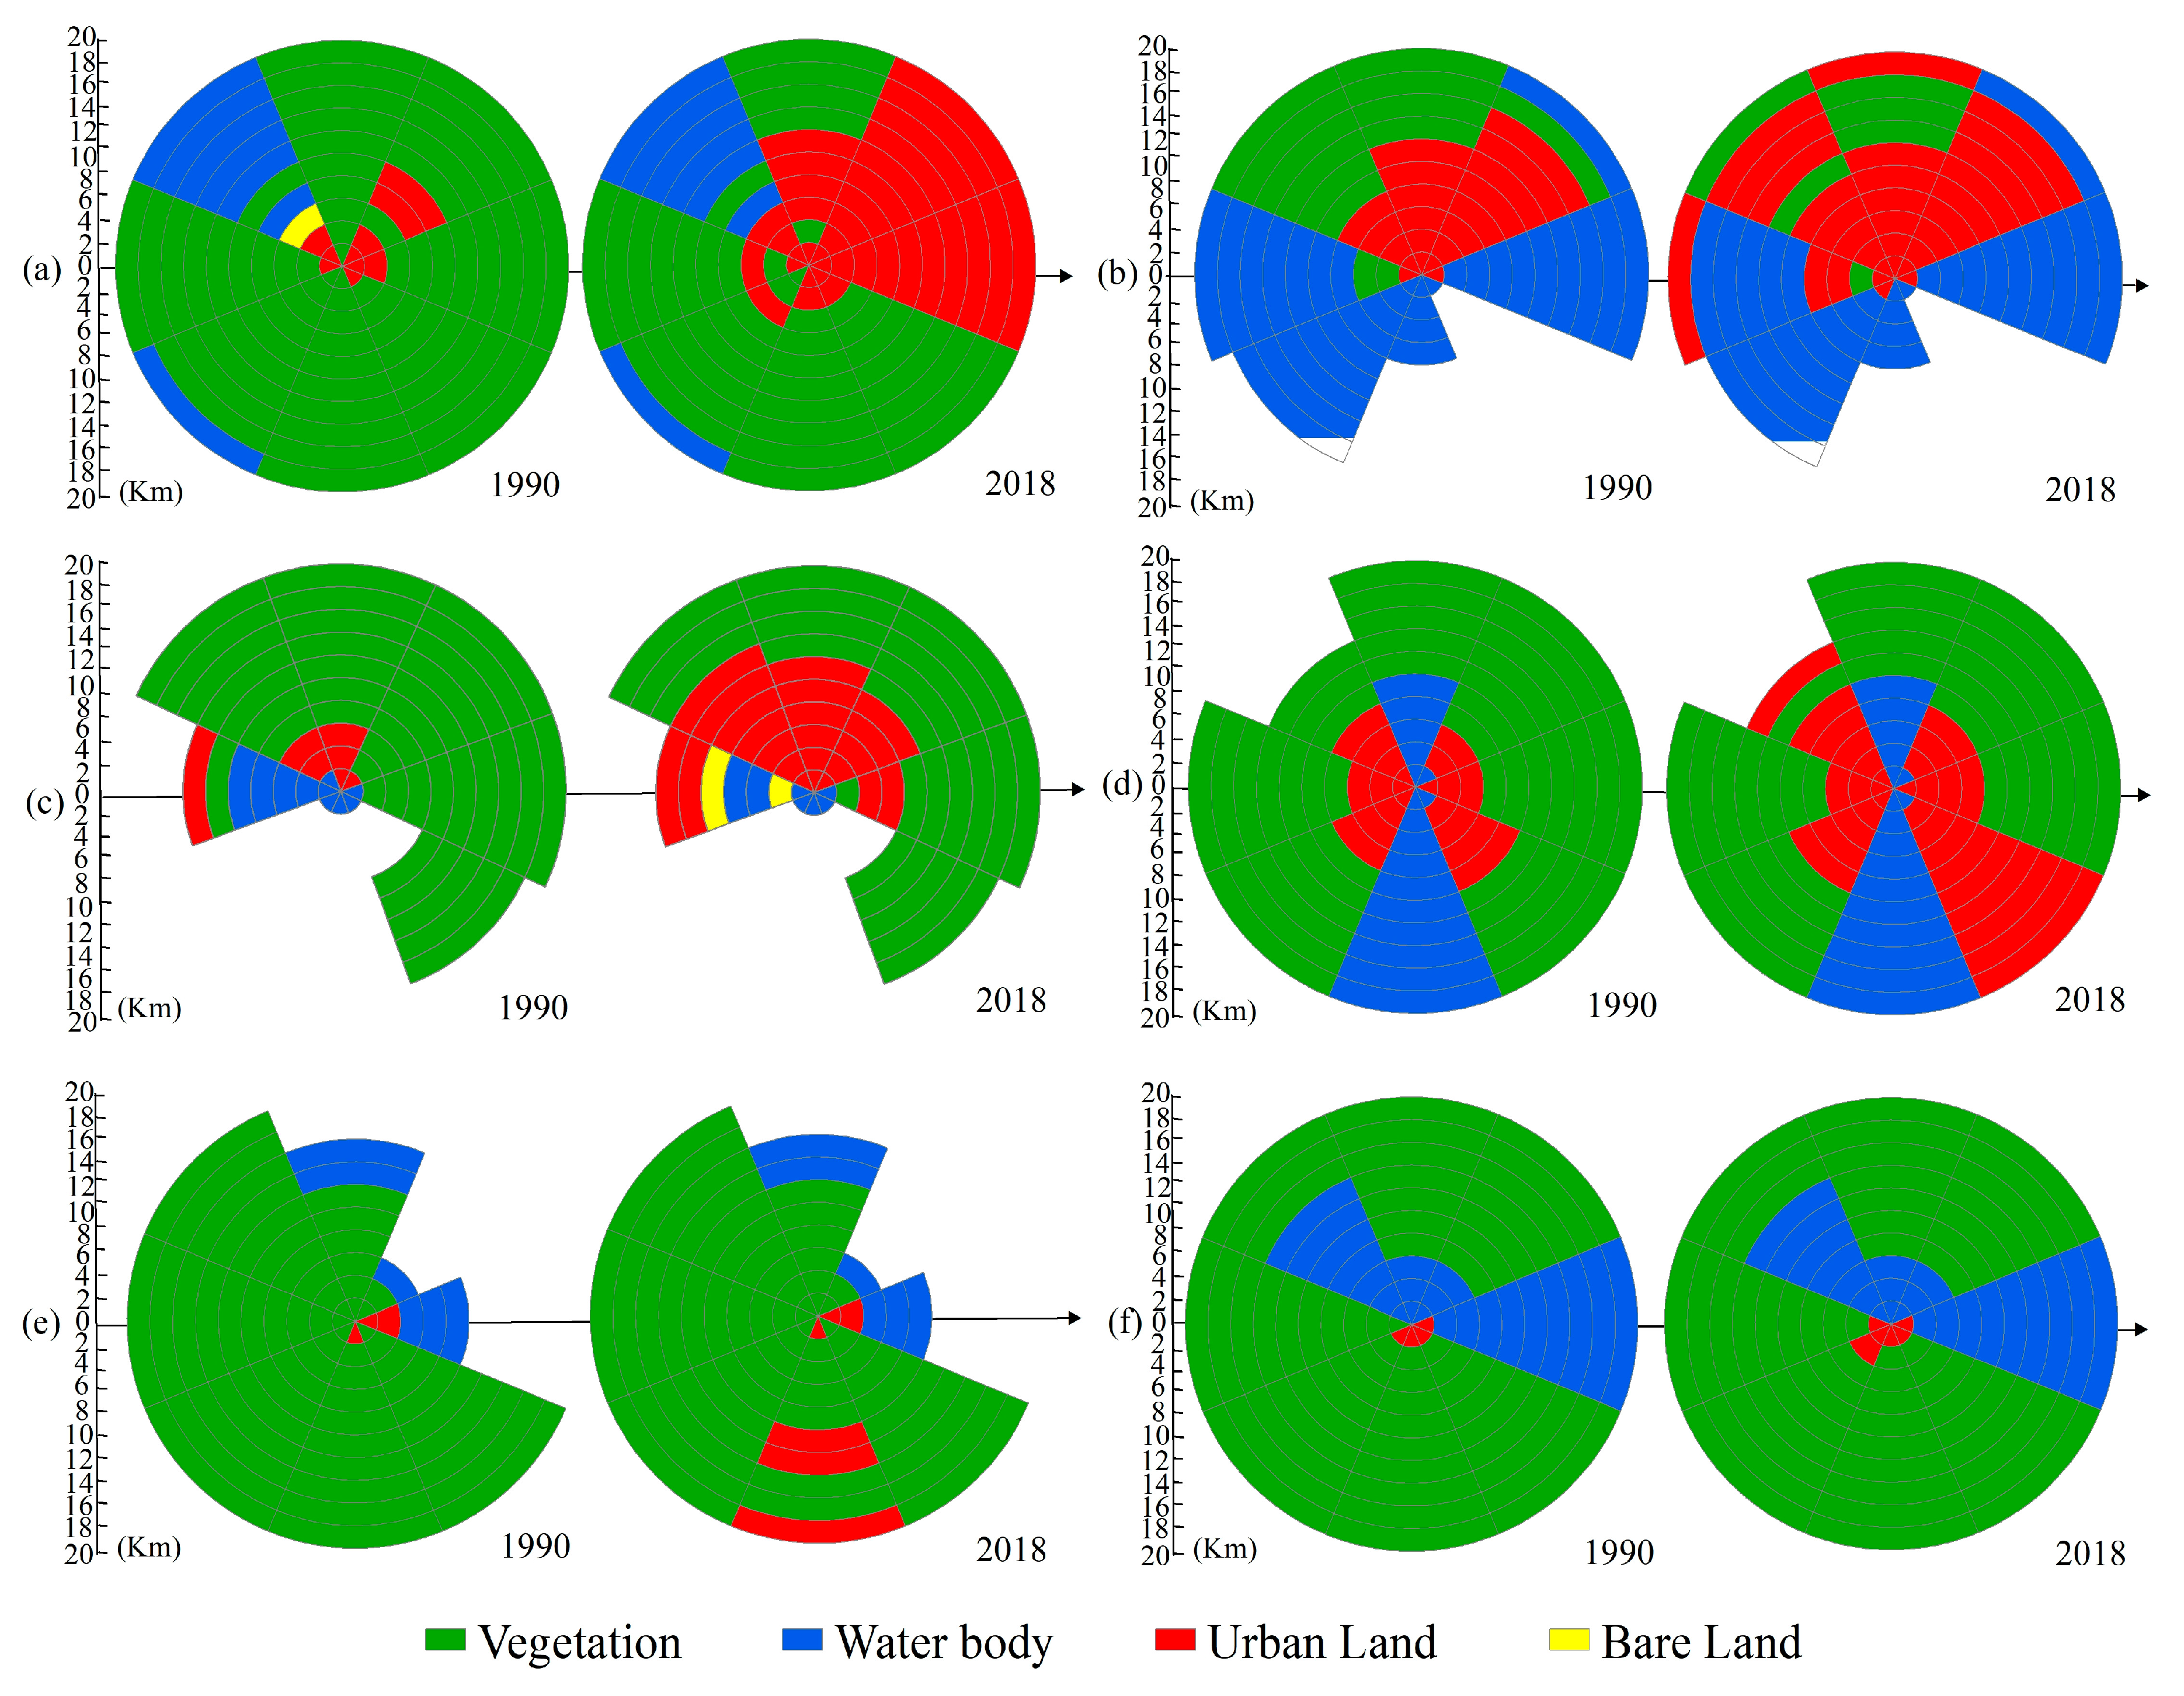
3.4. Spatial-Temporal Characteristics of the Urban Land Area Expansion around the Ports

The areas with a high degree of urban land development on both banks of the Strait of Malacca were concentrated mostly around the ports. The cargo handling capacity, industrial structure, and development trend of the ports all exerted an influence on the development of the surrounding urban land. Therefore, in this study, we used a gradient direction analysis to explore the spatial-temporal characteristics of the expansion of the major ports on both banks of the strait (Figure 7).
In 1990, the urban boundary of Port Kelang was within 10 km of the port’s center, and most of the urban land areas were distributed to the northeast. By 2018, the main land use type within 20 km northeast and east of the port was urban land area. Over the past 30 years, the urban land area has been transformed from vegetation. With the acceleration of urban expansion, the green space continuously decreased. Overall, the urban land expansion in Port Kelang was concentrated mainly to the east, northeast, and north. It developed along the highways toward Kuala Lumpur, whereas land use changes in other directions were relatively small.
Since 1990, the proportion of urban land areas in the Port of Singapore has been relatively high and has been concentrated mainly in the central area to the northeast of the port. By 2018, many of the green areas in the northern area had been transformed into urban land areas. With the acceleration of sea reclamation on Jurong Island and in Pasir Panjang, the dominant land use type in the zones 4–8 and 18–20 km from the port’s center on the western side also changed from water body to urban land areas. In contrast to the conventional continuous expansion mode, the expansion of the Port of Singapore has followed a leapfrog pattern, and a large area of green space was preserved within the city, indicating that ecological and environmental protection were taken into account during the development of Singapore.
Malacca Port was dominated by urban land areas within 6 km to the north and northwest of the port and 10–12 km to the west in 1990. However, by 2018, the boundary of the dense urban area to the northwest had expanded to 18 km, accounting for 28.24% of the total urban land area, and the expansion to the west was greater than that to the east.
The urban land areas around Penang Port were concentrated mainly around the George Town port of Penang Island and the Beihai port on the mainland, and they extended as far as 8 km from the port’s center. Over the past 30 years, the urban land areas have expanded inland along the port. Penang has expanded in a fan shape toward the west, and the mainland area has expanded mainly to the southeast. The expansion area on the mainland was larger than in Penang.
In 1990, only 0.84% of the area in Belawan Port was urban land. From 1990 to 2018, there was no obvious expansion around the port, whereas the urban land area located more than 10 km south of the port increased, which was mainly due to the development of Medan. This also reduced the green space.
During the early stage, the urban land areas of Dumai Port were only located within 2 km of the port and were distributed in a fan shape opening toward the southeast. Since the green land to the southwest has gradually been developed, the urban boundary expanded to 4 km, and the area of the urban land more than doubled. Generally speaking, however, the degree of urbanization was not high and the urban land area accounted for only 1% of the total area.
As evident from this analysis, over the past 30 years, Port Kelang, the Port of Singapore, Penang Port, and Malacca Port greatly stimulated the expansion of the surrounding urban land, among which the scope of influence of the first three ports had reached 20 km from their centers. However, the effect of Belawan Port and Dumai Port on the urban expansion in the hinterlands was small. In particular, the dominant area of urban land around Belawan Port did not significantly expand from 1990 to 2018. Compared with the western bank, the port hinterlands on the eastern bank were more extensive and exerted a profound impact on the urban spatial structure. The Port of Singapore relied mainly on marine reclamation to expand its urban areas, whereas other ports mainly occupied green spaces during their urbanization processes.

4. Discussion

4.1. Comparison of the Urban Land Area Change Research

Previous studies conducted on urban land area changes have paid more attention to the spatial-temporal variation characteristics of urban expansion, using landscape metrics [59,60,61], gradient direction analysis [13,14], urban expansion intensity [62,63], and metrics such as the per capita built land and green spaces [64,65]. Similar to the study of Cao et al. [13], in this study, we used gradient direction analysis to determine the trend of spatial-temporal variations in urban expansion. Cao et al. took the urban administrative center as the center point of the concentric circle of the analysis scope, whereas we took the port as the center point. In this study, we obtained the trend of the port land use change. In addition, we analyzed the radiation scope of the port urban land expansion and its impact on other land use types. The urban expansion intensity could help to visualize and better understand the development and utilization intensity of urban construction. Most of the studies conducted on this topic have used administrative areas as the statistical unit, which cannot delineate the spatial distribution characteristics and differences in the land development intensity well. Therefore, in this study, we used a 10 km × 10 km grid within the study area as the statistical unit to detect the urban expansion intensities in the different geographic areas. In addition to the analysis and monitoring of the past and present urban land use situations, to provide city managers with more auxiliary information for decision making, several studies have used cellular automaton to predict the future development trend of urban land areas [66,67], which is also the content that we will study in the next step.
Compared with other studies of the urban expansion of both banks of the Strait of Malacca or in similar coastal regions, in this study, we comprehensively determined the changes and regional differences in the urban land areas from the surface level (coastal zone) to the point level (major ports) over a long timeframe. The difference in development between the two banks was enormous, and the rate and the area of urban development were obviously greater on the eastern bank than on the western bank, which is consistent with the research conclusions of Yan et al. [30]. The development intensities of the different coastal sections on the same bank were also different. The higher development areas on the eastern bank were concentrated mainly along the coastal sections of Kuala Lumpur, Singapore, Malacca, Ipoh, and Penang, whereas the other coastal sections had low development intensities. On the western bank, only the Medan coastal section had a higher development intensity. The study of Zhang et al. reported that this difference in the development intensity of the coastal sections was significantly influenced by the geomorphologic backgrounds, and plain coastal areas and tableland coastal areas were usually convenient for urban development and construction [68]. Although there have been several studies on the expansion of the port cities on both banks of the Strait of Malacca [31,36,37,69], a comparison of port development has not been conducted. This study revealed the spatial-temporal expansion patterns of and differences between the major ports in the strait and deepened our understanding of the development of the ports in this region.

4.2. Factors Influencing the Urban Land Development Intensity

The intensity of urban land development is affected by many factors, including topography, resource conditions, and policies. The coastal zone on the eastern bank of the Strait of Malacca is mostly estuary alluvial plains with a small amount of tableland. This coastal area is rich in tin, sand, and minerals, with developed agriculture and industry. There are many evenly distributed coastal cities in this region. The large wetlands along the northern coast promote the development of farming, making Sungai Petani the rice production center of the Kedah Plain. There are a large number of tin mines in the foothills of the Titiwangsa Mountains in the central area. Tin mining has promoted the expansion of cities, such as Taiping and Seremban. In the southern portion of the eastern bank, the shipping trade has developed, which has attracted significant foreign investment. Abdullah et al. reported that since the 1980s, the Malaysian economy has focused increasingly on the manufacturing industry, which has promoted the development of urbanization, ports, infrastructure, and businesses [70].
The northeastern coast of Sumatra island is located on the western bank of the Strait of Malacca, where there are widespread jungle swamps, serious siltation of estuaries, a lack of natural high-quality ports, less arable land, and a low degree of coastal development. Only the areas around Belawan Port and Dumai Port have high development intensities. The northern part of the western bank is mainly mountainous, with scattered small coastal plains, poor infrastructure, and a slow expansion of construction land. The central and southern parts of the western bank are mainly plains, which are suitable for the development of agriculture, and population growth has driven the development of urban construction [69].
In addition, in terms of the zonality laws of urban land expansion, the analysis presented in Section 3.3 revealed that the intensity of the regional development was negatively correlated with the distance from the coastline, and thus, the development rate of the near-shore zone was significantly faster than that of the inland zone. According to Rong et al., this may be due to the abundance of land, ports, and mineral resources in the coastal areas [71], which provide unique geographic conditions and convenient transportation. Under normal circumstances, coastal areas are the base of the flow of economic, ecological, and social materials, and the core competitiveness of the economy is highly concentrated in this area. In contrast, the inland zone is characterized by mountains, inconvenient transportation, a lack of resources, and poor infrastructure. Thus, urban land expansion has been relatively slow in these areas [40].

4.3. Comparative Analysis of the Expansion of the Urban Land Areas around the Ports

A comparison of the land use patterns of the major ports on both banks revealed that in 1990, with the exceptions of the Port of Singapore and Penang Port, the degree of development of the other ports was relatively low. Subsequently, increased port freight volumes promoted the development of tourism, commerce, and the manufacturing industry in the harbor area, creating more employment opportunities and accelerating the urban expansion process [30]. By 2018, from the largest to smallest in terms of the scale of expansion the ports were Port Kelang, the Port of Singapore, Malacca Port, Penang Port, Belawan Port, and Dumai Port. In terms of their urban expansion trends, Port Kelang still has great expansion potential and space. Similarly, Malacca Port also contains significant development space. In particular, the construction of Huangjing Port will drive the rapid development of this region. In contrast to the first two ports, the urban land around the Port of Singapore is nearly saturated. Huang et al. pointed out that space is limited in this city and more attention should be focused on improving the efficiency of the land use in this port [72]. Unlike the Port of Singapore, although the development is limited by the island’s area, Penang Port still has a great deal of mainland expansion space [31]. The development degrees of Belawan Port and Dumai Port were relatively low, and the development has been concentrated only within 4 km of each port, resulting in a great deal of potential expansion space. In terms of the expansion mode, although the Port of Singapore and Dumai Port exhibited leapfrog patterns, the other ports exhibited edge-expansion patterns, forming a contiguous high-density urban area.
Driven by port development, urbanization construction areas have rapidly grown [30]. Port Kelang is located about 40 km southwest of Kuala Lumpur, which is the capital of Malaysia, on the northeastern coast of the Strait of Malacca. It is the largest port in Malaysia and is the primary port responsible for the export of wood, palm oil, and rubber and the import of energy and raw materials. Over the past 30 years, to adapt to the rapid economic development of the country, Port Kelang has been expanded many times, and the construction of the free trade zone around the port has greatly promoted urban expansion in the region. Note, however, that the study by Morris et al. showed that the increase in urban land in this area affected the urban climate and aggravated the urban heat island effect [73]. Therefore, environmental protection should be considered in future development plans to achieve sustainable development. Penang Port is close to the northeastern entrance of the Strait of Malacca. It is not only the second largest port in Malaysia but also a famous entrepot or trade port. Its industry ranks first in the northern part of western Malaysia, and its developed industry has made Penang one of the largest industrial and commercial cities in the country. Therefore, the urban construction has expanded primarily along the George Town harbor area of Penang Island and the Beihai Port area of the mainland. To meet the development needs of international shipping and the infrastructure construction of the Belt and Road Initiative, China has constructed a deep-water terminal (i.e., Huangjing Port) based on Malacca Port, which has created new employment and investment opportunities in Malacca. Therefore, since 2010, the urban area has been in a stage of rapid expansion. The Port of Singapore is located on the southern coast of Singapore. It is the largest transit port in the Asia-Pacific region and is one of the largest container ports in the world. Singapore has a limited land area, so sea reclamation is one of the main types of urban expansion. According to the discussion in Section 3.1, from 1990 to 2018, the land area of Singapore increased by 95.30 km2, and the reclamation projects were distributed mainly in port areas, such as Tuas, Jurong Island, and Pasir Panjang.
The development intensity of the ports on the western bank of the Strait of Malacca is far lower than that on the eastern bank. Belawan is a harbor in Medan. Located on the northeastern coast of Sumatra, Belawan is the second largest exporter of palm oil, rubber, and coffee in Indonesia. As an emerging city developed from plantations, Medan has become the economic center of northern Sumatra. Therefore, by 2018, the radiation area of the urban land in Medan had expanded 10 km to the south of Belawan Port. Dumai Port is the largest oil exporter in Indonesia, and the Minas oil field, which is the largest oil storage area in Indonesia, is located at the south of Dumai Port. Unlike Belawan Port, however, no large cities are located around Dumai Port to promote its development, and its urban expansion rate has been the slowest among the six ports investigated in this study.
As evident from this analysis, the western bank of the strait has been dominated by an agricultural economy, whereas the eastern bank has been dominated by developed industries, manufacturing, and high-tech industries [70,74]. In addition, the western bank is characterized by a muddy coast and poor infrastructure, which has made it difficult to build high-quality ports. Therefore, the economic and industrial structure, natural resource conditions, policies, and other factors have all caused the development of the ports on the western bank to lag behind the development of those on the eastern bank. The gradient direction analysis revealed that the continuous expansion of port construction land has encroached on a large area of agricultural land and natural forest land, which will lead to increased greenhouse gas emissions and the deterioration of the ecological environment. In the future, the urban land construction of ports should consider actual conditions to control the direction and strength of the development, thereby reducing the negative effects of the urbanization process and achieving sustainable development.

5. Conclusions

In this study, we developed an object-oriented retro-updating method. This method quickly and effectively obtained multi-phase urban land use data for a large area to support the analysis of the spatial-temporal changes in regional urban land use. Over the past 30 years, urban land areas on both banks of the Strait of Malacca have expanded significantly. There are obvious differences in the rates, scales, and modes of expansion on the two banks. The speed of the urban development was faster on the eastern bank than on the western bank. By 2018, the urban land area on the eastern bank was approximately four times greater than that on the western bank. The urban land areas on the eastern and western banks increased 1.51 and 1.76 times from 1990 to 2018, respectively, corresponding to rates of 74.69 km2/year and 22.28 km2/year. The development pattern of the eastern bank exhibited the spatial distribution of large aggregations and small strips, forming a cluster mode with large cities as the centers in George Town, Taiping, Kuala Lumpur, Malacca, Johor Bahru, and Singapore and forming long strips along the roads in the coastal area. The degree of development on the western bank was relatively low. As of 2018, 98.73% of the area still had a low development intensity, and the urban land areas were scarce and scattered. The western bank of the Strait of Malacca is dominated by an agricultural economy, whereas the eastern bank is dominated by developed industries, manufacturing, and high-tech industries. The developed economy on the eastern bank has accelerated the rate of urban expansion and widened the development gap between the two banks.
The coastal locations had an important influence on the construction of the urban land areas. The development rates of the eastern and western banks followed the same zonality law (i.e., decreasing with increasing distance from the coastline). In the inland area 60 km from the coastline, the average annual expansion rate was <1 km2/year. This is mainly due to the inconvenient transportation, a lack of resources, and poor infrastructure of the inland zone, which hindered urban development.
The development of the ports played an important role in promoting the construction of the surrounding coastal zone. Limited by the natural conditions, the western bank of the Strait of Malacca lacks natural high-quality ports, and the number and scales of the ports on the western bank are smaller than those on the eastern bank. Over the past 30 years, in descending order of their relative expansion scales, the major ports on both banks of the strait were Port Kelang, the Port of Singapore, Malacca Port, Penang Port, Belawan Port, and Dumai Port. The urban areas of Port Kelang, the Port of Singapore, and Penang Port expanded by up to 20 km from their centers. The gradient direction analysis showed that except for the Port of Singapore and Dumai Port, which exhibited leapfrog expansion patterns, the other ports exhibited edge-expansion patterns. Singapore has mainly relied on sea reclamation to expand its coastal areas, but the other ports still have large hinterlands for development.
For the western bank, infrastructure construction and economic development are needed to promote orderly and healthy urban development. The trend in the urban expansion on the eastern bank is obvious, but in the current development process, the vegetation areas have constantly been transformed into urban land areas. As a result, the amount of green space has decreased year by year, which threatens the biodiversity. In addition, problems such as environmental pollution, water shortages, and ecological deterioration often occur during the current urban expansion process. Therefore, it is imperative that future development plans consider the rationality of land use, the optimization of the spatial pattern of urban development in the coastal zone, and the mitigation of marine ecological problems and achieve sustainable development.

Author Contributions

Conceptualization, F.Y. and X.Y.; methodology, F.Y.; software, F.Y. and Z.W.; validation, F.Y., Z.W. and X.Y.; formal analysis, Y.L.; investigation, F.Y., Y.L. and B.L.; resources, B.L.; data curation, F.Y. and Y.L.; writing—original draft preparation, F.Y.; writing—review and editing, F.Y. and X.Y.; visualization, Y.L.; supervision, F.Y., Z.W. and X.Y. All authors have read and agreed to the published version of the manuscript.

Funding

This research was funded by the Chinese Academy of Sciences Earth Big Data Science Project of China, Grant No. XDA19060303; the National Science Foundation of China, Grant Nos. 41671436 and 41421001; and the Innovation Project of the Laboratory of Resources and Environmental Information System, Grant No. O88RAA01YA.

Acknowledgments

The authors sincerely thank the anonymous reviewers and the editor for their useful comments and suggestions for this paper.

Conflicts of Interest

The authors declare no conflict of interest.

References

  1. Thia-Eng, C.; Gorre, I.R.L.; Ross, S.A.; Bernad, S.R.; Gervacio, B.; Ebarvia, M.C. The Malacca Straits. Mar. Pollut. Bull. 2000, 41, 160–178. [Google Scholar] [CrossRef]
  2. Donald, B.F. The Straits of Malacca: Gateway or Gauntlet? McGill-Queen’s University Press: Montreal, QC, Canada, 2003. [Google Scholar]
  3. Abdullah, A.R.; Tahir, N.M.; Loong, T.S. The GEF/UNDP/IMO Malacca Straits Demonstration Project: Sources of Pollution. Mar. Pollut. Bull. 1999, 39, 229–233. [Google Scholar] [CrossRef]
  4. Ba, A.D. Governing the Safety and Security of the Malacca Strait: The Nippon Foundation between States and Industry. J. Contemp. Asia 2018, 48, 252–277. [Google Scholar] [CrossRef]
  5. Looi, L.J.; Aris, A.Z.; Johari, W.L.W.; Yusoff, F.M.; Hashim, Z. Baseline metals pollution profile of tropical estuaries and coastal waters of the Straits of Malacca. Mar. Pollut. Bull. 2013, 74, 471–476. [Google Scholar] [CrossRef] [PubMed]
  6. Sun, Z.; Xu, R.; Du, W.; Wang, L.; Lu, D. High-Resolution Urban Land Mapping in China from Sentinel 1A/2 Imagery Based on Google Earth Engine. Remote Sens. 2019, 11, 752. [Google Scholar] [CrossRef] [Green Version]
  7. Liu, X.; Hu, G.; Chen, Y.; Li, X.; Xu, X.; Li, S.; Pei, F.; Wang, S. High-resolution multi-temporal mapping of global urban land using Landsat images based on the Google Earth Engine Platform. Remote Sens. Environ. 2018, 209, 227–239. [Google Scholar] [CrossRef]
  8. Esch, T.; Marconcini, M.; Felbier, A.; Roth, A.; Heldens, W.; Huber, M.; Schwinger, M.; Taubenboeck, H.; Mueller, A.; Dech, S. Urban Footprint Processor-Fully Automated Processing Chain Generating Settlement Masks From Global Data of the TanDEM-X Mission. IEEE Geosci. Remote Sens. Lett. 2013, 10, 1617–1621. [Google Scholar] [CrossRef] [Green Version]
  9. Ji, H.; Li, X.; Wei, X.; Liu, W.; Zhang, L.; Wang, L. Mapping 10-m Resolution Rural Settlements Using Multi-Source Remote Sensing Datasets with the Google Earth Engine Platform. Remote Sens. 2020, 12, 2832. [Google Scholar] [CrossRef]
  10. Lin, Y.; Zhang, H.; Lin, H.; Gamba, P.E.; Liu, X. Incorporating synthetic aperture radar and optical images to investigate the annual dynamics of anthropogenic impervious surface at large scale. Remote Sens. Environ. 2020, 242, 111757. [Google Scholar] [CrossRef]
  11. Zhang, X.; Liu, L.; Wu, C.; Chen, X.; Gao, Y.; Xie, S.; Zhang, B. Development of a global 30m impervious surface map using multisource and multitemporal remote sensing datasets with the Google Earth Engine platform. Earth Syst. Sci. Data 2020, 12, 1625–1648. [Google Scholar] [CrossRef]
  12. Zhang, Y.; Qin, K.; Bi, Q.; Cui, W.; Li, G. Landscape Patterns and Building Functions for Urban Land-Use Classification from Remote Sensing Images at the Block Level: A Case Study of Wuchang District, Wuhan, China. Remote Sens. 2020, 12, 1831. [Google Scholar] [CrossRef]
  13. Cao, H.; Liu, J.; Chen, J.; Gao, J.; Wang, G.; Zhang, W. Spatiotemporal Patterns of Urban Land Use Change in Typical Cities in the Greater Mekong Subregion (GMS). Remote Sens. 2019, 11, 801. [Google Scholar] [CrossRef] [Green Version]
  14. Cao, H.; Liu, J.; Fu, C.; Zhang, W.; Wang, G.; Yang, G.; Luo, L. Urban Expansion and Its Impact on the Land Use Pattern in Xishuangbanna since the Reform and Opening up of China. Remote Sens. 2017, 9, 137. [Google Scholar] [CrossRef] [Green Version]
  15. Chen, J.; Gao, J.; Chen, W. Urban land expansion and the transitional mechanisms in Nanjing, China. Habitat Int. 2016, 53, 274–283. [Google Scholar] [CrossRef]
  16. Li, X.; Gong, P.; Liang, L. A 30-year (1984–2013) record of annual urban dynamics of Beijing City derived from Landsat data. Remote Sens. Environ. 2015, 166, 78–90. [Google Scholar] [CrossRef]
  17. Li, X.; Zhou, Y.; Zhu, Z.; Liang, L.; Yu, B.; Cao, W. Mapping annual urban dynamics (1985–2015) using time series of Landsat data. Remote Sens. Environ. 2018, 216, 674–683. [Google Scholar] [CrossRef]
  18. Liu, J.; Kuang, W.; Zhang, Z.; Xu, X.; Qin, Y.; Ning, J.; Zhou, W.; Zhang, S.; Li, R.; Yan, C.; et al. Spatiotemporal characteristics, patterns, and causes of land-use changes in China since the late 1980s. J. Geogr. Sci. 2014, 24, 195–210. [Google Scholar] [CrossRef]
  19. Zhang, L.; Weng, Q. Annual dynamics of impervious surface in the Pearl River Delta, China, from 1988 to 2013, using time series Landsat imagery. ISPRS-J. Photogramm. Remote Sens. 2016, 113, 86–96. [Google Scholar] [CrossRef]
  20. Cao, X.; Gao, X.; Shen, Z.; Li, R. Expansion of Urban Impervious Surfaces in Xining City Based on GEE and Landsat Time Series Data. IEEE Access 2020, 8, 147097–147111. [Google Scholar] [CrossRef]
  21. Omurakunova, G.; Bao, A.; Xu, W.; Duulatov, E.; Jiang, L.; Cai, P.; Abdullaev, F.; Nzabarinda, V.; Durdiev, K.; Baiseitova, M. Expansion of Impervious Surfaces and Their Driving Forces in Highly Urbanized Cities in Kyrgyzstan. Int. J. Environ. Res. Public Health 2020, 17, 362. [Google Scholar] [CrossRef] [Green Version]
  22. Gong, P.; Li, X.; Zhang, W. 40-Year (1978–2017) human settlement changes in China reflected by impervious surfaces from satellite remote sensing. Sci. Bull. 2019, 64, 756–763. [Google Scholar] [CrossRef] [Green Version]
  23. Wang, L.; Li, C.; Ying, Q.; Cheng, X.; Wang, X.; Li, X.; Hu, L.; Liang, L.; Yu, L.; Huang, H.; et al. China’s urban expansion from 1990 to 2010 determined with satellite remote sensing. Chin. Sci. Bull. 2012, 57, 2802–2812. [Google Scholar] [CrossRef] [Green Version]
  24. Griffiths, P.; Hostert, P.; Gruebner, O.; van der Linden, S. Mapping megacity growth with multi-sensor data. Remote Sens. Environ. 2010, 114, 426–439. [Google Scholar] [CrossRef]
  25. Deng, C.; Zhu, Z. Continuous subpixel monitoring of urban impervious surface using Landsat time series. Remote Sens. Environ. 2020, 238, 110929. [Google Scholar] [CrossRef]
  26. Masek, J.G.; Lindsay, F.E.; Goward, S.N. Dynamics of urban growth in the Washington DC metropolitan area, 1973–1996, from Landsat observations. Int. J. Remote Sens. 2000, 21, 3473–3486. [Google Scholar] [CrossRef]
  27. Wang, J.; Zhao, Y.; Li, C.; Yu, L.; Liu, D.; Gong, P. Mapping global land cover in 2001 and 2010 with spatial–temporal consistency at 250 m resolution. ISPRS-J. Photogramm. Remote Sens. 2015, 103, 38–47. [Google Scholar] [CrossRef]
  28. Fu, Y.; Li, J.; Weng, Q.; Zheng, Q.; Li, L.; Dai, S.; Guo, B. Characterizing the spatial pattern of annual urban growth by using time series Landsat imagery. Sci. Total Environ. 2019, 666, 274–284. [Google Scholar] [CrossRef]
  29. Schneider, A.; Mertes, C.M. Expansion and growth in Chinese cities, 1978–2010. Environ. Res. Lett. 2014, 9, 024008. [Google Scholar] [CrossRef]
  30. Yan, J.; Su, F.; Wang, M. The development processes and regional differentiation of both banks of the Strait of Malacca during 1980–2010. Ocean Coast. Manag. 2017, 139, 141–152. [Google Scholar] [CrossRef]
  31. Tew, Y.L.; Tan, M.L.; Samat, N.; Yang, X. Urban Expansion Analysis using Landsat Images in Penang, Malaysia. Sains Malays. 2019, 48, 2307–2315. [Google Scholar] [CrossRef]
  32. Aburas, M.M.; Abdullah, S.H.; Ramli, M.F.; As’shari, Z.H. Landscape analysis of urban growth patterns in Seremban, Malaysia, using spatio-temporal data. In Proceedings of the 8th Igrsm International Conference and Exhibition on Geospatial & Remote Sensing, Lumpur, Malaysia, 13–14 April 2016; Volume 37. [Google Scholar]
  33. Boori, M.S.; Choudhary, K.; Kupriyanov, A.; Kovelskiy, V. Satellite data for Singapore, Manila and Kuala Lumpur city growth analysis. Data Brief 2016, 7, 1576–1583. [Google Scholar] [CrossRef] [PubMed] [Green Version]
  34. Noor, N.M.; Abdullah, A. Sustainable Urban Planning Mapping Using Remote Sensing and GIS in Malaysia. In Proceedings of the IEEE 2015 Joint Urban Remote Sensing Event, Lausanne, Switzerland, 30 March–1 April 2015. [Google Scholar]
  35. Tan, K.C.; Lim, H.S.; MatJafri, M.Z.; Abdullah, K. Landsat data to evaluate urban expansion and determine land use/land cover changes in Penang Island, Malaysia. Environ. Earth Sci. 2010, 60, 1509–1521. [Google Scholar] [CrossRef]
  36. Zhao, L.; Wong, W.B.; Bin Hanafi, Z. The evolution of George Town’s urban morphology in the Straits of Malacca, late 18th century-early 21st century. Front. Archit. Res. 2019, 8, 513–534. [Google Scholar] [CrossRef]
  37. Samat, N. Monitoring the expansion of built-up areas in Seberang Perai region, Penang State, Malaysia. In Proceedings of the 8th International Symposium of the Digital Earth, Kuching, Malaysia, 26–29 August 2013; Volume 18. [Google Scholar]
  38. Li, J.; Wang, H.; Wang, G.; Zhai, H.; Wang, G. Monitoring and Environmental Analysis of Important Cities in China-Indochina Peninsula Based on Remote Sensing Data. Remote Sens. Inf. 2018, 33, 71–78. [Google Scholar]
  39. Yao, D.M.; Chen, Y.F.; Zhang, F.G. Research of the land developing intensity evaluation of Hainan Province. Hebei Agric. Sci. 2008, 12, 86–90. [Google Scholar]
  40. Zhang, J.; Su, F.; Zuo, X.; Fang, Y.; Yang, J. Research on the spatial differentiation of coastal land development surrounding South China Sea. Acta Geogr. Sin. 2015, 70, 319–332. [Google Scholar]
  41. Gong, Y.C. The background and on evolution of the issue of user cooperation the straits of Malacca. Foreign Aff. Rev. 2006, 87, 88–95. [Google Scholar]
  42. Wang, B.; Ono, A.; Muramatsu, K.; Fujiwara, N. Automated detection and removal of clouds and their shadows from Landsat TM images. IEICE Trans. Inf. Syst. 1999, 82, 453–460. [Google Scholar]
  43. Watmough, G.R.; Atkinson, P.M.; Hutton, C.W. A combined spectral and object-based approach to transparent cloud removal in an operational setting for Landsat ETM+. Int. J. Appl. Earth Obs. Geoinf. 2011, 13, 220–227. [Google Scholar] [CrossRef]
  44. Zhu, Z.; Woodcock, C.E. Object-based cloud and cloud shadow detection in Landsat imagery. Remote Sens. Environ. 2012, 118, 83–94. [Google Scholar] [CrossRef]
  45. Yang, F.; Yang, X.; Wang, Z.; Lu, C.; Li, Z.; Liu, Y. Object-based classification of cloudy coastal areas using medium-resolution optical and SAR images for vulnerability assessment of marine disaster. J. Oceanol. Limnol. 2019, 37, 1955–1970. [Google Scholar] [CrossRef]
  46. Hu, D.; Chen, S.; Qiao, K.; Cao, S. Integrating CART algorithm and multi-source remote sensing data to estimate sub-pixel impervious surface coverage: A case study from Beijing Municipality, China. Chin. Geogr. Sci. 2017, 27, 614–625. [Google Scholar] [CrossRef]
  47. Liu, X.; Hu, G.; Ai, B.; Li, X.; Shi, Q. A Normalized Urban Areas Composite Index (NUACI) Based on Combination of DMSP-OLS and MODIS for Mapping Impervious Surface Area. Remote Sens. 2015, 7, 17168–17189. [Google Scholar] [CrossRef] [Green Version]
  48. Shao, Z.; Liu, C. The Integrated Use of DMSP-OLS Nighttime Light and MODIS Data for Monitoring Large-Scale Impervious Surface Dynamics: A Case Study in the Yangtze River Delta. Remote Sens. 2014, 6, 9359–9378. [Google Scholar] [CrossRef] [Green Version]
  49. Zhang, Y.; Zhang, H.; Lin, H. Improving the impervious surface estimation with combined use of optical and SAR remote sensing images. Remote Sens. Environ. 2014, 141, 155–167. [Google Scholar] [CrossRef]
  50. Foga, S.; Scaramuzza, P.L.; Guo, S.; Zhu, Z.; Dilley, R.D., Jr.; Beckmann, T.; Schmidt, G.L.; Dwyer, J.L.; Hughes, M.J.; Laue, B. Cloud detection algorithm comparison and validation for operational Landsat data products. Remote Sens. Environ. 2017, 194, 379–390. [Google Scholar] [CrossRef] [Green Version]
  51. Shimada, M.; Isoguchi, O.; Tadono, T.; Isono, K. PALSAR radiometric and geometric calibration. IEEE Trans. Geosci. Remote Sens. 2009, 47, 3915–3932. [Google Scholar] [CrossRef]
  52. Yang, F.; Wang, Z.; Yang, X.; Liu, Y.; Liu, B.; Wang, J.; Kang, J. Using Multi-Sensor Satellite Images and Auxiliary Data in Updating and Assessing the Accuracies of Urban Land Products in Different Landscape Patterns. Remote Sens. 2019, 11, 2664. [Google Scholar] [CrossRef] [Green Version]
  53. Huete, A.R.; Liu, H.Q.; Batchily, K.; van Leeuwen, W. A comparison of vegetation indices global set of TM images for EOS-MODIS. Remote Sens. Environ. 1997, 59, 440–451. [Google Scholar] [CrossRef]
  54. Xu, H. Modification of normalised difference water index (NDWI) to enhance open water features in remotely sensed imagery. Int. J. Remote Sens. 2006, 27, 3025–3033. [Google Scholar] [CrossRef]
  55. Zha, Y.; Gao, J.; Ni, S. Use of normalized difference built-up index in automatically mapping urban areas from TM imagery. Int. J. Remote Sens. 2003, 24, 583–594. [Google Scholar] [CrossRef]
  56. Breiman, L. Bagging predictors. Mach. Learn. 1996, 24, 123–140. [Google Scholar] [CrossRef] [Green Version]
  57. Dietterich, T.G. An experimental comparison of three methods for constructing ensembles of decision trees: Bagging, boosting, and randomization. Mach. Learn. 2000, 40, 139–157. [Google Scholar] [CrossRef]
  58. Rodriguez-Galiano, V.F.; Ghimire, B.; Rogan, J.; Chica-Olmo, M.; Rigol-Sanchez, J.P. An assessment of the effectiveness of a random forest classifier for land-cover classification. ISPRS J. Photogramm. Remote Sens. 2012, 67, 93–104. [Google Scholar] [CrossRef]
  59. Ji, W.; Ma, J.; Twibell, R.W.; Underhill, K. Characterizing urban sprawl using multi-stage remote sensing images and landscape metrics. Comput. Environ. Urban Syst. 2006, 30, 861–879. [Google Scholar] [CrossRef]
  60. Sun, Y.; Zhao, S.Q.; Qu, W.Y. Quantifying spatiotemporal patterns of urban expansion in three capital cities in Northeast China over the past three decades using satellite data sets. Environ. Earth Sci. 2015, 73, 7221–7235. [Google Scholar] [CrossRef]
  61. Liu, H.; Weng, Q. Landscape metrics for analysing urbanization-induced land use and land cover changes. Geocarto Int. 2013, 28, 582–593. [Google Scholar] [CrossRef]
  62. Liu, F.; Zhang, Z.; Wang, X. Forms of Urban Expansion of Chinese Municipalities and Provincial Capitals, 1970s–2013. Remote Sens. 2016, 8, 930. [Google Scholar] [CrossRef] [Green Version]
  63. Liu, F.; Zhang, Z.; Shi, L.; Zhao, X.; Xu, J.; Yi, L.; Liu, B.; Wen, Q.; Hu, S.; Wang, X.; et al. Urban expansion in China and its spatial-temporal differences over the past four decades. J. Geogr. Sci. 2016, 26, 1477–1496. [Google Scholar] [CrossRef]
  64. Zhou, W.; Jiao, M.; Yu, W.; Wang, J. Urban sprawl in a megaregion: A multiple spatial and temporal perspective. Ecol. Indic. 2019, 96, 54–66. [Google Scholar] [CrossRef]
  65. Sun, C.; Lin, T.; Zhao, Q.; Li, X.; Ye, H.; Zhang, G.; Liu, X.; Zhao, Y. Spatial pattern of urban green spaces in a long-term compact urbanization process—A case study in China. Ecol. Indic. 2019, 96, 111–119. [Google Scholar] [CrossRef]
  66. Batty, M. Molding and simulation in geographic information science: Integrated models and grand challenges. Procedia Soc. Behav. Sci. 2011, 21, 1959–1977. [Google Scholar] [CrossRef] [Green Version]
  67. Li, X.; Yeh, A.G.O. Constrained cellular automata for modelling sustainable urban forms. Acta Geogr. Sin. 1999, 54, 159–166. [Google Scholar]
  68. Zhang, J.; Su, F.; Zhou, C.; Zuo, X.; Ding, Z.; Li, H. Construction land expansion in coastal zone around the South China Sea based on different geomorphologic backgrounds in the past 35 years. Acta Geogr. Sin. 2016, 71, 104–117. [Google Scholar]
  69. Hua, A.K.; Ping, O.W. The influence of land-use/land-cover changes on land surface temperature: A case study of Kuala Lumpur metropolitan city. Eur. J. Remote Sens. 2018, 51, 1049–1069. [Google Scholar] [CrossRef] [Green Version]
  70. Abdullah, S.A.; Nakagoshi, N. Changes in landscape spatial pattern in the highly developing state of Selangor, peninsular Malaysia. Landsc. Urban. Plan. 2006, 77, 263–275. [Google Scholar] [CrossRef]
  71. Rong, J.; Han, Q. Division of coastal zone regional level and analysis of core competitiveness of region. Acad. Res. 2003, 7, 79–82. [Google Scholar]
  72. Huang, S.; Guo, Q.; Tang, L. Compact development of space-limited city: A case study of Xiamen Island. Acta Ecol. Sin. 2014, 34, 3158–3168. [Google Scholar]
  73. Morris, K.I.; Chan, A.; Morris, K.J.K.; Ooi, M.C.G.; Oozeer, M.Y.; Abakr, Y.A.; Nadzir, M.S.M.; Mohammed, I.Y. Urbanisation and urban climate of a tropical conurbation, Klang Valley, Malaysia. Urban Clim. 2017, 19, 54–71. [Google Scholar] [CrossRef]
  74. Abdullah, S.A.; Nakagoshi, N. Forest fragmentation and its correlation to human land use change in the state of Selangor, peninsular Malaysia. For. Ecol. Manag. 2007, 241, 39–48. [Google Scholar] [CrossRef]
Figure 1. Sketch map of the study area.
Sustainability 12 09714 g001
Figure 2. Flow chart of the object-oriented retro-updating method (taking Singapore as an example).
Sustainability 12 09714 g002
Figure 3. Urban land areas within 100 km of the two banks of the Strait of Malacca. (a) Urban land areas for 1990; (b)Urban land areas for 2018.
Sustainability 12 09714 g003
Figure 4. Development intensity of the urban construction land on both banks of the Strait of Malacca. (a) Urban land development intensity for 1990; (b) Urban land development intensity for 2018.
Sustainability 12 09714 g004
Figure 5. Areas of urban land at various distances from the coast.
Sustainability 12 09714 g005
Figure 6. Annual rates of urban land expansion at various distances from the coast.
Sustainability 12 09714 g006
Figure 7. Gradient direction maps of each port in 1990 and 2018: (a) Port Kelang; (b) Port of Singapore; (c) Malacca Port; (d) Penang Port; (e) Belawan Port; and (f) Dumai Port.
Sustainability 12 09714 g007
Table 1. The rules of each transformation type.
Transformation TypeRules
VegetationdNDVI< 0 and NDBI1990 < 0 and MNDWI1990 < 0
Water bodydMNDWI < 0 and MNDWI1990 > 0 and rectangle fit < 1
Bare landdNDBI < 0 and NDBI1990 > 0 and NDVI1990 < 0.2
Urban landdNDBI < 0 and dNDVI > 0 and NDVI1990 < 0 and MNDWI1990 < 0
Note: The transformation type represents the land use type of the change area in 1990. The subscript_1990 indicates that the corresponding features were extracted from the image taken in 1990.
Publisher’s Note: MDPI stays neutral with regard to jurisdictional claims in published maps and institutional affiliations.

