Economic and Human Features for Energy and Environmental Indicators: A Tool to Assess Countries’ Progress towards Sustainability


Abstract
:1. Introduction
- To monitor the performance of a country in a certain timeinterval;
- To determine priorities and choices for policy-making in relation to available data.
1.1. Efforts for Going towards Sustainable Development—History in Brief
- Food production, related to economic, demographic, and environmental conditions;
- Industrialization, considering the related economic growth, which is affected by other factors, such as demographic growth;
- Non-renewable resources, represented by the availability of natural resources required to produce goods and services;
- Pollution, considering the outputs due to industrial, agricultural, and service production that could affect the ecosystem, including agricultural systems and human health;
- Population, considering the demographic effects of social, economic, and environmental aspects that affect human birth and death rates.
- The conservation of global ecosystems;
- The interrelations between actions on the local and global levels, highlighting the ramifications of those on the local level for the global one, as well as the awareness of human actions.
- The Rio Declaration of Principles, which contains a list of 27 principles with the aim of establishing a “new and equitable global partnership” [20], moving in the direction of international agreements, safeguarding the integrity of both environmental and developmental systems, and integrating legislative instruments to pursue environmental issues in each country.
- The United Nations Framework Convention on Climate Change (UNFCC) [21], which is an international treaty on environment, with the aim of fixing the amount of greenhouse gases concentrations in the atmosphere to the 1990 levels, preventing a human interference with natural climate system.
- The Convention on Biological Diversity (CBD) [22], an international treaty with three main aims: “the conservation of biological diversity, the sustainable use of its components and the fair and equitable sharing of the benefits arising out of the utilization of genetic resources”, highlighting the finite amount of natural resources and the need for all to preserve them.
- The Statement on Forest Principle [23], a document which contains principles to manage and preserve the forests reserves, using them in a sustainable way.
- Agenda 21 [24], which represents a global action plan (both analyses and recommendations [19]) with the aim to integrate issues related to environment and development, in order to improve living standards and to guarantee a better future for all the people with a particular attention to the ecosystem. All these issues are considered the challenges of XXI Century and is highlighted the central role of multiscalar cooperation from an international level to a local one [25]. Indeed, the need to bring the Agenda at a local level within each Nation has led to a program called Local Agenda 21 (LA21) in which local communities are recognized as the core for the implementation and control of the planning for actions towards sustainable development.
1.2. Indicators of Sustainable Development
1.3. This Study
- Environment;
- Society;
- Economy.
- An economic set, based on Gross Domestic Product, as usually done in all economic assessment in literature;
- A more human-centred set, which has been related to the UN’s Human Development Index, in order to take into account human well-being.
2. Materials and Methods
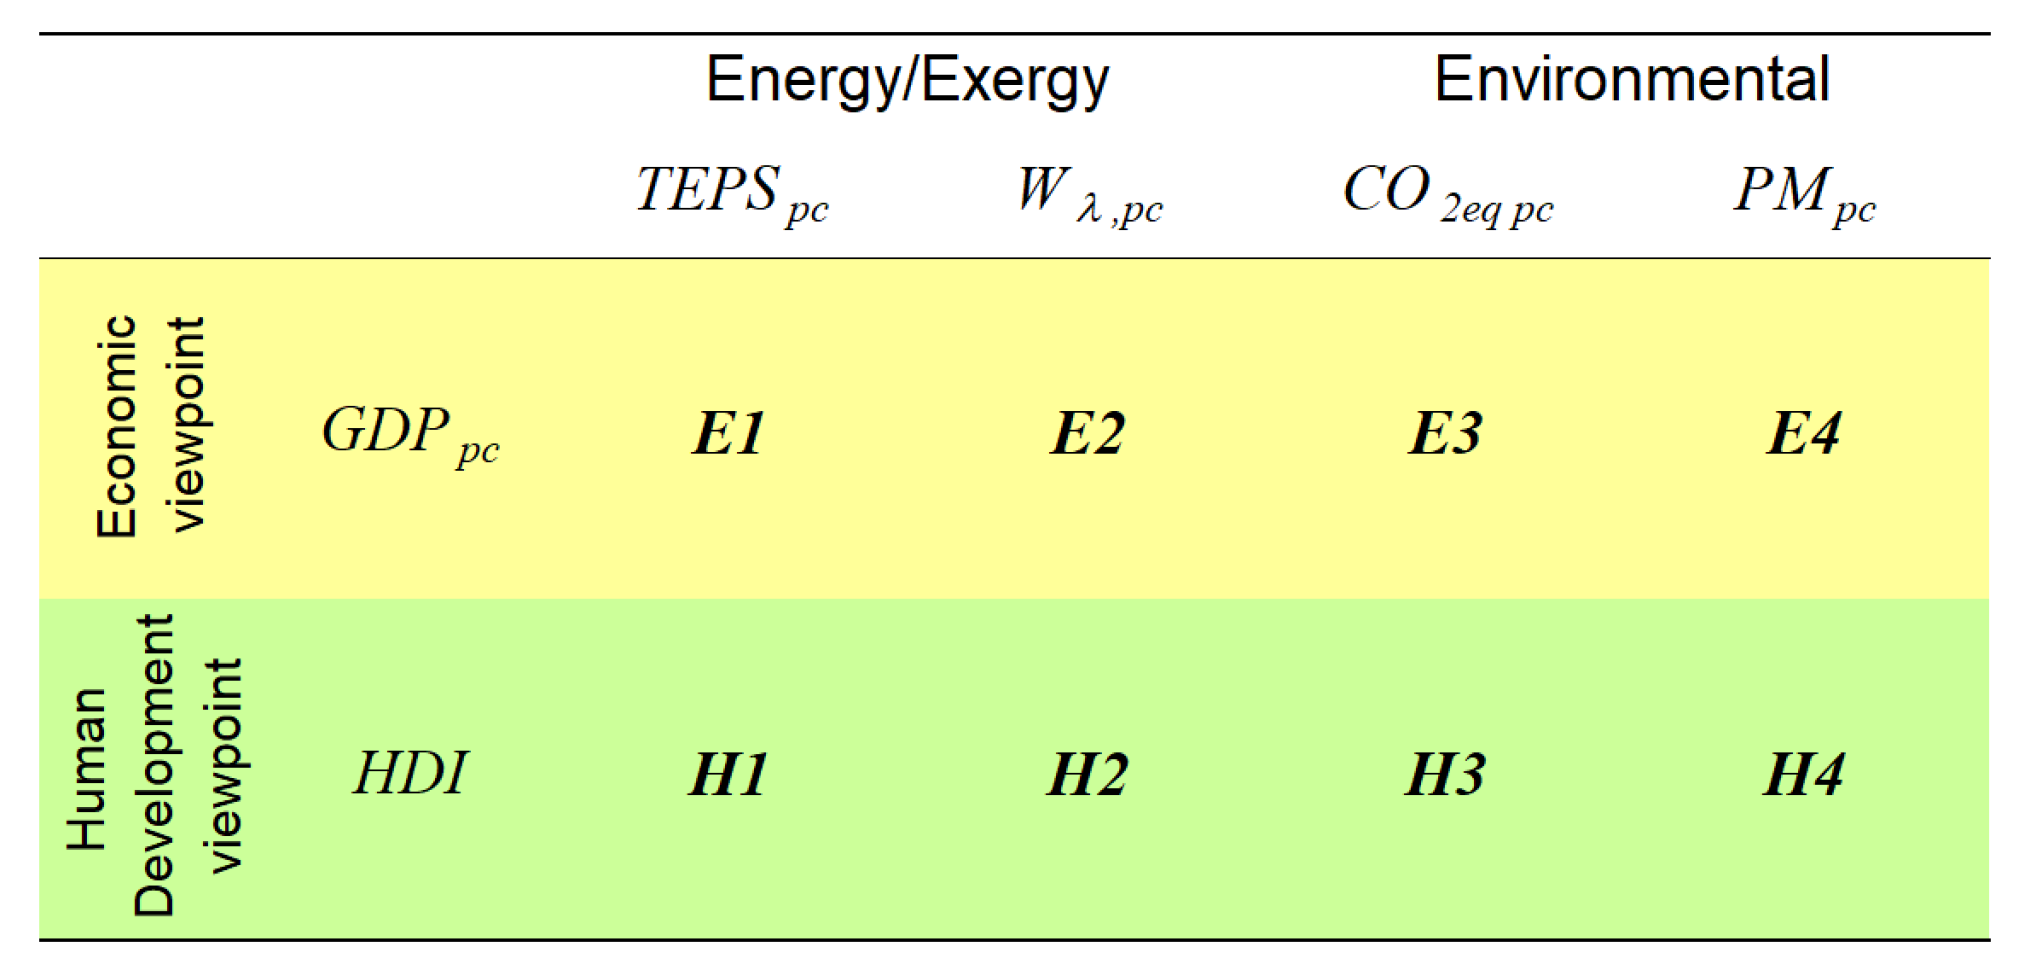
- Economic indicators, usually used for decision-making;
- Human indicators, introduced for the assessment of the human well-being.
- The Total Primary Energy Supply (), which is the total amount of energy available for a country;
- The Exergy Losses () in the energy chain;
- The amount of GreenHouse Gases (GHGs) emitted;
- The amount of particulate matter () emitted.
- The Gross Domestic Product (GDP) [$] [64]:where C is the consumption [$], are the investments [$], G are the government spendings [$], X are the imports [$] and M are the exports [$].
- The Human Development Index (HDI) [60]:where is the normalized Life Expectancy Index, which is the life expectancy at birth [yr], is the normalized Education Index which considers two different indicators equally weighted (by their mean arithmetic value): the mean years of schooling and the expected years of schooling [yr] and, is the normalized Gross National Income per capita at purchasing power parties [$ per capita]. The GNI per capita ‘is the sum of value added by all resident producers in the economy plus any product taxes (less subsidies), not included in the valuation of output plus net receipts of primary income (compensation of employees and property income) from abroad, divided by midyear population. Value added is the net output of an industry after adding up all outputs and subtracting intermediate inputs’ [58]. All the values of indicators that appear in Equation (2) are normalized ones by using their minimum and maximum values in the following way:where is the actual value of the indicator, is its minimum value and, is the maximum value of the indicator. In the case of the the natural logarithms are applied to the normalization formula (Equation (3)) in order to consider that higher incomes have a declining contribution to human development [60]. In Table 2, the values used for the normalization—since 2010—have been reported. The aim of the normalization is to obtain a non dimensional value in the range between 0 and 1.So, is the result of the geometric mean of these normalized indicators. Thus, the Human Development Index considers three fundamental dimensions of human development: a long and healthy life, access to education and a decent standard of life [65].
- The classical economic approach;
- A more social-related one.
- and allow us to evaluate the country energy consumption,
- and allow us to evaluate country technological level,
- and allow us to evaluate country GHGs emissions,
- and allow us to evaluate country PM emissions,
3. Results
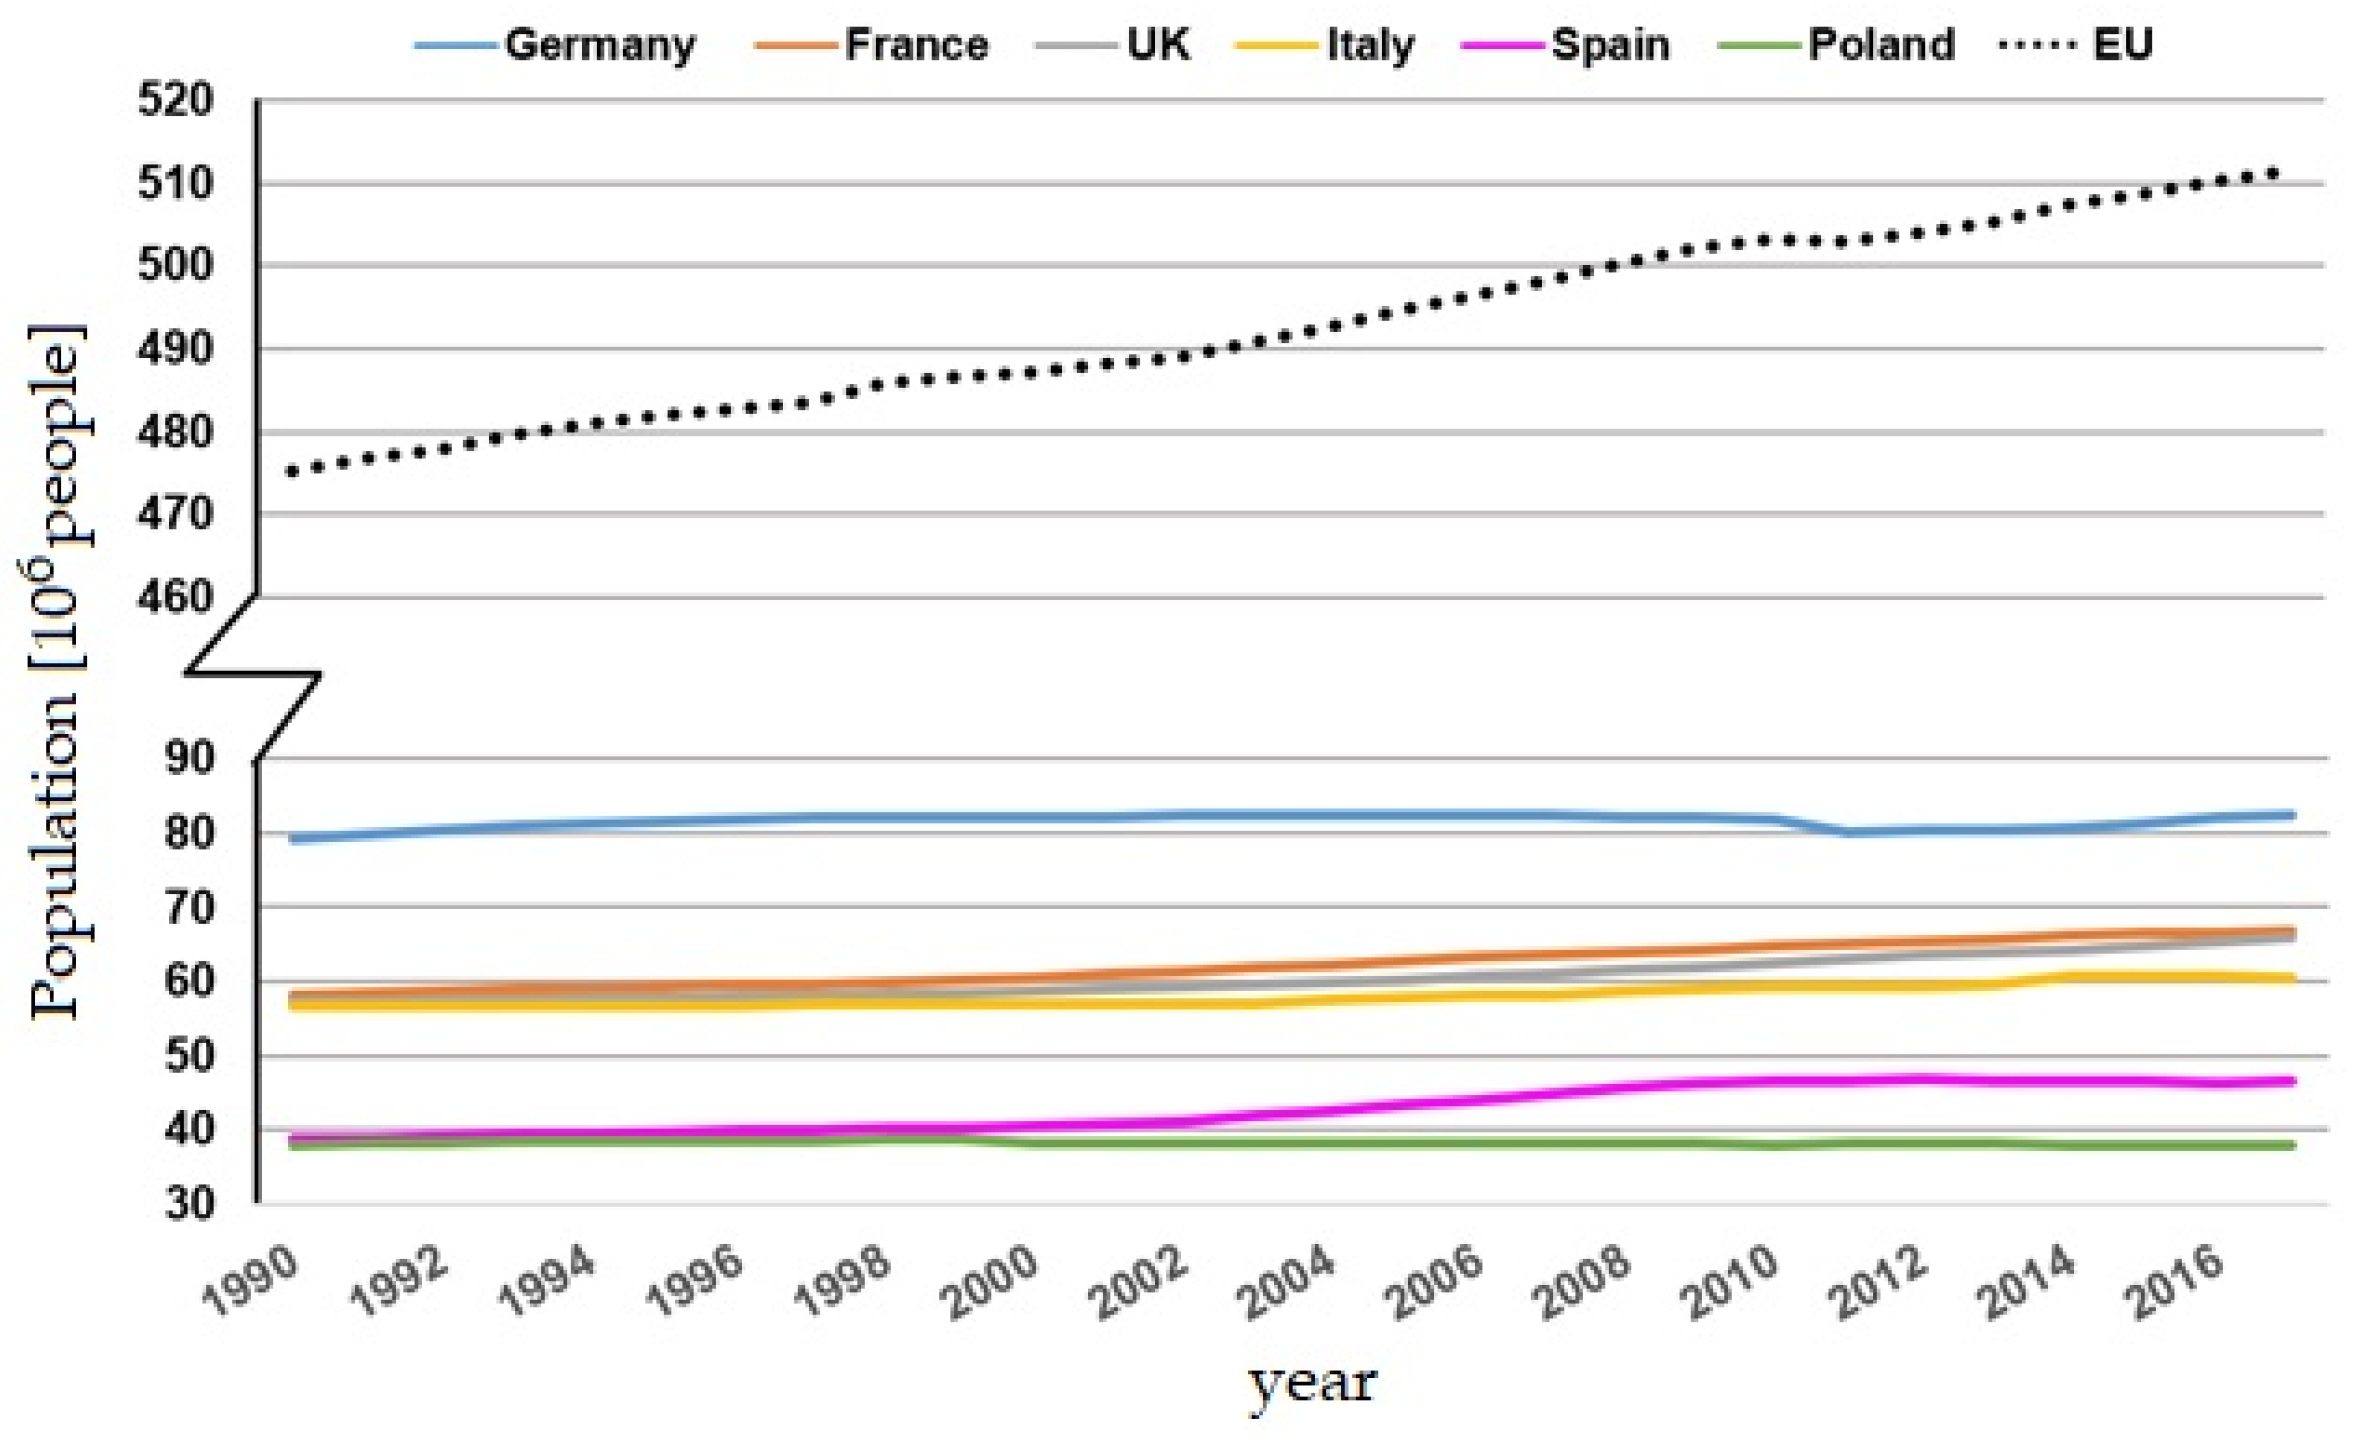
- Countries which belong to the same macro geographical area;
- Countries with comparable number of inhabitants.
- Germany;
- France;
- United Kingdom;
- Italy;
- Spain;
- Poland;
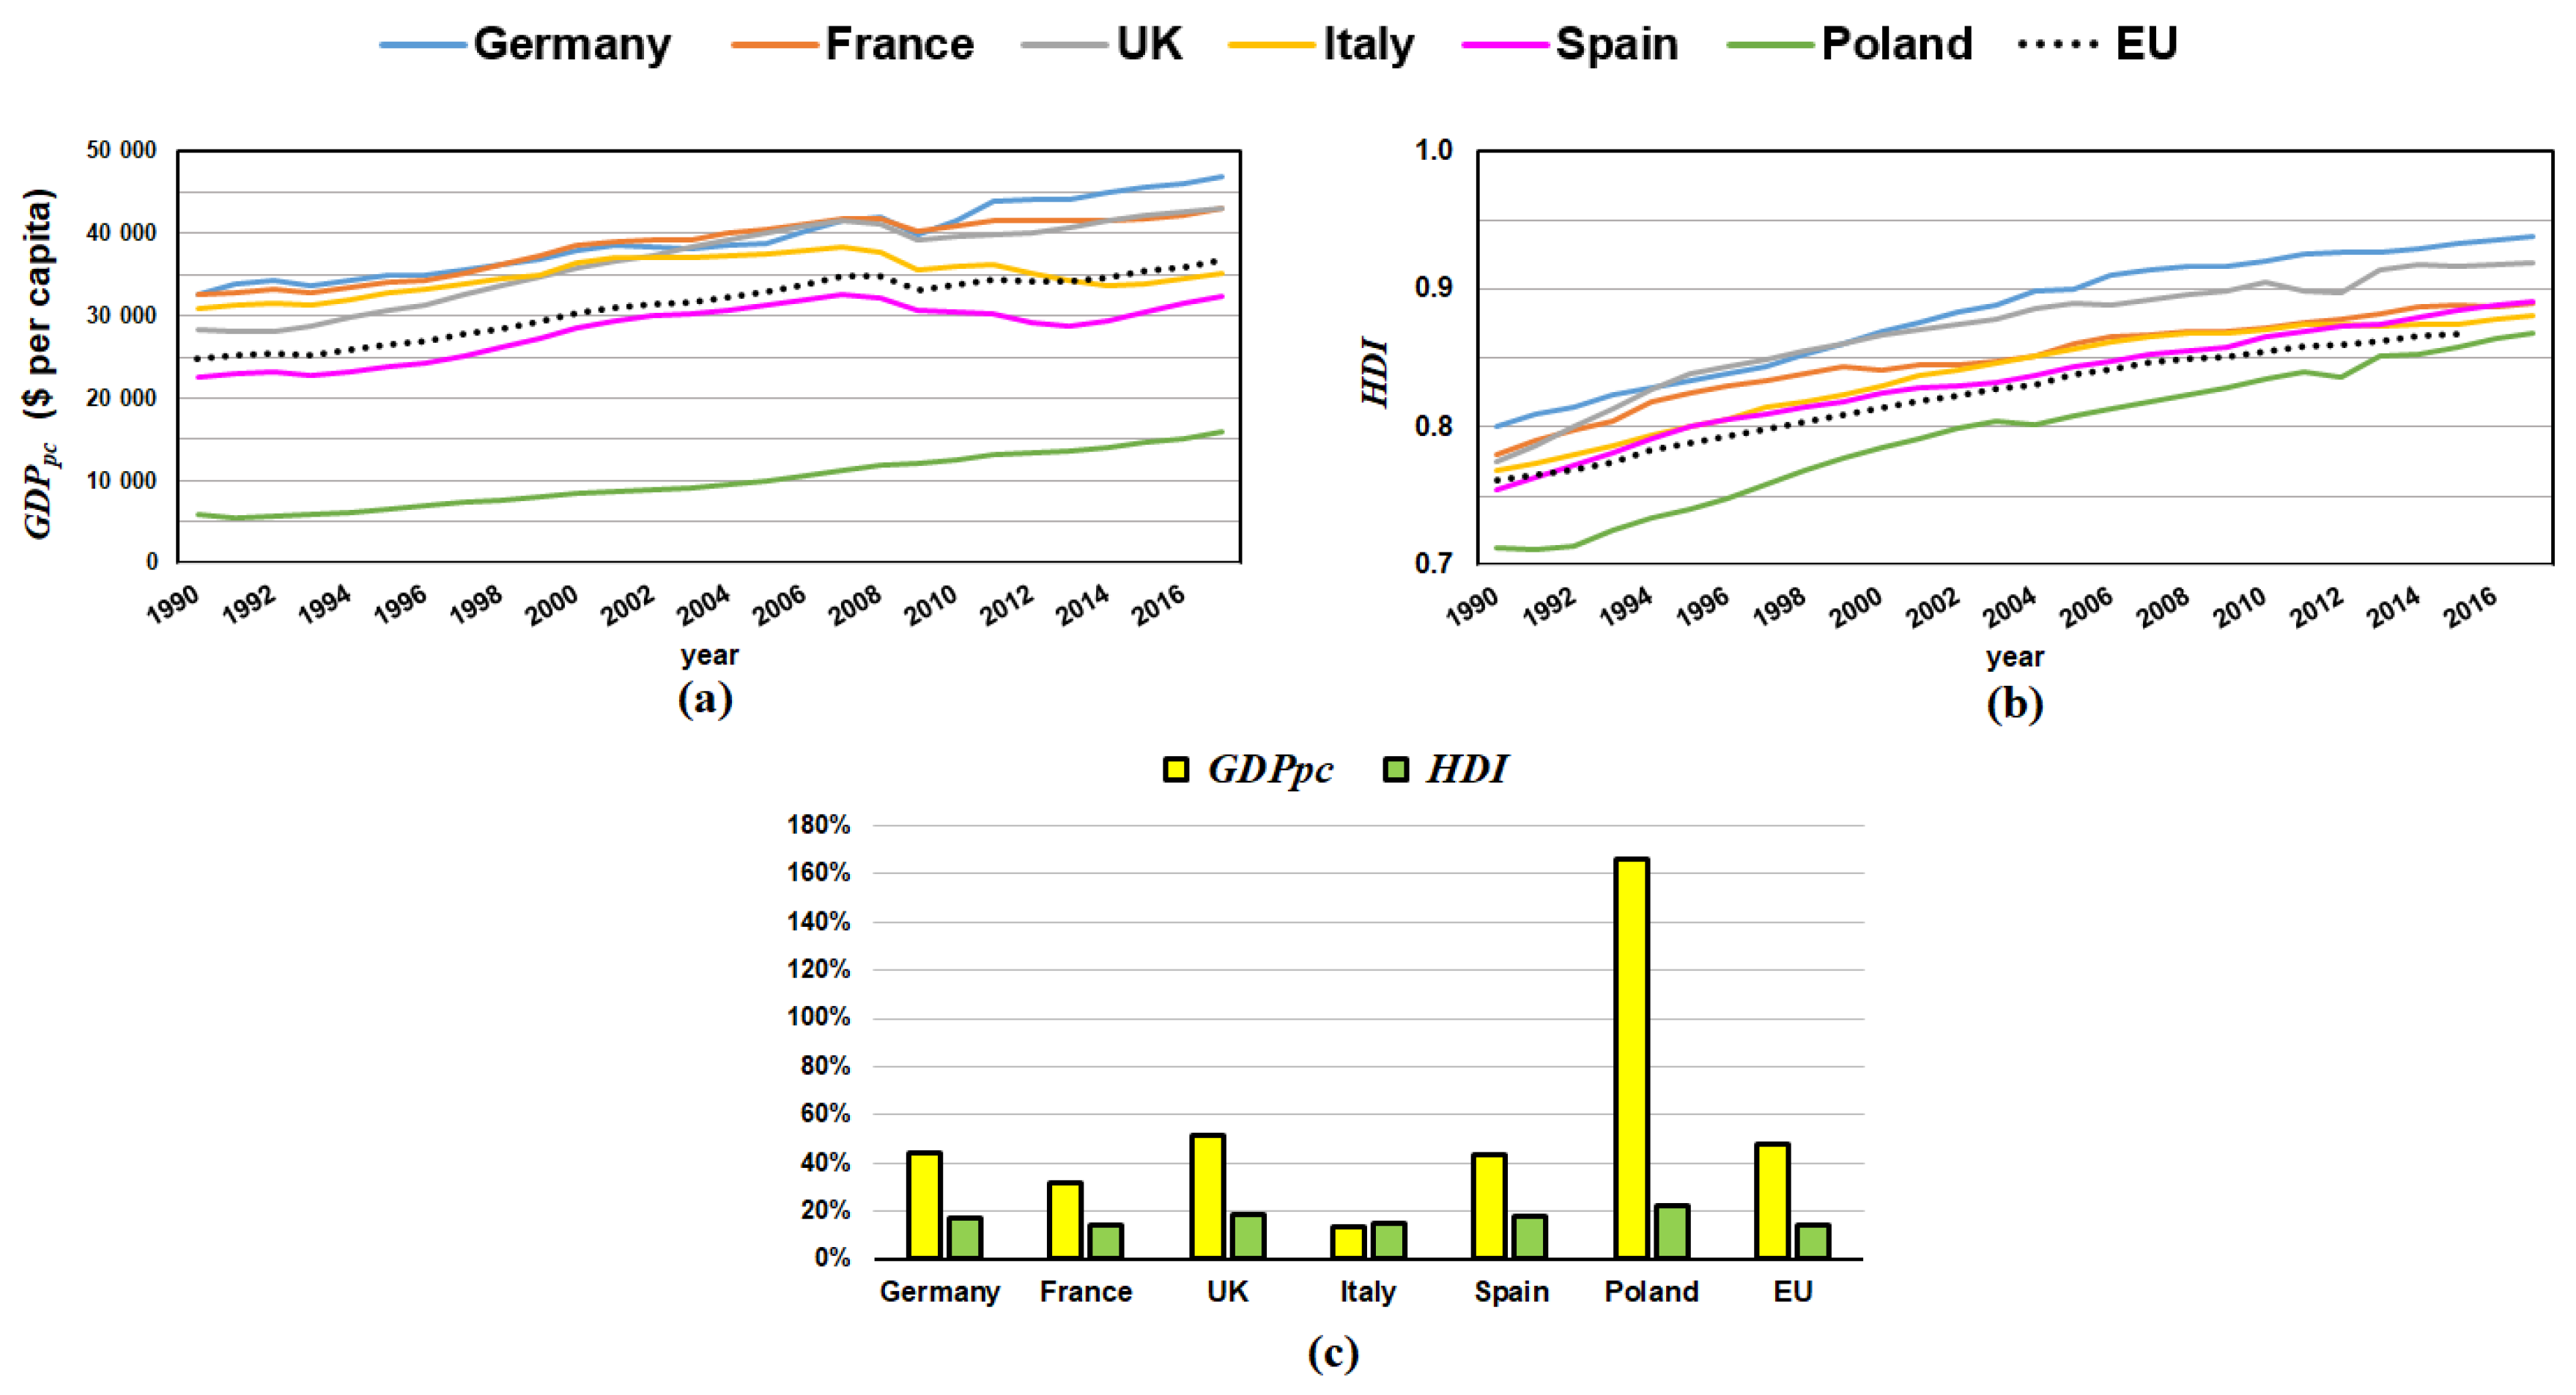
- ∼ for Germany;
- ∼ both for France and United Kingdom;
- ∼ for Italy
- ∼ for Spain;
- approximately unchanged for Poland,
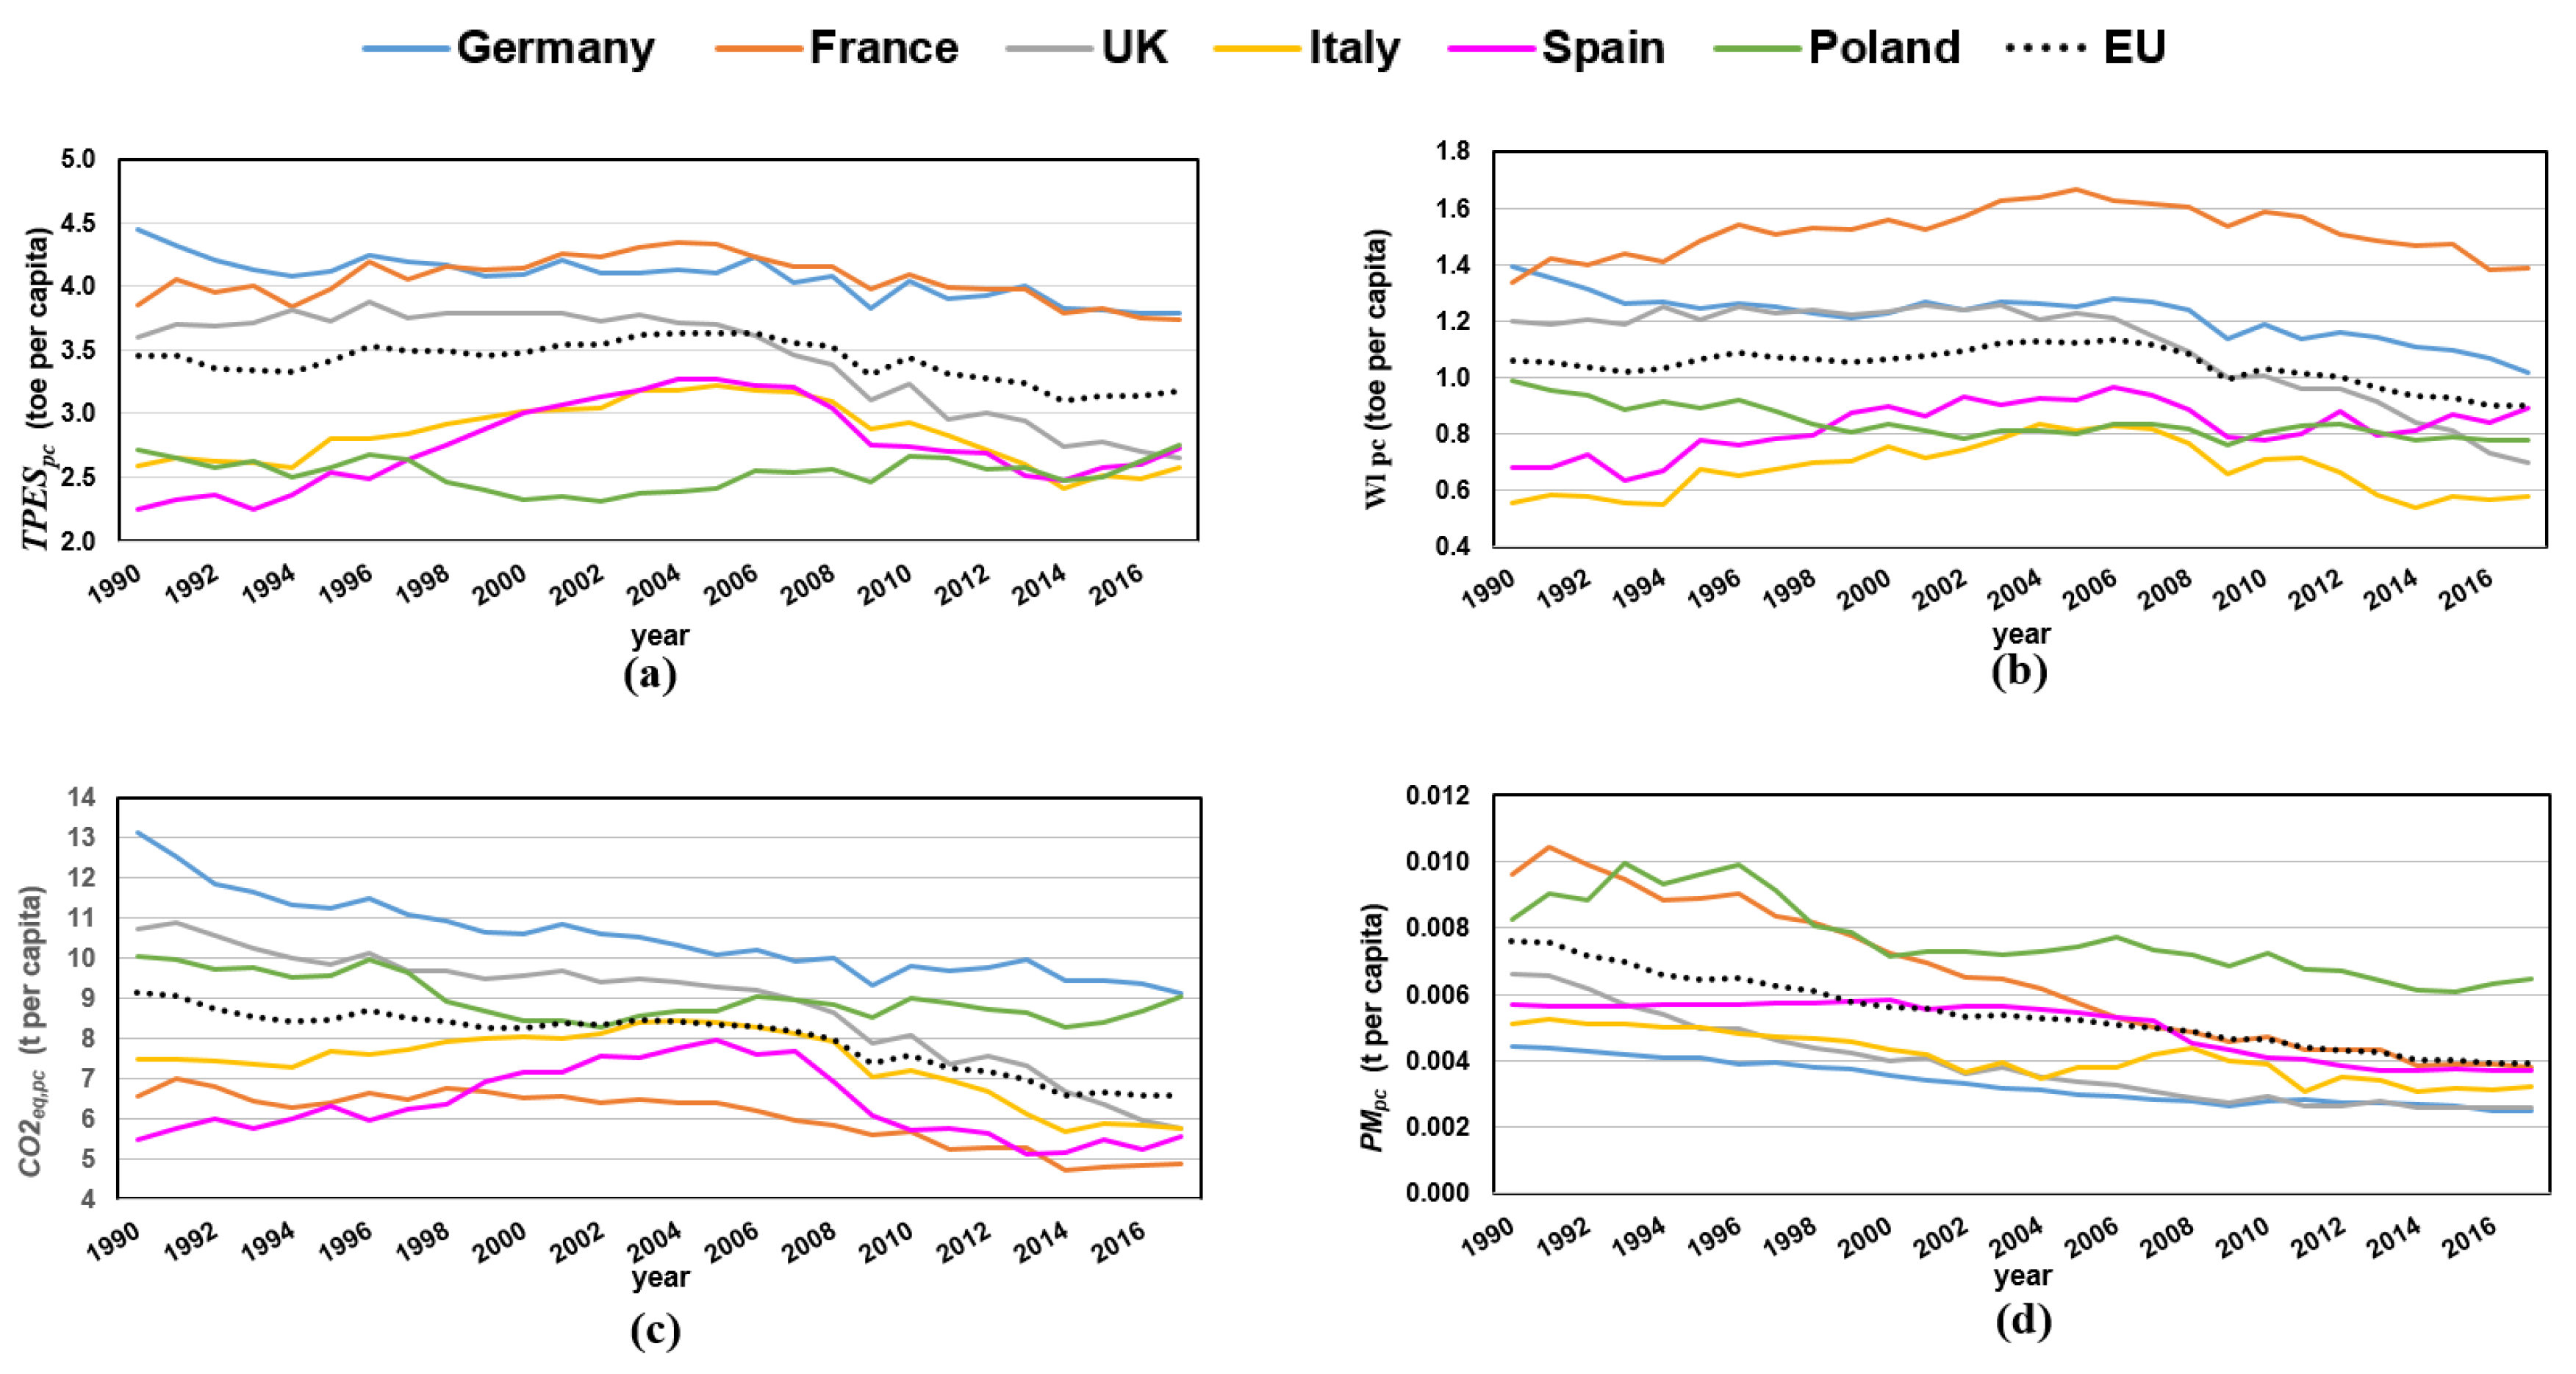
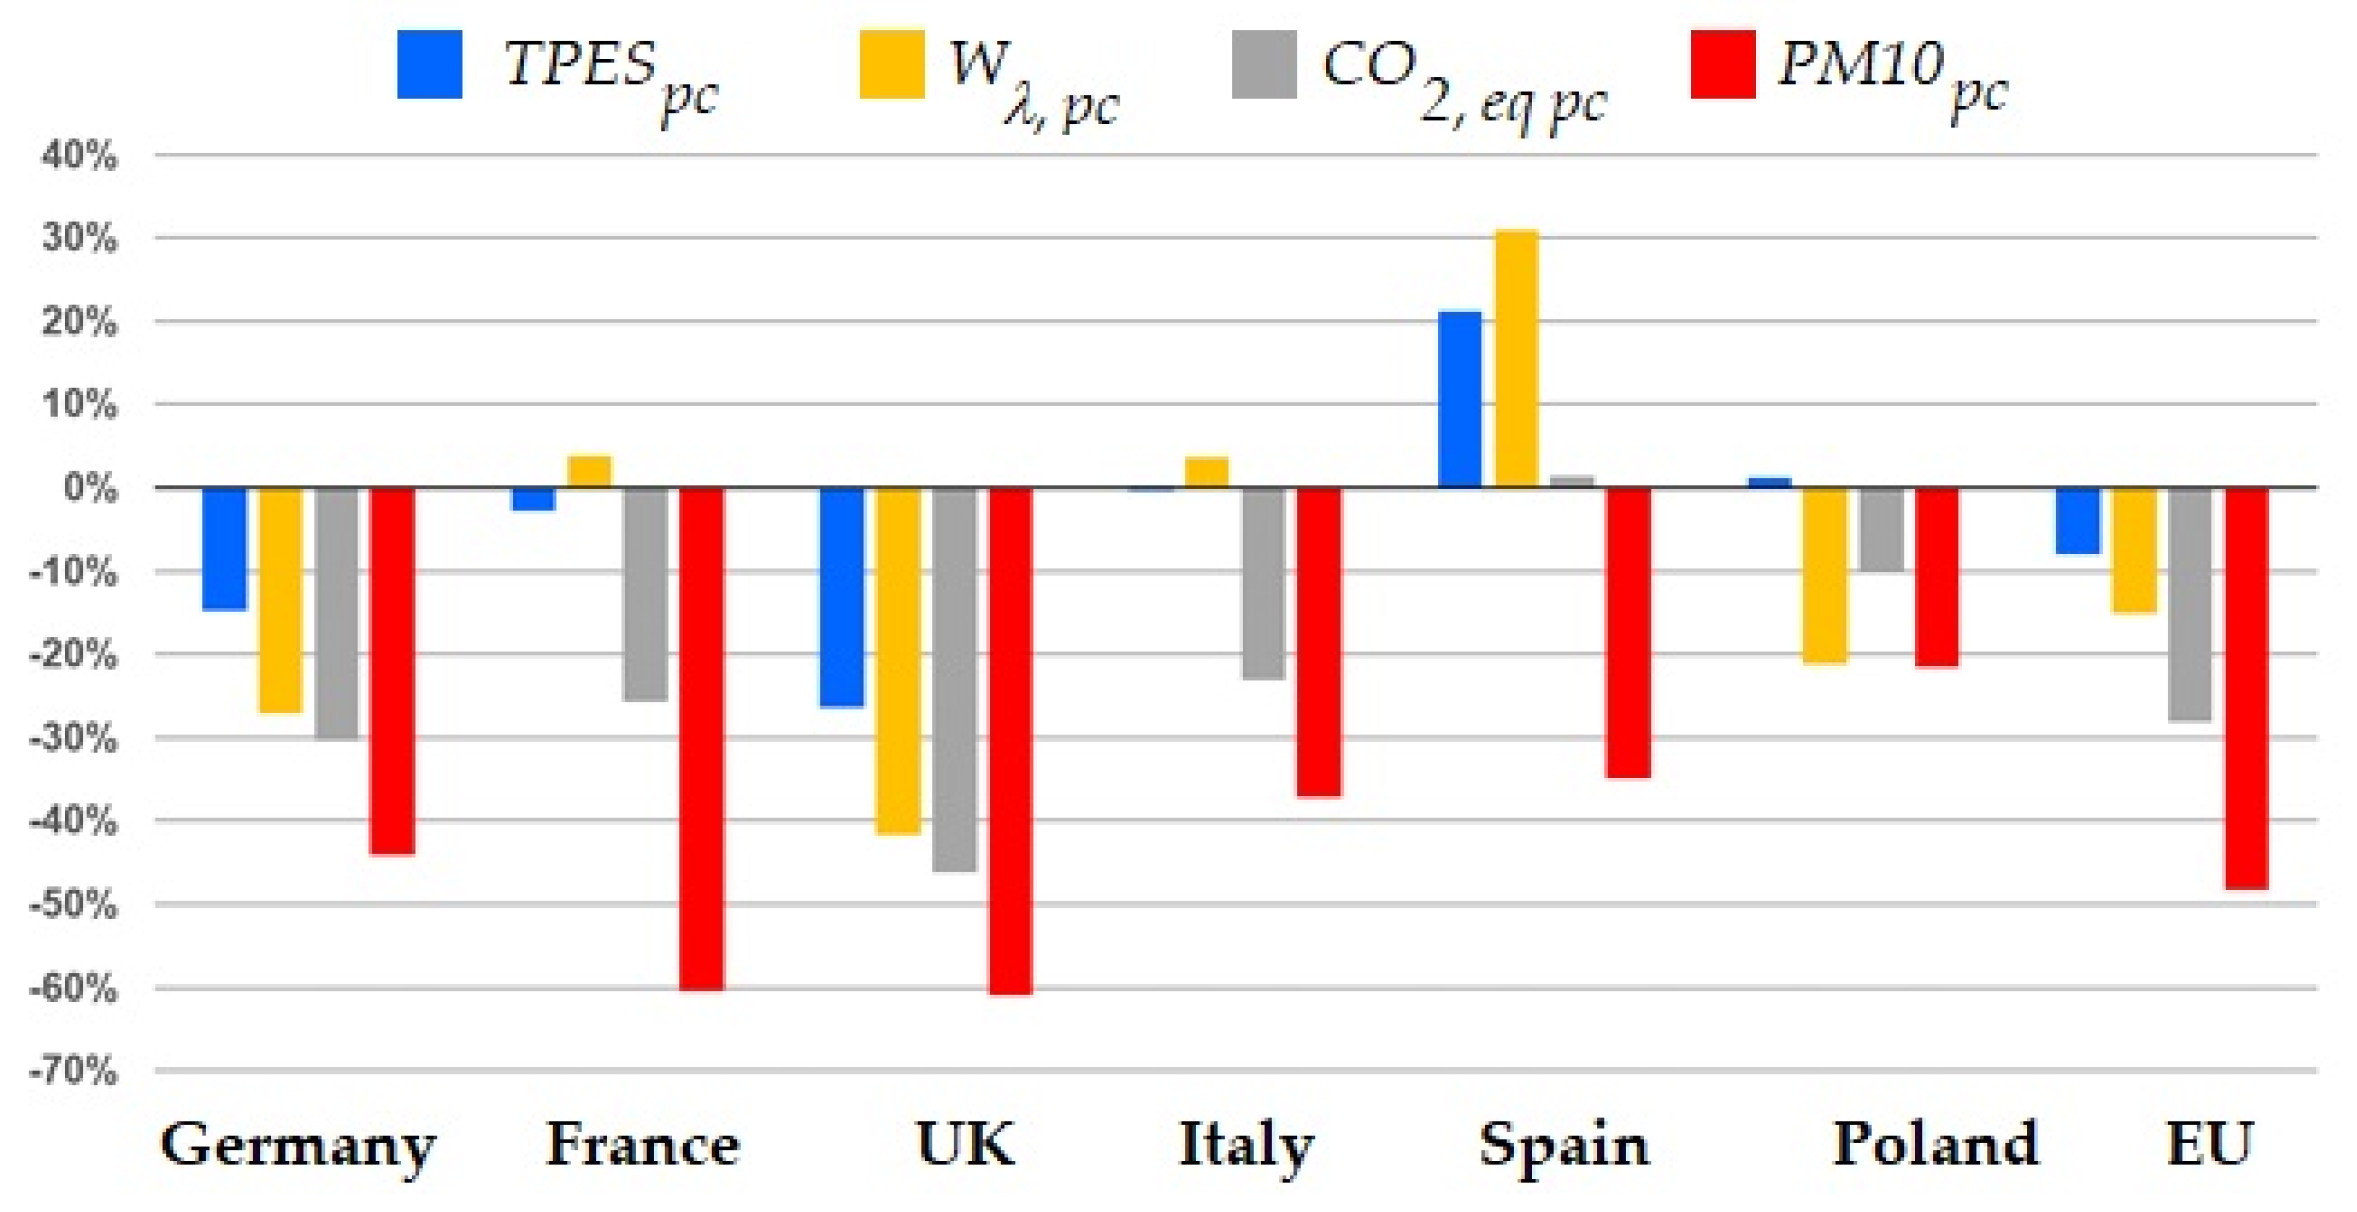
- The Total Primary Energy Supply per capita (Figure 3a) presents different trends among the European countries. Spain and Italy have shown a relevant increase in until 2005, followed by a reduction in the subsequent years, while, as regards the UK and Germany, their decreasing trend in can be highlighted. On the contrary, for France and Poland, a stable trend in can be noticed. The overall variation from 1990 to 2017, presented in Figure 4, highlights that: the UK, Germany and France have reduced their total Primary Energy Supply, compared with the 1990’s values, respectively of , and , while, for Italy and Poland, this quantity has remained almost constant and, an increase of has occurred in Spain. As concerns the overall of EU during the same reference time, it has shown a reduction of ;
- The Exergy Losses related to the energy chain per capita (Figure 3b) present similar shapes if compared with the ones, with an overall reduction (Figure 4) of for Poland, for Germany, for the UK, while an increment for France, Italy and Spain relatively of , and can be identified. For the European Union an overall reduction trend of in has been verified;
- The Greenhouse Gases emissions per capita (Figure 3c) have been reduced in the UK of , in Germany of , in France of , in Italy of and in Poland of . On the contrary, in Spain an increase of ofthe greenhouse emissions has been shown. The overall European Union GHGs emissions reduction has been of ;
- The Particulate Matter emissions per capita (Figure 3d) present a decreasing trend for all the countries involved in the analysis. Their reduction between 1990 and 2017 (Figure 4) has been: of in the UK, of in France, of in Germany, of in Italy, of in Spain and of in Poland. Moreover, the overall reduction of the European Union has been relevant ().
4. Discussion
- Social;
- Economic;
- Environmental;
- Institutional.
5. Conclusions
- The two sets of indicators proposed could be applied to other countries with different population dimensions both in Europe and in other aggregated macro-regions (such as: America, Asia, Africa, etc.);
- Many other alternatives to HDI have been proposed, in order to measure the development of a country from a socio-economic viewpoint, therefore new sets of indicators could be introduced, analysed and compared;
- Although two important pollutants were chosen in this work (one with global impact and the other with local impact) it would be interesting to introduce other environmental indicators that could be useful to policy makers.
Author Contributions
Funding
Conflicts of Interest
Abbreviations
| Energy available to final consumption | |
| C | Consumption |
| Carbon dioxide equivalent, total amount of greenhouse gases emissions | |
| E | This letter has been used to identify the first set of indicators, with reference to economy aspects () |
| EU | European Union |
| G | Government spendings |
| GDP | Gross Domestic Product |
| GHGs | Greenhouse Gases |
| GNI | Gross National Income |
| H | this letter has been used to identify the first set of indicators, with reference to human aspects () |
| HDI | Human Development Index |
| I | Indicator |
| IEA | International Energy Agency |
| Investments | |
| M | Exports |
| PM | Particulate Matter |
| SDI | Sustainable Development Index |
| SDGs | Sustainable Development Goals |
| Total Primary Energy Supply | |
| W | Exergy (Available work) |
| X | Imports |
| Population, total number of inhabitants of a country/region | |
| Subscripts | |
| Maximum value | |
| Minimum value | |
| Per capita | |
| Lost | |
References
- Nardo, M.; Saisana, M.; Saltelli, A.; Tarantola, S.; Hoffmann, A.; Giovannini, E. Handbook on Constructing Composite Indicators: Methodology and User Guide; OECD Publishing: Paris, France, 2008. [Google Scholar]
- Lucia, U.; Grisolia, G. Unavailability percentage as energy planning and economic choice parameter. Renew. Sustain. Energy Rev. 2017, 75, 197–204. [Google Scholar] [CrossRef]
- Garrett, R.D.; Latawiec, A.E. What are sustainability indicators for? In Sustainability Indicators in Practice; Latawiec, A.E., Ed.; DeGruyter: Berlin, Germany, 2015; Chapter 1; pp. 12–22. [Google Scholar]
- Roberts, P.; Jalal, K.; Boyd, J. An Introduction to Sustainable Development; Earthscan—Glen Educational Foundation: London, UK, 2007. [Google Scholar]
- Wu, J.; Wu, T. Sustainability indicators and indices: An overview. In Handbook of Sustainability Management; World Scientific Publishing: Singapore, 2012; Chapter 4; pp. 65–86. [Google Scholar] [CrossRef]
- Neumayer, E. Sustainability and Well-Being Indicators; Report; UNU-WIDER: Helsinki, Finland, 2004. [Google Scholar]
- Asr, E.T.; Kakaie, R.; Ataei, M.; Mohammadi, M.T. A review of studies on sustainable development in mining life cycle. J. Clean. Prod. 2019, 229, 213–231. [Google Scholar] [CrossRef]
- Meadows, D.; Meadows, D.; Randers, J.; Behrens, W., III. The Limits to Growth; Potomac Associates—Universe Books: New York, NY, USA, 1972. [Google Scholar]
- Basiago, A. Economic, social, and environmental sustainability in development theory and urban planning practice. Environmentalist 1999, 19, 145–161. [Google Scholar] [CrossRef]
- Nørgård, J.; Peet, J.; Ragnardsdóttir, K. The History of The Limits to Growth. Solut. J. 2010, 1, 59–63. [Google Scholar]
- Turner, G. A comparison ofThe Limits to Growthwith 30 years of reality. Glob. Environ. Chang. 2008, 18, 397–411. [Google Scholar] [CrossRef]
- Vermeulen, P. ‘Dynamics of Growth in a Finite World’—Comprehensive Sensitivity Analysis. IFAC Proc. Vol. 1976, 9, 133–145. [Google Scholar] [CrossRef]
- Thissen, W. Investigations into the Club of Rome’s World3 Model: Lessons for Understanding Complicated Models. Ph.D. Thesis, Industrial Engineering & Innovation Sciences, Technische Hogeschool Eindhoven, Eindhoven, The Netherlands, 1978. [Google Scholar]
- IUCN; UNEP; WWF. World Conservation Strategy Living Resource Conservation for Sustainable Development; Report; International Union for Conservation of Nature and National Resources; United Nations Environment Programme; World Wildlife Fund; Food and Agriculture Organization; United Nations Educational; Scientific and Cultural Organization; IUCN: Gland, Switzerland, 1980. [Google Scholar]
- Schaefer, A.; Crane, A. Addressing sustainability and consumption. J. Macromarket. 2005, 25, 76–92. [Google Scholar] [CrossRef] [Green Version]
- WCED. Our Common Future; Oxford University Press: Oxford, UK, 1987. [Google Scholar]
- Johnston, P.; Everard, M.; Santillo, D.; Robèrt, K.H. Reclaiming the Definition of Sustainability. Environ. Sci. Pollut. Res. 2007, 14, 60–66. [Google Scholar]
- Castro, C. Sustainable Development: Mainstream and critical perspectives. Organ. Environ. 2004, 17, 195–225. [Google Scholar] [CrossRef]
- Cicin-Sain, B. Earth Summit implementation: Progress since Rio. Mar. Policy 1996, 20, 123–143. [Google Scholar] [CrossRef]
- United Nations General Assembly. Report of the United Nations Conference on Environment and Development—Annex I: Rio Declaration on Environment and Development; Report; United Nations: New York, NY, USA, 1992. [Google Scholar]
- United Nations General Assembly. United Nations Framework Convention on Climate Change; Report; United Nations: New York, NY, USA, 1992. [Google Scholar]
- United Nations General Assembly. Convention on Biological Diversity; Report; United Nations General Secretary: New York, NY, USA, 1992. [Google Scholar]
- United Nations General Assembly. Report of the United Nations Conference on Environment and Development—Annex III: Non-Legally Binding Authoritative Statement of Principles for a Global Consensus on the Management, Conservation and Sustainable Development for All Types of Forests; Report; United Nations: New York, NY, USA, 1992. [Google Scholar]
- United Nations General Assembly. Report of the United Nations Conference on Environment and Development—Agenda 21; Report; United Nations: New York, NY, USA, 1992. [Google Scholar]
- Norman, E.; Carr, D. Rio summit. In International Encyclopedia of Human Geography; Kitchin, R., Thrift, N., Eds.; Elsevier: Oxford, UK, 2009; pp. 406–411. [Google Scholar]
- Sachs, J. From Millennium Development Goals to Sustainable Development Goals. Lancet 2012, 379, 2206–2211. [Google Scholar] [CrossRef]
- Attaran, A. An Immeasurable Crisis? A Criticism of the Millennium Development Goals and Why They Cannot Be Measured. PLoS Med. 2005, 2, 955–961. [Google Scholar] [CrossRef] [PubMed] [Green Version]
- Solheim, E. Climate, Conflict and Capital: Critical Issues for the MDGs and Beyond 2015. IDS Bull. 2010, 41, 100–103. [Google Scholar] [CrossRef] [Green Version]
- Vandemoortele, J. The MDG Story: Intention Denied. Dev. Chang. 2011, 42, 1–21. [Google Scholar] [CrossRef]
- Griggs, D.; Stafford-Smith, M.; Gaffney, O.; Rockstrm, J.; Öhman, M.; Shyamsundar, P.; Steffen, W.; Glaser, G.; Kanie, N.; Noble, I. Sustainable development goals for people and planet. Nature 2013, 495, 305–307. [Google Scholar] [CrossRef]
- Van Zanten, J.A.; van Tulder, R. Towards nexus-based governance: Defining interactions between economic activities and Sustainable Development Goals (SDGs). Int. J. Sustain. Dev. World Ecol. 2020, 27, 1–17. [Google Scholar] [CrossRef]
- Steffen, W.; Persson, A.; Deutsch, L.; Zalasiewicz, J.; Williams, M.; Richardson, K.; Crumley, C.; Crutzen, P.; Folke, C.; Gordon, L.; et al. The Anthropocene: From Global Change to Planetary Stewardship. Ambio 2011, 40, 739–761. [Google Scholar] [CrossRef] [Green Version]
- Lewis, S.; Maslin, M. Defining the Anthropocene. Nature 2015, 519, 171–180. [Google Scholar] [CrossRef]
- Keys, P.; Galaz, V.; Dyer, M.; Matthews, N.; Folke, C.; Nyström, M.; Cornell, S. Anthropocene risk. Nat. Sustain. 2019, 2, 667–673. [Google Scholar] [CrossRef]
- Wu, J. Landscape sustainability science: Ecosystem services and human well-being in changing landscapes. Landsc. Ecol. 2013, 28, 999–1023. [Google Scholar] [CrossRef]
- Hák, T.; Moldan, B.; Dahl, A.L. (Eds.) Sustainability Indicators—A Scientific Assessment; Island Press: Washington, DC, USA, 2007. [Google Scholar]
- Meadows, D. Indicators and Information Systems for Sustainable Development; Report to the Balaton Group; The Sustainability Institute: Hartland, WI, USA, 1998. [Google Scholar]
- Cobb, C. The Index for Sustainable Economic Welfare; Beacon Press: Boston, MA, USA, 1989. [Google Scholar]
- Cobb, C.; Cobb, J. The Green National Product: A Proposed Index of Sustainable Economic Welfare; University Press of America: Lanham, MD, USA, 1994. [Google Scholar]
- Neumayer, E. The ISEW: Not an index of sustainable economic welfare. Soc. Indic. Res. 1999, 48, 77–101. [Google Scholar] [CrossRef] [Green Version]
- Wackernagel, M.; Rees, W. Our Ecological Footprint; Birkhouse Publishing: Basel, Switzerland, 1997. [Google Scholar]
- Rees, W.E. Ecological footprints and appropriated carrying capacity: What urban economics leaves out. Environ. Urban. 1992, 4, 121–130. [Google Scholar] [CrossRef]
- Moldan, B.; Janoušková, S.; Hák, T. How to understand and measure environmental sustainability: Indicators and targets. Ecol. Indic. 2012, 17, 4–13. [Google Scholar] [CrossRef]
- Kissinger, M.; Sussman, C.; Moore, J.; Rees, W. Accounting for the Ecological Footprint of Materials in Consumer Goods at the Urban Scale. Sustainability 2013, 5, 1960–1973. [Google Scholar] [CrossRef] [Green Version]
- Ghita, S.I.; Saseanu, A.; Gogonea, R.; Huidumac-Petrescu, C. Perspectives of Ecological Footprint in European Context under the Impact of Information Society and Sustainable Development. Sustainability 2018, 10, 3224. [Google Scholar] [CrossRef] [Green Version]
- Chen, G.; Li, Q.; Peng, F.; Karamian, H.; Tang, B. Henan ecological security evaluation using improved 3D ecological footprint model based on emergy and net primary productivity. Sustainability 2019, 11, 1353. [Google Scholar] [CrossRef] [Green Version]
- Shi, X.; Matsui, T.; Machimura, T.; Gan, X.; Hu, A. Toward Sustainable Development: Decoupling the High Ecological Footprint from Human Society Development: A Case Study of Hong Kong. Sustainability 2020, 12, 4177. [Google Scholar] [CrossRef]
- Guo, J.; Ren, J.; Huang, X.; He, G.; Shi, Y.; Zhou, H. The Dynamic Evolution of the Ecological Footprint and Ecological Capacity of Qinghai Province. Sustainability 2020, 12, 3065. [Google Scholar] [CrossRef] [Green Version]
- Fiala, N. Measuring sustainability: Why the ecological footprint is bad economics and bad environmental science. Ecol. Econ. 2008, 67, 519–525. [Google Scholar] [CrossRef]
- Hamilton, K.; Naikal, E. Genuine saving as an indicator of sustainability. In Handbook of Sustainable Development; Atkinson, G., Dietz, S., Neumayer, E., Agarwala, M., Eds.; Edward Elgar Publishing: London, UK, 2014; Volume 4, Chapter 22; pp. 336–347. [Google Scholar]
- Hamilton, K.; Hepburn, C. Wealth. Oxf. Rev. Econ. Policy 2014, 30, 1–20. [Google Scholar] [CrossRef]
- Boos, A. Genuine Savings as an Indicator for “Weak” Sustainability: Critical Survey and Possible Ways forward in Practical Measuring. Sustainability 2015, 7, 4146–4182. [Google Scholar] [CrossRef] [Green Version]
- Wilson, J.; Tyedmers, P.; Pelot, R. Contrasting and comparing sustainable development indicator metrics. Ecol. Indic. 2007, 7, 299–314. [Google Scholar] [CrossRef]
- Hsu, A.; Lloyd, A.; Emerson, J.W. What progress have we made since Rio? Results from the 2012 Environmental Performance Index (EPI) and Pilot Trend EPI. Environ. Sci. Policy 2013, 33, 171–185. [Google Scholar] [CrossRef]
- UNDP Human Development Report Office. Concept and Measurement of Human Development; Human Development Report 1990; UNDP (United Nations Development Programme): New York, NY, USA, 1990. [Google Scholar]
- Sagar, A.D.; Najam, A. The human development index: A critical review. Ecol. Econ. 1998, 25, 249–264. [Google Scholar] [CrossRef]
- Hickel, J. The sustainable development index: Measuring the ecological efficiency of human development in the anthropocene. Ecol. Econ. 2020, 167, 106331. [Google Scholar] [CrossRef]
- UNDP Human Development Report Office. The Real Wealth of Nations: Pathways to Human Development; Human Development Report 2010; UNDP (United Nations Development Programme): New York, NY, USA, 2010. [Google Scholar]
- Liu, G.; Brown, M.T.; Casazza, M. Enhancing the Sustainability Narrative through a Deeper Understanding of Sustainable Development Indicators. Sustainability 2017, 9, 1078. [Google Scholar] [CrossRef] [Green Version]
- UNDP Human Development Report Office. Training Material for Producing National Human Development Reports; Occasional Paper; UNDP: New York, NY, USA, 2015. [Google Scholar]
- Mensah, J. Sustainable development: Meaning, history, principles, pillars, and implications for human action: Literature review. Cogent Soc. Sci. 2019, 5, 1653531. [Google Scholar] [CrossRef]
- Lucia, U.; Grisolia, G. Cyanobacteria and microalgae: Thermoeconomic considerations in biofuel production. Energies 2018, 11, 156. [Google Scholar] [CrossRef] [Green Version]
- Torchio, M.F. Comparison of district heating CHP and distributed generation CHP with energy, environmental and economic criteria for Northern Italy. Energy Convers. Manag. 2015, 92, 114–128. [Google Scholar] [CrossRef]
- Mankiw, N. Principles of Macroeconomics; Harcourt College: San Diego, CA, USA, 2001. [Google Scholar]
- Roser, M.; Human Development Index (HDI). Our World in Data. 2014. Available online: OurWorldInData.org (accessed on 29 September 2020).
- World Bank. GDP (Constant 2010 US$). 2020. Available online: https://data.worldbank.org/indicator/NY.GDP.MKTP.KD (accessed on 25 August 2020).
- Lucia, U.; Fino, D.; Grisolia, G. Thermoeconomic analysis of Earth system in relation to sustainability: A thermodynamic analysis of weather changes due to anthropic activities. J. Therm. Anal. Calorim. 2020. [Google Scholar] [CrossRef]
- EUROSTAT. Population Change—Demographic Balance and Crude Rates at National Level. 2020. Available online: https://appsso.eurostat.ec.europa.eu/nui/show.do?dataset=demo_gind&lang=en (accessed on 25 August 2020).
- EUROSTAT. Simplified Energy Balances. 2020. Available online: https://appsso.eurostat.ec.europa.eu/nui/show.do?dataset=nrg_bal_s&lang=en (accessed on 25 August 2020).
- EEA. Greenhouse Gas Emissions by Source Sector. 2020. Available online: https://appsso.eurostat.ec.europa.eu/nui/show.do?dataset=env_air_gge&lang=en (accessed on 25 August 2020).
- EEA. PM10. 2020. Available online: https://ec.europa.eu/eurostat/databrowser/view/sdg_11_50/default/table?lang=en (accessed on 25 August 2020).
- UNDESA; CSD. Indicators of Sustainable Development, Framework and Methodologies; Report; United Nations: New York, NY, USA, 1996. [Google Scholar]
- Levrel, H.; Kerbiriou, C.; Couvet, D.; Weber, J. OECD pressure-state-response indicators for managing biodiversity: A realistic perspective for a French biosphere reserve. Biodivers. Conserv. 2009, 18, 1719–1732. [Google Scholar] [CrossRef] [Green Version]
- OECD. OECD Core Set of Indicators for Environmental Performance Reviews; Report; OECD—Organization for Economic Co-operation and Development: Paris, France, 1993. [Google Scholar]
- IAEA; UNDESA; IEA; EUROSTAT; EEA. Energy Indicators for Sustainable Development: Guidelines and Methodologies; Report; International Atomic Energy Agency; United Nations Department of Economic and Social Affairs; International Energy Agency; Eurostat; European Environment Agency: Vienna, Austria, 2005. [Google Scholar]
- Angelis-Dimakis, A.; Arampatzis, G.; Assimacopoulos, D. Monitoring the sustainability of the Greek energy system. Energy Sustain. Dev. 2012, 16, 51–56. [Google Scholar] [CrossRef]
- Bejan, A. Why we want power: Economics is physics. Int. J. Heat Mass Transf. 2012, 55, 4929–4935. [Google Scholar] [CrossRef]
- Bejan, A. Advanced Engineering Thermodynamics; Wiley & Sons: New York, NY, USA, 2006. [Google Scholar]
- Lucia, U.; Grisolia, G. Exergy inefficiency: An indicator for sustainable development analysis. Energy Rep. 2019, 5, 62–69. [Google Scholar] [CrossRef]
- Grisolia, G.; Fino, D.; Lucia, U. Thermodynamic optimisation of the biofuel production based on mutualism. Energy Rep. 2020, 6, 1561–1571. [Google Scholar] [CrossRef]
- Ritchie, H.; Roser, M. CO2 Emissions. 2020. Available online: https://ourworldindata.org/co2-emissions (accessed on 25 August 2020).
- United Nations. Paris Agreement; UNFCC Agreement; United Nations: New York, NY, USA, 2015. [Google Scholar]
- Anderson, J.O.; Thundiyil, J.G.; Stolbach, A. Clearing the Air: A Review of the Effects of Particulate Matter Air Pollution on Human Health. J. Med. Toxicol. 2012, 8, 166–175. [Google Scholar] [CrossRef] [PubMed] [Green Version]


| Year | Indicator | References |
|---|---|---|
| 1989 | Index of Sustainable Economic Welfare (ISEW) first version | [38] |
| 1990 | Human Development Index (HDI) first version | [55,56] |
| 1992 | Ecological Footprint (EF) | [41,42,43,44,45,46,47,48,49] |
| 1994 | Index of Sustainable Economic Welfare (ISEW), updated | |
| version: Green National Product | [39,40] | |
| 2007 | Environmental Sustainability Index (ESI) | [53] |
| 2010 | Human Development Index (HDI) updated version | [57,58,59,60] |
| 2013 | Environmental Performance Index (EPI) | [54] |
| 2014 | Genuine Savings Indicator (GS) | [50,51,52] |
| Indicator | Maximum Value | Minimum Value |
|---|---|---|
| Life Expectancy Index [yr] | 85 | 20 |
| Mean Years of Schooling [yr] | 15 | 0 |
| Expected Years of Schooling [yr] | 18 | 0 |
| [PPP 2011 $] | 75,000 | 100 |
Publisher’s Note: MDPI stays neutral with regard to jurisdictional claims in published maps and institutional affiliations. |
© 2020 by the authors. Licensee MDPI, Basel, Switzerland. This article is an open access article distributed under the terms and conditions of the Creative Commons Attribution (CC BY) license (http://creativecommons.org/licenses/by/4.0/).
Share and Cite
Torchio, M.F.; Lucia, U.; Grisolia, G. Economic and Human Features for Energy and Environmental Indicators: A Tool to Assess Countries’ Progress towards Sustainability. Sustainability 2020, 12, 9716. https://doi.org/10.3390/su12229716
Torchio MF, Lucia U, Grisolia G. Economic and Human Features for Energy and Environmental Indicators: A Tool to Assess Countries’ Progress towards Sustainability. Sustainability. 2020; 12(22):9716. https://doi.org/10.3390/su12229716
Chicago/Turabian StyleTorchio, Marco Filippo, Umberto Lucia, and Giulia Grisolia. 2020. "Economic and Human Features for Energy and Environmental Indicators: A Tool to Assess Countries’ Progress towards Sustainability" Sustainability 12, no. 22: 9716. https://doi.org/10.3390/su12229716
APA StyleTorchio, M. F., Lucia, U., & Grisolia, G. (2020). Economic and Human Features for Energy and Environmental Indicators: A Tool to Assess Countries’ Progress towards Sustainability. Sustainability, 12(22), 9716. https://doi.org/10.3390/su12229716