Article

Inventory Share Policy Designs for a Sustainable Omni-Chanel E-Commerce Network

1
Department of Industrial Engineering, Faculty of Engineering, Yasar University, Izmir 35100, Turkey
2
Faculty of Accounting, Ton Duc Thang University, Ho Chi Minh City District 7, Vietnam
3
Bristol Business School, University of the West of England, Bristol BS16 1QY, UK
*
Author to whom correspondence should be addressed.
Sustainability 2020, 12(23), 10022; https://doi.org/10.3390/su122310022
Submission received: 26 October 2020 / Revised: 15 November 2020 / Accepted: 26 November 2020 / Published: 1 December 2020
(This article belongs to the Special Issue Digital Manufacturing and Industrial Sustainability)

Abstract

:
This paper studies inventory share policies for sustainable omni-channel e-commerce supply network design by seeking for a good integration policy of online and offline retailers so that the overall supply network reduce its cost, environmental negative impacts by the decreased number of shipments from the main depot, and increase its responsiveness. By the recent advancement in information technologies and internet use, e-commerce practice gained popularity also to keep up with the competitive environment. The increased competitive supply chain environment has revealed the business-to-business (B2B) concepts enabling business applications between companies. Strategic alliance is a partnership concept realized between two or more organizations ensuring that stages are managed with consideration of the welfare of the others in the whole network. By considering that there are inventory share policies between stages, we accept the existence of strategic alliance implementation in the network, aiming to increase total network flexibility and profitability as well as sustainability in the network. In the study, we research inventory share policies towards strategic alliance concept to have a network design with a decreased negative effect of demand uncertainty and increased profitability in the network. By inventory share policies, businesses share their current inventories with the others so that transportation cost and CO2 emission caused by traffic intensity is decreased in the network. We propose six inventory share policy combinations and optimize the (s, S) inventory levels under those policies by minimizing total network cost. We utilize the simulation modeling approach for the modeling purpose. We compare the policy results based on the total network cost, the total number of shipments completed from the main warehouse, and total lost sale cost, etc., at the optimal levels and suggest the best policy design.

1. Introduction

Developments in technology and the economy have created great changes in marketing. The widespread use of the internet and mobile devices has led to changes in customer expectations and marketing approaches. Those developing and changing dynamic structures have pushed companies to seek faster and more profitable channels [1]. By digitalization of supply chains and recent customer oriented competition of businesses, e-commerce in commercial enterprises has become one of the most important channels. It ensures increased customer satisfaction and expectations by providing fast and wide options in service.
In the past, retailers could only access customers from their physical (e.g., brick-and-mortar) stores, through a single channel. By the recent IT developments, enterprises have changed their marketing policies towards uninterrupted, faultless, and fast service implementations through many channels. Those channels are evolving from single-channel classical commerce to multi-channel, cross-channel, and multi-channel commerce. With the disappearance of the boundaries between the channels, it has become possible to redesign the relationships of business processes between retailers and supply chains considering integration of physical and online channels [2]. The recent trend through that is defined to be multi-channel, enabling the integration of physical and online channels and increasing the number of channels they serve to customers [3]. Transition to omni-channel marketing is one of the reasons for providing an uninterrupted service understanding [4]. It is a concept aiming to provide customers a shopping experience in which all channels are integrated [5]. While multi-channel retailing is the concept where consumers reach products or services through multiple channels [6], omni-channel, on the other hand, integrates retailers′ physical and online channels, enabling consumers to shop from any channel by removing the boundaries between them [7]. Under the multi-channel option, customers cannot access all physical and online channels. Hence, they are subject to interruptions between channels. On the other hand, in the omni-channel option, customers can access all channels in a single transaction [8]. By that, customer continuity can be achieved by preventing demand loss.
Increased integration in supply networks has also increased the complexity of the efficient management of the networks. Hence, the redesign of supply chains for efficient management of them has become an emerging topic [9]. Business-to-business (B2B) models are considered to be the building blocks of omni-channel systems. B2B models enable the business applications within the company or between companies in the network. They do not only provide market and economic advantages to businesses but also provide customer sustainability.
B2B models and the removal of the boundaries in omni-channel concepts may cause increased demand uncertainty throughout the network. Hence, the requirement of efficient inventory control algorithms emerges. Enterprises seek inventory management policies and practices in their supply chains in order to respond to customer orders shortly and reduce their total costs [10]. Inventory sharing between chain members in the network may be an option providing flexibility and profitability in the supply chain system [11]. By an optimal inventory share policy, total inventory holding costs can be decreased and the customer service level can be increased by the transfer of excess stock between locations [12]. By the recent Industry 4.0 technological and internet of things (IoT)-based developments, real time communication and provision of active coordination of supply chain members become easy and possible. Hence, inventory share implementations among locations can be managed efficiently.
In an effort to meet all customer demands and deliver products in the fastest way, transport flow in the supply network tends to increase. Increased transport flow also increases the number of active vehicles on the roads, resulting in increased CO2 emission. By a good inventory share policy, a stage in a supply network tends to not order from an upper-echelon, instead, it requests from a lateral stage in the network which might result with decreased traffic and CO2 emission. Today, environmental responsibilities have also become important issues for companies in supply chain management.
In this study, we aim to study inventory share policies in an omni-channel supply network where there are online and offline stores connected to each other under an IoT environment. Our aim is to reduce the total network cost by ensuring customer sustainability and reducing total transportation from upper echelons. We consider three online and offline stores and optimize their s, S inventory levels under pre-defined inventory share policies. To solve the problem, we utilize a simulation modeling approach completed in Arena 16.0 commercial software. Optimization of inventory levels is done by using the tool OptQuest provided in that software.
This paper is structured as follows. In Section 2, we provide literature works on omni-chanel, lateral transshipment, s, S inventory control problems as well as sustainability subjects. Section 3 describes the methodology implemented, simulation models and developed inventory share policies. In Section 4 and Section 5, we provide the results and analyses, respectively.

2. Literature Review

Technological developments have changed customer behaviors, resulting in an increased tendency of retailers towards digitalization. Digital channels emerge in marketing as a result of uninterrupted shopping experience expectation of customers [13]. E-commerce has experienced significant improvements compared to the brick-and-click channel system by recent digitalization advancements. In e-commerce, business models are developed by the integration of channels providing online and offline services together to increase sales [14]. Towards this concept, in this study, we study an integrated supply network system (i.e., omni-channel network) design where stages (i.e., online and offline stores) can share their current inventories among them so that the network reduces its total transportation cost and CO2 emission as well as the total network cost.
Lazaris and Vrechopoulos [15] describe omni-channel as a marketing strategy realized by integrated and uninterrupted usage of all channels. Multi-channel and omni-channel concepts are usually confused with each other. The most important difference is that in the multichannel, customers cannot move freely between online and offline stores. However, in an omni-channel concept, customers move freely between all channels without interruption [8]. The omni-channel strategy enables customers to shop wherever and whenever they would like. It aims to manage retailers’ expectations accurately and provide services to satisfy customer expectations [16,17].
Increasing cost of physical stores and the advantages of integrating the physical and online stores have led retailers to consider omni-channel applications. Janka [18] studies the integration of stock management and distribution channels. By that, customer sustainability can be achieved by reducing lost sales due to stock shortages. Juaneda-Ayensa et al. [19] emphasize the two most important issues for omni-channel applications to be successful: providing a holistic customer experience and preparing an effective technological infrastructure. The administrative and financial difficulties of integration of online and offline warehouses are mentioned by [20].
Implementation of logistic operations is one of the significant and hardest issues in omni-channel supply chain management [21]. Retailers implementing omni-channel strategies successfully are gaining significant experience in distribution logistics capabilities to overcome the challenges arising [22]. Logistics and inventory management in the supply chain plays a significant role in affecting the performance and success of the entire chain. In an omni-channel, network, inventory control policies should be developed so that demand uncertainties are altered to ensure customer satisfaction and sustainability. Lateral inventory transhipment policy allows inventory sharing between the same stages in a network, reducing lost sale costs and increasing customer satisfaction [23]. Lateral inventory share policy is also referred to as inventory pooling in literature.
Cohen and Lee [24] conduct two case studies for the automobile and computer industry and conclude that stock pooling performs well in service level improvement. Lau et al. [25] create a decision model based on genetic algorithm and fuzzy logic in which lateral transshipment, supplier selection, and vehicle routing decisions are taken simultaneously. The algorithm they develop produces better results than the other search methods. Wijk et al. [26] study lateral inventory share models for two stock points. Alvarez et al. [27] conduct a study where lateral transshipment is performed for priority customers in a network with multiple dealers and the main depot.
Lateral transshipment is performed based on two policies: reactive and proactive, where sharing policy decisions differ according to some conditions [28]. The proactive approach requires incoming demand information at predetermined times and predicts the required inventory levels. Reactive approaches are based on the current inventory level and instant demand, so sharing can be done at any time. Banerjee et al. [29] propose two sharing policies, based on inventory availability and inventory equalization, similar to proactive and reactive approaches. In the proactive one, warehouses with excess stocks ship items to warehouses that fall below a specific stock level. In the reactive approach, products are sent when the backorder is to occur.
Determining the correct order quantity by determining the reorder points and safety stock levels is a critical issue in supply chain management. Amiri Aref et al. [30] achieve minimum cost by optimizing location and inventory in a two-echelon supply chain network. They use a sample average approximation approach in their developed mathematical model and apply an (s, S) inventory control policy to avoid demand uncertainty. Their work provides a powerful solution approach for cases of uncertainty and complicated situations. Ekren and Örnek [31,32] examine (s, S) inventory control problems by using simulation optimization procedures. Ekren and Arslan [33] compare different lateral transshipment policies by considering an (s, S) inventory policy to minimize cost. They propose that models with lateral transshipment policy produce better results than models without lateral transshipment policy.
Today, organizations are required to be economically and environmentally balanced in global operations to stay competitive. That is why laws, social pressures, environmental problems, and the depletion of natural resources, businesses are trying to make their supply chain operations environmentally sensitive to reduce environmental risks. Hammami et al. [34] develop a multi-echelon inventory model using a carbon emission tax and carbon emission cap. In that study, they show the effect of lead time in a multi-echelon inventory model with carbon emissions. Manupati et al. [35] develop a nonlinear mixed-integer programming model for a multi-echelon supply chain network aiming to minimize cost and CO2 emissions. As a result of their work, they observe that the carbon cap and trade policy provide the best cost. Wang et al. [36] observed the problem of production planning, transfer, and carbon trading of a producer with different carbon applications. The manufacturer′s operational decisions are optimized by using an integer programming model to maximize total profit. Their results examine the impact of different carbon trading mechanisms on manufacturers, retailers, relevant countries, and the global supply chains. That work contributes to the research of lateral transshipment, cap carbon, and trading policies. Visconti and Morea [37,38] study the network problem for healthcare systems.
The main motivation of this article is to search inventory share policies for today’s omni-channel supply chain network providing decreased cost, transport flow, customer dissatisfaction, and CO2 emissions in the network. We pre-define six lateral inventory share policies for the studied omni-channel supply network and compare their performance results in terms of total network cost by optimizing (s, S) inventory levels by simulation modeling. In addition to comparing six lateral inventory share policies, we also compare lateral inventory share policies with a non-sharing policy in the network.

3. Materials and Methods

3.1. Problem Definition

As mentioned, retailers apply the omni-channel concept to integrate all channels throughout the supply network to provide increased service level for customers [20]. Logistics and inventory management operations are important issues for successful implementation of the omni-channel concept. Businesses have to ensure the visibility of online and offline channels to achieve efficient management. Companies search for ways of how they can increase customer satisfaction while reducing their cost in managing such complex omni-channel networks. For example, inventory share application could be one of the solutions that might reduce total network cost while increasing customer service level. Developing a good inventory share policy becomes critical at this point. In this paper, we study different inventory share policies under an omni-channel network where there are three online and offline stores that are connected to each other so that their inventory levels are visible.
We assume that there are three different companies selling similar group of products under their online and offline marketing channels. Customers can purchase from either online and offline stores. Each store has a specific demand distribution. If the requested product amount does not exist at the store then, the lacking product could be met from another store based on the pre-defined inventory share policy. The policies developed such that inventory share does not take place only within a single company’s online and offline stores but may also take place between different companys’ online and offline stores. By an inventory share policy, transportation cost from the main depot is aimed to be reduced, contributing to the CO2 emission reduction.
In the studied omni-channel network, our aim is to optimize the (s, S) inventory levels minimizing total network cost. Here, s and S represent re-order point and order-up-to levels, respectively. Determining the optimal (s, S) levels is significant for efficient management of inventory in supply chains. We simulate the considered policies in ARENA 16.0 commercial simulation software and optimize them by using the OptQuest tool provided in that software. We compare the performance of the results at the optimal points of the studied inventory share policies in terms of total network cost, total number shipments completed from the main warehouse, total lost sale cost, total inventory share, etc. The simulation model details, along with the considered assumptions, are provided in Section 3.2.

3.2. Simulation Model Assumptions

The assumptions of the omni-channel network and the considered inventory share policies are summarized as below:
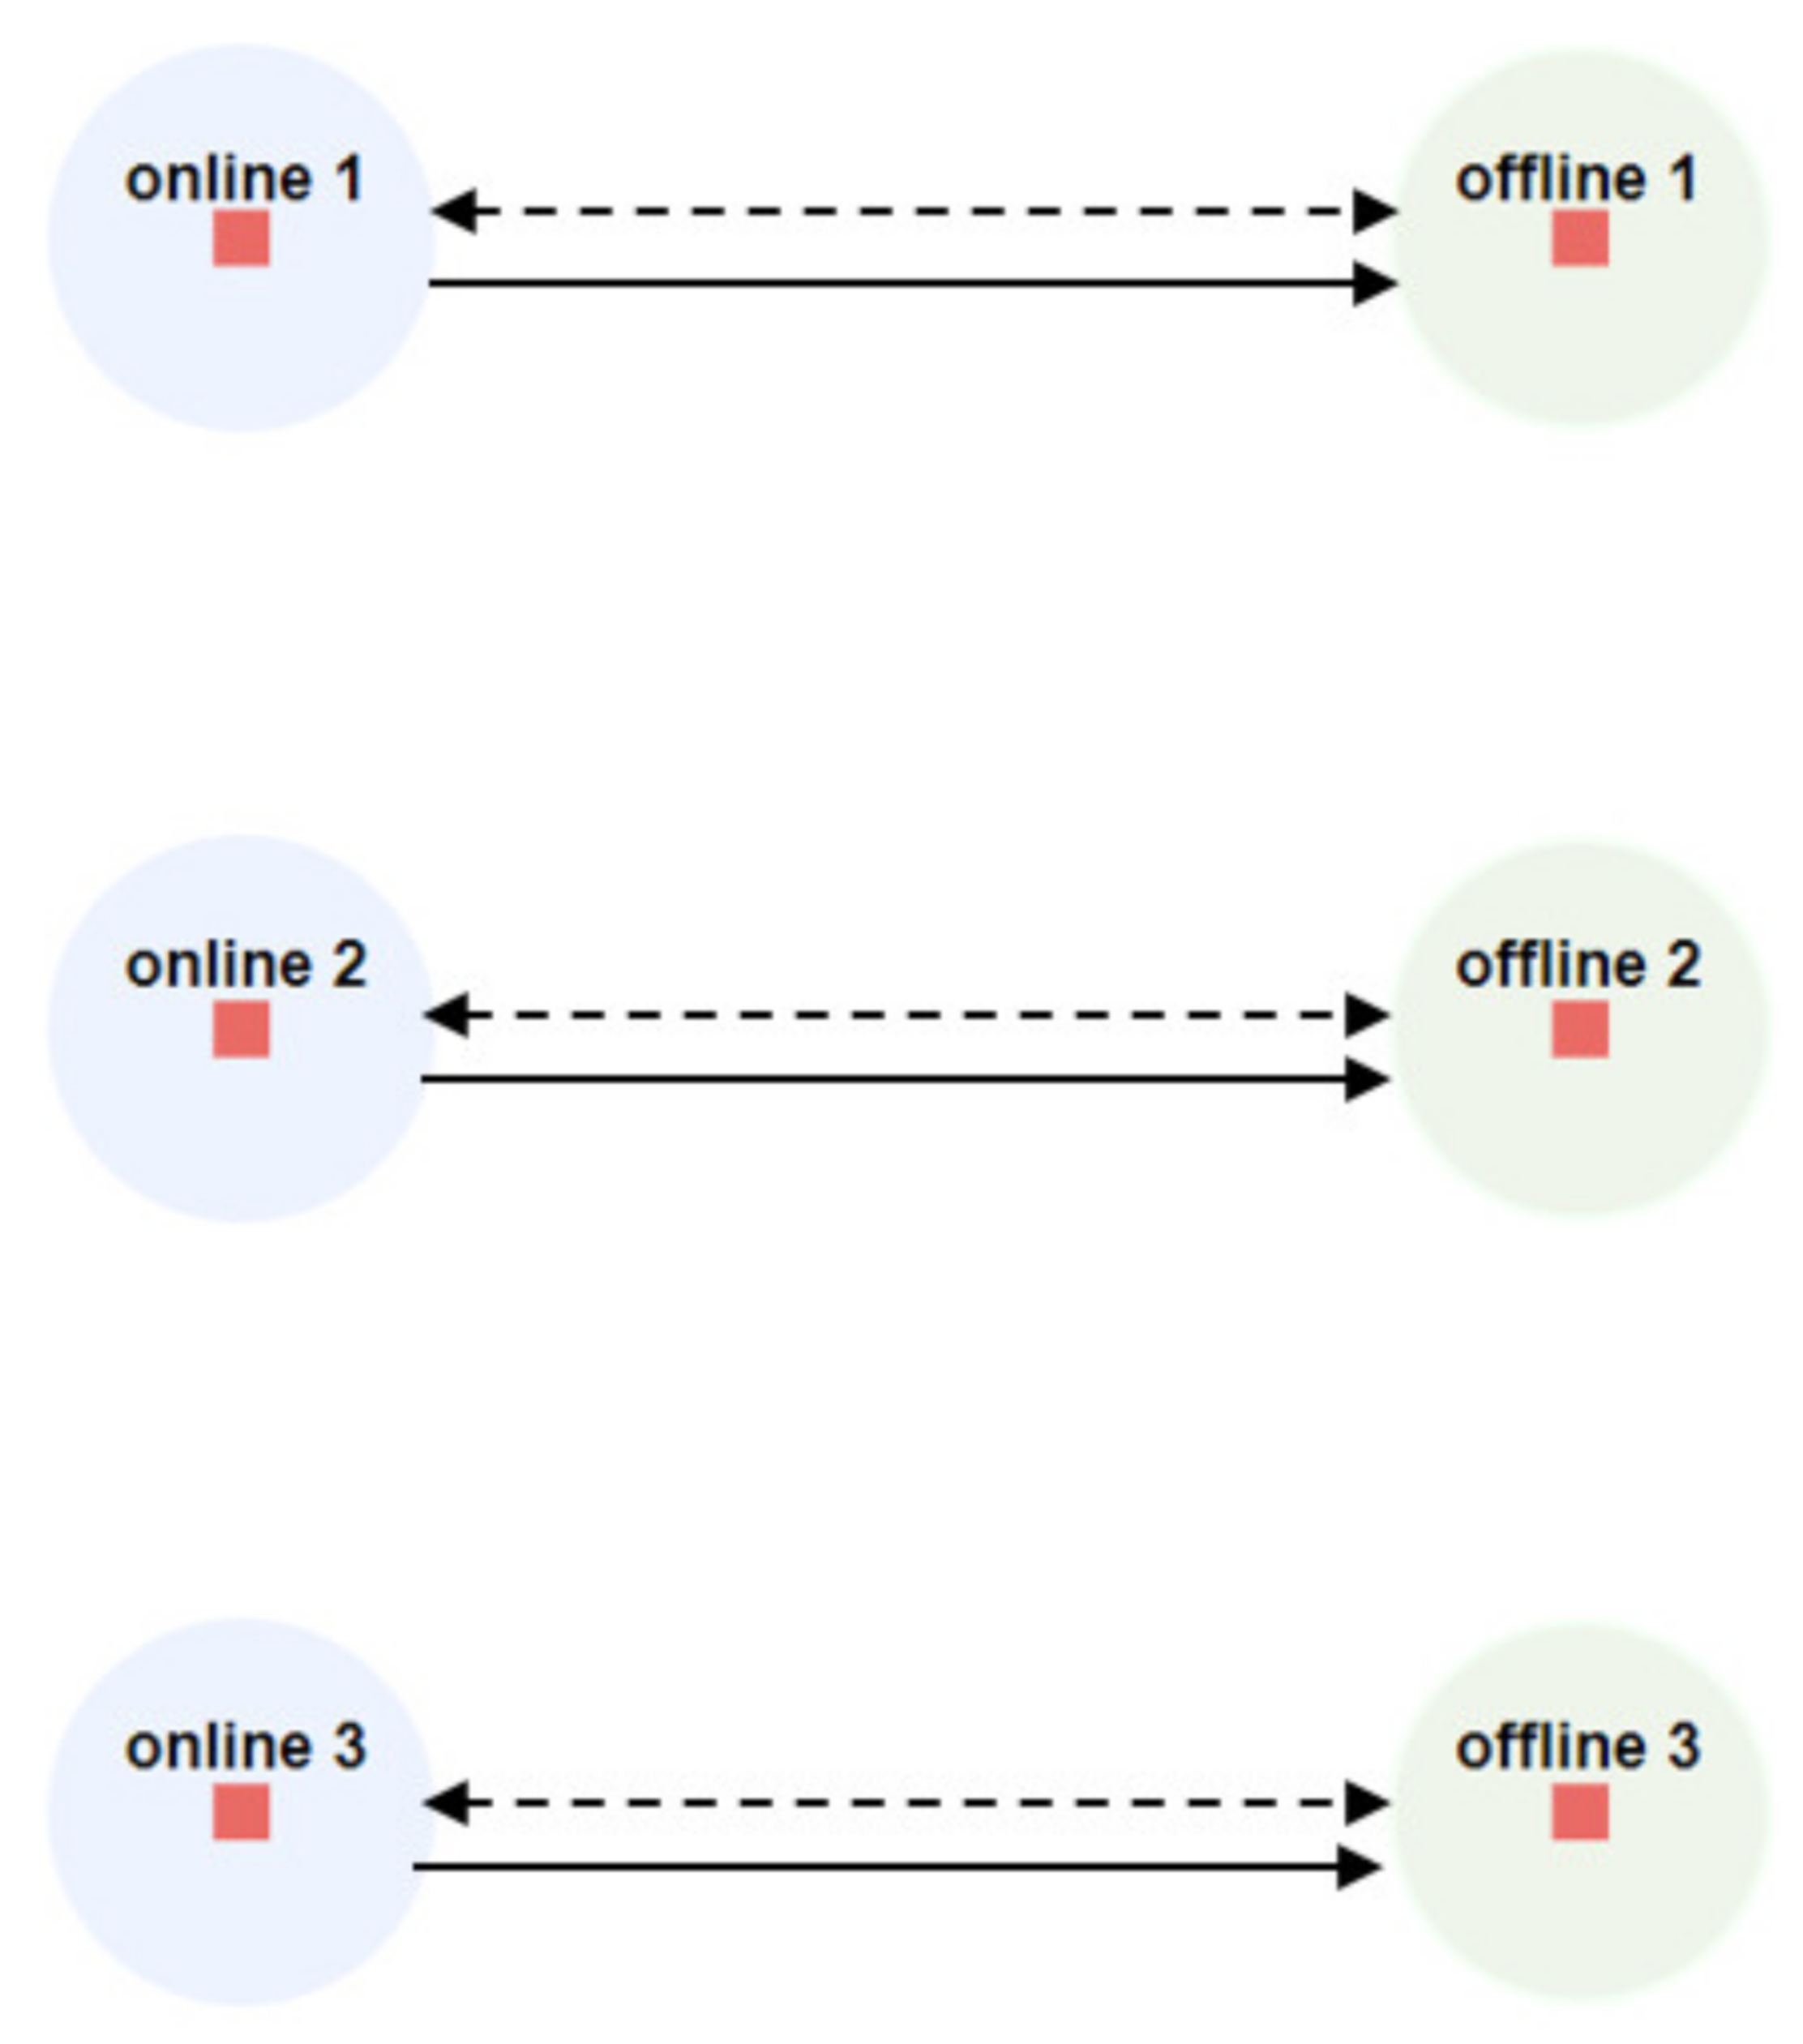
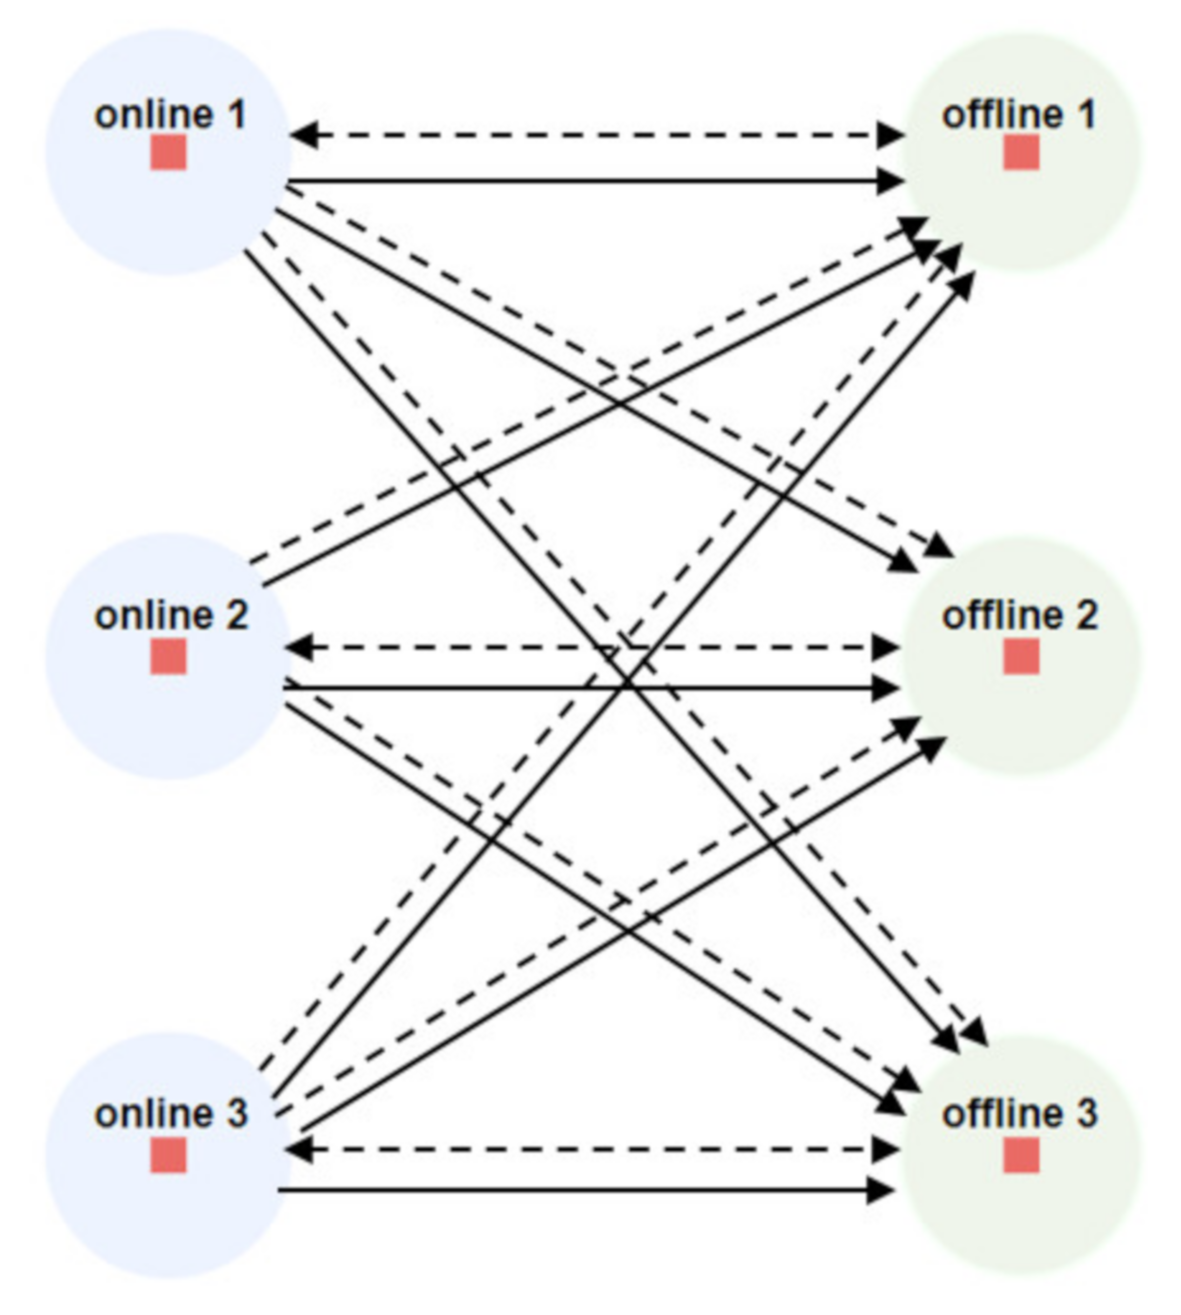
  • There are three different companies in the system, each of which has its offline and online stores. Hence, there are six store locations at the same echelon as offline and online stores.
  • There is a single type of product in the system.
  • Mean demand amount distribution for online stores is considered to be larger than the mean demand amount distribution from offline stores.
  • Demand arrivals at stores follow a Poisson distribution with mean one day.
  • Demand amount distributions for stores are considered to be a normal distribution. Specifically, these values are: Online 1 Normal (70, 20), Online 2 Normal (50, 20), Online 3 Normal (90, 20), Offline 1 Normal (35, 20), Offline 2 Normal (25, 20), and Offline 3 Normal (45, 20).
  • Inventory replenishments are done by the main warehouse with unlimited capacity.
  • Lead time distribution for product arrivals from the main warehouse to the stores follows Uniform (1, 2) days.
  • While calculating the replenishment amounts for store i at time t, Qit, products on road are counted as on hand.
  • Capacity of a truck sent from the main warehouse is considered to be 100 items per truck.
  • The number of trucks sent from the main warehouse is considered to be infinite.
  • For unmet offline store orders, it is assumed that with 75% probability, the customers accept that those orders can be met from any other stores. Namely, with 75% probability, customers accept to wait to meet their orders from another store in the network. Otherwise, it becomes a lost sale.
  • In each store, the (s, S) levels are optimized under 95% customer service level constraint.
  • Simulation models are run for one year.
  • Warm-up periods are two months for the all models.
  • Total cost of the network is computed by considering holding, ordering, transportation, fixed and variable inventory share costs, as well as lost sale costs.
  • Ten independent replications are performed for each scenario.
  • The common random numbers (CRN) variance reduction technique is used to ensure that the random numbers in the simulation models were consistent with each other for all scenarios.
The simulation models are verified and validated by animating and debugging the models, respectively.

3.3. Notations and Pseudo-Codes Considered in the Simulation Models

The notations that are considered in the simulation models are summarized as in below:
  • si: re-order stock level of store i, i = {1, 2, 3, 4, 5, 6}.
  • Si: up-to-level of store i, i = {1, 2, 3, 4, 5, 6}.
  • k: number of stores (i.e., k = 6).
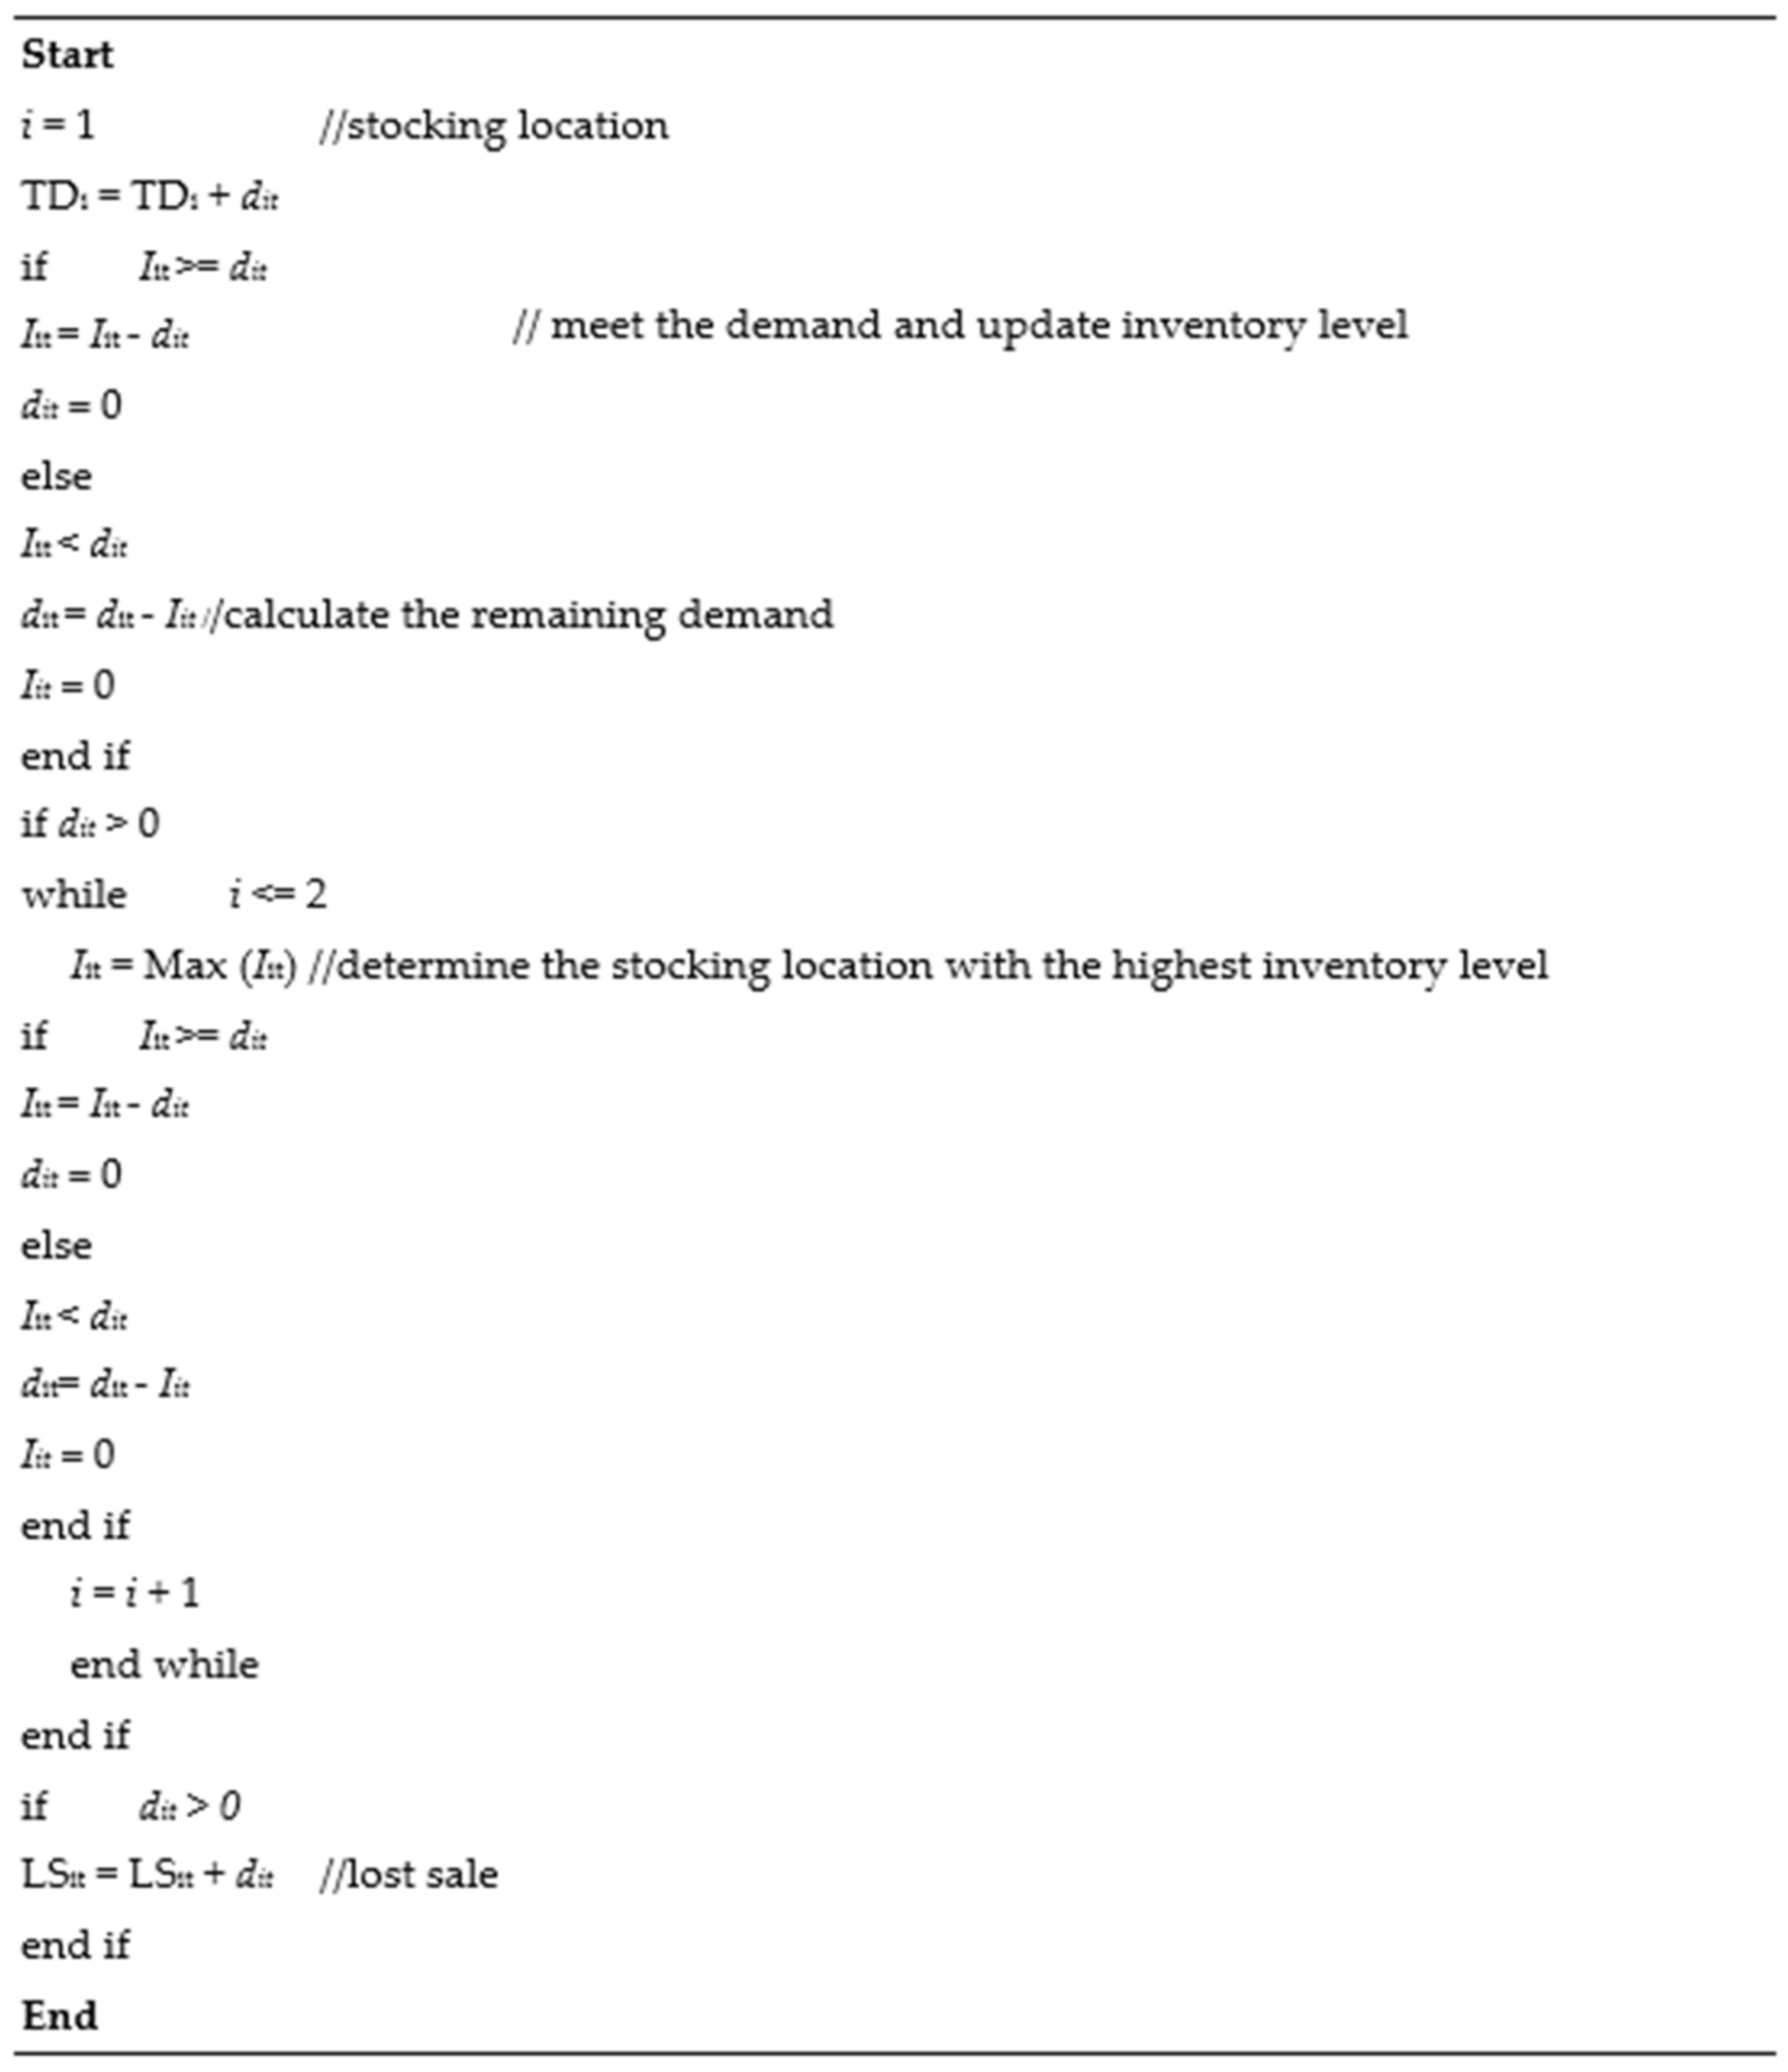
  • dit: amount of demand arrived at store i at time t, i = {1, 2, 3, 4, 5, 6}.
  • TDi: total demand for store i during simulation, i = {1, 2, 3, 4, 5, 6}.
  • CT: truck capacity for main depot (i.e., 100 products per truck).
  • Iit: current inventory level at store i, at time t.
  • LCji: inventory share cost per item from store j to i, ji, i = {1, 2, 3, 4, 5, 6}, j = {1, 2, 3, 4, 5, 6}.
  • Ljit: total product amount sent from store j to i by inventory share at time t.
  • LFji: total number of shipments based on inventory share takes place from store j for store i, during simulation, i = {1, 2, 3, 4, 5, 6}, j = {1, 2, 3, 4, 5, 6}.
  • CFL: fixed inventory share cost.
  • TC: fixed truck cost (i.e., $450/truck).
  • LSit: total amount of lost sale at store i at time t, i = {1, 2, 3, 4, 5, 6}.
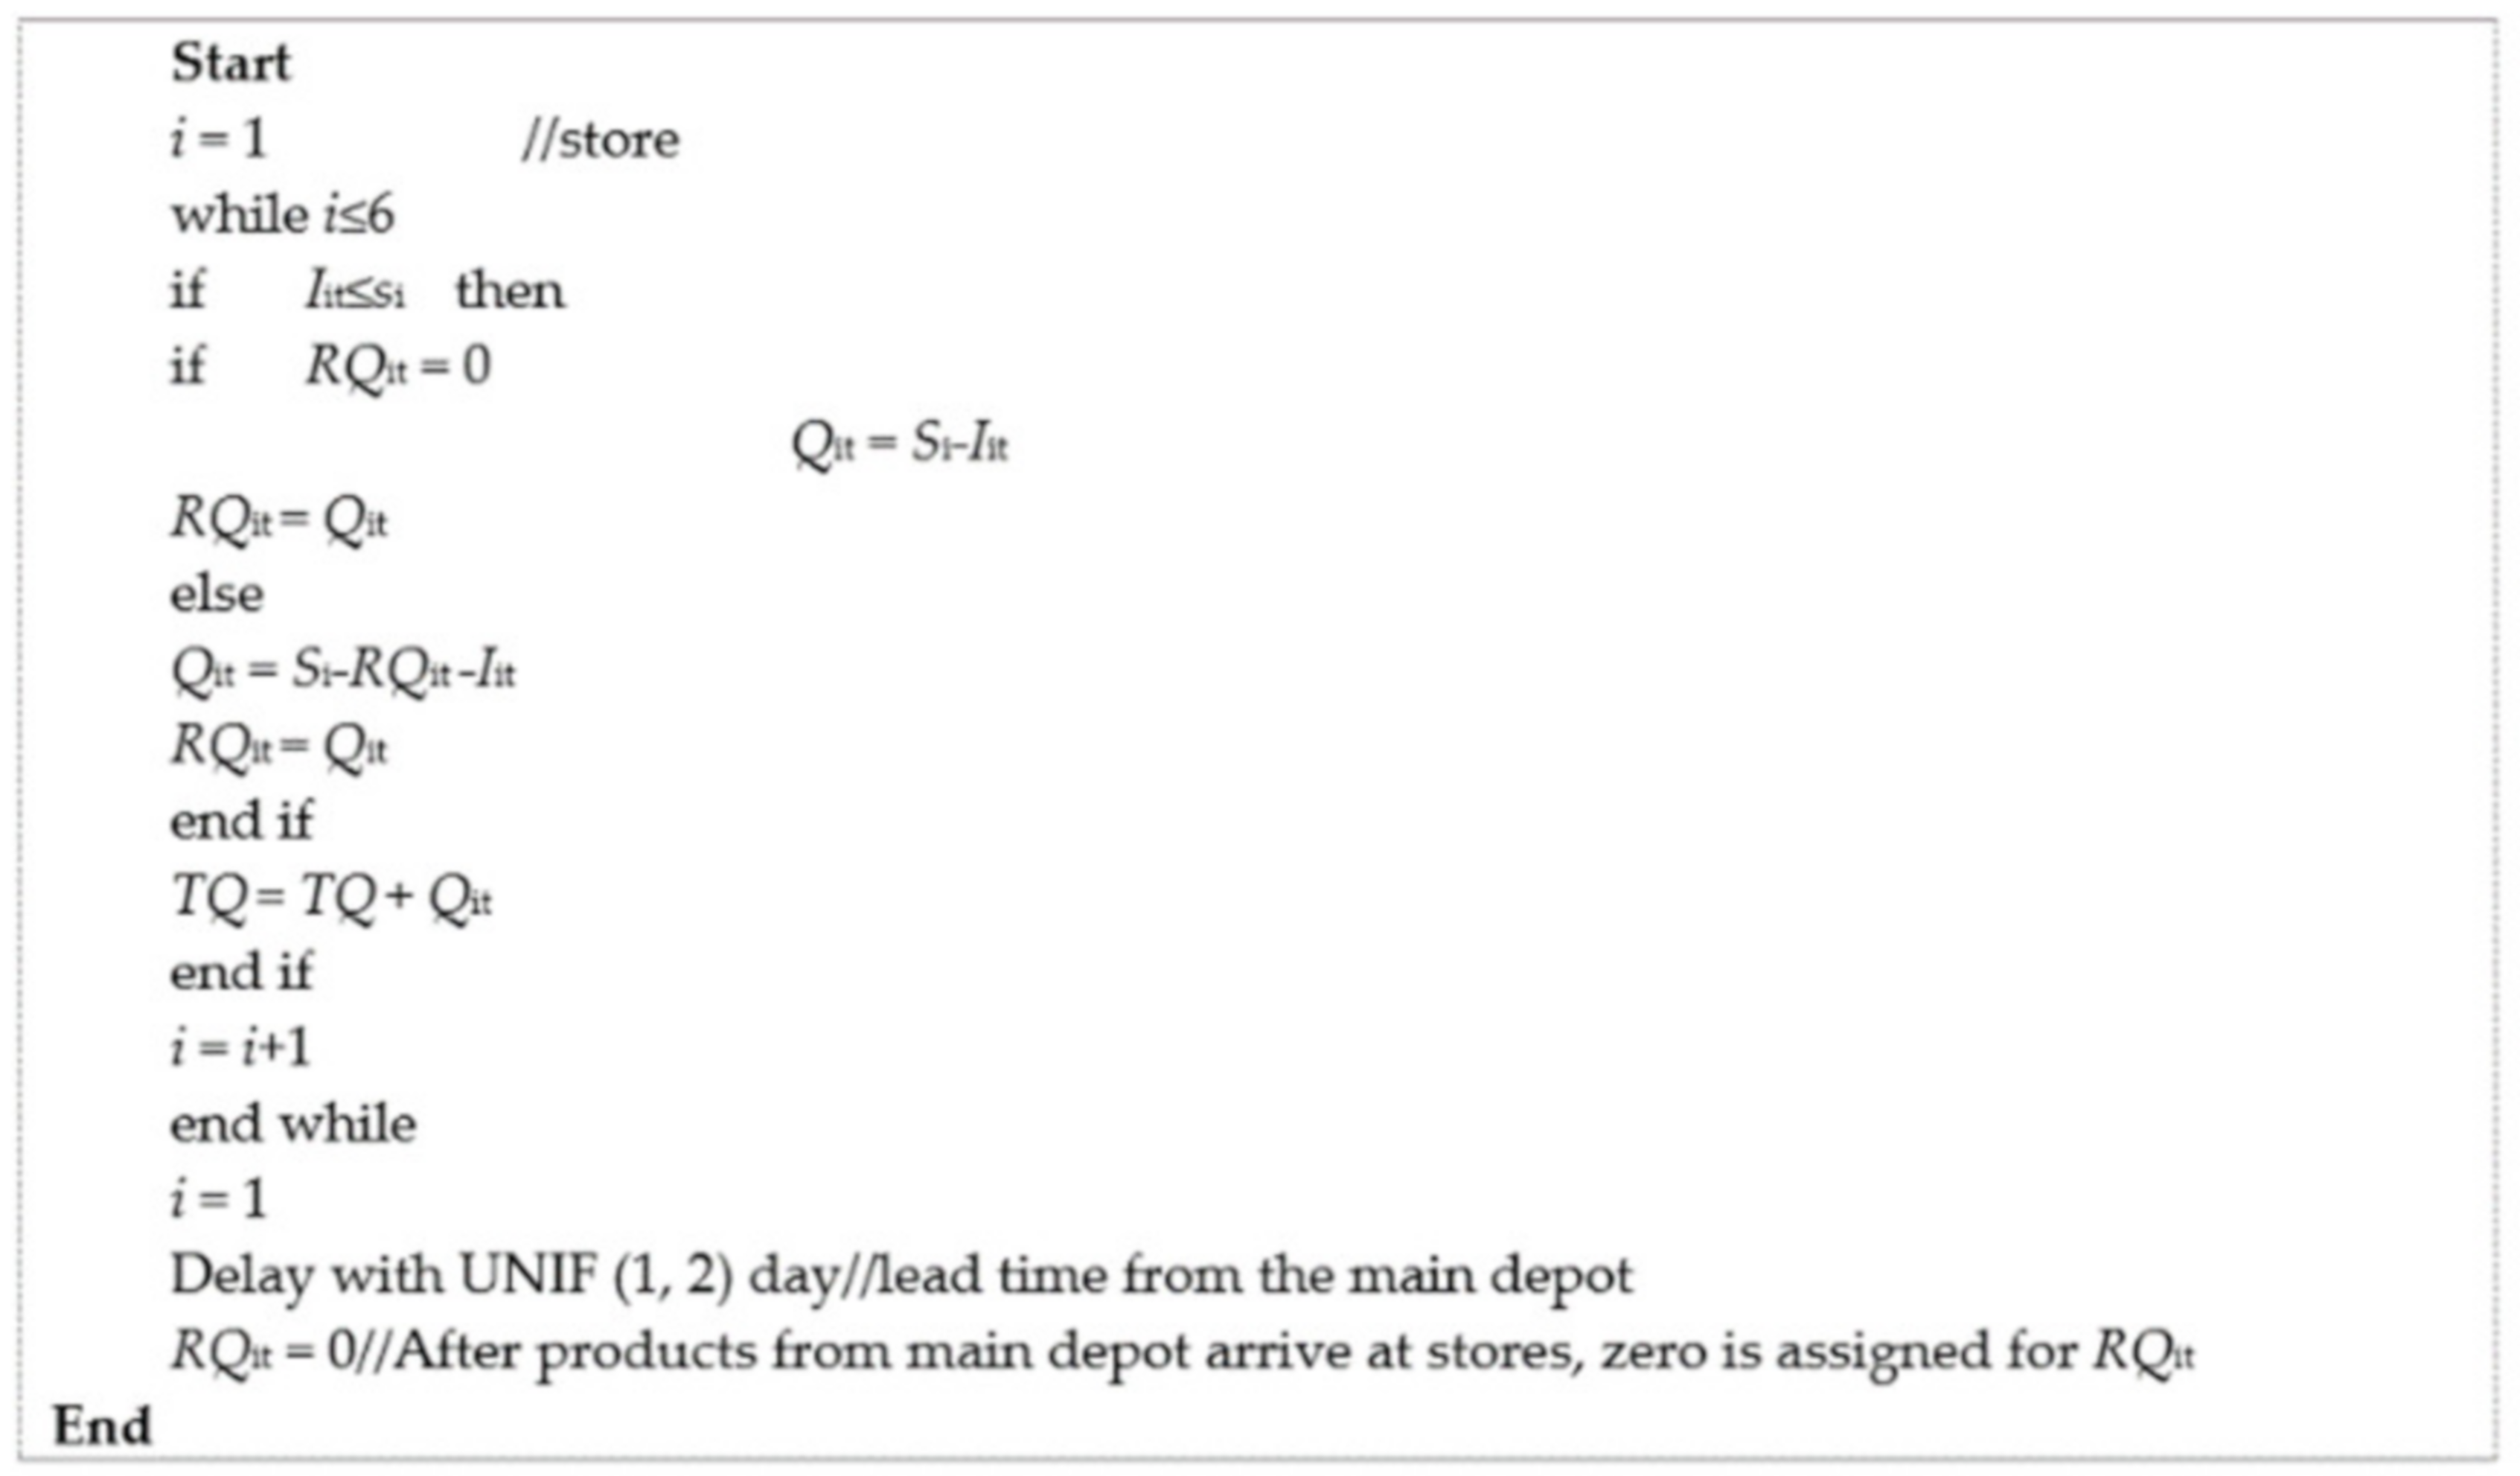
  • Qit: ordering amount of store i from main depot at time t, i = {1, 2, 3, 4, 5, 6}.
  • nit: number of trucks shipped from main depot to store i at day t, (nit is an integer value) i = {1, 2, 3, 4, 5, 6}.
  • TQ: total amount of products sent from main depot during the simulation run.
  • RQit: amount of products on road from main depot to the store i, i = {1, 2, 3, 4, 5, 6} at time t.
  • Co: ordering cost per item from main depot.
  • CLS: lost sale cost per item.
  • h: annual holding cost.
  • Rit: remaining demand amount that could not be met by store i, at time t.
  • rjt: ratio for store j at time t for inventory share amount calculation.
CLS is set to 10$/product. LCji is set to $1/item for inventory share between the stores of the same company (i.e., between online and offline stores of a specific company). Otherwise, if inventory share takes place between different companies, then it is assumed to be $1.5/product. CFL is set to $5 for each inventory share scenario. Co is considered to be $1/item. Inventory levels at stores are traced in real-time for replenishment of inventories. The order amount from the main depot, Qit, is computed by Equation (1):
Q i t = S i I i t   i f   I i t s i 0 ,     o t h e r w i s e .
Total network cost (TC) is calculated by Equation (2), where k is the total number of stores (i.e., k = 6) in the network and T is the simulation run length (i.e., 365 days):
T C =   t = 1 T i = 1 k j i k h + L S i t × C L S + Q i t × C O + n i t × T C + L j i t × L C j i   +   L F j i × C F L
The number of trucks sent from the main depot is calculated by (3) and rounded up to the next integer:
n it   =   Q i t / C T .
Figure 1 shows the pseudo codes for (s, S) inventory control policy applied in the simulation model.
As mentioned previously, we consider different inventory share policies and check their performance results based on the considered unit cost parameters. Details of those policies are explained in Section 3.4.

3.4. Inventory Share Policies

By applying inventory share policies to an omni-channel system, we aim to observe how average inventory holding levels, inventory share frequencies, order frequencies from the main depot, and environmental impacts are affected. We define six inventory share policies, also defining how companies are connected to each other in the network. Note that, there are three different companies in the system, each of which has its own offline and online stores separately. Hence, we define the inventory share policies based on online and offline stores separately. Specifically, we define two policies for online stores and three policies for offline stores. By the combination of each policy, a total of six scenarios are tested in the network. In addition to those, we also model the network where there is no inventory share policy in the system. Here, we aim to determine the most efficient policy in the studied omni-channel network as well as compare how the system efficiency is improved when an inventory share policy is considered in the network.

3.4.1. Inventory Share Policy 1 Considered for Online Stores

Figure 2 shows how stores in the studied omni-channel network are connected according to Policy 1. Dot and solid arrows show information and product flow, respectively. According to Figure 2, each online store is connected with its offline store. In other words, offline stores can share their inventories with their online stores. In addition, all online stores are connected with each other meaning that inventory share may take place in two ways. According to this policy, if an online store cannot meet its customer demand, first it checks its offline store’s inventory. It receives the required products from its offline store. However, if the remaining demand cannot be fully met by the offline store, then it starts searching for inventory share possibilities from other online stores. First, the online store having the highest amount of inventory shares its current inventory with the lacking ones. If still the remaining demand cannot be fully met, the following online store with the highest inventory level shares its current inventory until the remaining amount is met. After all inventory shares are completed, if there is still unmet demand, then that amount becomes a lost sale.
The steps of Policy 1 is summarized as follows: First, if incoming demand to an online store i can be fully met, then no inventory share takes place. Otherwise, the online store i first checks its offline store whether or not enough inventory exists. If it exists, then the offline store i sends the required amount from its store to its online store. If not exist, the offline store shares as many products as it has in its store with the online store. If the online store i’s remaining demand cannot be fully met by its offline store, then the remaining amount is aimed to be met by the stores in the order of having the highest stock level. If still it cannot be met, then the unmet amount is assumed to be lost sale. Total cost is calculated accordingly.
Figure 3 shows the pseudo-code for Policy 1.

3.4.2. Inventory Share Policy 2 Considered for Online Stores

In this policy, all assumptions are the same as in Policy 1. However, the only difference is that the online store j shares its inventory in an amount so that it does not drop less than its re-order point, sj.

3.4.3. Inventory Share Policy 3 Considered for Online Stores

In this policy, the network connection is the same as in Policy 1. However, inventory share between online stores is done according to some pre-defined ratios calculated on their current inventory levels. For instance, when there is Rit amount of remaining demand that is not met at an online store i at time t, inventory share amounts from the other online stores at time t, Ljit, are calculated by Equations (4) and (5), respectively:
r j t   =   I j t j I j t ,   j i ,
L j i t   =   r j t × I j t .
Equation (4) calculates a ratio according to the existing level of inventories. Equation (5) calculates at most what level of inventory can be shared by the online stores. If there is still remaining demand that could not be met after inventory share, that amount is assumed to be a lost sale in the network.

3.4.4. Inventory Share Policy 4 Considered for Offline Stores

In this policy, we consider sharing policy for offline stores. Namely, when the offline store’s demand cannot be fully met then, we propose a policy on how that remaining demand is met by the others (i.e., online) stores. Figure 4 shows the considered policy. According to that, the offline company’s own online store can share its inventory with its offline store.
All the steps considered in Policy 4 are as follows: First, demand arrives at an offline store i. If all demand cannot be met by that offline store, the inventory level of that company’s online store is checked. If there is enough amount of product, with 75% probability, the offline customer accepts to meet its demand from the online store. Otherwise, the remaining demand becomes a lost sale. If there is not enough amount of inventory, then with 75% probability, the offline customer accepts to meet its some amount from the online store’s existing inventory. The unmet amount becomes a lost sale.

3.4.5. Inventory Share Policy 5 Considered for Offline Stores

Figure 5 shows the considered policy. In this policy, offline stores are connected to all online stores in the network. Here, if the offline store’s demand cannot be fully met, again with 75% probability, it starts receiving the remaining demand from the online stores.
The details of the steps for Policy 5 are as follows:
Step 1:
Demand arrives at an offline store i. If demand cannot be fully met by that store,
Step 2:
With 75% probability, it tends to meet the lacking amount from online stores in this order:
Step 3:
The online stores are checked in the order of having the highest inventory levels. The online store having the highest inventory level starts sending its inventory until the remaining demand is met.
Step 4:
The last remaining amount becomes a lost sale.

3.4.6. Policy 6 for No Inventory Share

There is no inventory share under this policy. The unmet demand becomes a lost sale.

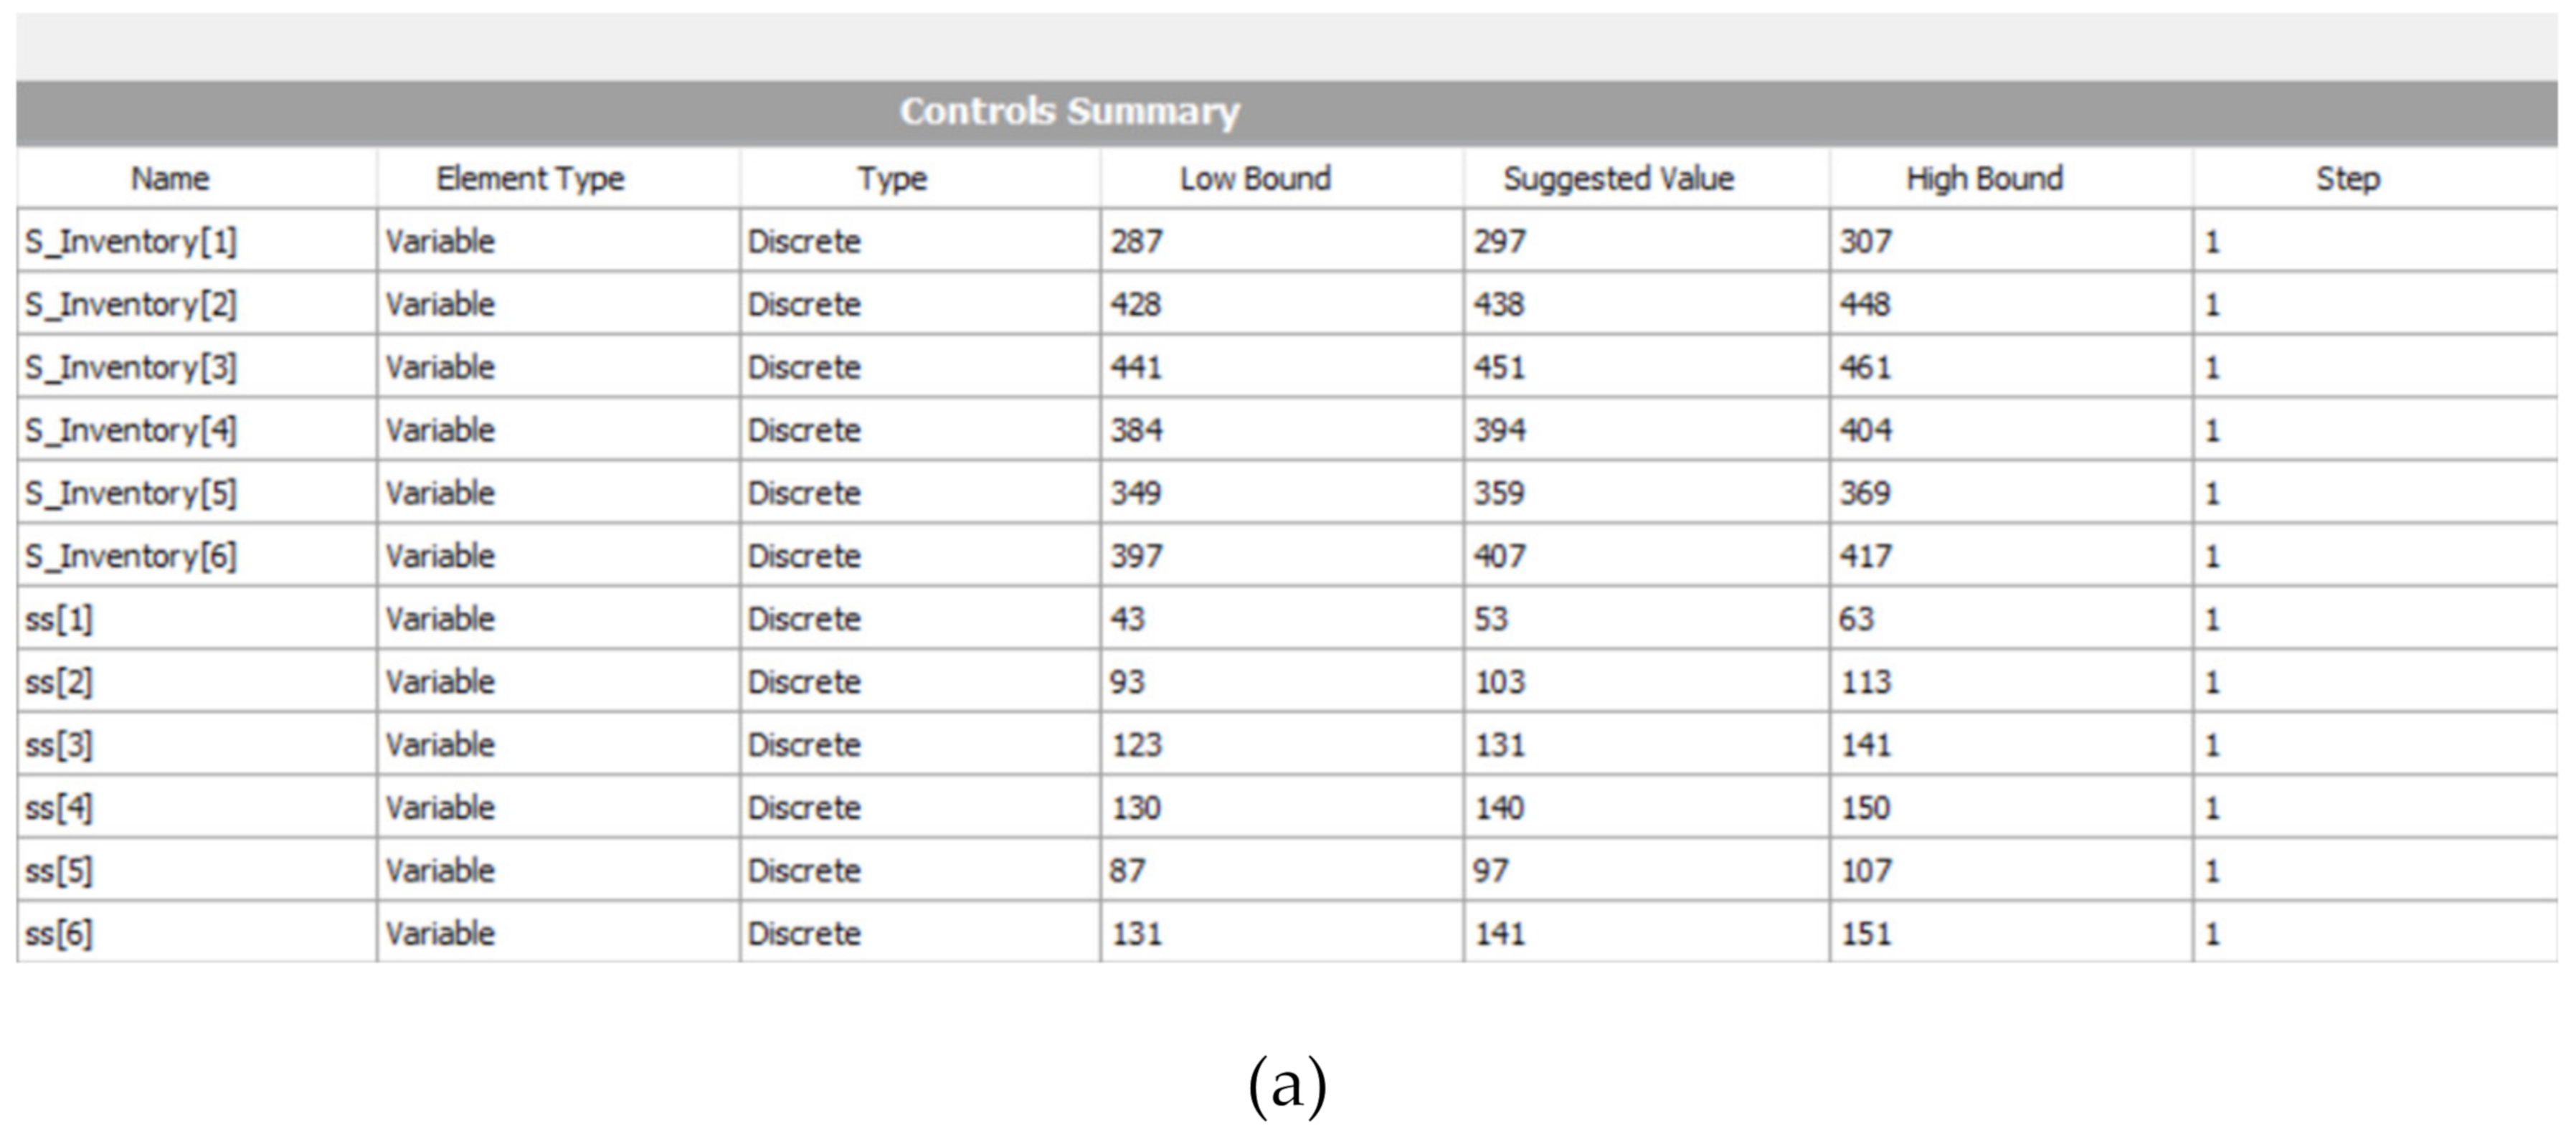
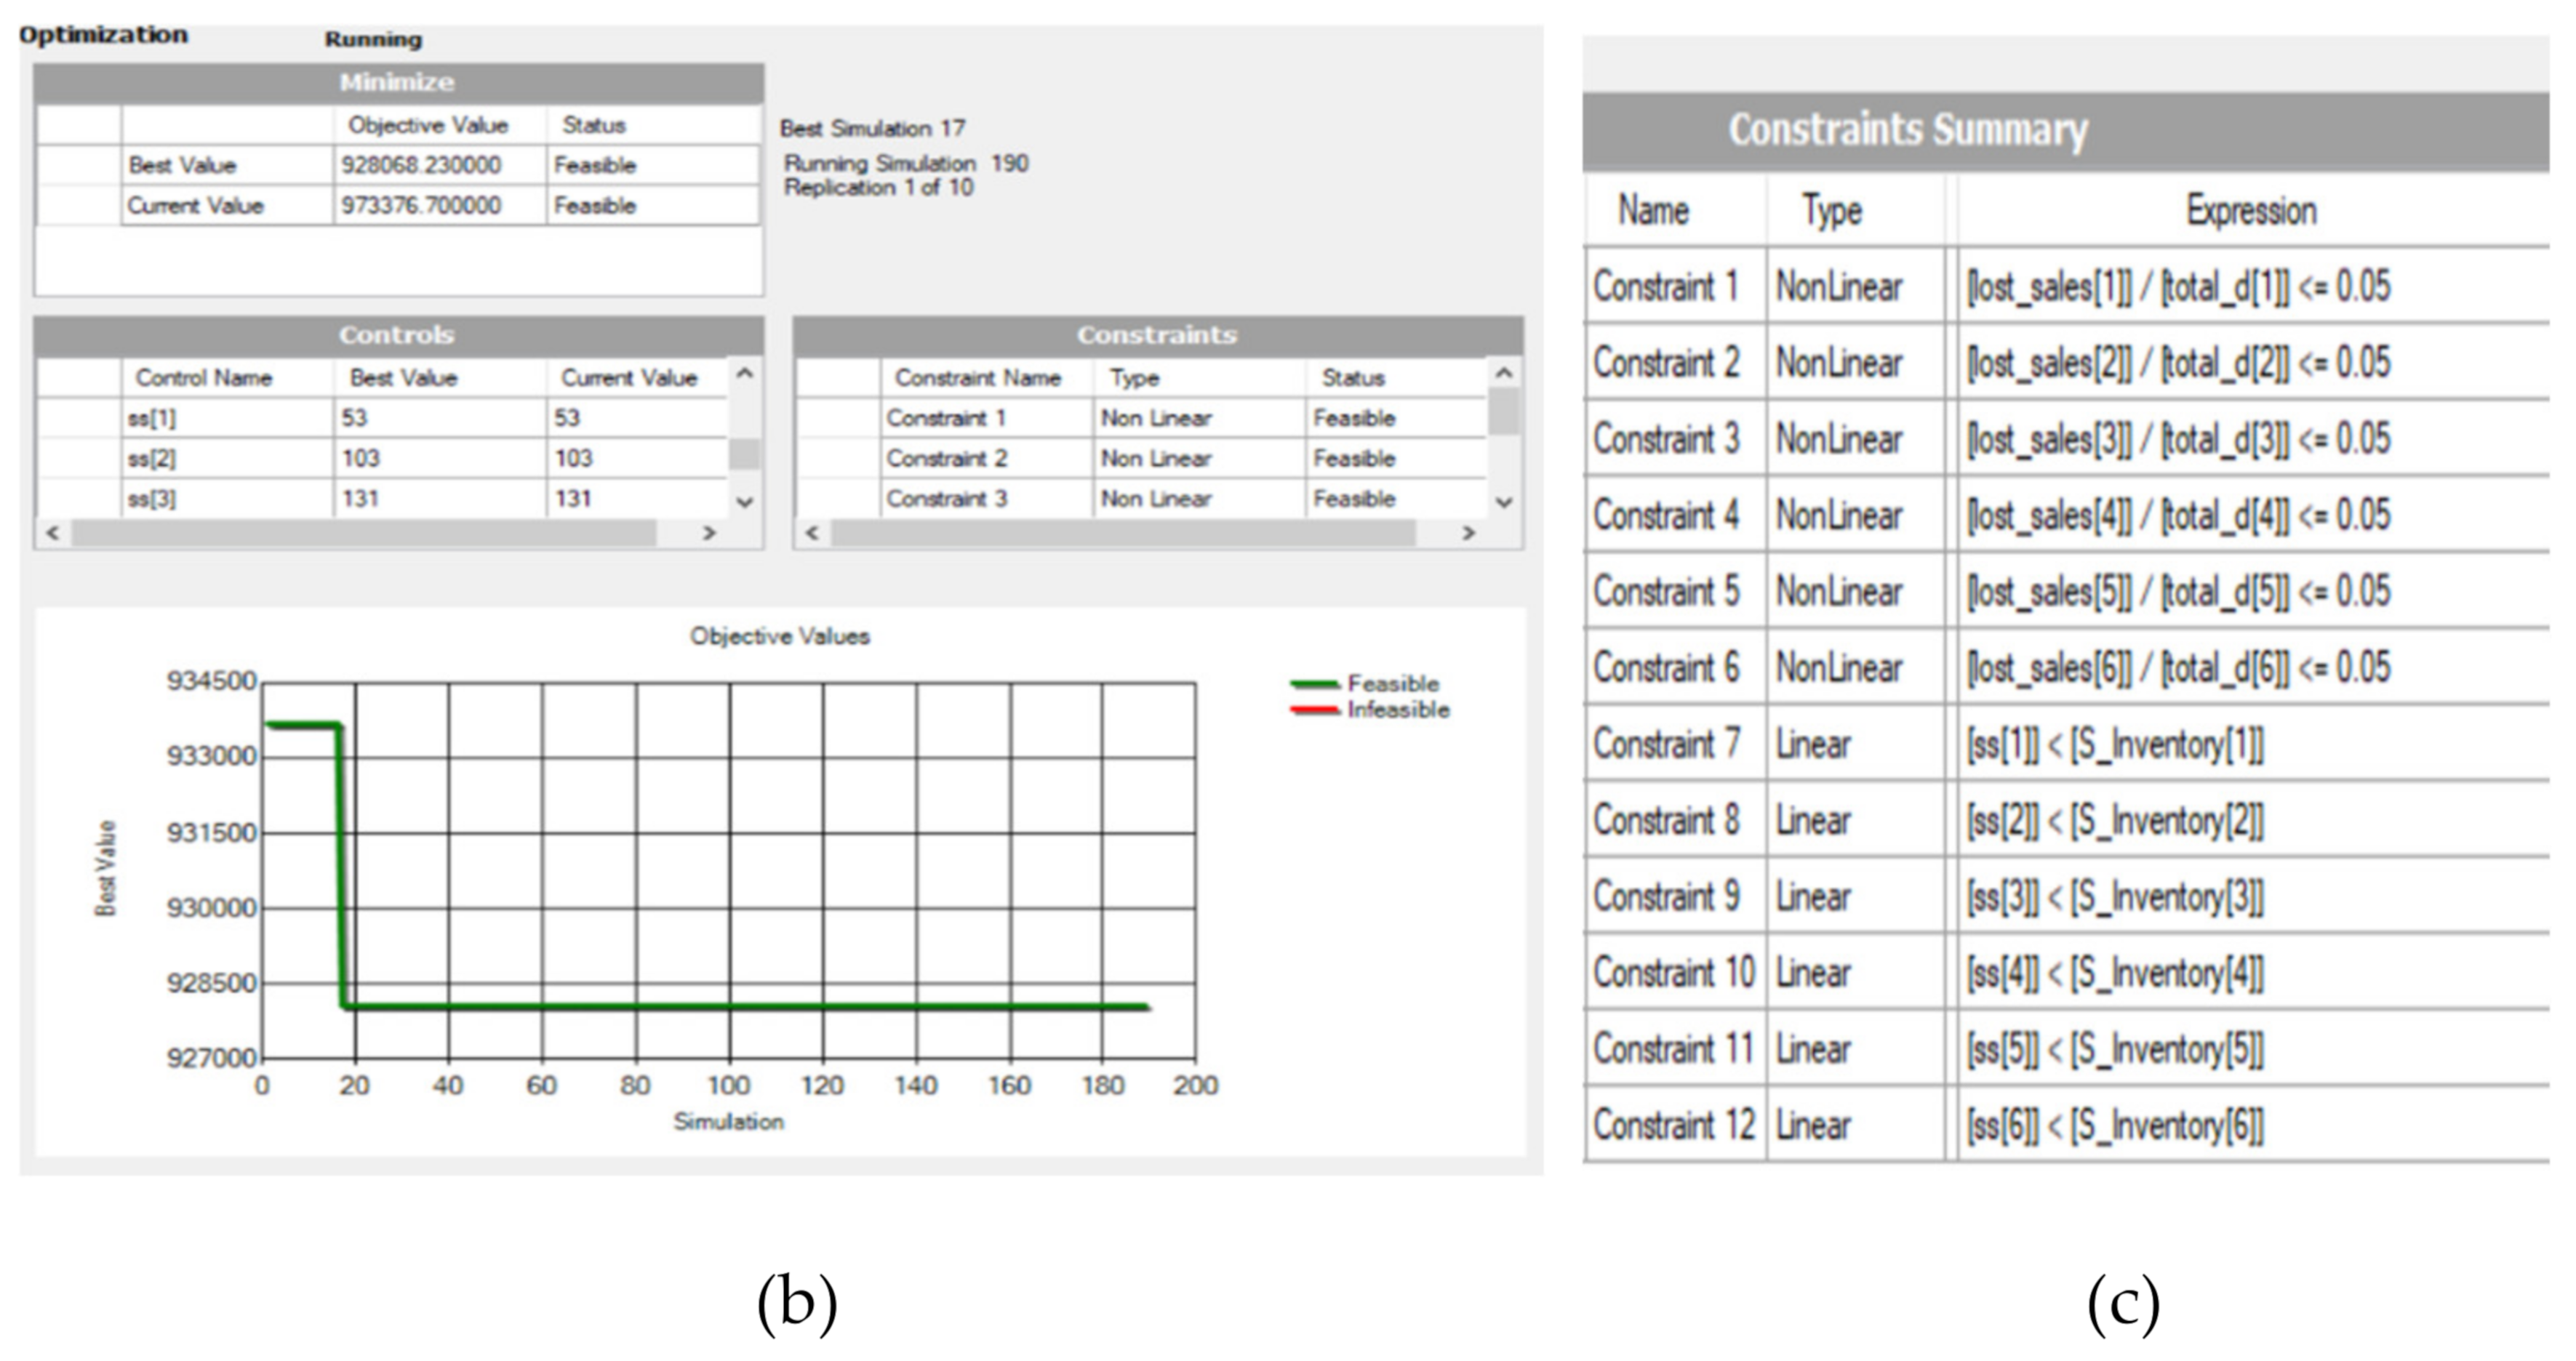
3.5. Simulation Modeling

We simulate each scenario, by considering the combination of those five inventory share policies. Hence, we test six combinations plus no inventory share policy. Namely, we run the simulation models for seven scenarios in total. We utilize the Arena 16.0 commercial software for the modeling purpose. We optimize the (s, S) levels under each scenario by using the OptQuest optimization tool in that simulation software. The OptQuest optimization tool combines the meta-heuristics of neural networks, tabu search, and scatter search into a single search heuristic [39].
As mentioned, we run seven different scenarios and compare their performance results in terms of total network cost under the optimized results. The aim is to select the best design providing minimum cost in the omni-channel system. The OptQuest results are shown in Section 4.

4. Results

Remember that Policies 1–3 represent inventory share policies for online stores, while Policies 4,5 show the policies for offline store policies. Hence, for instance, Policy 1 and 5 represents the combination of Policy 1 for online stores and Policy 5 for offline stores. Figure 5 shows a screenshot from the OptQuest run for Policy 1 and 5. Once again, the decision variables to be optimized are the reorder and up-to inventory levels (s, S) for each store. Since there are six stores in the network, twelve (2 × 2 × 3) decision variables are determined in the optimization procedure. We consider a constraint as the customer service level (CSL) to be at least 95%. Namely, it ensures at least 95% customer satisfaction based on met demand. Equations (6)–(8) show the optimization model considered in OptQuest tool:
Min TC,
CSLi ≥ 0.95, Ɐi,
si < Si, Ɐi.
Figure 6 shows an OptQuest snapshot from Policy 1 and 5 runs. Figure 6a–c illustrate different visuals provided by that tool. Table 1 shows the si, Si results obtained by OptQuest. The optimum total cost found by the optimal si, Si levels as well as other cost related outputs are summarized in Table 2.
Table 3 shows several outputs from the system at the optimal results. Here, we also would like to observe how different outputs behave based on the optimal results.

5. Discussion

From OptQuest results, it is observed that the highest network cost is obtained when there is no inventory share policy in the network. Hence, considering any inventory share works better in terms of total network cost. In addition, the total number of trucks sent from the main depot is decreased when an inventory share policy is considered. For instance, in this case, the worst result is obtained when there is no inventory sharing in the network. Thanks to inventory sharing applications that the frequency of trucks sent from the main depot is decreased. Thus, we assume that this contributes to the reduction of CO2 emission due to decreased truck travels from the main depot. The other comments on the results are summarized below:
  • From Table 2 and Table 3, it is observed that total cost tends to decrease when inventory share is allowed more in the network. For instance, the Policy 1 and 5 combination provides the least total cost one. In that scenario, total inventory share cost is the highest one. Hence, we may focus on developing scenarios where more inventory share takes place.
  • When inventory share happens more, the ordering frequency from the main depot decreases as expected. This contributes to a sustainable network design by the decreased truck travels from the main depot.
  • From Table 2, it is observed that the combination of Policy 1 and 5 produces the best result in terms of the total cost.
  • From the result tables, it is also observed that there is a negative correlation between inventory share and a lost sale. When inventory share cost increases, lost sale cost tends to decrease.
  • As inventory share increases, total transportation cost and holding cost also tend to decrease in all policies.
  • There is also a negative correlation between the total amount of inventory share and the total number of trucks sent from the main depot. This situation not only affects the cost but also gains importance in terms of decreasing CO2 released by trucks. By inventory sharing, companies can fulfil their environmental responsibilities by reducing CO2 emissions, while meeting customer demand rapidly and ensuring customer sustainability.
  • When there is no inventory share in the system, ordering from the main depot increases drastically compared to any other scenarios.
  • (s, S) levels tend to increase when there is no inventory share in the network. This also leads to increased holding cost in the system.
Compared to previous studies, we provide significant contributions by studying different inventory share policies for the omni-chanel network to increase cost-effectiveness and sustainability in the network. For instance, a combination of the developed Policies 1 and 5 provides significant improvements in the network compared to a non-shared policy.

6. Conclusions

In this paper, we study inventory share policies in an omni-channel network where there are three companies having both online and offline stores. Inventory share is implemented between stores to reduce total network cost, CO2 emission, and increase customer sustainability. Technological developments and increasing interest in e-commerce have forced companies to make innovations in this direction. Customers’ demand for fast and uninterrupted shopping requires the integration of channels since the borders in online and offline stores are removed. In this work, we consider that the stores in the network are connected so that they can share their inventories to decrease the whole network cost and increase the sustainability in the network.
We propose six omni-channel network designs in terms of connectivity and inventory share scenarios. We also study a network design with no inventory share policy in the system. Our simulation optimization results suggest that the combination of Policy 1 and 5 as the best result in terms of the total cost. When we compare the models with the model with no inventory share policy, we observe that the total network cost decreases when there is any inventory share policy in the system. The findings in our study show that inventory sharing applications work well in terms of the total cost, customer satisfaction, and CO2 emission and sustainability. In other words, the implementation of inventory share can provide a more efficient, sustainable, and green supply chain system.
Our findings are also valuable for practitioners who intend to increase cost-effectiveness and sustainability in the network by adopting different inventory share policies. However, as is the case with any study, the present work also has limitations in itself due to some pre-defined assumptions related to the network design. Hence, more novel sharing policies, as well as different demand distribution and network designs could be investigated in future works.

Author Contributions

Conceptualization, B.Y.E.; Methodology, B.Y.E. and D.İ.; Software, D.İ.; Validation, B.Y.E. and D.İ.; Formal Analysis, B.Y.E. and V.K.; Investigation, D.İ., B.Y.E. and V.K.; Resources, B.Y.E. and V.K.; Data Curation, B.Y.E. and D.İ.; Writing—Original Draft Preparation, D.İ., B.Y.E., and V.K.; Writing—Review & Editing, B.Y.E. and V.K.; Visualization, D.İ.; Supervision, B.Y.E. and V.K.; Project Administration, B.Y.E. and V.K.; Funding Acquisition, B.Y.E. and V.K. All authors have read and agreed to the published version of the manuscript.

Funding

This research was partially funded by Newton Katip Celebi, TUBITAK and Royal Academy of Engineering (Industry-Academia Partnership Programme 2018/2019), grant number 4180046. And The APC was funded by authors.

Conflicts of Interest

Authors declare no conflict of interest.

References

  1. Hoppner, J.; Griffith, D. Looking Back to Move Forward: A Review Of The Evolution Of Research in International Marketing Channels. J. Retail. 2015, 91, 610–626. [Google Scholar] [CrossRef]
  2. Brynjolfsson, E.; Jeffrey, Y.; Rahman, M. Competing in the Age of Omni-Channel Retailing. MIT Sloan Manag. Rev. 2013, 54, 23–29. [Google Scholar]
  3. Rangaswamy, A.; Van Bruggen, G. Opportunities and Challenges in Multichannel Marketing: An Introduction to the Special Issue. J. Interact. Mark. 2005, 19, 5–11. [Google Scholar] [CrossRef] [Green Version]
  4. Rigby, D. The Future of Shopping. Harv. Bus. Rev. 2011, 89, 65–76. [Google Scholar]
  5. Piotrowicz, W.; Cuthbertson, R. Introduction to the Special Issue Information Technology in Retail: Toward Omnichannel Retailing. Int. J. Electron. Commer. 2014, 18, 5–16. [Google Scholar] [CrossRef]
  6. Zhang, J.; Farris, P.; Irvin, J.; Kushwaha, T.; Steenburgh, T.; Weitz, B. Crafting Integrated Multichannel Retailing Strategies. J. Interact. Mark. 2010, 24, 168–180. [Google Scholar] [CrossRef]
  7. Shen, X.; Li, Y.; Sun, Y.; Wang, N. Channel Integration Quality, Perceived Fluency and Omnichannel Service Usage: The Moderating Roles of Internal and External Usage Experience. Decis. Support Syst. 2018, 109, 61–73. [Google Scholar] [CrossRef]
  8. Melero, I.; Sese, F.; Verhoef, P. Recasting the Customer Experience in Today’s Omni-Channel Environment. Universia Bus. Rev. 2016, 50, 18–37. [Google Scholar] [CrossRef]
  9. Cao, L.; Li, L. The Impact of Cross-Channel Integration on Retailers’ Sales Growth. J. Retail. 2015, 91, 198–216. [Google Scholar] [CrossRef]
  10. Wisner, J. A Structural equation model of supply chain management strategies and firm performance. J. Bus. Logist. 2003, 24, 1–26. [Google Scholar] [CrossRef]
  11. Mangal, D.; Chandna, P. Inventory Control in Supply Chain through Lateral Transhipment—A Case Study in Indian Industry. Int. J. Eng. Sci. 2009, 3, 443–457. [Google Scholar]
  12. Belgasmi, N.; Saïd, L.B.; Ghédira, K. Evolutionary Multiobjective Optimization Of The Multi-Location Transshipment Problem. Oper. Res. 2008, 8, 167–183. [Google Scholar] [CrossRef] [Green Version]
  13. Burton, S.; Soboleva, A. Interactive or Reactive? Marketing With Twitter. J. Consum. Mark. 2011, 28, 491–499. [Google Scholar] [CrossRef]
  14. Kotler, P.; Keller, K.L.; Goodman, M.; Brady, M.; Hansen, T. Marketing Management, 3rd ed.; Pearson Education Limited: Harlow, UK, 2016; ISBN 9781292142357. [Google Scholar]
  15. Lazaris, C.; Vrechopoulos, A. From Multichannel to “Omnichannel” Retailing: Review of the Literature and Calls for Research. In Proceedings of the 2nd International Conference on Contemporary Marketing Issues, Athens, Greece, 18–20 June 2014. [Google Scholar]
  16. Rodríguez-Torrico, P.; Cabezudo, R.S.J.; San-Martín, S. Tell Me What They Are Like And I Will Tell You Where They Buy. An Analysis of Omnichannel Consumer Behavior. Comput. Hum. Behav. 2017, 68, 465–471. [Google Scholar] [CrossRef] [Green Version]
  17. Xing, Y.; Grant, D.; McKinnon, A.; Fernie, J. Physical Distribution Service Quality in Online Retailing. Int. J. Phys. Distrib. Logist. Manag. 2010, 40, 415–432. [Google Scholar] [CrossRef]
  18. Janka, P. Embedded Plugins and Mobile Apps for Ecommerce. Available online: https://blog.monkeydata.com/6-benefits-of-choosing-an-omnichannel-strategy-e8a019506857 (accessed on 9 October 2020).
  19. Juaneda-Ayensa, E.; Mosquera, A.; Murillo, Y.S. Omnichannel Customer Behavior: Key Drivers of Technology Acceptance and Use and Their Effects on Purchase Intention. Front. Psychol. 2016, 7, 1117. [Google Scholar] [CrossRef] [Green Version]
  20. Hübner, A.; Holzapfel, A.; Kuhn, H. Distribution Systems in Omni-Channel Retailing. Bus. Res. 2016, 9, 255–296. [Google Scholar] [CrossRef] [Green Version]
  21. Ishfaq, R.; Defee, C.; Gibson, B.; Raja, U. Realignment of the Physical Distribution Process in Omni-Channel Fulfillment. Int. J. Phys. Distrib. Logist. Manag. 2016, 46, 543–561. [Google Scholar] [CrossRef]
  22. Maltz, A.B.; Sinha, R.; Rabinovich, E. Logistics: The key to e-retail success. Supply Chain Manag. Rev. 2004, 8, 48–54. [Google Scholar]
  23. Lee, H. A Multi-Echelon Inventory Model For Repairable Items With Emergency Lateral Transshipments. Manag. Sci. 1987, 33, 1302–1316. [Google Scholar] [CrossRef]
  24. Cohen, M.; Lee, H. Out of touch with customer needs? Spare parts and after sales service. Sloan Manag. Rev. 1990, 31, 55–66. [Google Scholar]
  25. Lau, H.; Chan, T.; Tsui, W.; Ho, G. Cost Optimization Of The Supply Chain Network Using Genetic Algorithms—Withdrawn. IEEE Trans. Knowl. Data. Eng. 2009, 1–36. [Google Scholar] [CrossRef]
  26. Van Wijk, A.; Adan, I.; van Houtum, G. Optimal Lateral Transshipment Policies for a Two Location Inventory Problem with Multiple Demand Classes. Eur. J. Oper. Res. 2019, 272, 481–495. [Google Scholar] [CrossRef]
  27. Alvarez, E.; van der Heijden, M.; Vliegen, I.; Zijm, W. Service Differentiation through Selective Lateral Transshipments. Eur. J. Oper. Res. 2014, 237, 824–835. [Google Scholar] [CrossRef] [Green Version]
  28. Paterson, C.; Kiesmüller, G.; Teunter, R.; Glazebrook, K. Inventory Models with Lateral Transshipments: A Review. Eur. J. Oper. Res. 2011, 210, 125–136. [Google Scholar] [CrossRef] [Green Version]
  29. Banerjee, A.; Burton, J.; Banerjee, S. A Simulation Study of Lateral Shipments in Single Supplier, Multiple Buyers Supply Chain Networks. Int. J. Prod. Econ. 2003, 81–82, 103–114. [Google Scholar] [CrossRef]
  30. Amiri-Aref, M.; Klibi, W.; Babai, M. The Multi-Sourcing Location Inventory Problem with Stochastic Demand. Eur. J. Oper. Res. 2018, 266, 72–87. [Google Scholar] [CrossRef]
  31. Ekren, B.Y.; Ornek, M. Determining Optimum (s, S) Levels Of Floor Stock Items In A Paint Production Environment. Simul. Model. Pract. Theory 2015, 57, 133–141. [Google Scholar] [CrossRef]
  32. Ekren, B.Y.; Ornek, M.A. Simulation-Based Inventory Control in a Chemical Industry. In Industrial Engineering Applications in Emerging Countries, 1st ed.; Sabuncuoglu, I., Kara, B.Y., Bidanda, B., Eds.; CRC Press: Boca Raton, FL, USA, 2015; ISBN 978-1-4822-2689-8. [Google Scholar]
  33. Ekren, B.Y.; Arslan, B. Simulation-Based Lateral Transshipment Policy Optimization for S, S Inventory Control Problem in A Single-Echelon Supply Chain Network. Int. J. Optim. Control: Theor. Appl. (IJOCTA) 2019, 10, 9–16. [Google Scholar] [CrossRef] [Green Version]
  34. Hammami, R.; Nouira, I.; Frein, Y. Carbon Emissions In A Multi-Echelon Production-Inventory Model With Lead Time Constraints. Int. J. Prod. Econ. 2015, 164, 292–307. [Google Scholar] [CrossRef]
  35. Manupati, V.; Jedidah, S.; Gupta, S.; Bhandari, A.; Ramkumar, M. Optimization Of A Multi-Echelon Sustainable Production-Distribution Supply Chain System With Lead Time Consideration Under Carbon Emission Policies. Comput. Ind. Eng. 2019, 135, 1312–1323. [Google Scholar] [CrossRef]
  36. Wang, M.; Ouyang, J.; Zhao, L. Production Planning With Transshipment in A Global Supply Chain Under Different Carbon Trading Mechanisms. Oper. Res. 2019. [Google Scholar] [CrossRef]
  37. Visconti, R.M.; Morea, D. Healthcare Digitalization and Pay-For-Performance Incentives in Smart Hospital Project Financing. Int. J. Environ. Res. Public Health 2020, 17, 2318. [Google Scholar] [CrossRef] [PubMed] [Green Version]
  38. Visconti, R.M.; Morea, D. Big Data for the Sustainability of Healthcare Project Financing. Sustainability 2019, 11, 3748. [Google Scholar] [CrossRef] [Green Version]
  39. Kleijnen, J.; Wan, J. Optimization of Simulated Systems: Optquest and Alternatives. Simul. Model. Pract. Theory 2007, 15, 354–362. [Google Scholar] [CrossRef]
Figure 1. Pseudo codes of the (s, S) inventory policy implemented for the replenishment process (Source: Authors).
Sustainability 12 10022 g001
Figure 2. Policy 1 for online stores (Source: Authors).
Sustainability 12 10022 g002
Figure 3. Pseudo-code for Policy 1 (Source: Authors).
Sustainability 12 10022 g003
Figure 4. Policy 4 for offline stores (Source: Authors).
Sustainability 12 10022 g004
Figure 5. Policy 5 for offline stores (Source: Authors).
Sustainability 12 10022 g005
Figure 6. OptQuest screenshots for Policy 1 and 5: (a) control part of the (s, S) values; (b) Visualized (s, S) values of Policy 1 and 5 OptQuest; (c) Part to which the specified constraints are added to OptQuest.
Sustainability 12 10022 g006aSustainability 12 10022 g006b
Table 1. si, Si values obtained by OptQuest.
Online Store 1Online Store 2Online Store 3Offline Store 1Offline Store 2Offline Store 3
Policys1, S1s2, S2s3, S3S4, S4S5, S5S6, S6
1&4(125, 394)(95, 354)(171, 464)(188, 411)(85, 323)(193, 448)
2&4(140, 453)(135, 419)(189, 519)(169, 308)(159, 292)(179, 346)
3&4(153, 479)(112, 395)(188, 503)(155, 371)(128, 367)(198, 439)
1&5(53, 297)(103, 438)(131, 451)(140, 394)(97, 359)(141, 407)
2&5(111, 450)(70, 420)(105, 500)(200, 346)(117, 350)(120, 368)
3&5(160, 397)(110, 300)(186, 499)(141, 406)(103, 360)(170, 430)
6(278, 399)(248, 318)(347, 522)(191, 299)(199, 250)(200, 346)
Note that Table 2 summarizes the total cost and other costs based on the optimal values of (si, Si).
Table 2. Cost results of the policies.
Policy Total Lost Sale ($)Total Holding ($)Total Transportation ($)Total Inventory Share ($)Total Ordering ($)Total ($)
1&412,366152,060589,01016,023171,310940,769
2&415,200154,710601,56012,058172,000955,528
3&416,570153,310593,73014,115172,840950,565
1&511,368148,820573,39023,770170,720928,068
2&513,187151,110583,65020,293171,880940,120
3&510,954152,200589,14014,419171,870938,583
640,819164,790654,8900169,0901,029,589
Table 3. Several outputs from the system at optimal levels.
PolicyTotal Number of Inventory Share CompletedTotal Amount of Products by Inventory Share Total Number of Orders Given to the Main DepotTotal Number of Trucks Sent From the Main Depot
1&4309.5014,680423.701308.9
2&4226.5010,349483.601336.8
3&4273.2012,577407.701319.4
1&5421.3020,330402.001274.2
2&5357.9016,529391.901297.0
3&5293.3012,269432.601309.2
600822.201455.3
The results are discussed in Section 5.
Publisher’s Note: MDPI stays neutral with regard to jurisdictional claims in published maps and institutional affiliations.

