Abstract
Road transport plays an important role in economic development, trade and social integration. However, it is also responsible for certain negative impacts on environment and society. In order to achieve sustainable development, there is a growing need for a country to assess both the benefits from road transport and its undesirable costs, to compare them with those in other countries and to provide estimates of their future developments. In this research, starting from the identification of relevant factors (both desirable and undesirable), a benchmarking approach is proposed as an alternative way to assess sustainable road transport among the 28 EU countries. Meanwhile, the basic concept of data envelopment analysis (DEA) for benchmarking purpose is further extended to integrate both the desirable achievements and the undesirable costs in evaluation. As a result, an overall road transport sustainability score is computed for the 28 EU countries, which can be further split into two efficiency scores with respect to desirable and undesirable factors, respectively. Furthermore, after applying a clustering analysis that groups countries with inherent similarity in their practices, the model is adopted to identify best-performing and underperforming countries within the cluster, as well as the reference sets for those underperforming ones, based on which valuable insights are gained, enabling decision makers to prioritize their actions towards a more sustainable road transport system in the future.
1. Introduction
Sustainable transport is a major global challenge facing the whole world. In 2016, the United Nations released the first global sustainable transport outlook report, pointing out that about 1 billion people around the world still lack adequate access to roads, and countries are still a long way from achieving sustainable transport. In the European Union (EU), road transport plays an important role in economic development, trade and social integration. Due to easy accessibility, flexibility of operations and door-to-door service, road transport has emerged as the dominant segment in Europe’s transport sector, representing roughly 81% of all passenger transport and 49% of freight transport [1]. However, it is also responsible for certain negative impacts on sustainable development, accounting for 82% of the annual transport energy consumption, 72% of the total transport greenhouse gas (GHG) emissions and over 100 times more deaths than all other transportation modes together [1]. As a result, in the midterm review of the European Commission’s 2001 transport white paper, the EU renewed the definition of its future transport policy direction: “Although mobility is essential to Europe’s prosperity and to the freedom of movement of its citizens, the negative effects of mobility, i.e., energy consumption and impacts on health and the environment, must be reduced” [2].
In order to achieve sustainable development, there is a growing need for a country to assess both the benefits from road transport and its undesirable costs. In recent decades, numerous studies have been carried out within the road transport sector and a large body of practical knowledge has been built up helping policy makers understand the challenges towards road transport sustainability [3,4,5,6,7]. However, most of these studies focused mainly on separate performance measures while limited attention has been given to overall road transport sustainability evaluation. One possible reason lies in the difficulty of obtaining theoretically correct and empirically valid and reliable monetary valuations of all relevant effects generated from road transport and further aggregating them.
Given the challenges encountered in the traditional economic evaluation approaches, there is a growing requirement to develop other techniques for assessing road transport sustainability. One of the alternatives is to perform a benchmarking analysis, which is a process of comparing organizations (e.g., countries) with the aim of identifying the highest standard of excellence for products, services, or processes—commonly known as “best practice”—and then making the improvements necessary to reach those standards. In recent decades, benchmarking has received significant attention in a variety of performance evaluation, quality management and continuous improvement activities (e.g., [8,9,10,11,12]). In literature, different benchmarking tools are available, one of which is data envelopment analysis (DEA). DEA, initially developed by Charnes et al. (1978) [13], is a nonparametric data-driven approach to assess the relative efficiency of a homogeneous set of decision-making units (DMUs) on the basis of multiple inputs and multiple outputs. The attractive features of DEA, relative to traditional economic evaluation approaches are: (1) an a priori knowledge concerning the monetary valuations of all relevant benefits and costs is not necessary (although sometimes preferable); (2) the inputs and outputs used in the model can be expressed in different units of measurement. In other words, DEA can be used to directly weigh different policy objectives such as environment and safety; and (3) by distinguishing between efficient and inefficient units, DEA possesses the ability to analyze the sources of inefficiency and further determine the level of potential improvement, which mostly attracts analysts and decision makers, and results in the widespread application of this technique (e.g., [14,15,16]). Despite their prominent advantages, the standard DEA models are not directly applicable to this study, because they are appropriate only for weighing inputs/outputs with the same direction, i.e., inputs have to be minimized and outputs have to be maximized. In the case of integrating both desirable and undesirable effects from road transport in evaluation and decision making, additional model consideration is needed in view of a successful benchmarking practice.
The remaining sections of this paper are structured as follows. Starting from a brief introduction of relevant factors (both desirable and undesirable) for sustainable road transport evaluation, Section 2 identifies suitable indicators for a benchmarking study among the 28 EU countries. In Section 3, we briefly review the principle of data envelopment analysis and propose a new model to integrate both desirable and undesirable factors in the evaluation. In Section 4, we apply the proposed model to assess the road transport sustainability of these 28 countries, and the benchmarking results are subsequently provided and discussed. The paper ends with conclusions and future research in Section 5.
2. Sustainable Road Transport and Its Effects in EU
There are many definitions of sustainable transport in general, and sustainable road transport in particular, and a representative one, given by the United Nations, is as follows: “the provision of services and infrastructure for the mobility of people and goods—advancing economic and social development to benefit today’s and future generations—in a manner that is safe, affordable, accessible, efficient, and resilient, while minimizing carbon and other emissions and environmental impacts” [17].
According to the above definition, the development goal of sustainable road transport can be understood as to reasonably meet the road traffic demand, optimize the utilization of resources, improve the environmental quality, promote social harmony, improve the safety level and realize the benign development of society, economy, environment and road transport. Measuring road transport sustainability as a multiobjective problem needs to consider a mix of environmental, social and economic aspects [7]. With respect to the environmental aspect, road transport contributes significantly and increasingly to greenhouse gas emissions, which are linked to the use of fossil fuels. Therefore, a sustainable road transport system should consider minimizing the consumption of nonrenewable resources, so as to battle against resource depletion and global warming. In addition, vehicle exhaust pollution is also one of the main sources of poor air quality. Currently, some of the most commonly used environmental indicators for sustainable road transport evaluation are GHG emissions and other air pollutants from road transport, energy consumption in road transport, population exposed to noise, land consumption for road transport and vehicle kilometer travelled [18,19,20]. Regarding the social aspect, a sustainable road transport system should provide accessibility for all people and also minimize hazards to health and the risk of road crashes. Some important social indicators related to sustainable road transport include fatalities and injuries from road crashes, accessibility to facilities and public transport and quality of road transport for disadvantaged, disabled, children, nondrivers, etc. [18,21]. In addition, a sustainable road transport system must contribute to economic growth and also reflect costs related to road transport activities. In this respect, traffic congestion costs, travel time costs, transport emissions costs and road crash costs are the main focuses in the previous studies [22,23,24,25]. In general, sustainable road transport development emphasizes the integration of green and intelligent transportation system to realize the dynamic balance of supply and demand of road transport system. The aim is to maximize the sustainable development of the road transport system with minimum resource input and minimal environmental cost.
In Europe, the main objective of the EU’s road transport policy is to promote mobility that is efficient, safe and environmentally friendly [26]. Over the years, the EU road transport sector has developed considerably for the benefit of trade, the economy and the freedom of movement. In 2013, freight transport by road continued to dominate at the EU-28 level (i.e., the 28 Member States of the EU), accounting for nearly 50% of the total tonne-kilometres performed, which has remained almost unchanged since 2007 [27]. People also travel mainly by road, with private cars accounting for over 72% of passenger transport in 2013 [27].
Road transport is a vital economic sector in its own right, employing around 5 million people across the EU and generating close to 2% of its Gross Domestic Product (GDP) [26]. If one takes into account related services, including the manufacture of transport equipment, infrastructure construction and maintenance, trade, as well as tourism, the jobs and wealth stemming from road transport are even greater. However, road transport development in the EU has not come about without costs. Energy consumption, GHG emissions, traffic congestion, noise pollution and safety issues are all directly linked to today’s road transport systems and render road transport one of the key challenges of the EU’s sustainable development strategy [28].
In 2013, road transport in the EU-28 accounted for about 82% of the total transport energy consumption. Although the absolute amount of energy consumption in road transport keeps decreasing since 2008 due partly to the global financial crisis, in the long term, the steadily increasing demand for personal travel and freight transport will still be the primary factor of underlying increases in transportation energy demand [29]. Moreover, since fossil fuels are still the primary energy source for road transport, their ceaseless consumption is strongly linked to issues such as the security of supply, production of renewables, and, to an increasing extent, climate change due to rising emissions of GHG (e.g., CO2, CH4, and N2O) [30,31]. Specifically, the EU-28 total GHG emissions from transport (excluding international aviation and maritime transport) increased by nearly 15% between 1990 and 2012. Although the annual amount of emissions has continued to decrease since 2008, it is still the only major source category currently producing considerably more GHG emissions than in 1990 [1]. Amongst others, road transport continued to take the biggest share, which accounted for about 72% of the total transport GHG emissions in 2012. Furthermore, drivers are confronted with ever more congested roads in the EU, which is not just a nuisance for road users but also results in an enormous waste of fuel and more GHG emissions due to continuous acceleration and braking. Congestion costs the EU economy more than 1% of GDP—in other words, more than the EU budget [26]. In addition, road transport is increasingly associated with the negative effects on safety, which is important not only because of the lost travel time or cost of property damage but mainly because of the loss of human life and serious injuries sustained. In 2013, about 26,000 people died in the EU-28 as a consequence of road crashes [32]. Even though considerable progress has been made in the last 10 years with respect to road safety in Europe, the current situation is still socially unacceptable and concerted efforts are required for effective and sustainable prevention.
In order to assess road transport sustainability, both the desirable achievements and the undesirable costs from road transport have to be taken into account and cannot be viewed in isolation. In this study, to demonstrate how the benchmarking analysis can be used for road transport sustainability evaluation, some currently available desirable factors include (1) Turnover from road passenger transport and (2) Turnover from road freight transport and undesirable factors including (3) GHG emissions in road transport and (4) The number of road fatalities, are selected. Here, due to the lack of information on the direct and indirect profit from road transport, the turnover from both the road passenger and freight transport, which refers to transportation and storage activities (including postal and courier services, removal services) [1], is used as a proxy indicator currently data available for benchmarking purposes. Data for the 28 EU countries being Austria (AT), Belgium (BE), Bulgaria (BG), Croatia (HR), Cyprus (CY), Czech Republic (CZ), Denmark (DK), Estonia (EE), Finland (FI), France (FR), Germany (DE), Greece (EL), Hungary (HU), Ireland (IE), Italy (IT), Latvia (LV), Lithuania (LT), Luxembourg (LU), Malta (MT), the Netherlands (NL), Romania (RO), Poland (PL), Portugal (PT), Slovakia (SK), Slovenia (SI), Spain (ES), Sweden (SE) and the United Kingdom (UK), are collected from the European Commission for the year 2012 [1], together with the measures of exposure on both the road passenger and freight transport (see Table 1). The logical framework of causal relationships between these factors is that, given the total amount of road passenger transport and freight transport in each country (as exposure), a country who generates higher desirable achievements and meanwhile lower undesirable costs is considered to be more favorable in terms of road transport sustainability.

Table 1.
Input and output data for the 28 EU countries, 2012.
3. Methodology
To perform a benchmarking study among the 28 EU countries based on the selected factors, the DEA approach is employed to undertake the assessment, and a model extension is proposed to integrate both desirable and undesirable factors simultaneously.
3.1. Basic DEA Models
As a data-driven approach, DEA applies mathematical programming techniques to estimate the relations between multiple inputs and multiple outputs related to a set of DMUs (countries in this study). Specifically, consider an n-DMUs set, each consuming m different inputs to produce s different outputs. The relative efficiency of a DMU is defined as the ratio of its total weighted output to its total weighted input, subjected to lie between zero and unity. Mathematically, the efficiency score of a particular DMU0, i.e., E0, is obtained by solving the following model:
In this constrained optimization problem, yrj and xij are the rth output and ith input respectively of the jth DMU, ur is the weight given to the rth output, vi is the weight given to the ith input, and is a small non-Archimedean number for preventing the DMU to assign a weight of zero to unfavorable factors. This fractional program is computed separately for each DMU to determine its best possible input and output weights. In other words, the weights in the objective function are chosen to maximize the value of the DMU0’s efficiency ratio and meanwhile respect the less than unity constraint for all the DMUs.
Furthermore, to simplify the calculation and to avoid an infinite number of solutions, the above fractional program can be converted into a linear program as follows:
The transformation is completed by constraining the efficiency ratio denominator (i.e., the weighted sum of inputs) in (1) to a value of one, and thus the weighted sum of outputs will be maximized. In general, a DMU is considered to be efficient if it obtains a score of one whereas a score less than one implies that it is inefficient.
3.2. Model Extension
By applying the DEA approach, the data are believed to be able to “speak for themselves” and the specification error is minimized. However, in the standard DEA models (1) and (2), efficiency measurement is based on the assumption that inputs have to be minimized and outputs have to be maximized. Nevertheless, when undesirable outputs (e.g., GHG emissions) are considered which have to be minimized to improve efficiency, the standard DEA cannot be applied directly [33]. In literature, several approaches for incorporating undesirable factors in DEA are available, such as treating undesirable outputs (inputs) as inputs (outputs) [34], applying a linear or nonlinear monotone decreasing transformation to undesirable factors [35], or adopting a directional distance function [36]. However, none of them solves the problem perfectly. For instance, if one treats the undesirable outputs as inputs, the resulting DEA model will not reflect the true production process; the nonlinear transformation will demolish the convexity relations; when applying the linear transformation or the directional distance function approach, the choice of a different translation vector and direction vector can greatly influence the final results.
In this study, we propose an alternative approach in which the efficiency of a DMU, traditionally defined as the ratio of its total weighted output to its total weighted input, is split into two parts, i.e., the ratio of the weighted desirable output to the weighted input (E), and the ratio of the weighted undesirable output to the weighted input (E’). The link between these two ratios is that the weights allocated to all the inputs are kept the same. Thus, a multiple objective programming problem can be established with the purpose of maximizing the first ratio on the one hand, and minimizing the second one on the other, which can be further converted into a multiple objective linear program as follows:
where s1 is the number of desirable outputs. yrj (r = 1…s1) are the desirable outputs of the jth DMU and yrj (r = s1 + 1…s) are the undesirable outputs of the jth DMU, and the same m inputs xij are shared by both parts of the outputs.
Since and , and in other words, both of the optimal efficiency scores of a particular DMU0, i.e., and , equal to one, two deviation variables and can be introduced in order to achieve the following equations, i.e., , and , the above problem (3) can thereby be solved by applying the following goal programming:
where is the positive deviation variable of E0 and is the negative deviation variable of .
In summary, the main advantage of the proposed model is that no data transformation is needed and no parameters should be predefined. Therefore, it can be considered as an ideal way to integrate both desirable and undesirable factors simultaneously in evaluation and decision making.
4. Application and Results
4.1. Model Comparison
To test the necessity of extending the standard DEA model and the superiority of the proposed approach, three methods for treating undesirable factors in DEA are investigated based on the data from this study. The first one is to treat undesirable outputs (i.e., the GHG emissions from road transport and the number of road fatalities) as inputs. The standard DEA model can then be applied (see Option 1 in the table below). The second one is to apply a nonlinear monotone decreasing transformation (i.e., reciprocal) to these two undesirable factors. After doing this, the standard DEA model is applicable as well (Option 2). Furthermore, the third one is to adopt the model proposed in this study (Option 3). The results from these three options are presented in Table 2.
Table 2.
Results of the 28 EU countries based on 3 different models.
As can be seen, seven countries obtain an efficient score of one by applying Option 1 and five efficient countries are derived from Option 2. By applying Option 3, only one country, i.e., Sweden, obtains an optimal score of one. That is, all these 28 countries can be fully ranked by applying the proposed model. In other words, the discrimination power is greatly improved by applying the proposed model. Moreover, to be applicable in the standard DEA model, the undesirable outputs are either treated as inputs (in Option 1) or transformed using a reciprocal (in Option 2), which make the interpretation of the results difficult. In Option 3, however, both desirable and undesirable factors do stand for themselves, and apart from the overall score, it can be further split into two efficiency scores with respect to desirable and undesirable factors, respectively, which will be elaborated in the following section. All this demonstrates clearly the superiority of the proposed model in dealing with both desirable and undesirable factors.
4.2. Country Ranking
Now, we apply the proposed methodology to assess the current road transport performance of the 28 EU countries with respect to sustainability. In doing so, road passenger transport (1000 million passenger-kilometers (pkm) travelled) and road freight transport (1000 million freight tonne-kilometers (tkm) travelled) are used as the model’s inputs, the turnover from both road passenger and freight transport (€ million) is selected as a proxy of desirable outputs, and the GHG emissions from road transport (million tonnes CO2 equivalent), as well as the number of road fatalities are undesirable outputs. The results from model (4) are presented in Table 3. The counties are ranked based on their Z value.
Table 3.
Overall road transport sustainability scores of the 28 EU countries.
Among these 28 EU countries, Sweden is the only best-performing country with respect to road transport sustainability, since both its E and E’, i.e., the efficiency score with respect to desirable and undesirable factors, respectively, reach the optimum value of one, which thereby results in a minimum Z value of zero. In contrast, countries like Cyprus and Croatia perform relatively poorly from both the desirable and undesirable perspective. As a result, they rank at the bottom because a large value of Z is obtained (1.882 and 1.435, respectively) compared to the other countries. Moreover, from the view of desirable achievements, Austria also exhibits the best performance with its E score equaling to one. However, its E’ value is relatively large indicating that a high price is paid for the undesirable costs of road transport in this country in order to achieve its desirable outputs. Consequently, the overall road transport sustainability of Austria can only be ranked in the middle of all the EU countries (it was however, considered as a best performer in both Option 1 and Option 2). On the contrary, countries like Luxembourg are performing pretty well in terms of their undesirable factors. However, more attention has to be paid to improve their desirable factors. Distinguishing these two parts is valuable; Luxembourg was actually identified as a best-performer in both Option 1 and Option 2 (see Table 2).
4.3. Benchmarking
Furthermore, as a benchmarking study, valuable benchmarks should be identified for each underperforming country as a reference to move towards sustainability. To this end, a better understanding of the computational process leading to the efficiency scores presented in Table 3 is required, especially the reasons why the underperforming countries are unable to obtain a value of one for both E and E’. The mechanism of the proposed DEA model (4) is to choose the best possible input and output weights to minimize the Z value (or to maximize the E value and minimize the E’ value simultaneously) of a certain country under all imposed restrictions. If the best possible weights of Country A under study do not result in an E or E’ value of 1 for this country but cause the weighted score of Country B in the data set to become 1, then the model stops. This result implies that Country B performs better than Country A on at least one of the sustainability aspects since the E (or E’) score of B is relatively higher (or lower) with the same set of weights. Therefore, Country A should take Country B as an example for improving its road transport performance with respect to either desirable achievements or undesirable costs or both. In other words, Country B can be seen as a valuable benchmark for Country A to learn from.
In order to identify realistic benchmarks for each underperforming country, a clustering analysis is conducted to group the countries with inherent similarity in their practices. In this study, a hierarchical clustering analysis is applied based on all the indicators involved, and different methods in SPSS 25.0 (including the Ward’s method, the Centroid method and the Median method) are used to derive various clusters (see e.g., [37]). The results are shown in Figure 1, Figure 2 and Figure 3.
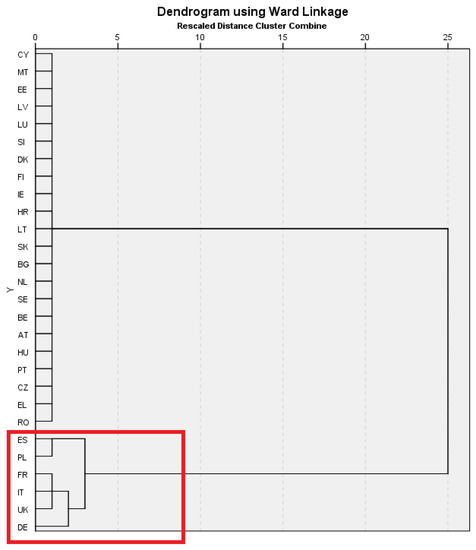
Figure 1.
Dendrogram from the hierarchical clustering analysis using the Ward’s method (six countries in the red box are grouped into one cluster).
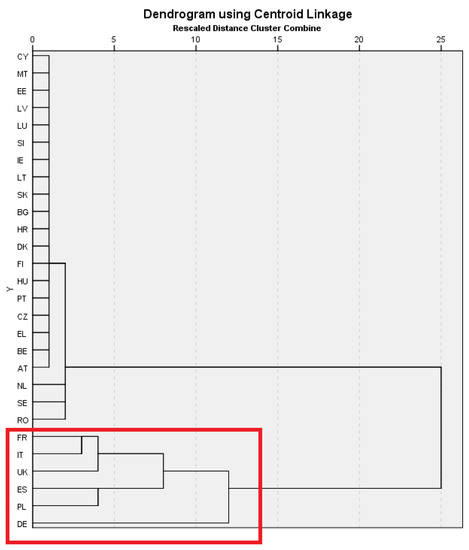
Figure 2.
Dendrogram from the hierarchical clustering analysis using the Centrold method (six countries in the red box are grouped into one cluster).
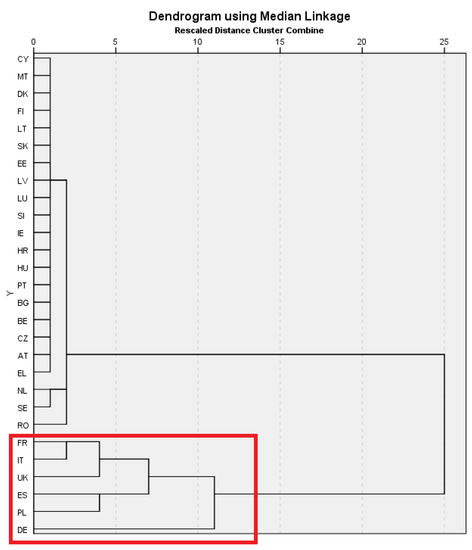
Figure 3.
Dendrogram from the hierarchical clustering analysis using the Median method (six countries in the red box are grouped into one cluster).
As can be seen, no matter which clustering method is used, even though certain differences can be found between some clusters, six countries with high road transport activities (also with large territory areas in the EU) are always grouped in one cluster, which are Germany, Spain, France, Italy, Poland and the United Kingdom. So, these six countries are believed to be more likely to contain inherent similarity in their practices and are suitable to be considered in one group for benchmarking analysis. As a result, they are used for the illustration of benchmark identification. Specifically, the model proposed in this study is adopted again to identify best-performing and underperforming countries within this cluster. The results are shown in Table 4.
Table 4.
Overall road transport sustainability scores of six countries in one cluster.
Based on the overall road transport sustainability score, Germany and the United Kingdom are the two best-performing countries within this cluster, followed by France and Italy. While Spain and Poland rank the last. Moreover, there are four countries (Germany, the United Kingdom, Italy and Spain) that obtain an E score of one and three countries (Germany, the United Kingdom and Poland) who obtain an E’ score of one. They are therefore possible benchmarks for the remaining countries with respect to the corresponding aspect.
With the principle of the DEA model elaborated before, Table 5 reveals the benchmark countries or the reference set for the remaining underperforming ones. Taking France as an example, the United Kingdom and Spain are the two benchmark countries with respect to the desirable achievements since they obtain an E score of one with the best possible weights of France. While Germany and Poland are the benchmark countries with respect to the undesirable costs since they obtain an E’ score of one with the best possible weights of France. Therefore, these countries are suitable for a comparison with the corresponding road transport performance in France. In other words, they can be considered as best practice cases to help improve the road transport sustainability of France. The situation could be different for different countries. When Poland is under consideration, as we can see from Table 5, Spain is the only benchmark country with respect to the desirable achievements and Germany the benchmark country with respect to the undesirable costs.
Table 5.
Benchmark countries for the underperforming countries in the same cluster.
Moreover, for the two best-performing countries in both aspects, we find that Germany has much to be learned from in terms of its action against GHG emissions and road crashes since it is the benchmark for all the four underperforming countries with respect to the undesirable costs, while the United Kingdom performs relatively better in terms of desirable achievements. Similarly, for the underperforming countries, Poland is doing relatively well in terms of undesirable costs, while the opposite is true for Spain. In addition, it is also interesting to see that Italy and Spain, both obtaining an E score of one, could still learn from each other in this aspect.
5. Concluding Remarks
Sustainable development is a fundamental and overarching objective of the EU, in which sustainable road transport is one of the key challenges requiring particular concern. Different from applying traditional economic evaluation approaches, we proposed in this study a new way to assess road transport sustainability, which was to perform a benchmarking analysis. By comparing both the benefits from road transport and its undesirable costs among different countries, insight in the relative performance of a country with respect to its sustainable road transport can be gained, main problems can be formulated and valuable benchmarks identified. All this can be further used by decision makers, research organizations and different stakeholders to set sustainability objectives, to design effective strategies and to see whether the present road transport system is moving towards sustainability.
In this research, starting from the identification of relevant factors (both desirable and undesirable ones) for sustainable road transport evaluation, a benchmarking study among the 28 EU countries was carried out, and the technique of data envelopment analysis was employed to undertake the assessment. In doing so, a new model that integrates both desirable and undesirable factors was proposed with the main advantage of avoiding data transformation and parameter predefinition.
In this study, three different options for incorporating undesirable factors in the evaluation were compared, and the superiority of the proposed model was shown. Moreover, using the measures of exposure on both road passenger and freight transport as the model’s input and both the desirable achievements (including turnover from both road passenger and freight transport) and the undesirable costs (including GHG emissions from road transport as well as road fatalities) as output, an overall road transport sustainability score was computed for the 28 EU countries, which could be further split into two efficiency scores with respect to desirable achievements and undesirable costs from road transport, respectively. It was found that Sweden was the only best-performing country who obtained an efficiency score of one for both the desirable and undesirable factors. The other countries were underperforming since they performed relatively bad in at least one aspect. Such a result confirmed that performing relatively well in one aspect, either desirable or undesirable, is not enough from the view of sustainable development.
Furthermore, after applying a clustering analysis to group countries with inherent similarity in their practices, the proposed model was adopted to identify best-performing and underperforming countries within the cluster, and a particular set of benchmark countries was obtained for those countries with relatively poor performance; this provides decision makers with valuable information on how to achieve a more sustainable road transport system in the future.
The benchmarking analysis has proven valuable for road transport sustainability evaluation. However, given the fact that sustainability research towards a thorough understanding of this complex problem is still an ongoing process, the degree of maturity of the selected desirable and undesirable factors in this study (such as the turnover) and the quality of data are still open for discussion. Other factors that have a strong relationship with sustainable road transport may also be considered in the future, such as the consumption and emission of different energy sources for road transport (e.g., [38,39]), as well as shared mobility (e.g., [40,41]). Meanwhile, other relevant socioeconomic and geographical conditions of a country may be used as extra measures of exposure as well. These factors can be integrated into the proposed model directly. Regarding the DEA approach, although data are believed to be able to “speak for themselves”, it does not allow for measurement error or random shocks. Therefore, more research attention should be paid to the sensitivity analysis of this approach. Moreover, by collecting the data at regular intervals, systematic country comparison over time can be conducted so as to evaluate the results of policy interventions and to monitor the progress towards sustainability. In addition, for those underperforming countries, the extent to which the benchmarks can be learned from is worth studying, and an empirical investigation on whether underperforming countries would choose the specific benchmarks indicated in this study will help in further validating the proposed methodology.
Author Contributions
Conceptualization, Y.S. and E.H.; methodology, Y.S. and Q.B.; formal analysis, Y.S. and Q.B.; data curation, Y.S. and Q.B.; writing—original draft preparation, Y.S.; writing—review and editing, Q.B. and E.H.; funding acquisition, Y.S. and Q.B. All authors have read and agreed to the published version of the manuscript.
Funding
This research was supported by the National Natural Science Foundation of China (Grant No.: 71701045), the Natural Science Foundation of Jiangsu Province of China (Grant No. BK20190371) and the Fundamental Research Funds for the Central Universities (Grant No.: 3221002007C3).
Conflicts of Interest
The authors declare no conflict of interest.
References
- European Commission. EU Energy and Transport in Figures 2018; Commission of the European Communities: Brussels, Belgium, 2018. [Google Scholar]
- European Commission. Keep Europe Moving—Sustainable Mobility for Our Continent, Mid-Term Review of the European Commission’s 2001 Transport White Paper; Commission of the European Communities: Brussels, Belgium, 2006. [Google Scholar]
- Santos, G.; Behrendt, H.; Maconi, L.; Shirvani, T.; Teytelboym, A. Part I: Externalities and economic policies in road transport. Res. Transp. Econ. 2010, 28, 2–45. [Google Scholar] [CrossRef]
- Santos, G.; Behrendt, H.; Teytelboym, A. Part II: Policy instruments for sustainable road transport. Res. Transp. Econ. 2010, 28, 46–91. [Google Scholar] [CrossRef]
- Pérez-Ortiz, M.; De La Paz-Marín, M.; Gutiérrez, P.; Hervás-Martínez, C. Classification of EU countries’ progress towards sustainable development based on ordinal regression techniques. Knowl. Based Syst. 2014, 66, 178–189. [Google Scholar] [CrossRef]
- Letnik, T.; Marksel, M.; Luppino, G.; Bardi, A.; Božičnik, S. Review of policies and measures for sustainable and energy efficient urban transport. Energy 2018, 163, 245–257. [Google Scholar] [CrossRef]
- Sdoukopoulos, A.; Pitsiava-Latinopoulou, M.; Basbas, S.; Papaioannou, P. Measuring progress towards transport sustainability through indicators: Analysis and metrics of the main indicator initiatives. Transp. Res. Part. D: Transp. Environ. 2019, 67, 316–333. [Google Scholar] [CrossRef]
- Barber, E. Benchmarking the management of projects: A review of current thinking. Int. J. Proj. Manag. 2004, 22, 301–307. [Google Scholar] [CrossRef]
- Luu, V.T.; Kim, S.-Y.; Huynh, T.-A. Improving project management performance of large contractors using benchmarking approach. Int. J. Proj. Manag. 2008, 26, 758–769. [Google Scholar] [CrossRef]
- Lai, M.-C.; Huang, H.-C.; Wang, W.-K. Designing a knowledge-based system for benchmarking: A DEA approach. Knowl. Based Syst. 2011, 24, 662–671. [Google Scholar] [CrossRef]
- Shen, Y.; Hermans, E.; Bao, Q.; Brijs, T.; Wets, G.; Wang, W. Inter-national benchmarking of road safety: State of the art. Transp. Res. Part. C Emerg. Technol. 2015, 50, 37–50. [Google Scholar] [CrossRef]
- Nikolaou, P.; Dimitriou, L. Evaluation of road safety policies performance across Europe: Results from benchmark analysis for a decade. Transp. Res. Part. A Policy Pr. 2018, 116, 232–246. [Google Scholar] [CrossRef]
- Charnes, A.; Cooper, W.W.; Rhodes, E. Measuring the efficiency of decision making units. Eur. J. Oper. Res. 1978, 2, 429–444. [Google Scholar] [CrossRef]
- Liu, J.S.; Lu, L.Y.; Lu, W.; Lin, B.J. A survey of DEA applications. Omega 2013, 41, 893–902. [Google Scholar] [CrossRef]
- Emrouznejad, A.; Yang, G.-L. A survey and analysis of the first 40 years of scholarly literature in DEA: 1978–2016. Socio Econ. Plan. Sci. 2018, 61, 4–8. [Google Scholar] [CrossRef]
- Shen, Y.; Hermans, E.; Bao, Q.; Brijs, T.; Wets, G. Towards better road safety management: Lessons learned from inter-national benchmarking. Accid. Anal. Prev. 2020, 138, 105484. [Google Scholar] [CrossRef] [PubMed]
- Ki-Moon, B. Mobilizing Sustainable Transport for Development; United Nation Official Publication: New York, NY, USA, 2016. [Google Scholar]
- Castillo, N.H.; Pitfield, D.E. ELASTIC—A methodological framework for identifying and selecting sustainable transport indicators. Transp. Res. Part. D Transp. Environ. 2010, 15, 179–188. [Google Scholar] [CrossRef]
- Haghshenas, H.; Vaziri, M. Urban sustainable transportation indicators for global comparison. Ecol. Indic. 2012, 15, 115–121. [Google Scholar] [CrossRef]
- Chakhtoura, C.; Pojani, D. Indicator-based evaluation of sustainable transport plans: A framework for Paris and other large cities. Transp. Policy 2016, 50, 15–28. [Google Scholar] [CrossRef]
- Guimarães, V.D.A.; Junior, I.C.L. Performance assessment and evaluation method for passenger transportation: A step toward sustainability. J. Clean. Prod. 2017, 142, 297–307. [Google Scholar] [CrossRef]
- Martens, K.; Di Ciommo, F. Travel time savings, accessibility gains and equity effects in cost–benefit analysis. Transp. Rev. 2017, 37, 152–169. [Google Scholar] [CrossRef]
- Hansen, I. Determination and evaluation of traffic congestion costs. Eur. J. Transp. Infrastruct. Res. 2018, 1, 61–72. [Google Scholar]
- Fernandes, P.; Vilaça, M.; Macedo, E.; Sampaio, C.; Bahmankhah, B.; Bandeira, J.; Guarnaccia, C.; Rafael, S.; Relvas, H.; Borrego, C.; et al. Integrating road traffic externalities through a sustainability indicator. Sci. Total. Environ. 2019, 691, 483–498. [Google Scholar] [CrossRef] [PubMed]
- Mahmoudi, R.; Shetab-Boushehri, S.-N.; Hejazi, S.R.; Emrouznejad, A. Determining the relative importance of sustainability evaluation criteria of urban transportation network. Sustain. Cities Soc. 2019, 47, 101493. [Google Scholar] [CrossRef]
- European Commission. Road Transport: A Change of Gear; Commission of the European Communities: Brussels, Belgium, 2012. [Google Scholar]
- Eurostat. Energy, Transport and Environment Indicators; Publications Office of the European Union: Kirchberg, Luxembourg, 2014. [Google Scholar]
- Shen, Y.; Ruan, D.; Hermans, E.; Brijs, T.; Wets, G.; Vanhoof, K. Sustainable road transport in the European Union: Changes in undesirable impacts. J. Transp. Res. Board 2011, 2242, 37–44. [Google Scholar] [CrossRef]
- Energy Information Administration. International Energy Outlook 2010; U.S. EIA: Washington, DC, USA, 2010. [Google Scholar]
- Maibach, M.; Schreyer, C.; Sutter, D.; van Essen, H.P.; Boon, B.H.; Smokers, R.; Schroten, A.; Doll, C.; Pawlowska, B.; Bak, M. Handbook on Estimation of External Costs in the Transport Sector. Internalisation Measures and Policies for All External Cost of Transport (IMPACT); Version 1.1; CE Delft: Delft, The Netherlands, 2008. [Google Scholar]
- Organization for Economic Co-operation and Development/International Transport Forum (OECD/ITF). Reducing Transport Greenhouse Gas Emissions: Trends & Data; OECD/ITF: Paris, France, 2010. [Google Scholar]
- European Transport Safety Council. Ranking EU Progress on Road Safety, 9th Road Safety Performance Index Report; ETSC: Brussels, Belgium, 2015. [Google Scholar]
- Allahyar, M.; Rostamy-Malkhalifeh, M. Negative data in data envelopment analysis: Efficiency analysis and estimating returns to scale. Comput. Ind. Eng. 2015, 82, 78–81. [Google Scholar] [CrossRef]
- Liu, W.; Sharp, J. DEA models via goal programming. In Data Envelopment Analysis in the Public and Private Sector; Westerman, G., Ed.; Deutscher Universitats-Verlag: Wiesbaden, Germany, 1999. [Google Scholar]
- Seiford, L.M.; Zhu, J. Modeling undesirable factors in efficiency evaluation. Eur. J. Oper. Res. 2002, 142, 16–20. [Google Scholar] [CrossRef]
- Färe, R.; Grosskopf, S. Modeling undesirable factors in efficiency evaluation: Comment. Eur. J. Oper. Res. 2004, 157, 242–245. [Google Scholar] [CrossRef]
- Shen, Y.; Hermans, E.; Brijs, T.; Wets, G.; Vanhoof, K. Road safety risk evaluation and target setting using data envelopment analysis and its extensions. Accid. Anal. Prev. 2012, 48, 430–441. [Google Scholar] [CrossRef]
- Pan, Y.; Chen, S.; Qiao, F.; Ukkusuri, S.V.; Tang, K. Estimation of real-driving emissions for buses fueled with liquefied natural gas based on gradient boosted regression trees. Sci. Total. Environ. 2019, 660, 741–750. [Google Scholar] [CrossRef]
- Zhang, Y.; Jiang, Y.; Rui, W.; Thompson, R.G. Analyzing truck fleets’ acceptance of alternative fuel freight vehicles in China. Renew. Energy 2019, 134, 1148–1155. [Google Scholar] [CrossRef]
- Ji, Y.; Ma, X.; Yang, M.; Jin, Y.; Gao, L. Exploring Spatially Varying Influences on Metro-Bikeshare Transfer: A Geographically Weighted Poisson Regression Approach. Sustainability 2018, 10, 1526. [Google Scholar] [CrossRef]
- Du, M.; Cheng, L. Better Understanding the Characteristics and Influential Factors of Different Travel Patterns in Free-Floating Bike Sharing: Evidence from Nanjing, China. Sustainability 2018, 10, 1244. [Google Scholar] [CrossRef]


Publisher’s Note: MDPI stays neutral with regard to jurisdictional claims in published maps and institutional affiliations. |
© 2020 by the authors. Licensee MDPI, Basel, Switzerland. This article is an open access article distributed under the terms and conditions of the Creative Commons Attribution (CC BY) license (http://creativecommons.org/licenses/by/4.0/).