Emergy and Sustainability Ternary Diagrams of Energy Systems: Application to Solar Updraft Tower
Abstract
1. Introduction
2. Methodology and Data
2.1. Solar Updraft Tower: Design Parameters
2.2. Materials and Resources in the Lifecycle of SUT Power Plants
2.3. Emergy Analysis
2.3.1. Analysis Scale and System Boundary
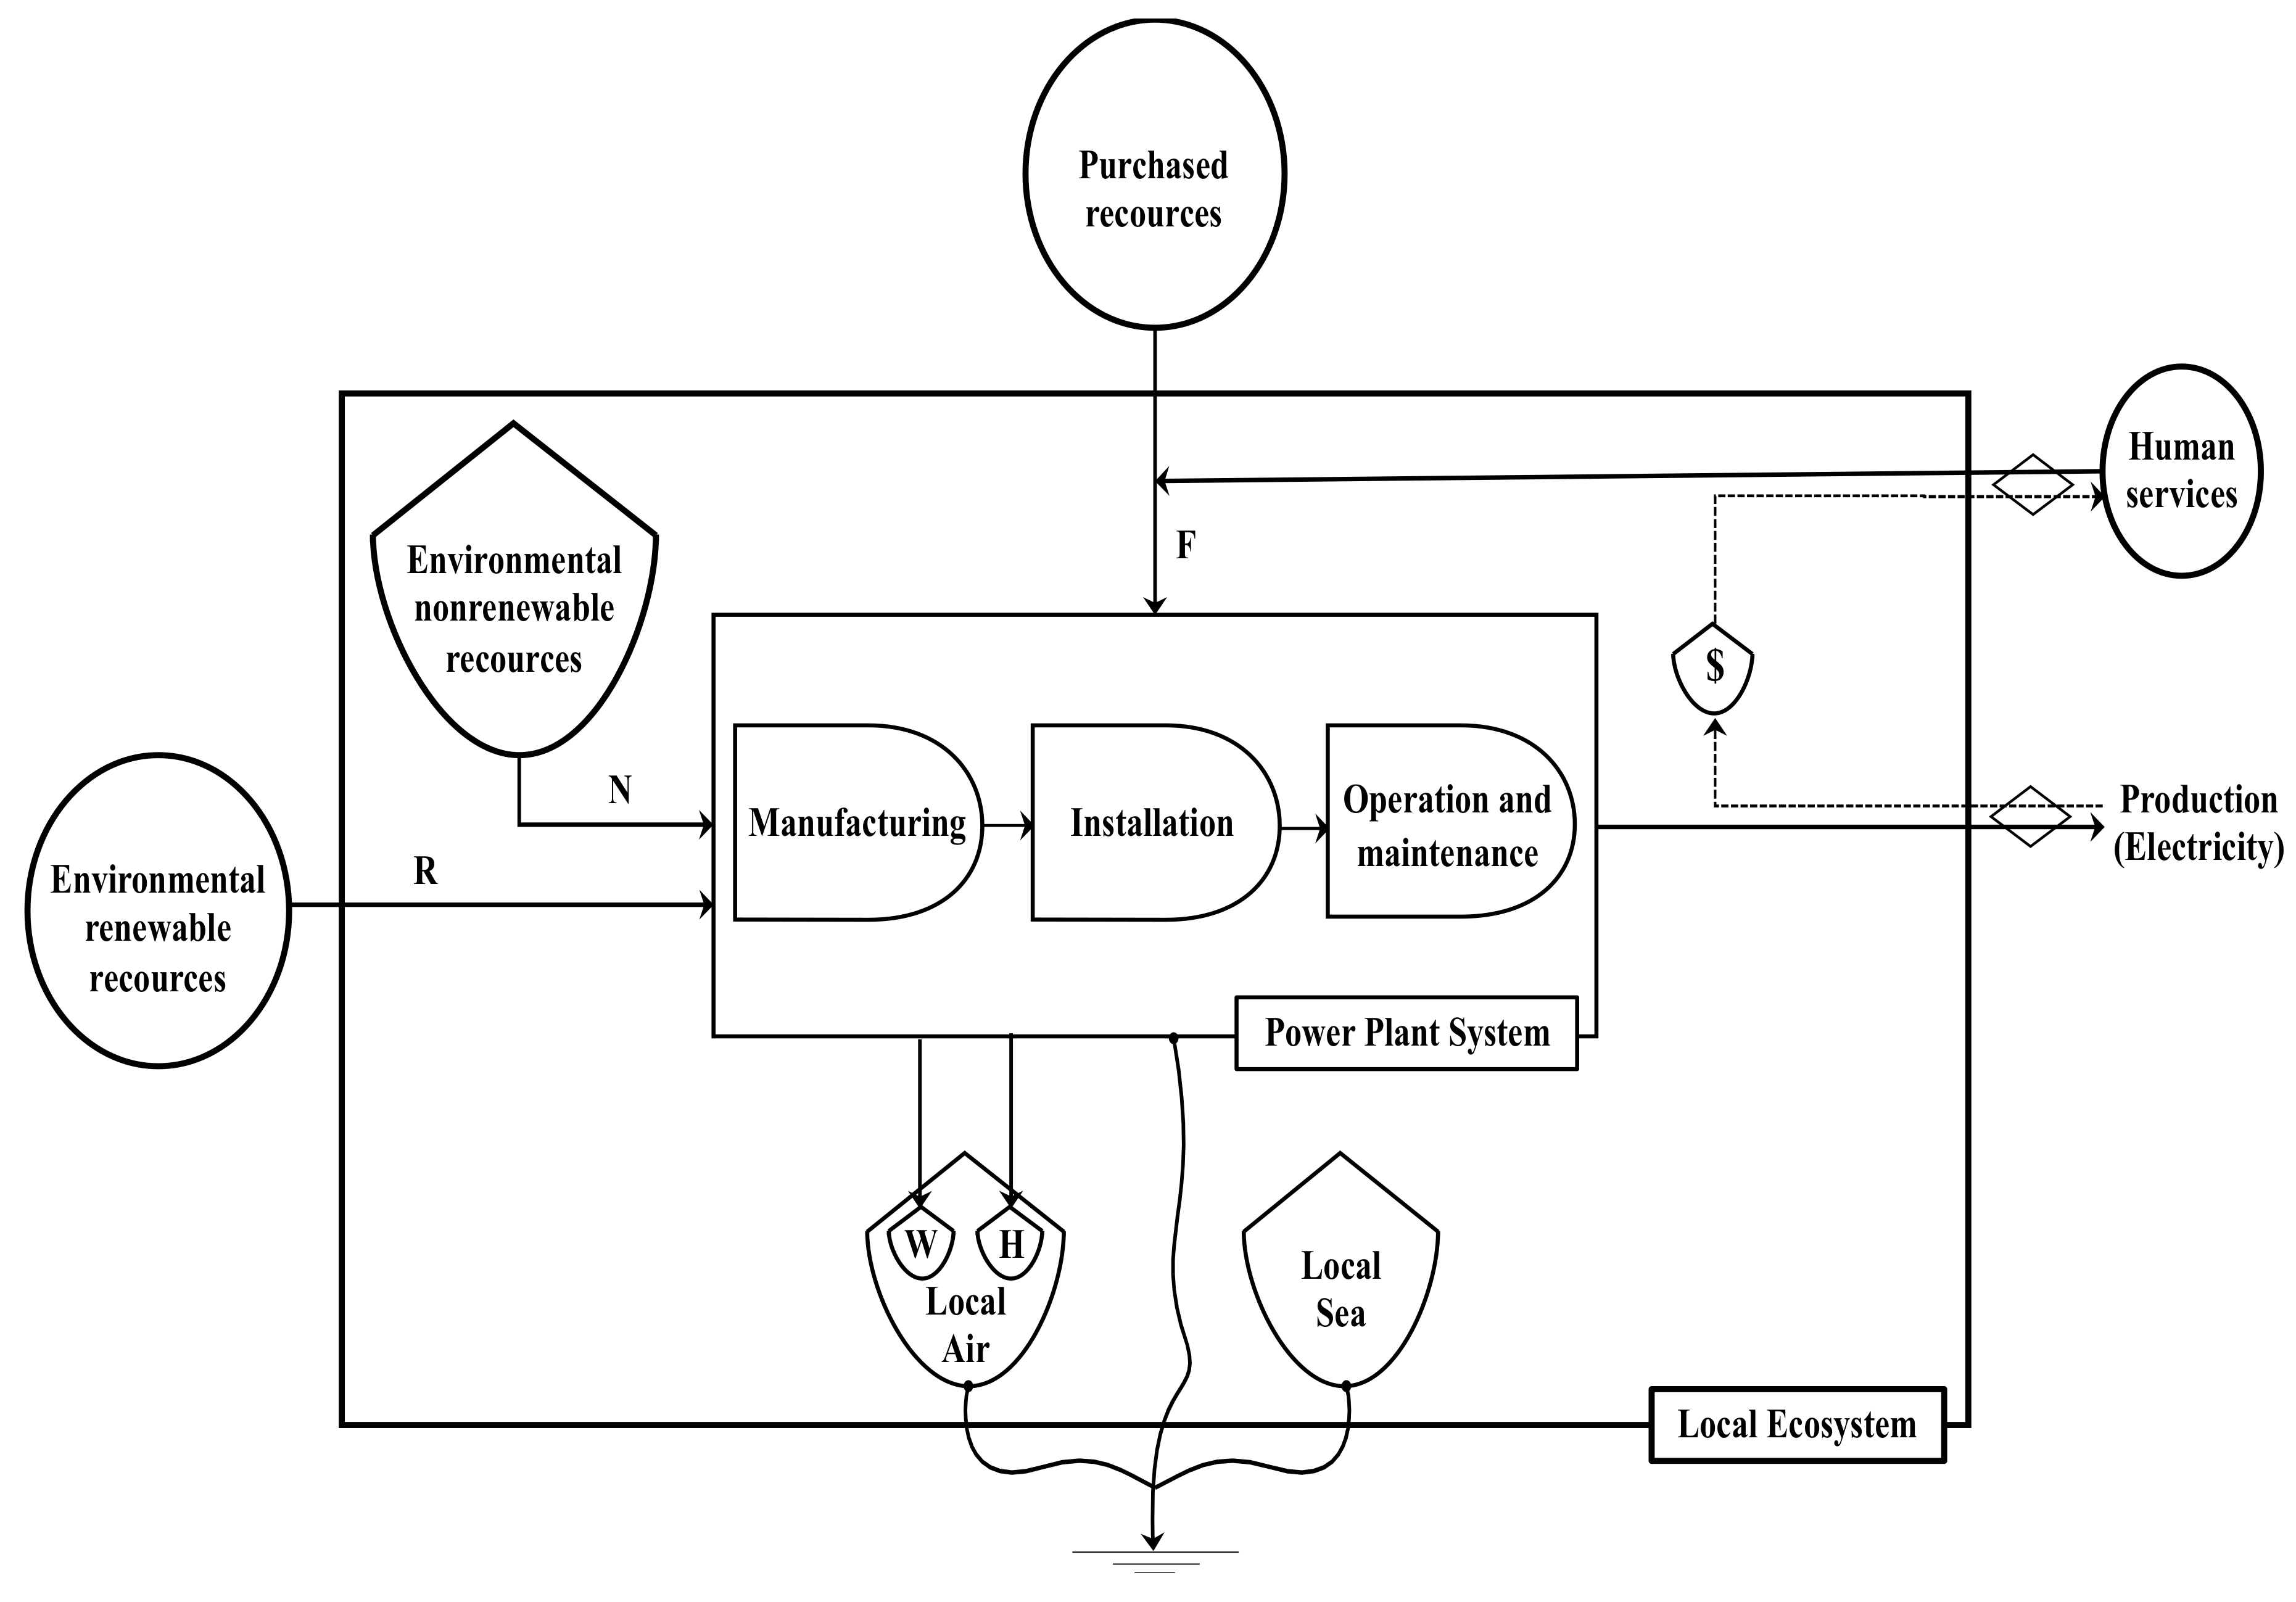
2.3.2. Emergy Diagram and Evaluation Table
2.3.3. Emergy indicators
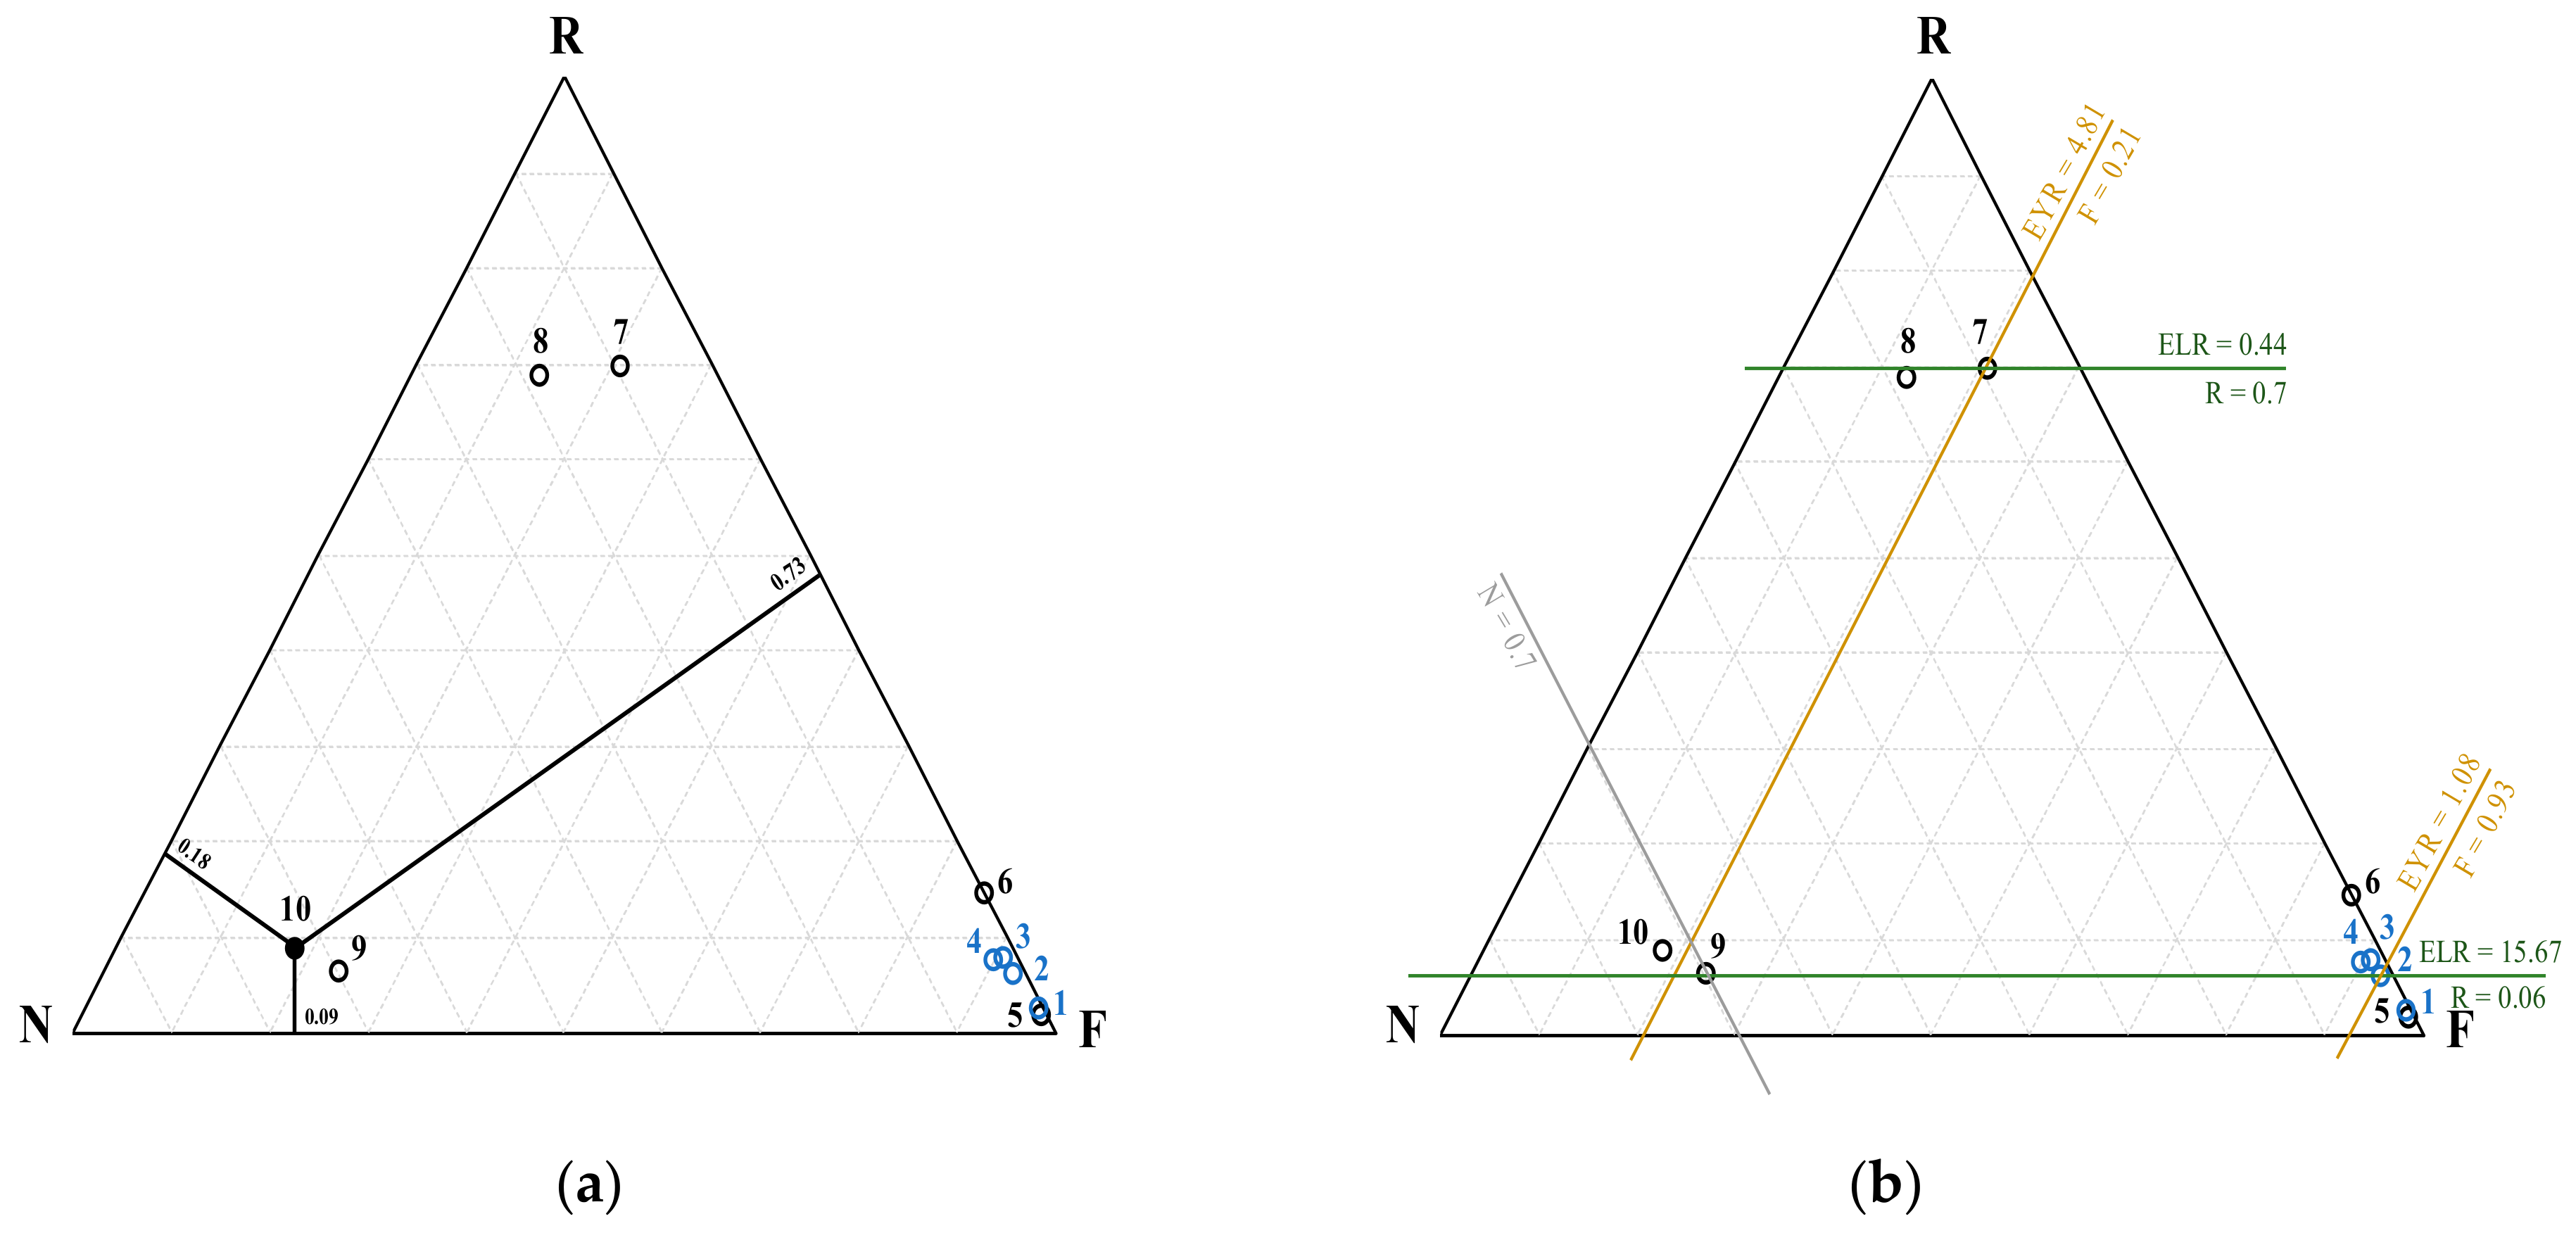
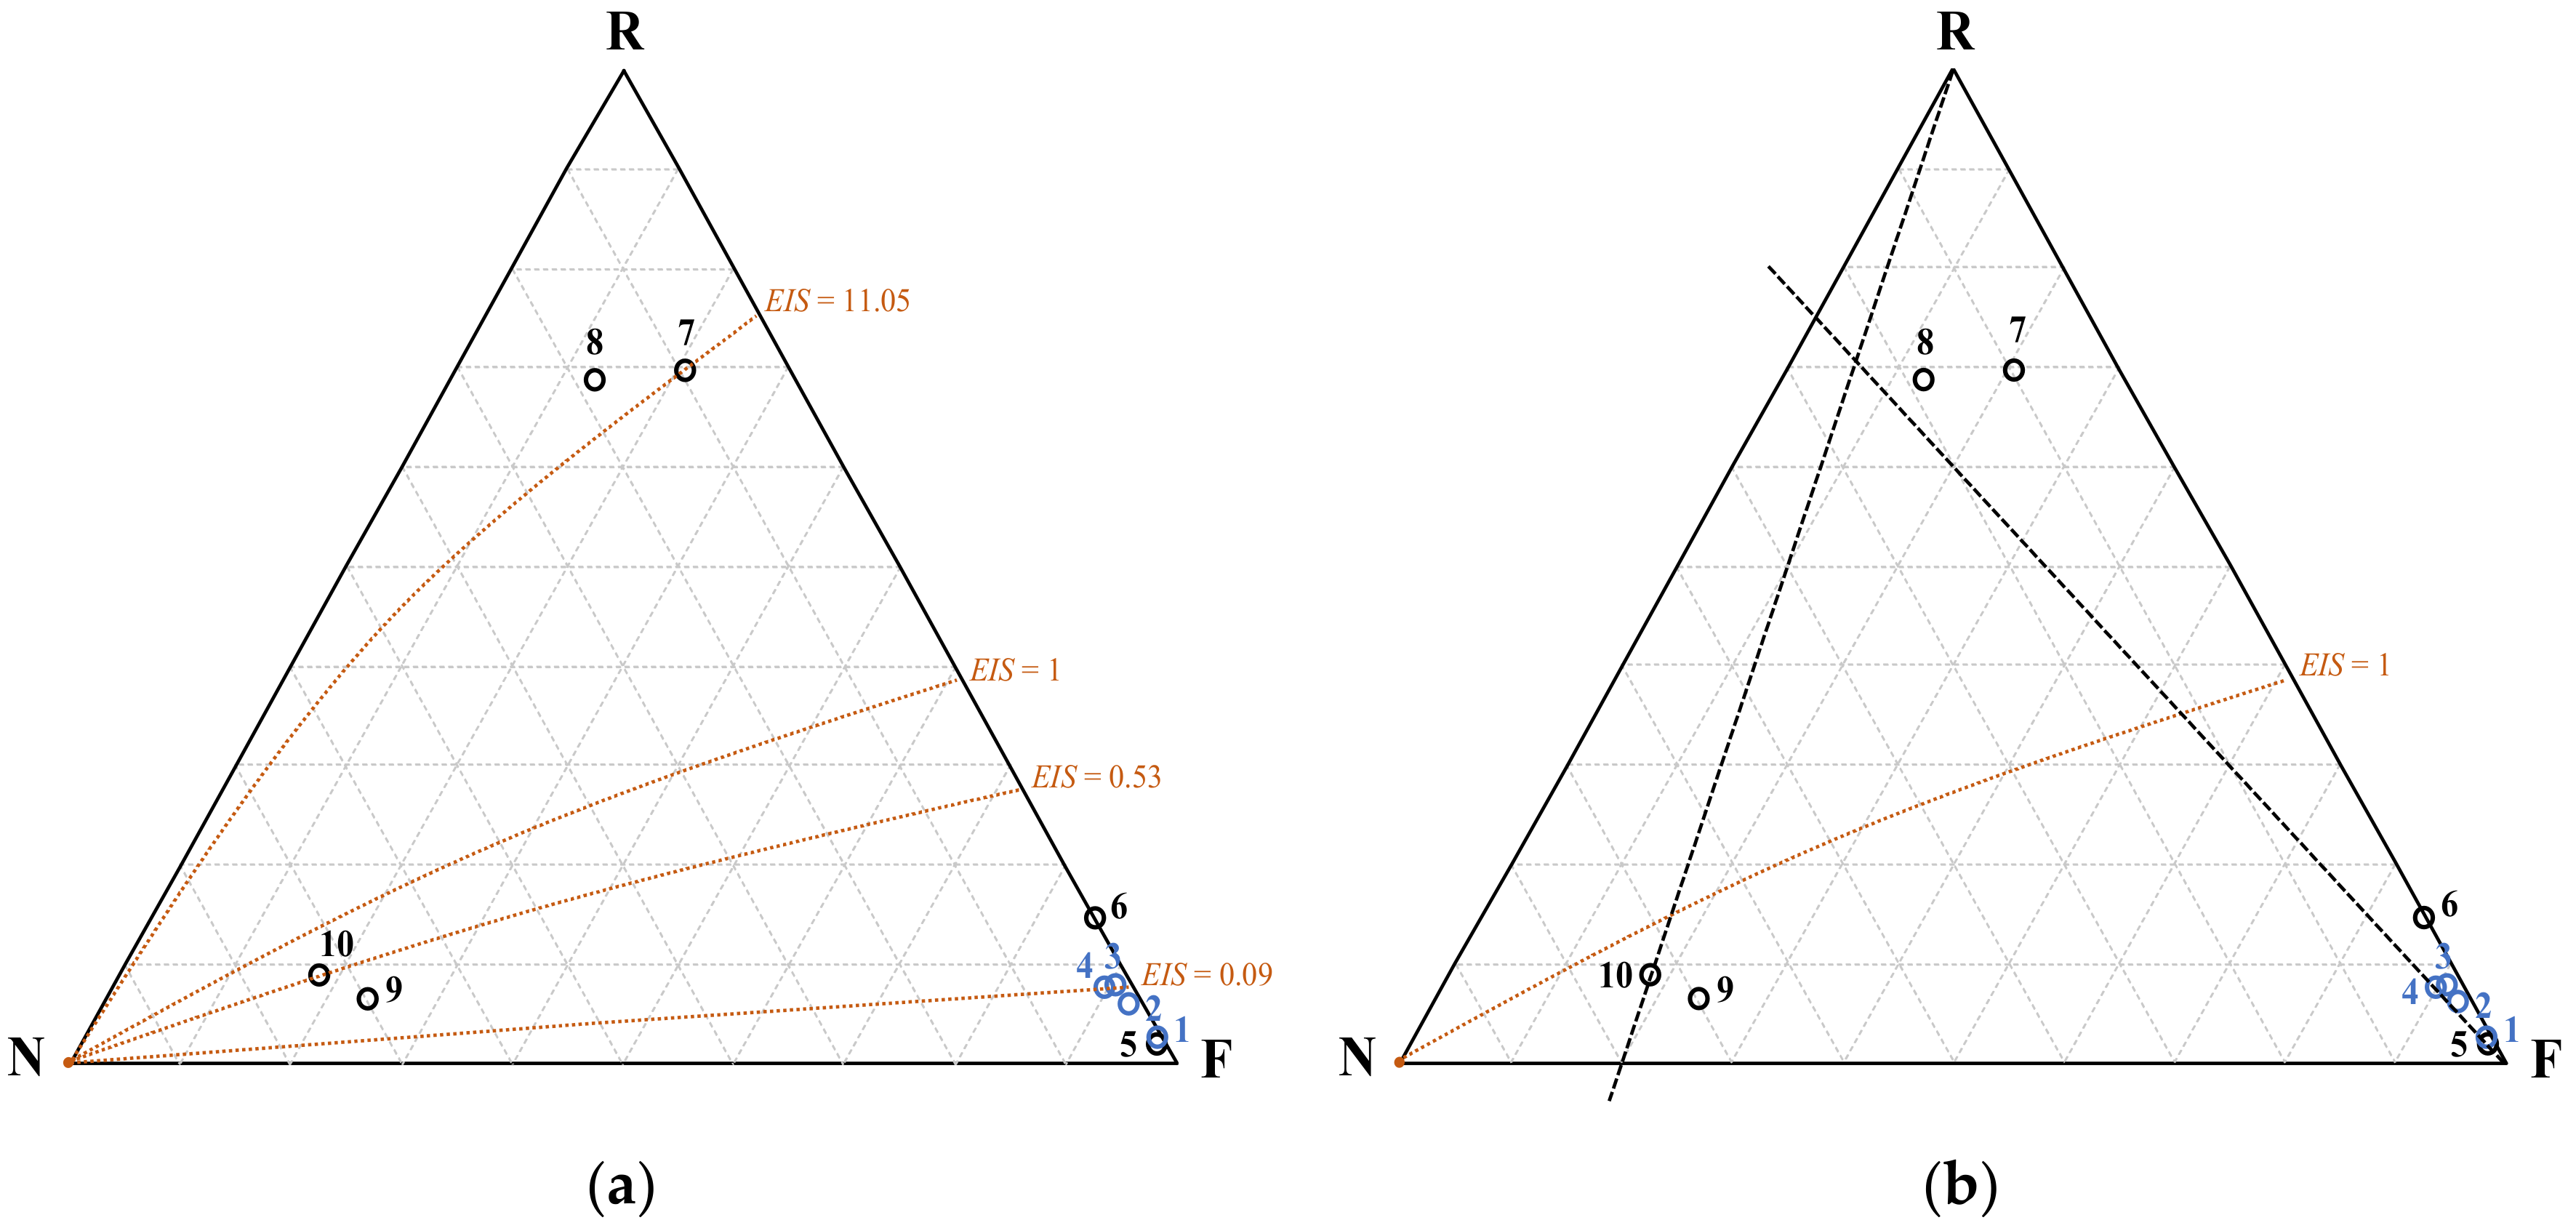
2.4. Emergetic Ternary Diagrams
2.5. Data Sources
3. Results: Emergy Accounting
4. Evaluation and Discussion
4.1. Emergy-Based Indicators
4.2. Emergetic Ternary Diagram
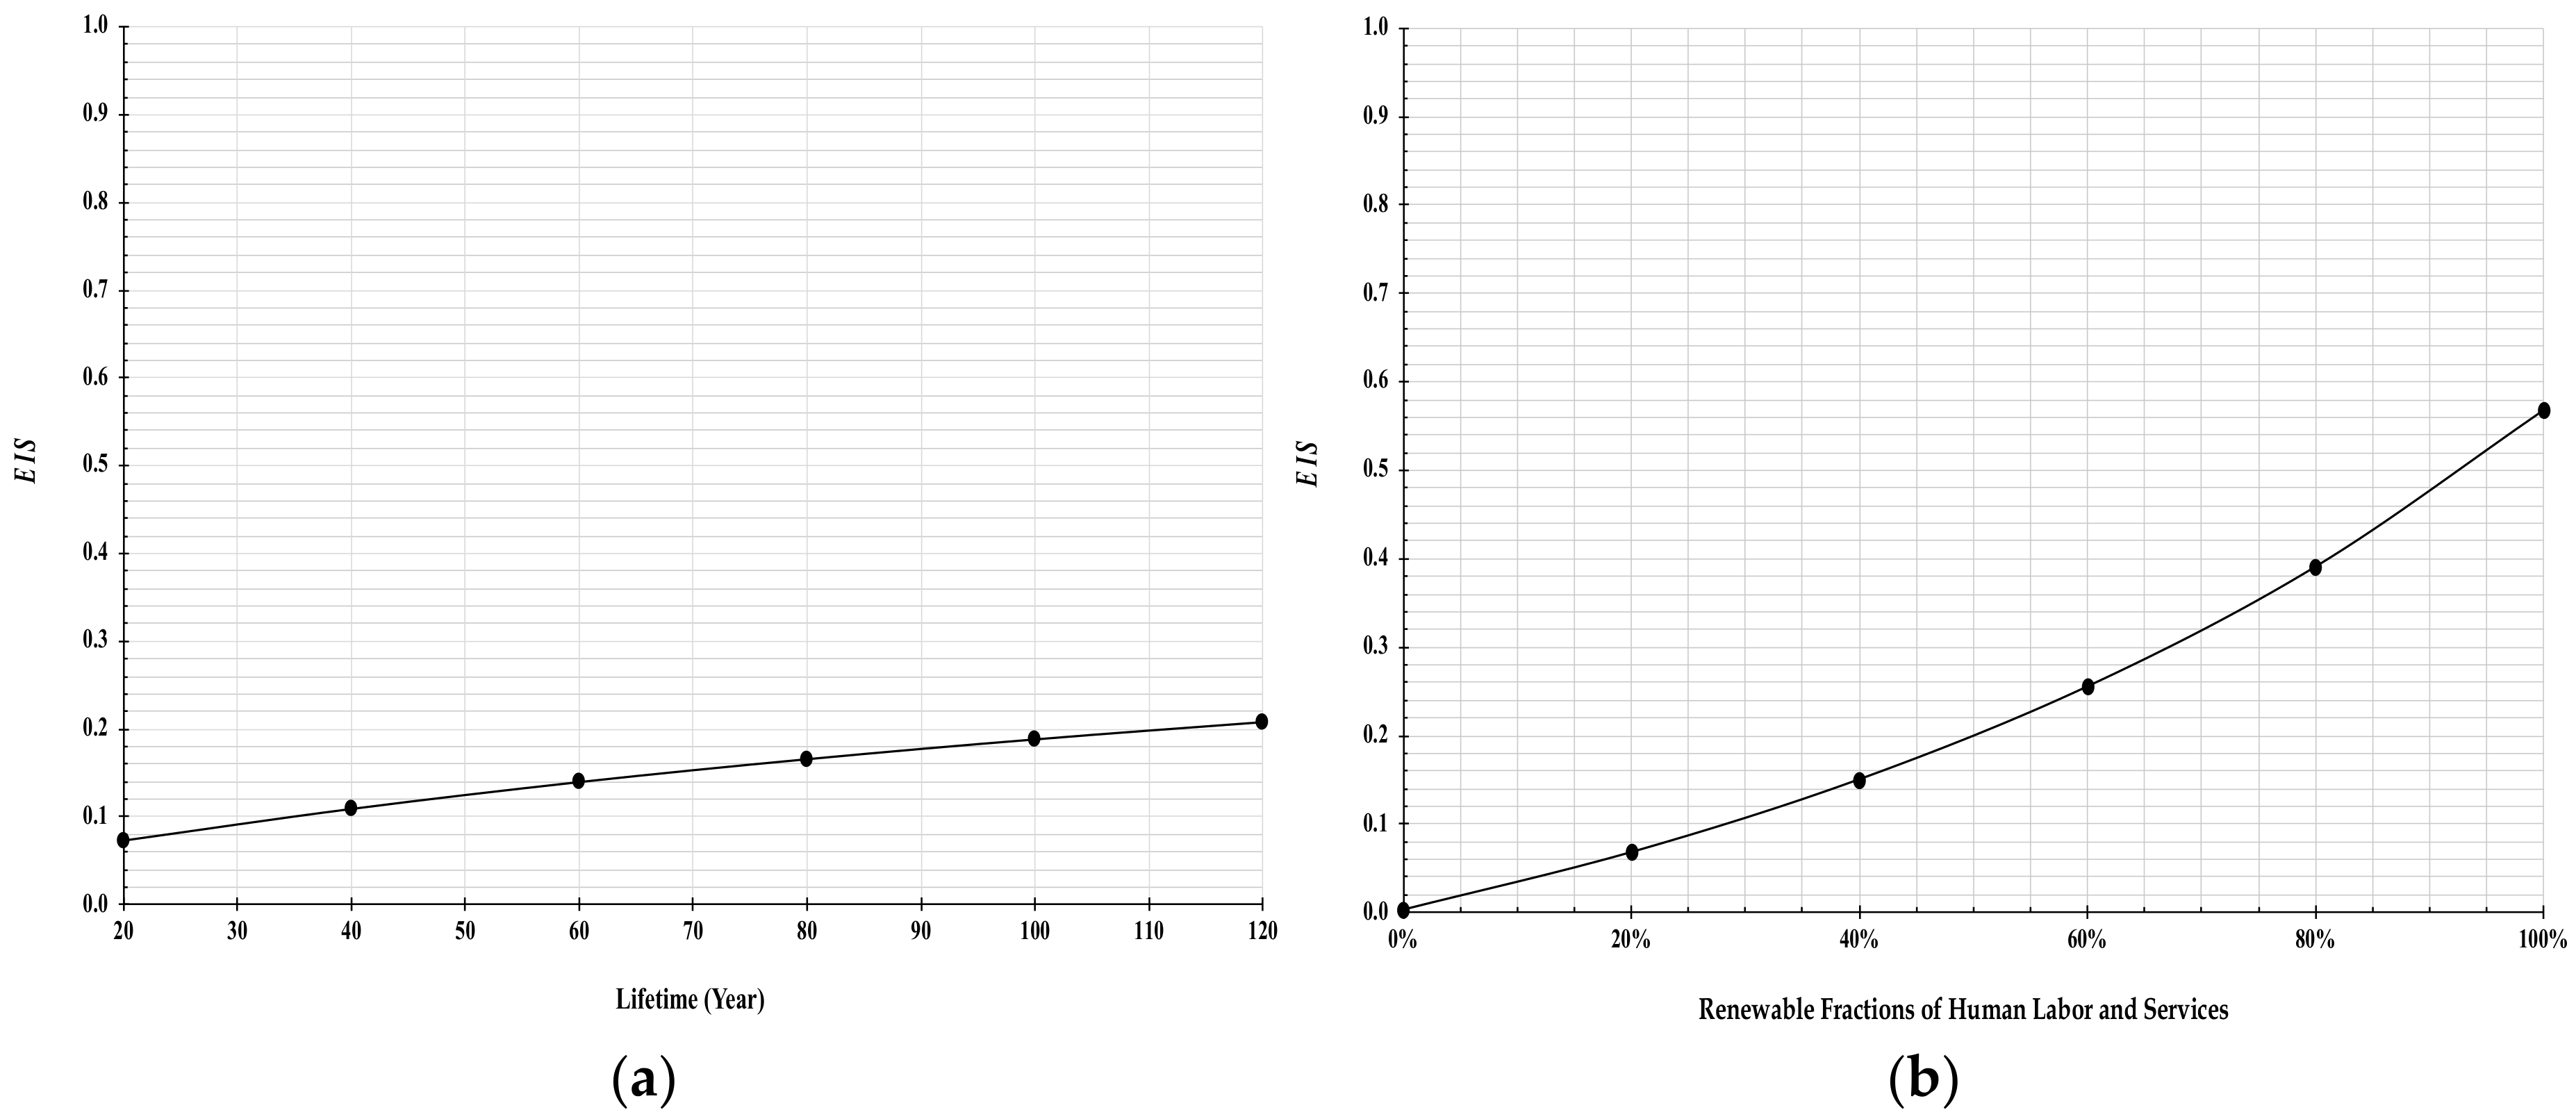
4.3. Scenario Analysis
5. Conclusions
Author Contributions
Funding
Acknowledgments
Conflicts of Interest
References
- World Commission on Environment and Development. Our Common Future; UN Documents, Oxford; Oxford University Press: New York, NY, USA, 1987. [Google Scholar]
- Burton, I. Report on Reports: Our Common Future. Environ. Sci. Policy Sustain. Dev. 1987, 29, 25–29. [Google Scholar] [CrossRef]
- Brown, M.T.; Ulgiati, S. Emergy evaluations and environmental loading of electricity production systems. J. Clean. Prod. 2002, 10, 321–334. [Google Scholar] [CrossRef]
- The World Economic Forum. Available online: https://www.weforum.org (accessed on 30 July 2020).
- Weber, C. Risky being green. Nat. Energy 2019, 4, 906–907. [Google Scholar] [CrossRef]
- Odum, H.T. Self-Organization, Transformity, and Information. Science 1988, 242, 1132–1139. [Google Scholar] [CrossRef]
- Odum, H.T. Environmental Accounting: Emergy and Environmental Decision Making; John Wiley: New York, NY, USA, 1996. [Google Scholar]
- Wang, C.; Zhang, S.; Yan, W.; Wang, R.; Liu, J.; Wang, Y. Evaluating renewable natural resources flow and net primary productivity with a GIS-Emergy approach: A case study of Hokkaido, Japan. Sci. Rep. 2016, 6, 37552. [Google Scholar] [CrossRef]
- Tilley, D.R.; Howard, T. Odum’s contribution to the laws of energy. Ecol. Model. 2004, 178, 121–125. [Google Scholar] [CrossRef]
- Brown, M.; McClanahan, T.R. EMergy analysis perspectives of Thailand and Mekong River dam proposals. Ecol. Model. 1996, 91, 105–130. [Google Scholar] [CrossRef]
- Cui, B.; Hu, B.; Zhai, H. Employing three ratio indices for ecological effect assessment of Manwan Dam construction in the Lancang River, China. River Res. Appl. 2011, 27, 1000–1022. [Google Scholar] [CrossRef]
- Buonocore, E.; Vanoli, L.; Carotenuto, A.; Ulgiati, S. Integrating life cycle assessment and emergy synthesis for the evaluation of a dry steam geothermal power plant in Italy. Energy 2015, 86, 476–487. [Google Scholar] [CrossRef]
- Pang, M.; Zhang, L.; Liang, S.; Liu, G.; Wang, C.; Hao, Y.; Wang, Y.; Xu, M. Trade-off between carbon reduction benefits and ecological costs of biomass-based power plants with carbon capture and storage (CCS) in China. J. Clean. Prod. 2017, 144, 279–286. [Google Scholar] [CrossRef]
- Yang, Q.; Chen, G.; Liao, S.; Zhao, Y.; Peng, H.; Chen, H. Environmental sustainability of wind power: An emergy analysis of a Chinese wind farm. Renew. Sustain. Energy Rev. 2013, 25, 229–239. [Google Scholar] [CrossRef]
- Yang, J.; Chen, B. Emergy-based sustainability evaluation of wind power generation systems. Appl. Energy 2016, 177, 239–246. [Google Scholar] [CrossRef]
- Zhang, X.; Xu, L.; Chen, Y.; Liu, T. Emergy-based ecological footprint analysis of a wind farm in China. Ecol. Indic. 2020, 111, 106018. [Google Scholar] [CrossRef]
- Paoli, C.; Vassallo, P.; Fabiano, M. Solar power: An approach to transformity evaluation. Ecol. Eng. 2008, 34, 191–206. [Google Scholar] [CrossRef]
- Zhang, M.; Wang, Z.; Xu, C.; Jiang, H. Embodied energy and emergy analyses of a concentrating solar power (CSP) system. Energy Policy 2012, 42, 232–238. [Google Scholar] [CrossRef]
- Giannetti, B.F.; Barrella, F.; Almeida, C. A combined tool for environmental scientists and decision makers: Ternary diagrams and emergy accounting. J. Clean. Prod. 2006, 14, 201–210. [Google Scholar] [CrossRef]
- Almeida, C.; Barrella, F.; Giannetti, B.F. Emergetic ternary diagrams: Five examples for application in environmental accounting for decision-making. J. Clean. Prod. 2007, 15, 63–74. [Google Scholar] [CrossRef]
- Haaf, W.; Friedrich, K.; Mayr, G.; Schlaich, J. Solar Chimneys Part I: Principle and Construction of the Pilot Plant in Manzanares. Int. J. Sol. Energy 1983, 2, 3–20. [Google Scholar] [CrossRef]
- Schlaich, J.; Bergermann, R.; Schiel, W.; Weinrebe, G. Sustainable Electricity Generation with Solar Updraft Towers. Struct. Eng. Int. 2004, 14, 225–229. [Google Scholar] [CrossRef]
- Schlaich, J.; Bergermann, R.; Schiel, W.; Weinrebe, G. Design of Commercial Solar Tower Systems: Utilization of Solar Induced Convective Flows for Power Generation. Sol. Energy 2003, 127, 573–581. [Google Scholar] [CrossRef]
- Mullett, L.B. The solar chimney—overall efficiency, design and performance. Int. J. Ambient. Energy 1987, 8, 35–40. [Google Scholar] [CrossRef]
- Ming, T.; Liu, W.; Wu, Y.; Gui, J.; Peng, K.; Pan, T. Introduction; Elsevier BV: Amsterdam, The Netherlands, 2016; pp. 1–46. [Google Scholar]
- Fluri, T.; Pretorius, J.; Van Dyk, C.; Von Backström, T.; Kröger, D.; Van Zijl, G. Cost analysis of solar chimney power plants. Sol. Energy 2009, 83, 246–256. [Google Scholar] [CrossRef]
- Okoye, C.O.; Solyalı, O.; Taylan, O. A new economic feasibility approach for solar chimney power plant design. Energy Convers. Manag. 2016, 126, 1013–1027. [Google Scholar] [CrossRef]
- Guo, P.; Zhai, Y.; Xu, X.; Li, J. Assessment of levelized cost of electricity for a 10-MW solar chimney power plant in Yinchuan China. Energy Convers. Manag. 2017, 152, 176–185. [Google Scholar] [CrossRef]
- Van Blommestein, B.; Mbohwa, C. Life Cycle Assessment of Solar Chimneys. In Re-engineering Manufacturing for Sustainability; Springer Science and Business Media LLC: Berlin/Heidelberg, Germany, 2013; pp. 535–541. [Google Scholar]
- Elsayed, I.; Nishi, Y. A Feasibility Study on Power Generation from Solar Thermal Wind Tower: Inclusive Impact Assessment Concerning Environmental and Economic Costs. Energies 2018, 11, 3181. [Google Scholar] [CrossRef]
- EnviroMission Limited. Available online: http://www.enviromission.com.au (accessed on 30 July 2020).
- Shimizu Corporation. Available online: https://www.shimz.co.jp (accessed on 30 July 2020).
- Yang, J.; Chang, Y.; Zhang, L.; Hao, Y.; Yan, Q.; Wang, C. The life-cycle energy and environmental emissions of a typical offshore wind farm in China. J. Clean. Prod. 2018, 180, 316–324. [Google Scholar] [CrossRef]
- Nian, V.; Liu, Y.; Zhong, S. Life cycle cost-benefit analysis of offshore wind energy under the climatic conditions in Southeast Asia—Setting the bottom-line for deployment. Appl. Energy 2019, 233–234, 1003–1014. [Google Scholar] [CrossRef]
- Hau, J.L.; Bakshi, B.R. Promise and problems of emergy analysis. Ecol. Model. 2004, 178, 215–225. [Google Scholar] [CrossRef]
- Ren, S.; Feng, X.; Yang, M. Emergy evaluation of power generation systems. Energy Convers. Manag. 2020, 211, 112749. [Google Scholar] [CrossRef]



| Item | SUT Power Generation Capacity | |||
|---|---|---|---|---|
| 5 MW | 30 MW | 100 MW | 200 MW | |
| Tower Height (m) | 550 | 750 | 1000 | 1000 |
| Tower Diameter (m) | 45 | 90 | 110 | 120 |
| Collector Diameter (m) | 1250 | 3750 | 4300 | 7000 |
| Collector Height (m) | 3 | 3 | 3 | 3 |
| Electricity Output 1 (GWh/y) | 14 | 99 | 320 | 680 |
| Item | Material | SUT Power Generation Capacity | ||||
|---|---|---|---|---|---|---|
| 5 MW | 30 MW | 100 MW | 200 MW | |||
| Components’ manufacturing materials | ||||||
| Tower | Concrete (ton) | 4.54 × 10⁵ | 4.54 × 10⁵ | 8.26 × 10⁵ | 8.26 × 10⁵ | |
| Collector | Glass (ton) | 1.27 × 10⁴ | 6.82 × 10⁴ | 1.60 × 10⁵ | 3.97 × 10⁵ | |
| Turbines | Resin and fiberglass (ton) | 2.42 × 10² | 1.21 × 10³ | 5.54 × 10³ | 9.68 × 10³ | |
| Iron (ton) | 1.19 × 10² | 5.94 × 10² | 2.01 × 10³ | 4.75 × 10³ | ||
| Steel (ton) | 5.93 × 101 | 2.97 × 10² | 8.18 × 10² | 2.37 × 10³ | ||
| Copper (ton) | 9.60 × 100 | 4.80 × 101 | 1.33 × 10² | 3.84 × 10² | ||
| Silica (ton) | 1.00 × 100 | 5.00 × 100 | 1.28 × 101 | 4.00 × 101 | ||
| Installation | ||||||
| Transportation of materials | Diesel fuel (J) | 9.43 × 10¹⁴ | 1.07 × 10¹⁵ | 1.94 × 10¹⁵ | 2.49 × 10¹⁵ | |
| Construction works | Reinforcement of tower | Steel (ton) | 1.65 × 10⁴ | 2.25 × 10⁴ | 3.00 × 10⁴ | 3.00 × 10⁴ |
| Collector’s load-bearing structure | Steel (ton) | 6.47 × 10⁴ | 6.47 × 10⁴ | 9.60 × 10⁴ | 1.56 × 10⁵ | |
| Collector’s foundations | Concrete (ton) | 7.27 × 10³ | 1.69 × 10⁴ | 2.50 × 10⁴ | 4.07 × 10⁴ | |
| Machinery | Electricity (MWh) | 6.00 × 10⁴ | 1.10 × 10⁵ | 1.50 × 10⁵ | 2.00 × 10⁵ | |
| Item | Quantity | Unit | Transformity (sej/Unit) | Emergy (sej) | |
|---|---|---|---|---|---|
| Energy source | |||||
| Solar energy (R) | 9.56 × 10¹⁸ | J | 1.00 × 100 [7] | 9.56 × 10¹⁸ | |
| Power plant area | |||||
| Land use (N) | 3.85 × 10⁷ | m2/y | 8.00 × 10¹⁰ [15] | 9.24 × 10¹⁹ | |
| Components’ manufacturing materials | |||||
| Tower | Concrete (F) | 8.26 × 10⁵ | ton | 5.08 × 10¹⁴ [3] | 4.19 × 10²⁰ |
| Canopy | Glass (F) | 3.97 × 10⁵ | ton | 1.90 × 10¹⁵ [17] | 7.55 × 10²⁰ |
| Turbines | Resin and fiberglass (F) | 9.68 × 10³ | ton | 8.07 × 10¹⁵ [14] | 7.81 × 10¹⁹ |
| Iron (F) | 4.75 × 10³ | ton | 8.60 × 10¹⁴ [16] | 4.09 × 10¹⁸ | |
| Steel (F) | 2.37 × 10³ | ton | 2.77 × 10¹⁵ [3] | 6.57 × 10¹⁸ | |
| Copper (F) | 3.84 × 10² | ton | 2.00 × 10¹⁵ [3] | 7.68 × 10¹⁷ | |
| Silica (F) | 4.00 × 101 | ton | 1.68 × 10¹⁵ [16] | 6.72 × 10¹⁶ | |
| SUBTOTAL | 1.26 × 10²¹ | ||||
| Installation | |||||
| Transportation | Diesel fuel (F) | 2.49 × 10¹⁵ | J | 6.60 × 10⁴ [7] | 1.64 × 10²⁰ |
| Construction works | Steel reinforcement of tower (F) | 3.00 × 10⁴ | ton | 4.82 × 10¹⁵ [16] | 7.53 × 10²⁰ |
| Steel load-bearing structure (F) | 1.56 × 10⁵ | ton | 4.82 × 10¹⁵ [16] | 1.45 × 10²⁰ | |
| Concrete foundations (F) | 4.07 × 10⁴ | ton | 5.08 × 10¹⁴ [3] | 2.07 × 10¹⁹ | |
| Electricity for machinery (F) | 7.20 × 10¹⁴ | J | 1.85 × 10⁵ [3] | 1.33 × 10²⁰ | |
| SUBTOTAL | 1.22 × 10²¹ | ||||
| Maintenance resources | |||||
| Turbine substitution (33% replacement rate) (F) | 5.69 × 10³ | ton | 2.96 × 10¹⁹ | ||
| Human labor and services | |||||
| Other costs for installation (26%R and 74%F) | 5.04 × 10⁷ | US$ | 5.87 × 10¹² [36] | 2.96 × 10²⁰ | |
| Labor and services for operation (26%R and 74%F) | 1.22 × 10⁸ | US$ | 5.87 × 10¹² [36] | 7.18 × 10²⁰ | |
| TOTAL | |||||
| Total emergy without human labor and services | 2.61 × 10²¹ | ||||
| Total emergy with human labor and services | 3.63 × 10²¹ | ||||
| Production | |||||
| Electricity output | 2.45 × 10¹⁵ | J/y | |||
| Emergy Flow | SUT Power Generation Capacity | ||||
|---|---|---|---|---|---|
| 5 MW | 30 MW | 100 MW | 200 MW | ||
| Environmental renewable resources (sej) | 2.05 × 10¹⁹ | 7.49 × 10¹⁹ | 1.81 × 10²⁰ | 2.73 × 10²⁰ | |
| Environmental nonrenewable resources (sej) | 2.95 × 10¹⁸ | 1.59 × 10¹⁹ | 3.49 × 10¹⁹ | 9.24 × 10¹⁹ | |
| Purchased resources (sej) | 8.13 × 10²⁰ | 1.16 × 10²¹ | 2.14 × 10²¹ | 3.26 × 10²¹ | |
| Total 1 | Total emergy flows, without human labor and services (sej) | 7.58 × 10²⁰ | 9.65 × 10²⁰ | 1.68 × 10²¹ | 2.61 × 10²¹ |
| Total 2 | Total emergy flows, with human labor and services (sej) | 8.36 × 10²⁰ | 1.25 × 10²¹ | 2.36 × 10²¹ | 3.63 × 10²¹ |
| AEP | Annual energy production (J/y) | 5.04 × 10¹³ | 3.56 × 10¹⁴ | 1.15 × 10¹⁵ | 2.45 × 10¹⁵ |
| Power Generation Technology | ||||||||
|---|---|---|---|---|---|---|---|---|
| Solar Updraft Tower Systems | ||||||||
| #1 | 5 MW | 6.82 × 10¹⁷ | 9.82 × 10¹⁶ | 2.71 × 10¹⁹ | 5.53 × 10⁵ | 1.03 | 39.88 | 0.03 |
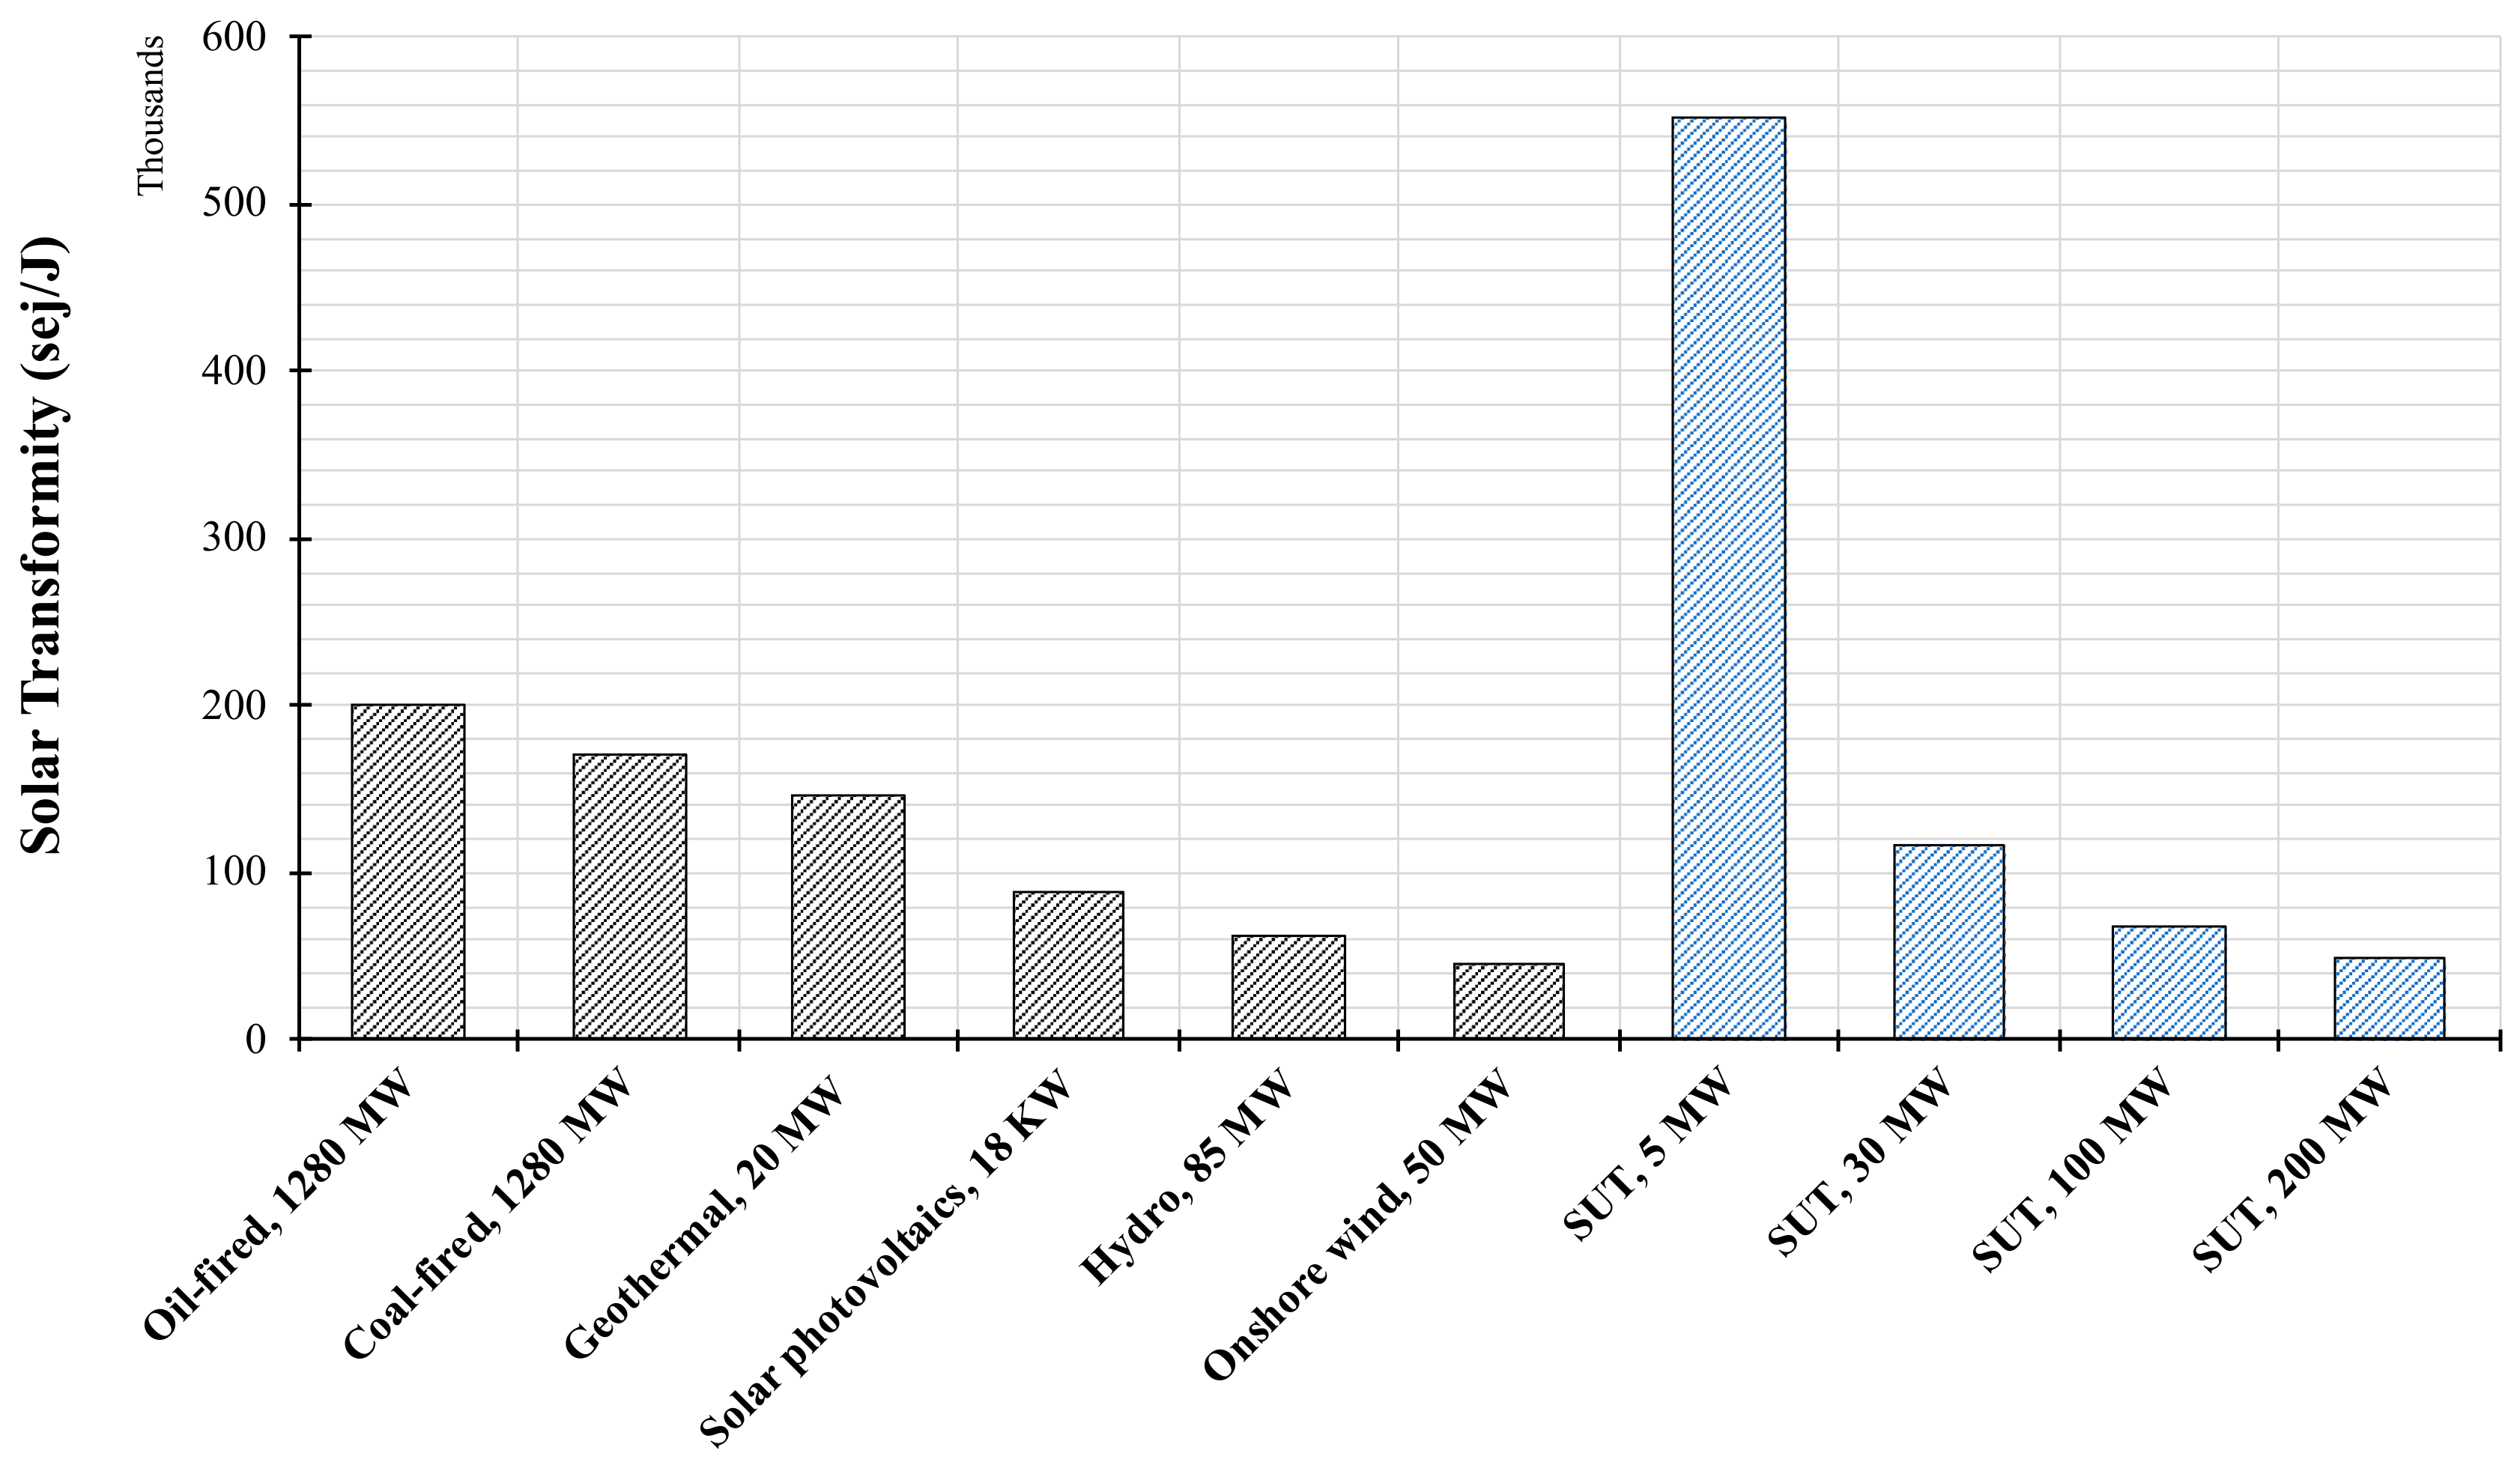
| #2 | 50 MW | 2.50 × 10¹⁸ | 5.28 × 10¹⁷ | 3.85 × 10¹⁹ | 1.17 × 10⁵ | 1.08 | 15.65 | 0.07 |
| #3 | 100 MW | 6.04 × 10¹⁸ | 1.16 × 10¹⁸ | 7.14 × 10¹⁹ | 6.82 × 10⁴ | 1.10 | 12.01 | 0.09 |
| #4 | 200 MW | 9.11 × 10¹⁸ | 3.08 × 10¹⁸ | 1.09 × 10²⁰ | 4.94 × 10⁴ | 1.11 | 12.27 | 0.09 |
| Renewable Power Generation | ||||||||
| #5 | Solar photovoltaics, 18 kW [17] | 1.00 × 10¹⁴ | 3.05 × 10¹³ | 4.88 × 10¹⁵ | 8.92 × 10⁴ | 1.03 | 48.93 | 0.02 |
| #6 | Onshore wind, 50 MW [15] | 2.64 × 10¹⁸ | 1.08 × 10¹⁶ | 1.54 × 10¹⁹ | 4.49 × 10⁴ | 1.17 | 5.84 | 0.20 |
| #7 | Geothermal, 20 MW [3] | 3.36 × 10¹⁹ | 4.61 × 10¹⁸ | 1.00 × 10¹⁹ | 1.47 × 10⁵ | 4.81 | 0.44 | 11.05 |
| #8 | Hydro, 85 MW [3] | 1.69 × 10¹⁹ | 4.45 × 10¹⁸ | 3.21 × 10¹⁸ | 6.23 × 10⁴ | 7.65 | 0.45 | 16.90 |
| Conventional Power Generation | ||||||||
| #9 | Oil-fired, 1280 MW [3] | 3.12 × 10²⁰ | 3.32 × 10²¹ | 1.13 × 10²¹ | 2.00 × 10⁵ | 4.21 | 14.24 | 0.30 |
| #10 | Coal-fired, 1280 MW [3] | 3.68 × 10²⁰ | 3.05 × 10²¹ | 7.63 × 10²⁰ | 1.71 × 10⁵ | 5.48 | 10.37 | 0.53 |
Publisher’s Note: MDPI stays neutral with regard to jurisdictional claims in published maps and institutional affiliations. |
© 2020 by the authors. Licensee MDPI, Basel, Switzerland. This article is an open access article distributed under the terms and conditions of the Creative Commons Attribution (CC BY) license (http://creativecommons.org/licenses/by/4.0/).
Share and Cite
Elsayed, I.; Nishi, Y. Emergy and Sustainability Ternary Diagrams of Energy Systems: Application to Solar Updraft Tower. Sustainability 2020, 12, 10546. https://doi.org/10.3390/su122410546
Elsayed I, Nishi Y. Emergy and Sustainability Ternary Diagrams of Energy Systems: Application to Solar Updraft Tower. Sustainability. 2020; 12(24):10546. https://doi.org/10.3390/su122410546
Chicago/Turabian StyleElsayed, Islam, and Yoshiki Nishi. 2020. "Emergy and Sustainability Ternary Diagrams of Energy Systems: Application to Solar Updraft Tower" Sustainability 12, no. 24: 10546. https://doi.org/10.3390/su122410546
APA StyleElsayed, I., & Nishi, Y. (2020). Emergy and Sustainability Ternary Diagrams of Energy Systems: Application to Solar Updraft Tower. Sustainability, 12(24), 10546. https://doi.org/10.3390/su122410546


