Article

The Evolutionary Game of Stakeholders’ Coordination Mechanism of New Energy Power Construction PPP Project: A China Case

School of Economics and Management, Beijing Key Laboratory of New Energy and Low-Carbon Development, North China Electric Power University, Changping, Beijing 102206, China
*
Author to whom correspondence should be addressed.
Sustainability 2020, 12(3), 1045; https://doi.org/10.3390/su12031045
Submission received: 4 December 2019 / Revised: 21 January 2020 / Accepted: 29 January 2020 / Published: 2 February 2020
(This article belongs to the Special Issue Energy Market Reform and Sustainability)

Abstract

:
The government, investors, and the public have formed a dynamic multi-game relationship on the Public-Private-Partnership (PPP) project, but few studies include them in a system to study their win–win solutions. Firstly, we constructed a tripartite game model of the government, investors, and the public based on evolutionary game theory. Secondly, the evolutionary process of tripartite strategy behaviors was studied with the system dynamics (SD) model. Finally, the impact of changes in key factors on behavior strategies was studied through sensitivity analysis. The results show the following: (1) In the outsourcing of new energy and power construction PPP projects, the three parties will eventually reach the equilibrium state of {government supervision, public participation, investors effort}, the three parties achieve a win–win situation and the project benefits are the highest at this time, and the public participation will play an important role in promoting the smooth outsourcing of PPP projects. (2) The strategic choices of the government, investors, and the public are sensitive to changes in the corresponding exogenous variables. (3) The security factor plays a crucial role in the choice of public strategy. The public’s choice is not only affected by its own income and cost, but also by the amount of compensation promised by the government and the estimated damage caused by the investor.

1. Introduction

The Public-Private-Partnership (PPP) model refers to a partnership between the government and private organizations based on a franchise agreement to provide certain public goods and services. The government accelerates the construction and effective operation by giving private companies long-term franchise and income rights in exchange for infrastructure [1]. China is facing the increasingly worse environment and rising pressure of emission reduction from home and abroad [2]. Therefore, in order to promote the adjustment of energy structure and the sustainable development of the economy, China urgently needs to further innovate the investment and financing mechanism in the key areas such as public service, resource environment, ecological construction and infrastructure, in order to give full play to the positive role of social capital, especially the private capital [3]. Based on this, the Chinese National Energy Administration issued the Notice on Actively Promoting the Cooperation Model of Government and Social Capital in the Energy Sector in March 2016 (it should be noted that the social capital in this paper refers to the investment of private organizations in PPP), which encourages social capital to participate in the construction of new energy and power PPP projects and emphasizes the formation of a supervisory mechanism involving the joint participation of government supervisors, investors, and the public [4]. In July 2018, 183 PPP projects were completed in China, totaling 29,099 billion dollars. More than 76% of the private capital involved in PPP projects came from state-owned enterprises, while private unlisted companies and listed companies accounted for 15% and 9%, respectively.
China is at a critical stage of energy reform. The introduction of PPP projects helps promote the reform of the energy market and the sustainable development of new energy. Promoting the cooperation between government and social capital in the energy field is conducive to breaking the irrational restrictions on social capital’s access to energy infrastructure and public services, introducing social capital innovation mechanisms, and improving supply efficiency. It is conducive to streamlining the relationship between the government and the market, deepening the reform of the administrative system, and giving full play to the decisive role of the market in allocating resources. Through the use of the PPP model, the enthusiasm of social capital to participate in the energy projects construction is fully mobilized and the level of public services in the energy field is effectively improved, which meet the people’s requirements for energy security, reliable, and clean supply and enjoy the fruits of energy reform and development.
In response to the speculative behavior that may be caused by the information asymmetry between investors and the government in the PPP project, the government should adopt corresponding regulatory strategies to safeguard the interests of all parties. Some scholars use evolutionary game theory to quantitatively study the interaction between government regulation strategies and investor investment strategies. Gao and Zhao studied the evolutionary game behavior strategy of the government and investors in the new energy power PPP project [1]. Song et al. proposed an effective method for assessing the compensation amount of PPP projects for incomplete contract new energy power construction through game analysis between the government and investors [5]. Jumbe and Mkondiwa analyzed the game relationship between the sub Saharan African governments and investors, and examined the extent to which the existing biofuel policies and strategies adopt the PPP model and whether the existing policies enhanced or hindered the relationship between the government and the investors [6]. Zhao et al. studied the stakeholders of corporate social responsibility in construction industry based on the stakeholder theory [7]. Burke and Demirag studied the stakeholder management strategies of enterprises and governments involved in the construction of Irish roads [8]. Clerck and Demeulemeester established the bidding model of PPP project investors based on game theory, and studied the influence of government on bidding results [9]. In view of investors’ speculative behavior, Gao and Bao studied the problem of government’s strategic choice based on the evolutionary game model between investors and government [10]. Zhang et al. found that subsidy mechanism could significantly affect contractors’ behaviors in some cases, and the owner could make full use of subsidy mechanism to cope with contractors’ opportunistic behaviors [11]. Yang and Zhang conducted research on motivating investors to participate in the ppp project. By studying the impact of relevant parameters on the evolutionary equilibrium point, they analyzed the incentive effect of incentives such as taxation and subsidies on investors [12].
As the research deepens, the public as a third party is also considered to be included in the regulatory system. James et al. pointed out that public service outsourcing can reduce public criticism of politicians due to the failure of public service provision [13]. As the public has the ability to distinguish the level of public services, the public evaluation has played a role in public service supervision to a certain extent [14]. Therefore, the government should fully consider the public’s right to know and participate, to make up for the lack of supervision mechanism [15]. Li et al. analyzed the evolutionary game laws of investors and government regulators in the PPP project, and studied the influence of public participation on the behavior of the government and investors [16]. Yang revealed the game strategy change of encouraging green retrofits and implementing green retrofits in government groups and investment groups through an evolutionary game analysis on PPP reconstruction of buildings [17]. Fang suggested a PPP program which encourages investment companies to cooperate with residents to promote the usage of solar power, and an evolutionary game model was established considering three populations [18]. Wang found that the public engagement through new media, government reputation, incentive mechanism, the discovering probability of defaulting behaviors and the punishment measures were the main factors for the private investors to make decision on the defaulting behaviors [19]. Guo and Li found that the government, the public, and investors could finally reach a balanced state of government supervision, owners’ participation, and private sectors effort. In the process of strategy evolution, the government played a leading role. The strategy choice of investors and the public depended on the strategy of the government. The final operation of PPP project depended on the cost and benefit of all parties [20]. Li et al. found that the supervision strategy was not chosen when the supervision cost of government supervision department was greater than the supervision benefit; it could make private sector consciously provide the high-quality public products/services with the improvement of public participation level [21].
In summary, the existing literature use evolutionary game model to study the strategy selection of PPP parties from various perspectives, providing a basic model and complete influencing factors for future research. In the evaluation of PPP projects, the government usually carries out a cost-benefit analysis. The investor performs an economic-financial analysis, and the public votes and elects political decision makers based on their own ideals and preferences.
However, the government, investors, and the public have formed a dynamic multi game relationship on the PPP project problem. Their strategy evolution process is dynamic, and few of studies include the three parts in an integral system to study the win-win solution. If only a simple one-way linear analysis is adopted, it is difficult to reveal the internal mechanism of the interaction between the players. In the game, participants cannot be completely rational, their decisions are in sequence and could deviate from expectations, and the information obtained is asymmetric. On this basis, this paper combines the evolutionary game theory with system dynamics (SD) model to study the dynamic characteristics of the government, investors, and the public in the PPP project of the new energy power construction to reveal the behavior choices of the parties to build a cooperative mechanism and form a stable strategy, in order to construct the long-term mechanism of the benign effect of the PPP project. With the help of mathematical models and computer simulations, the equilibrium point of the game was determined to provide decision support for the new energy and power construction PPP project. The main purpose of this study was to use evolutionary game theory to reveal the strategic choices of government, investors, and the public to promote the smooth construction of PPP projects.

2. Methodology

Under the framework of traditional game theory research, the research object is often assumed to be completely rational, which ignores the fact that human beings have analytical reasoning and learning ability in economic activities [
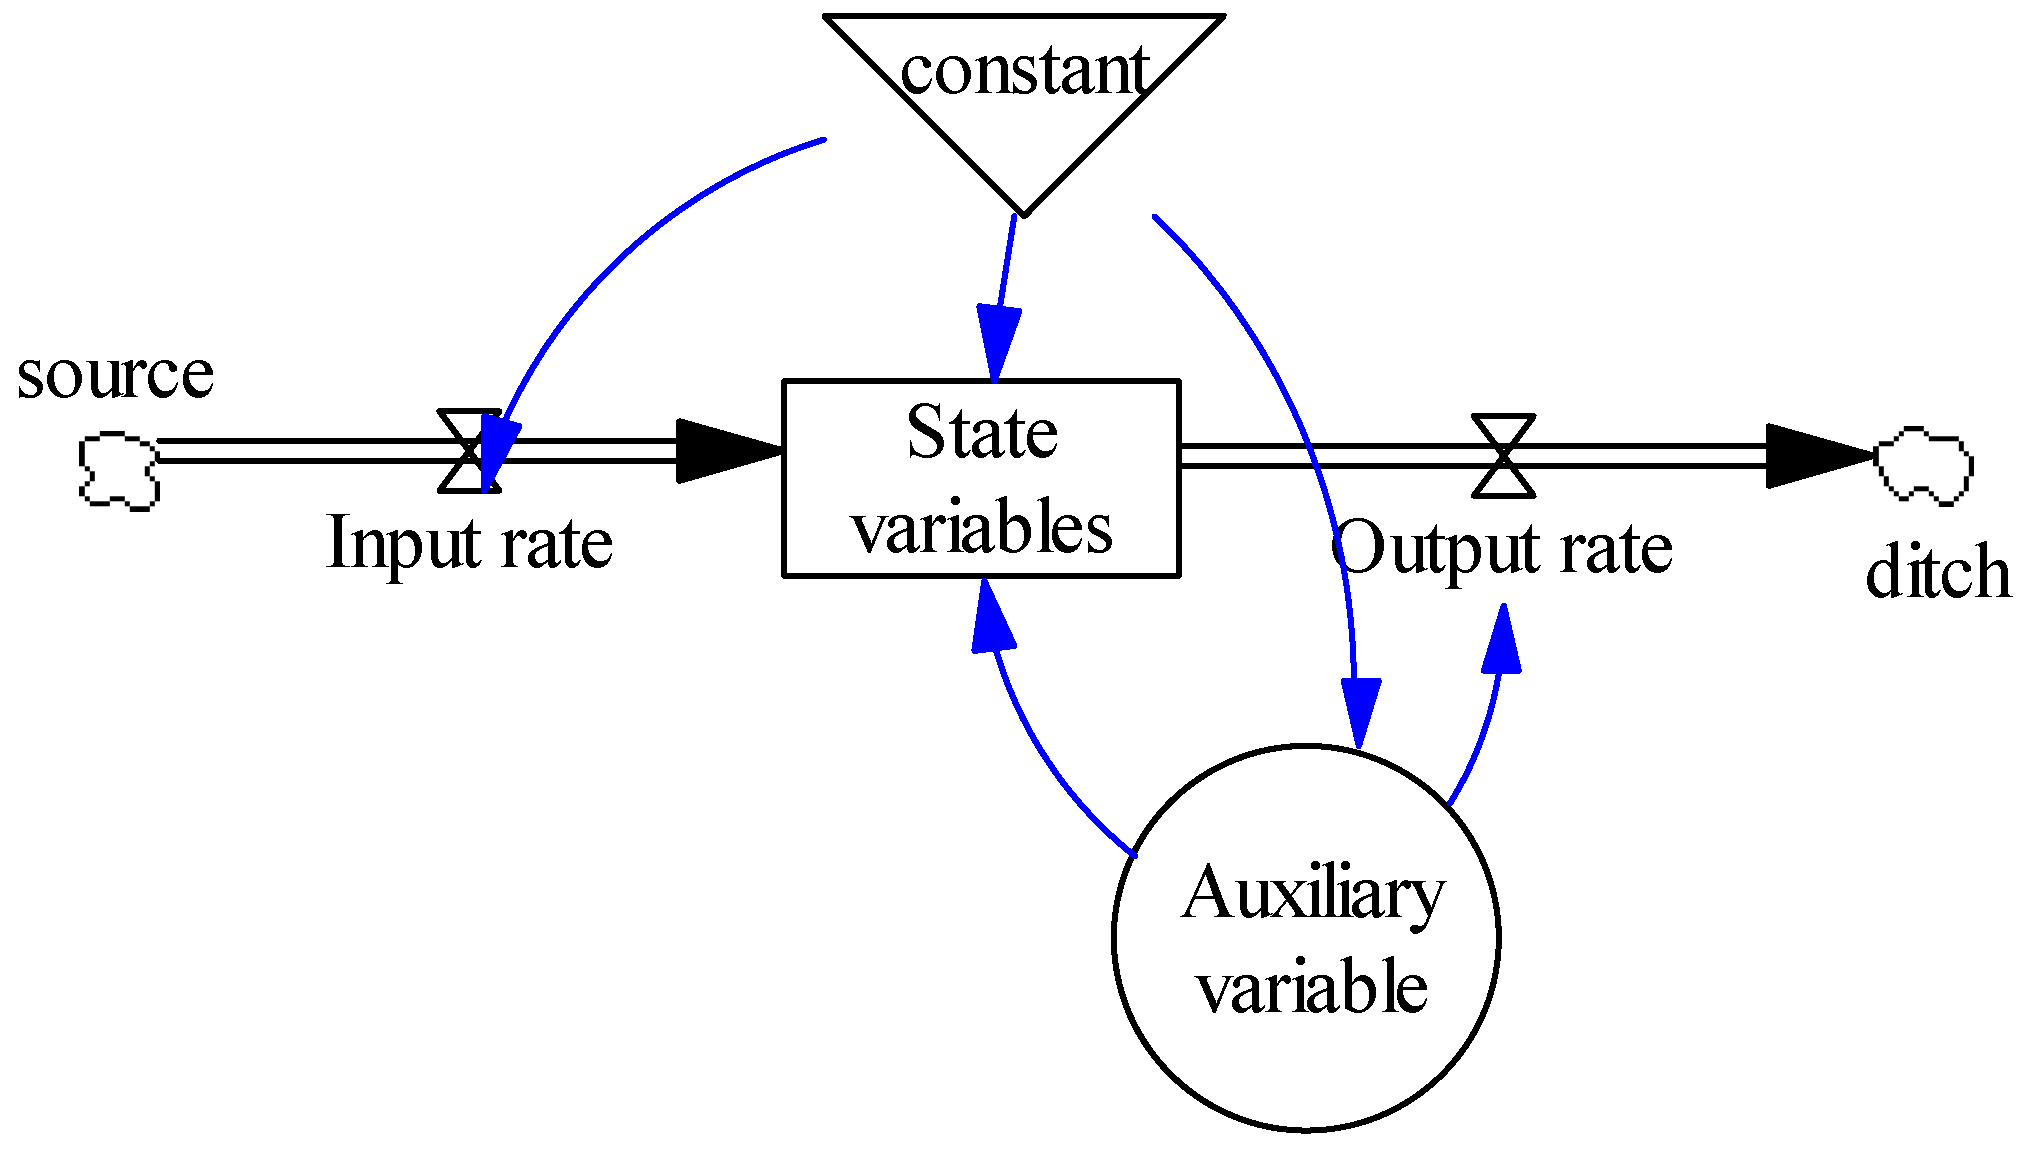
1]. The evolutionary game theory adopted in this study holds that participants are only rational economic men with limited rationality, and they usually obtain relevant strategies based on a transfer mechanism rather than rational choice. Each strategy choice of participants has its corresponding strategic revenue and the probability of participants choosing the strategy. In the process of multiple dynamic games, the theory transforms human behavior into a gradual evolutionary process with learning ability and adaptability. It shows that each higher-yield strategy in the game will replace the lower-yield strategy and finally, forms a stable evolutionary equilibrium strategy through repeated games. Obviously, the equilibrium emphasized by evolutionary game is the result of learning and adjustment rather than the result of selection, which is consistent with the simulation and simulation characteristics of SD. SD is a science that closely combines system science theory with computer simulation to study the structure and behavior of system feedback. It can combine other theories for interdisciplinary researches. The research method combining SD and evolutionary game theory has been applied in engineering project management and other fields; for example, Liu et al. combined multi-agent game with SD to discuss the long-term dynamic game process of stakeholders in coal mine safety production project under bounded rationality [22]. Xie et al. proposed the behavior strategy model of central government, local government and farmers in cultivated land protection project based on evolutionary game, and simulated the system changes under different strategies through SD simulation [23]. Thus, the combination of SD and evolutionary game theory is helpful to the dynamic study of the optimal strategy of each player, which makes the whole evolutionary game process reach equilibrium.
The basic principle of SD problem solving can be divided into five steps. The first step is to systematically and comprehensively understand, investigate and analyze the objects under study using the theory, principles and methods of system dynamics. The second step is to analyze the structure of the system, divide the system hierarchy and sub-blocks, and determine the overall and local feedback mechanism. The third step is to build a quantitative and standardized model using the soft partner of drawing modeling. The fourth step is to use the model for simulation and policy analysis to further analyze the system to get more information, discover new problems, and then repeatedly modify the model. The fifth step is to test the evaluation model. The above main processes and steps can be represented by Figure 1.
Determining the state, speed and auxiliary variables of the system, establishing the quantitative relationship between the main variables, representing different variables with different symbols, and connecting the various symbols representing different variables with arrow lines, a flow chart reflecting the structure of the system is formed (as shown in Figure 2). By designing each nonlinear table function and determining and estimating various parameters, and assigning values to all equations and table functions, the model can be simulated.

2.1. Analysis of Game Players’ Relationships

The term “PPP” is typically used to describe a long-term contractual arrangement for the provision of a public asset and related services in exchange for performance-based payments linked to the asset’s availability and/or use and the delivery of the related services. All contracts signed by government departments and social institutions for the operation of public infrastructure and the provision of public services are regarded as PPP models. The level of PPP development and measures adopted by member states of the European Union vary greatly. Some countries, such as Austria, Denmark, Germany, Ireland, Italy, the Netherlands, Portugal and the United Kingdom, set up PPP specialized institutions for management. Some countries, such as France, Germany, Greece, Portugal, Spain and Turkey, set up mechanisms or systems to constrain PPP through a series of laws. China has set up China Public Private Partnerships Center to manage PPP projects. Although this paper takes China as an example, the relevant formulas and models involved are universal and will be explained later.
In the PPP project, the government, as policy makers and regulators, stipulates the quantity and quality standards of the projects, and entrusts investors to build PPP projects and provide them with public consumption. The investors, as producers of PPP projects, can understand the public demand and production cost, product quality, and other information. As the ultimate consumer of the PPP project, the public directly senses the value of the project and feeds it back to the government. The game antagonistic relationship of the three parties is that the backbone of the PPP is made by government + investors. Then, the government is linked primarily to the public since they share a common interest. Thus, the main confrontation is government + public versus investors. Investor players are backed by their lending banks (and sub-contractors) that represent a key stakeholder in capital-intensive problems. The specific relationship among the three parties of the game is analyzed as follows.
(1) The game between the government and investors
In the process of PPP project outsourcing, the government wants to outsource the management rights of PPP projects to enterprise with market experience and provide more specialized services for the public. It is mainly decided by how the government supervises the investors. Because of information asymmetry and inconsistent objectives, investors will have more opportunistic behavioral tendencies if the government cannot effectively monitor the behavior of investment portfolios (although both the government and investors hope that the PPP project can go on smoothly, their goals are different. The government’s goal is to maximize the benefits brought by PPP as much as possible, while investors’ goal is to maximize the operating benefits of PPP project itself, which makes the two payment functions different) [24]. For example, it is possible for investors to take the benefits of the public and the government to maximize their interests. At this time, the government needs to adopt supervision mechanism and carry out certain punishment to transfer the risk caused by information asymmetry. However, opportunistic private behaviour is mitigated by competition in the tender, and possibly by pay-for-performance remuneration pattern.
The government must pay costs for the implementation of supervision. Moreover, the more the government invests in supervision, the greater the supervision of the investors, the greater the punishment, and the more likely investors choose to make efforts. The more investors invest in project’s risk management and control, the higher the service quality of power construction, the more they can be well received by the public, and the more likely they are to be recognized by the government and obtain long-term contracts. On the contrary, if the government fails to supervise, investors’ efforts will lead to public dissatisfaction, thereby bringing losses to the government. Therefore, the costs and profits of supervision are the focuses of game between the government and investors.
(2) The game between the government and the public
In the process of outsourcing the PPP project to the investor, the government and investors formulate a contract to stipulate the rights and responsibilities of both parties. This explicit contract is achievable in practice. Although there is a principal-agent relationship between the government and the public, the implicit contract relationship actually affects the realization of the contract. Therefore, in the outsourcing contract, there is no direct relationship between the government and the public. However, the purpose of the government’s PPP project is to meet the needs of the public. As consumers, the public should have the most say in the results of the PPP project. Moreover, from the perspective of practice, public satisfaction has increasingly attracted the attention of government departments, and the public’s evaluation has become more and more important in government decision-making [25]. As the main responsible person of service outsourcing, the government has the responsibility of finding suitable investors for the public to replace the government’s functions in fulfilling PPP projects [26]. Therefore, it is necessary for the public to participate in the process of outsourcing PPP projects. Whitaker points out that many public services require the active participation of the general public, especially those who will be directly beneficiaries of services [27]. Public participation will help improve the quality of PPP projects and increase public satisfaction and trust in the public sector.
Since the government must consider the wishes of the public in the process of providing PPP projects, the government’s strategy is to “encourage the public’s participation” and “disallow the public’s participation” in the face of public participation. From the government’s point of view, public satisfaction should be the starting point and end result of the government’s provision of PPP projects. Therefore, the choice of “encouraging public participation” is the best decision. From the perspective of the public, there are two strategic choices of “participation” and “no participation”. The participation strategy can enhance the perceived value of the public to the project, and then express the objective consumption intention to the government, so as to maintain or improve the PPP project. However, public participation will incur participation costs and opportunity costs (we collectively refer to the public’s participation costs), as well as the loss of profits that investors do not strive to bring to the public. If the public does not participate in the project, it will not benefit from the service and incur participation costs. Therefore, the trade-off between cost and benefit is the main influencing factor of public participation [28]. When the PPP project brings losses to the public, the government should provide corresponding compensation. Therefore, the government should pay attention not only to the benefits obtained through PPP projects, but also to meeting the value compensation expectations of public participation.
(3) The game between the government+ public versus investors
Although investors and the government directly sign the PPP project contract and accept the supervision and management of the government, the target of investors is the public, whose evaluation is the main basis for the government to approve investors or not. Thus, although there is no direct contractual relationship between the public and investors, there is a direct interest relationship.
Whether investors make efforts is a factor that cannot be ignored by the public. However, for investors, in the absence of government supervision, they do not want to make more efforts, because investors do not bear the cost of harming the public interest, and will not actively raise the level of service efforts. Under the conditions of government supervision, investors will increase the cost of efforts, or bear the penalty cost of not working hard. Both of these costs are closely related to the perceived value of the public. Therefore, investors’ effort cost and penalty cost are the focuses of the game between investors and the public.
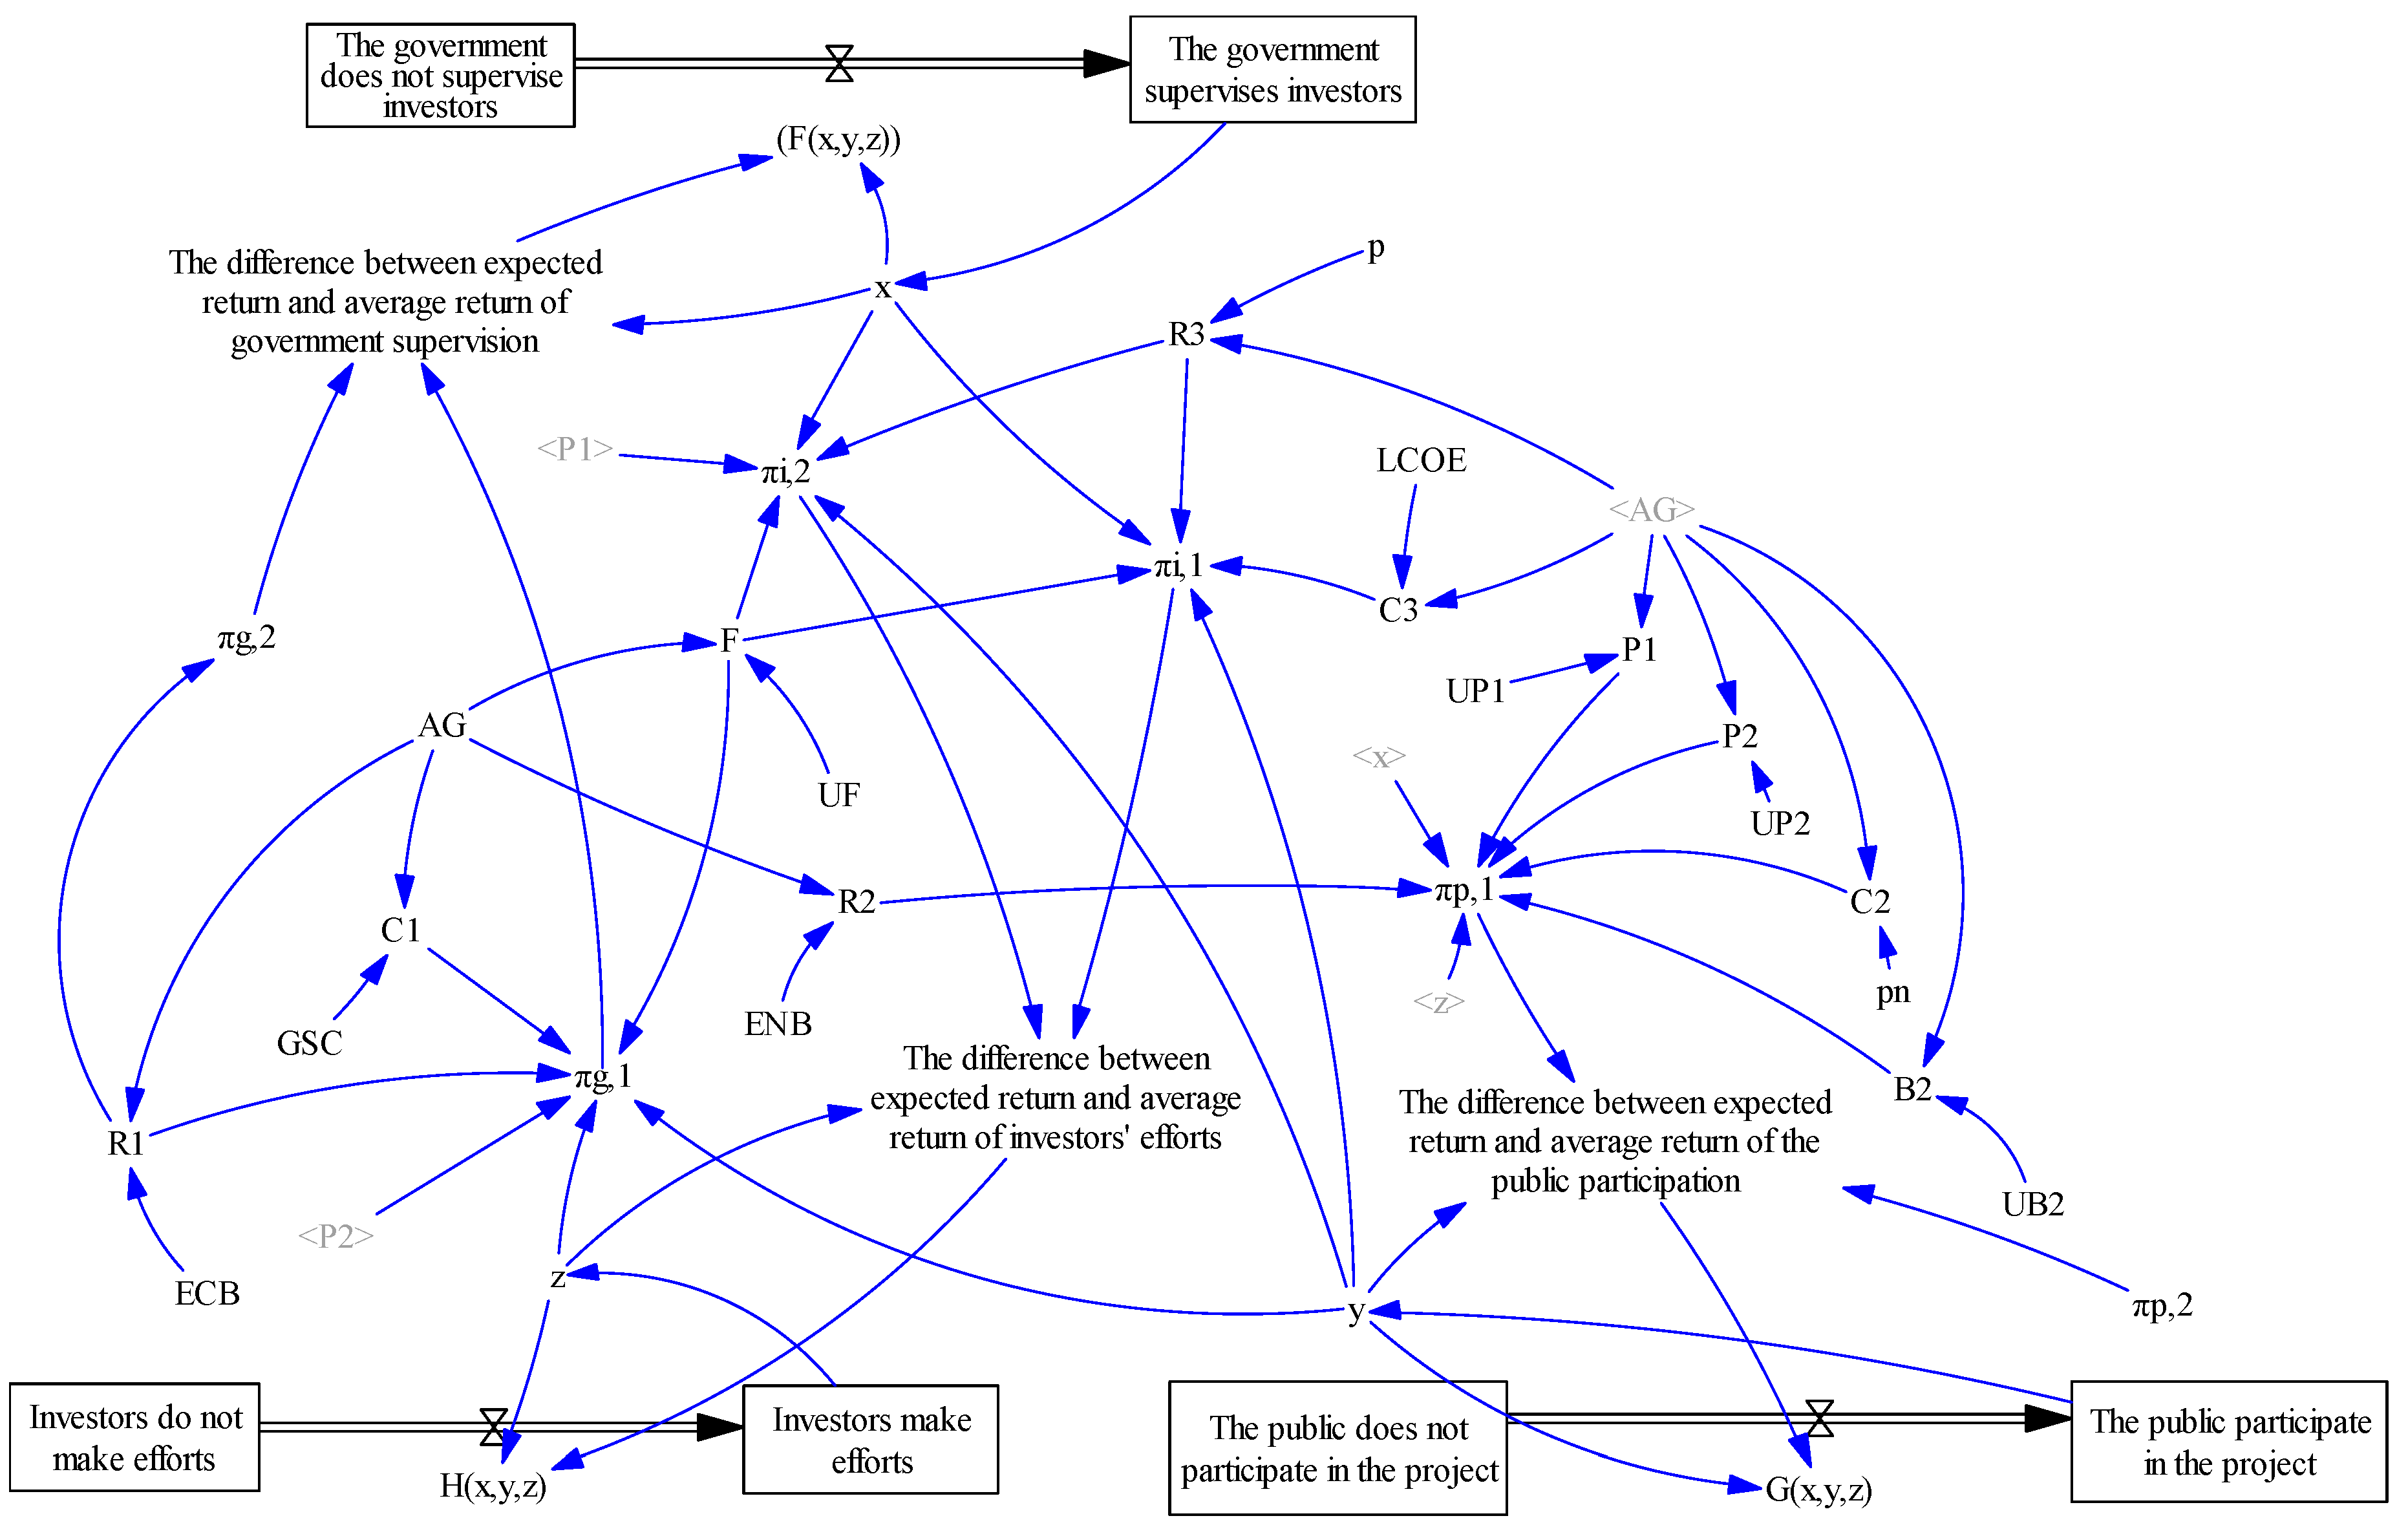
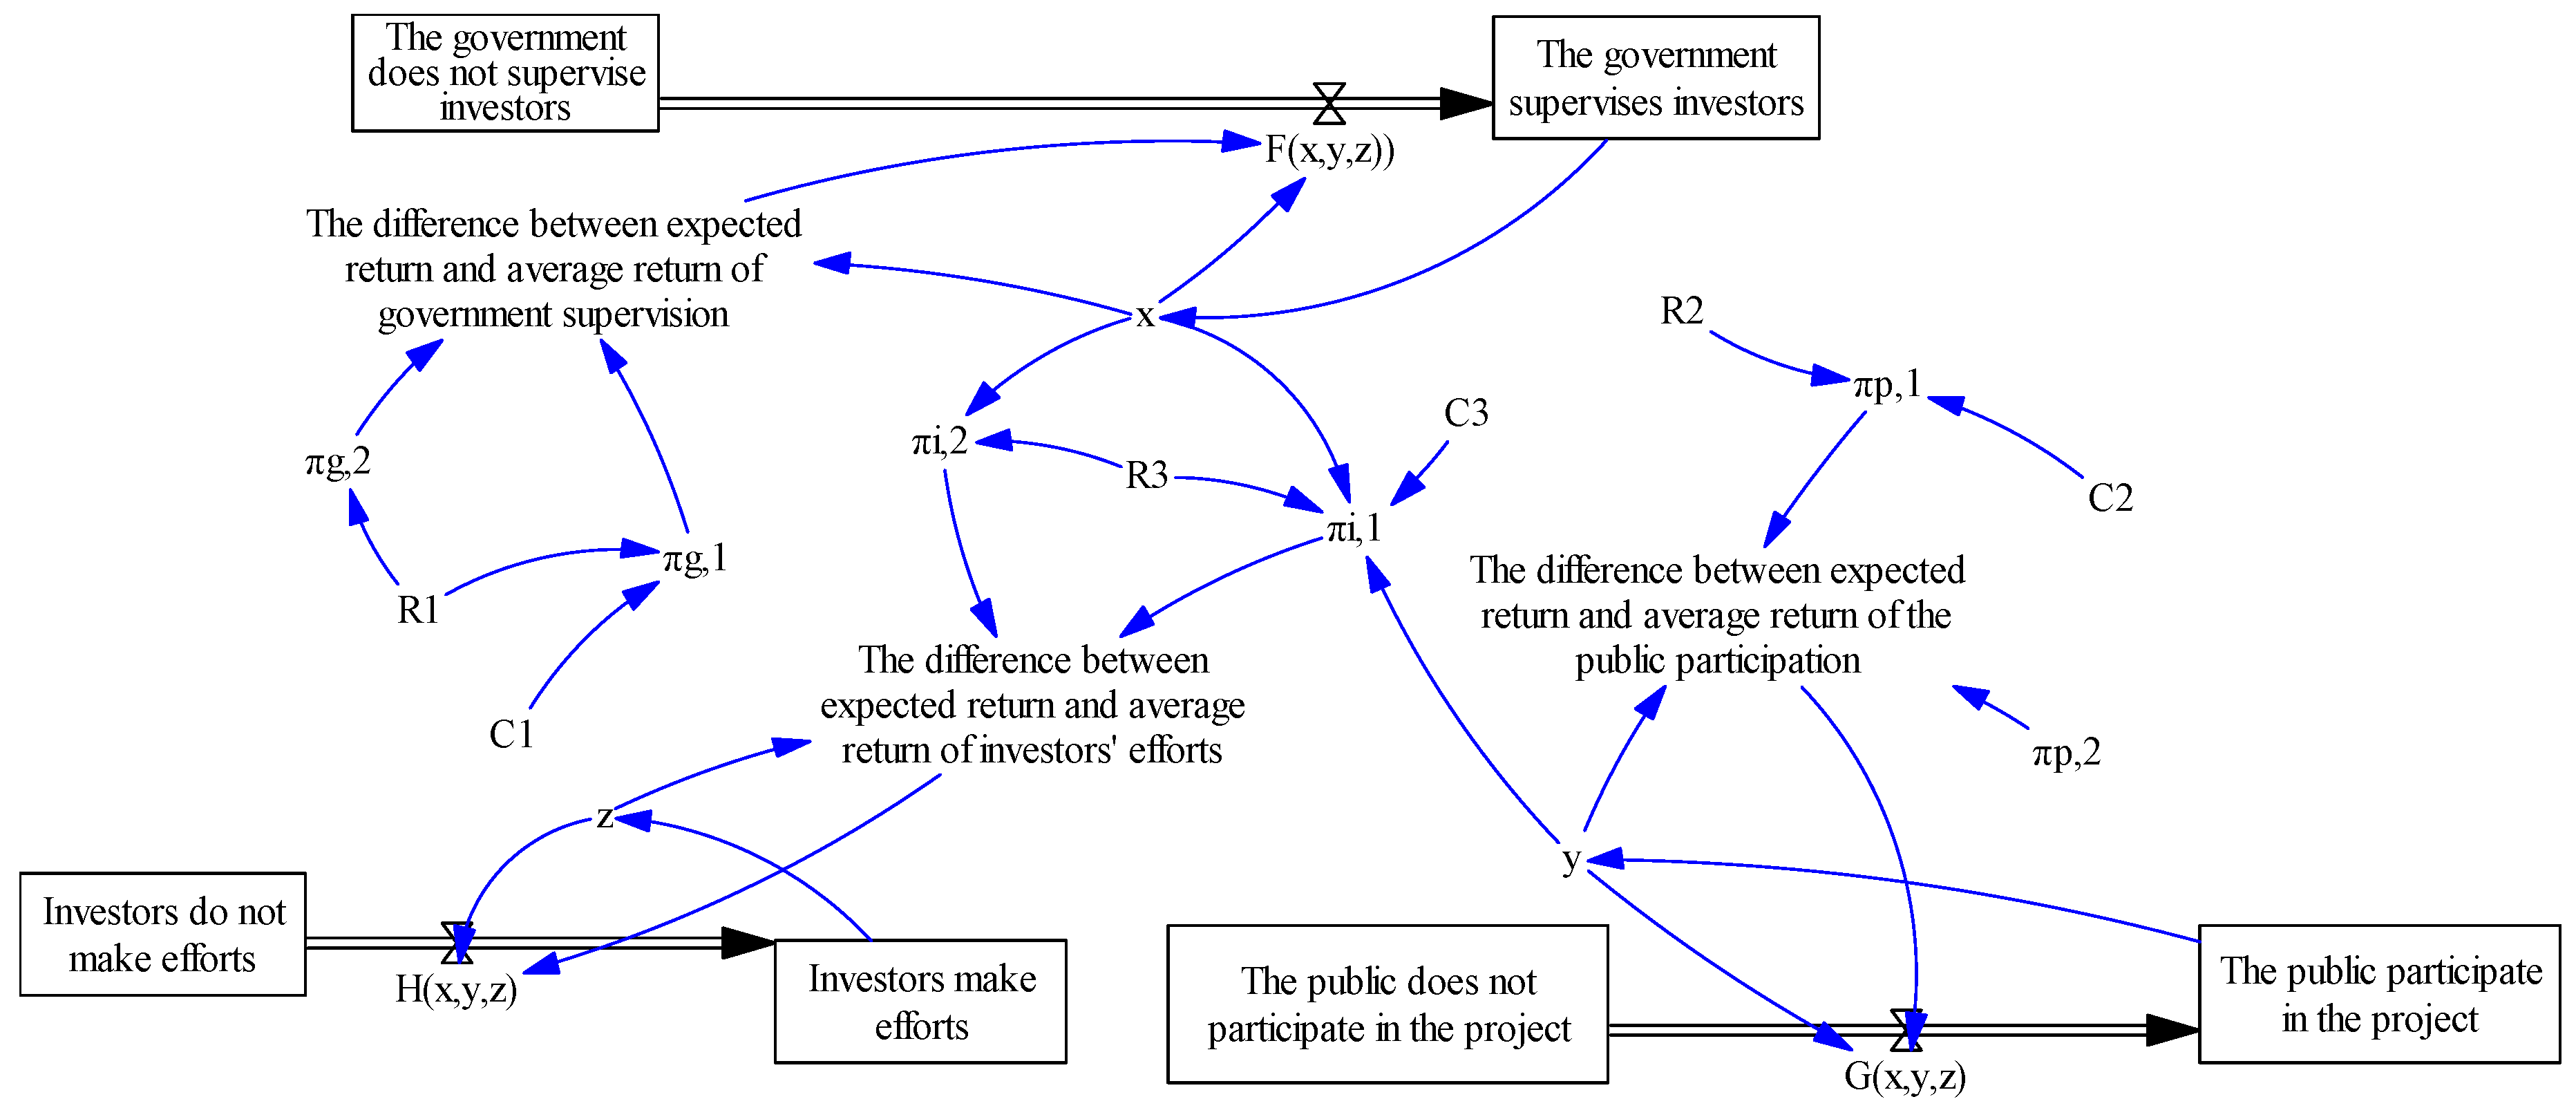
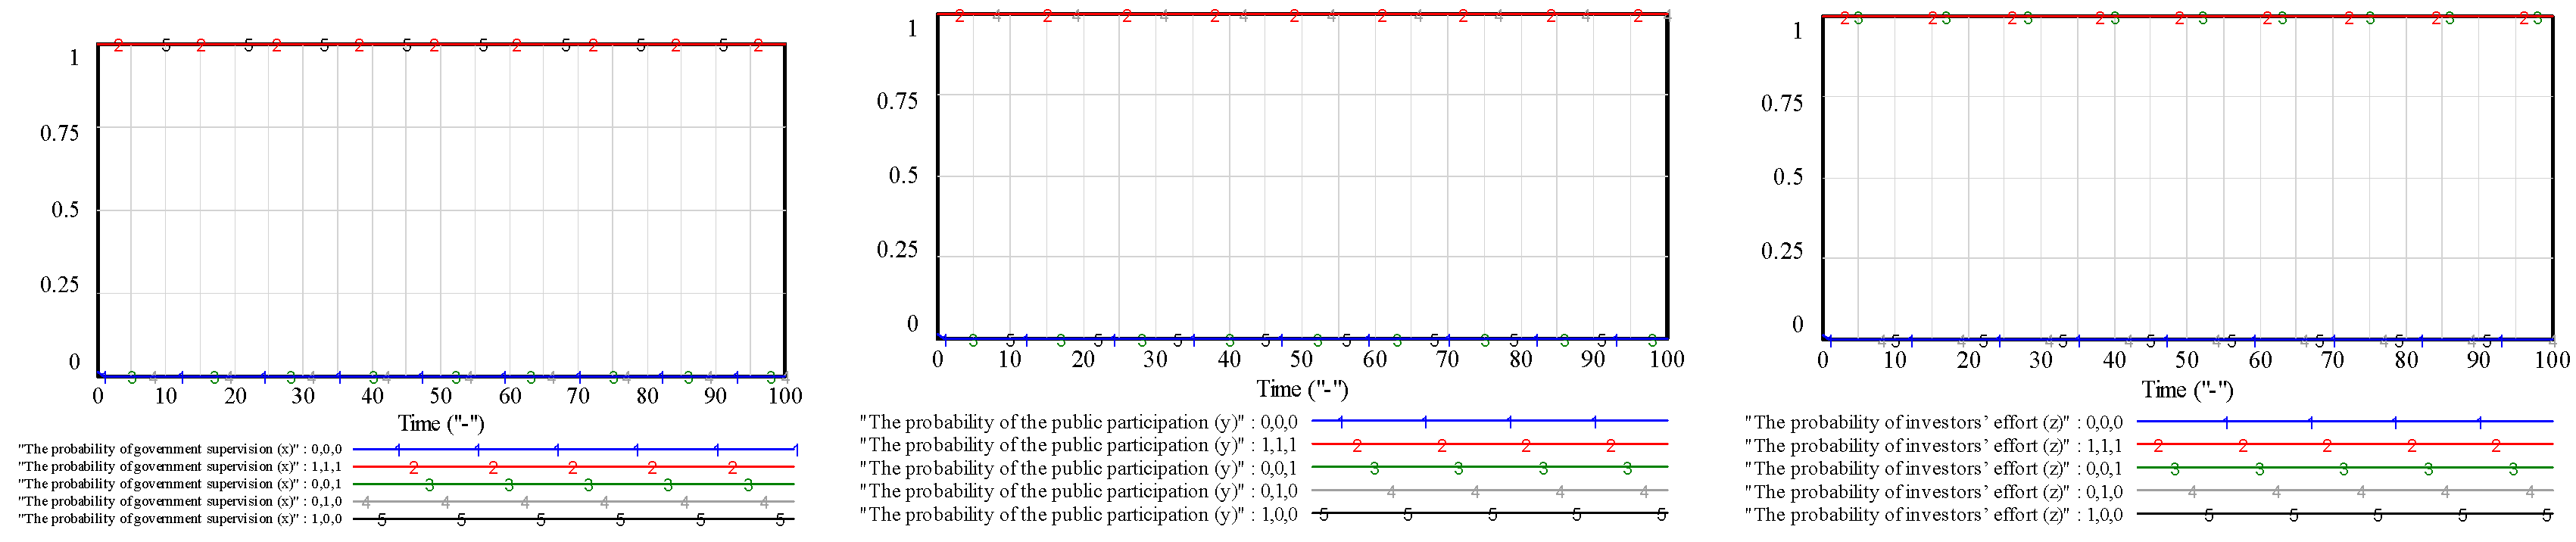
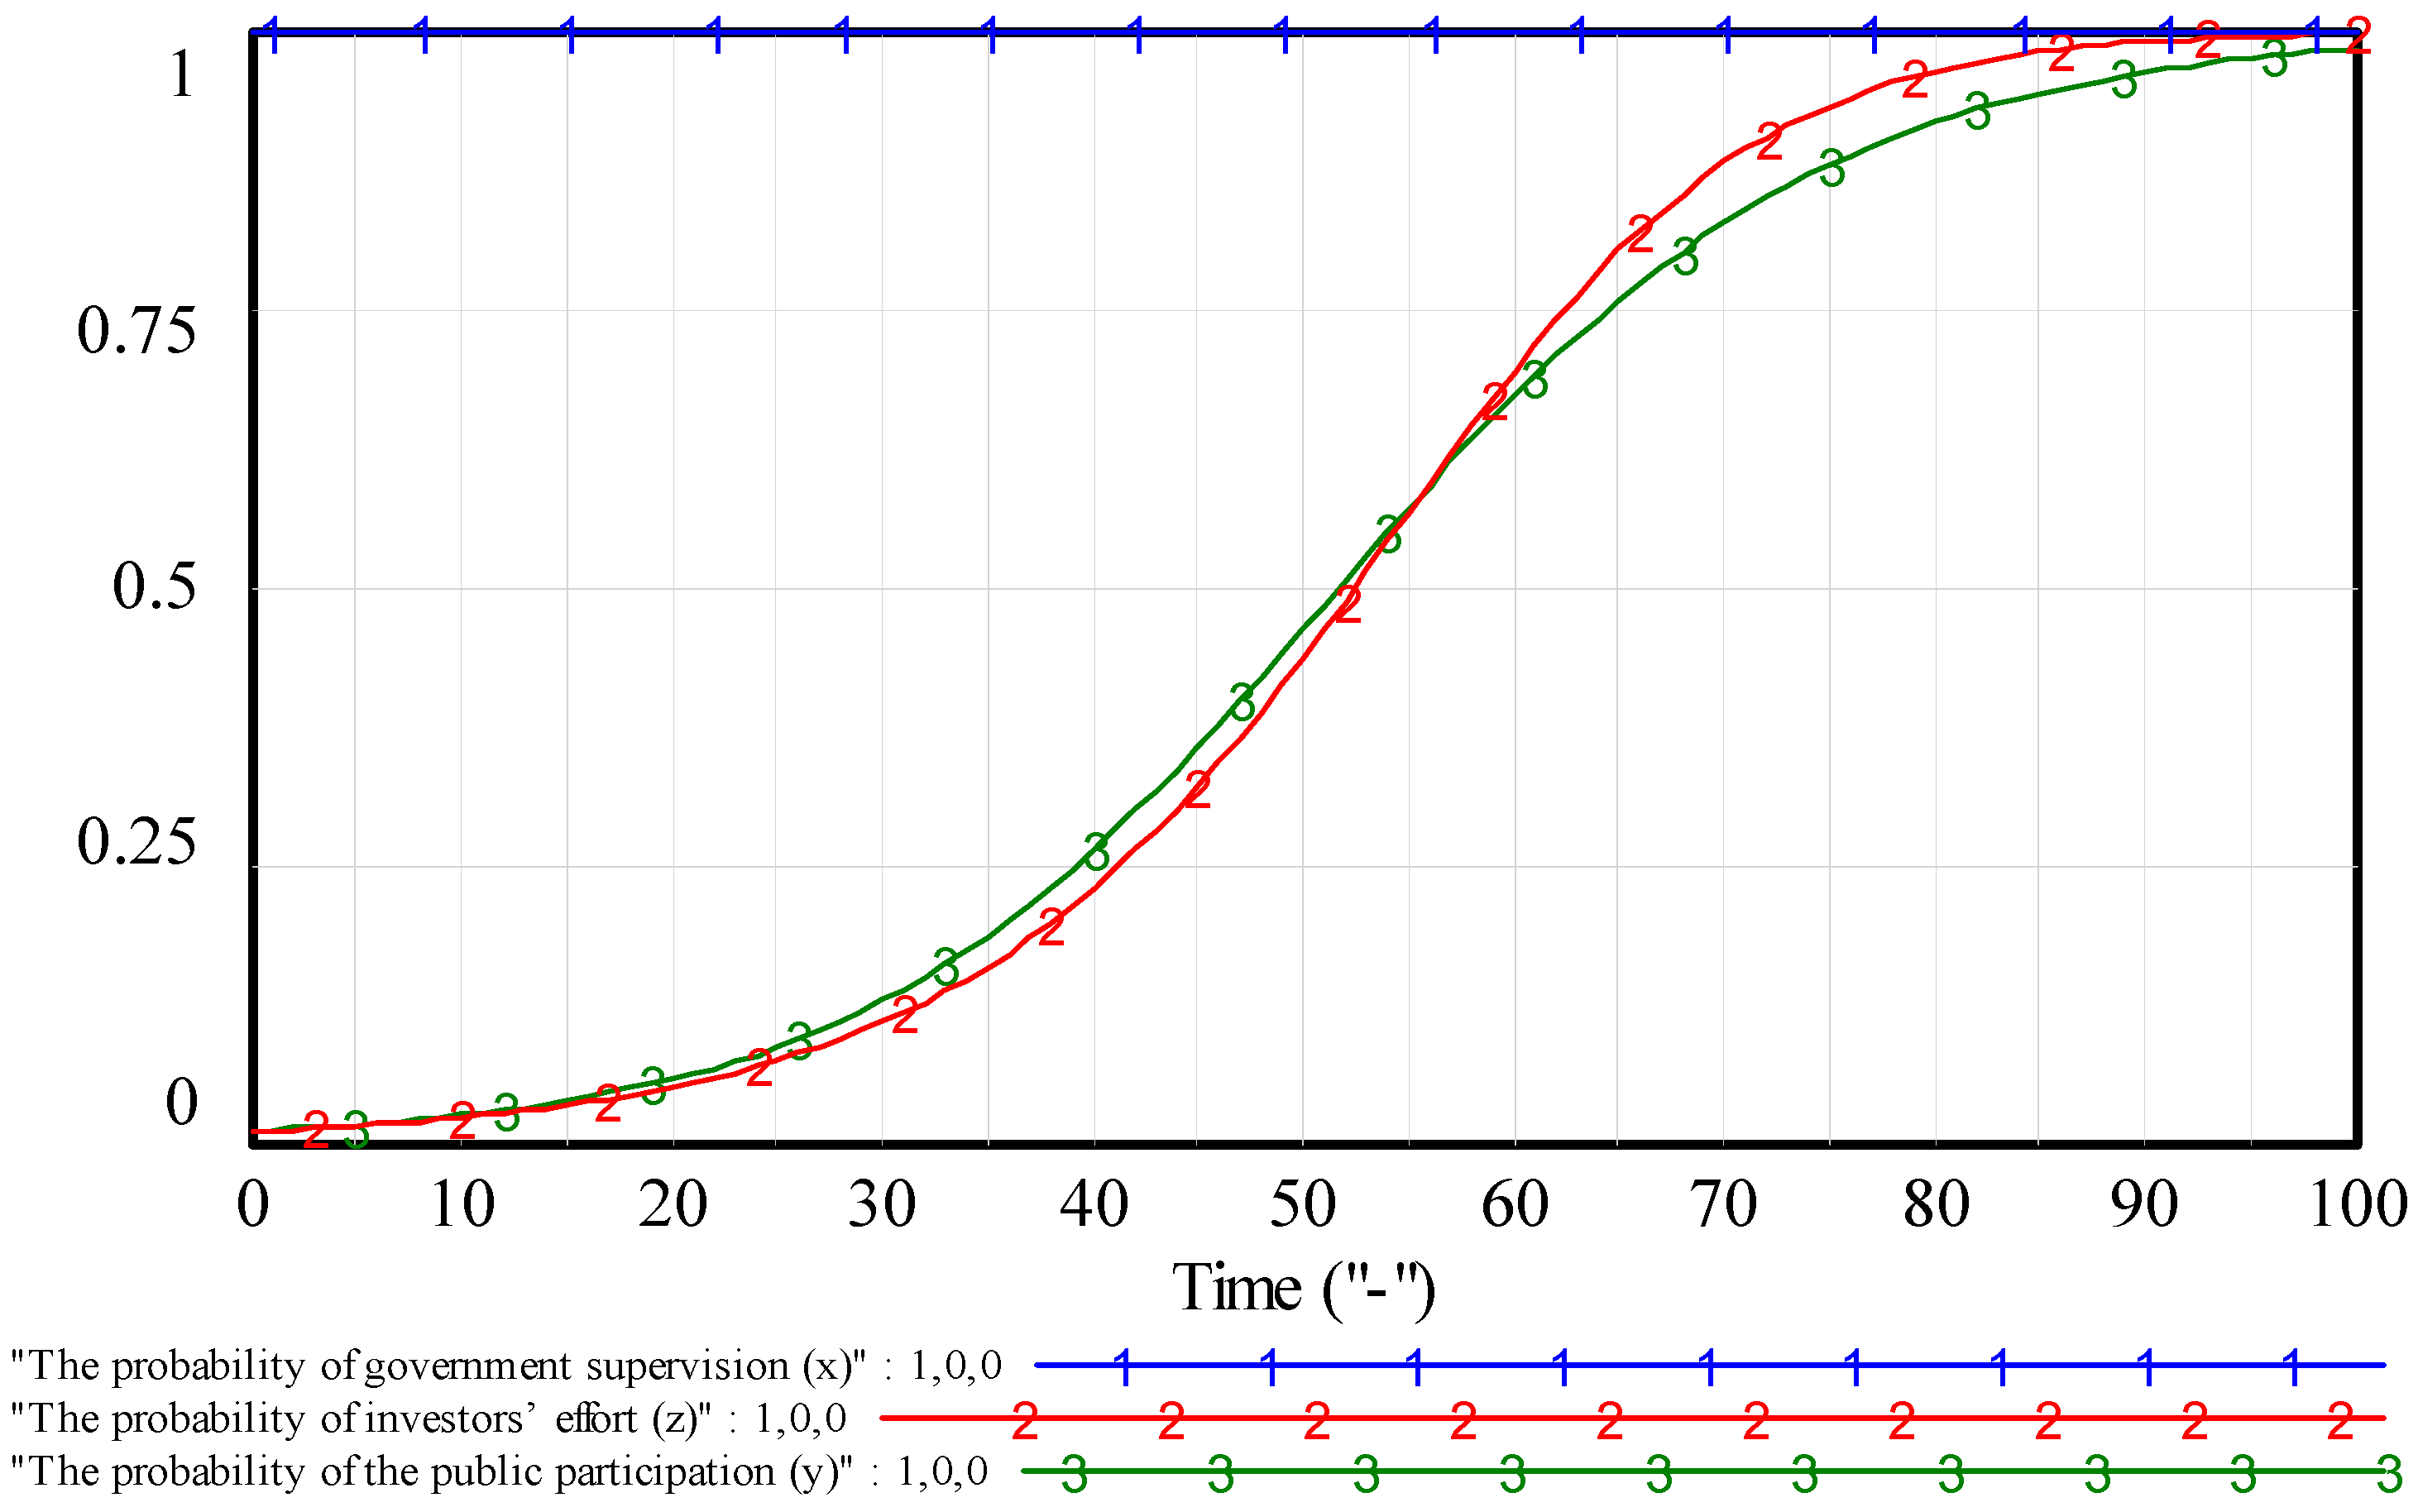
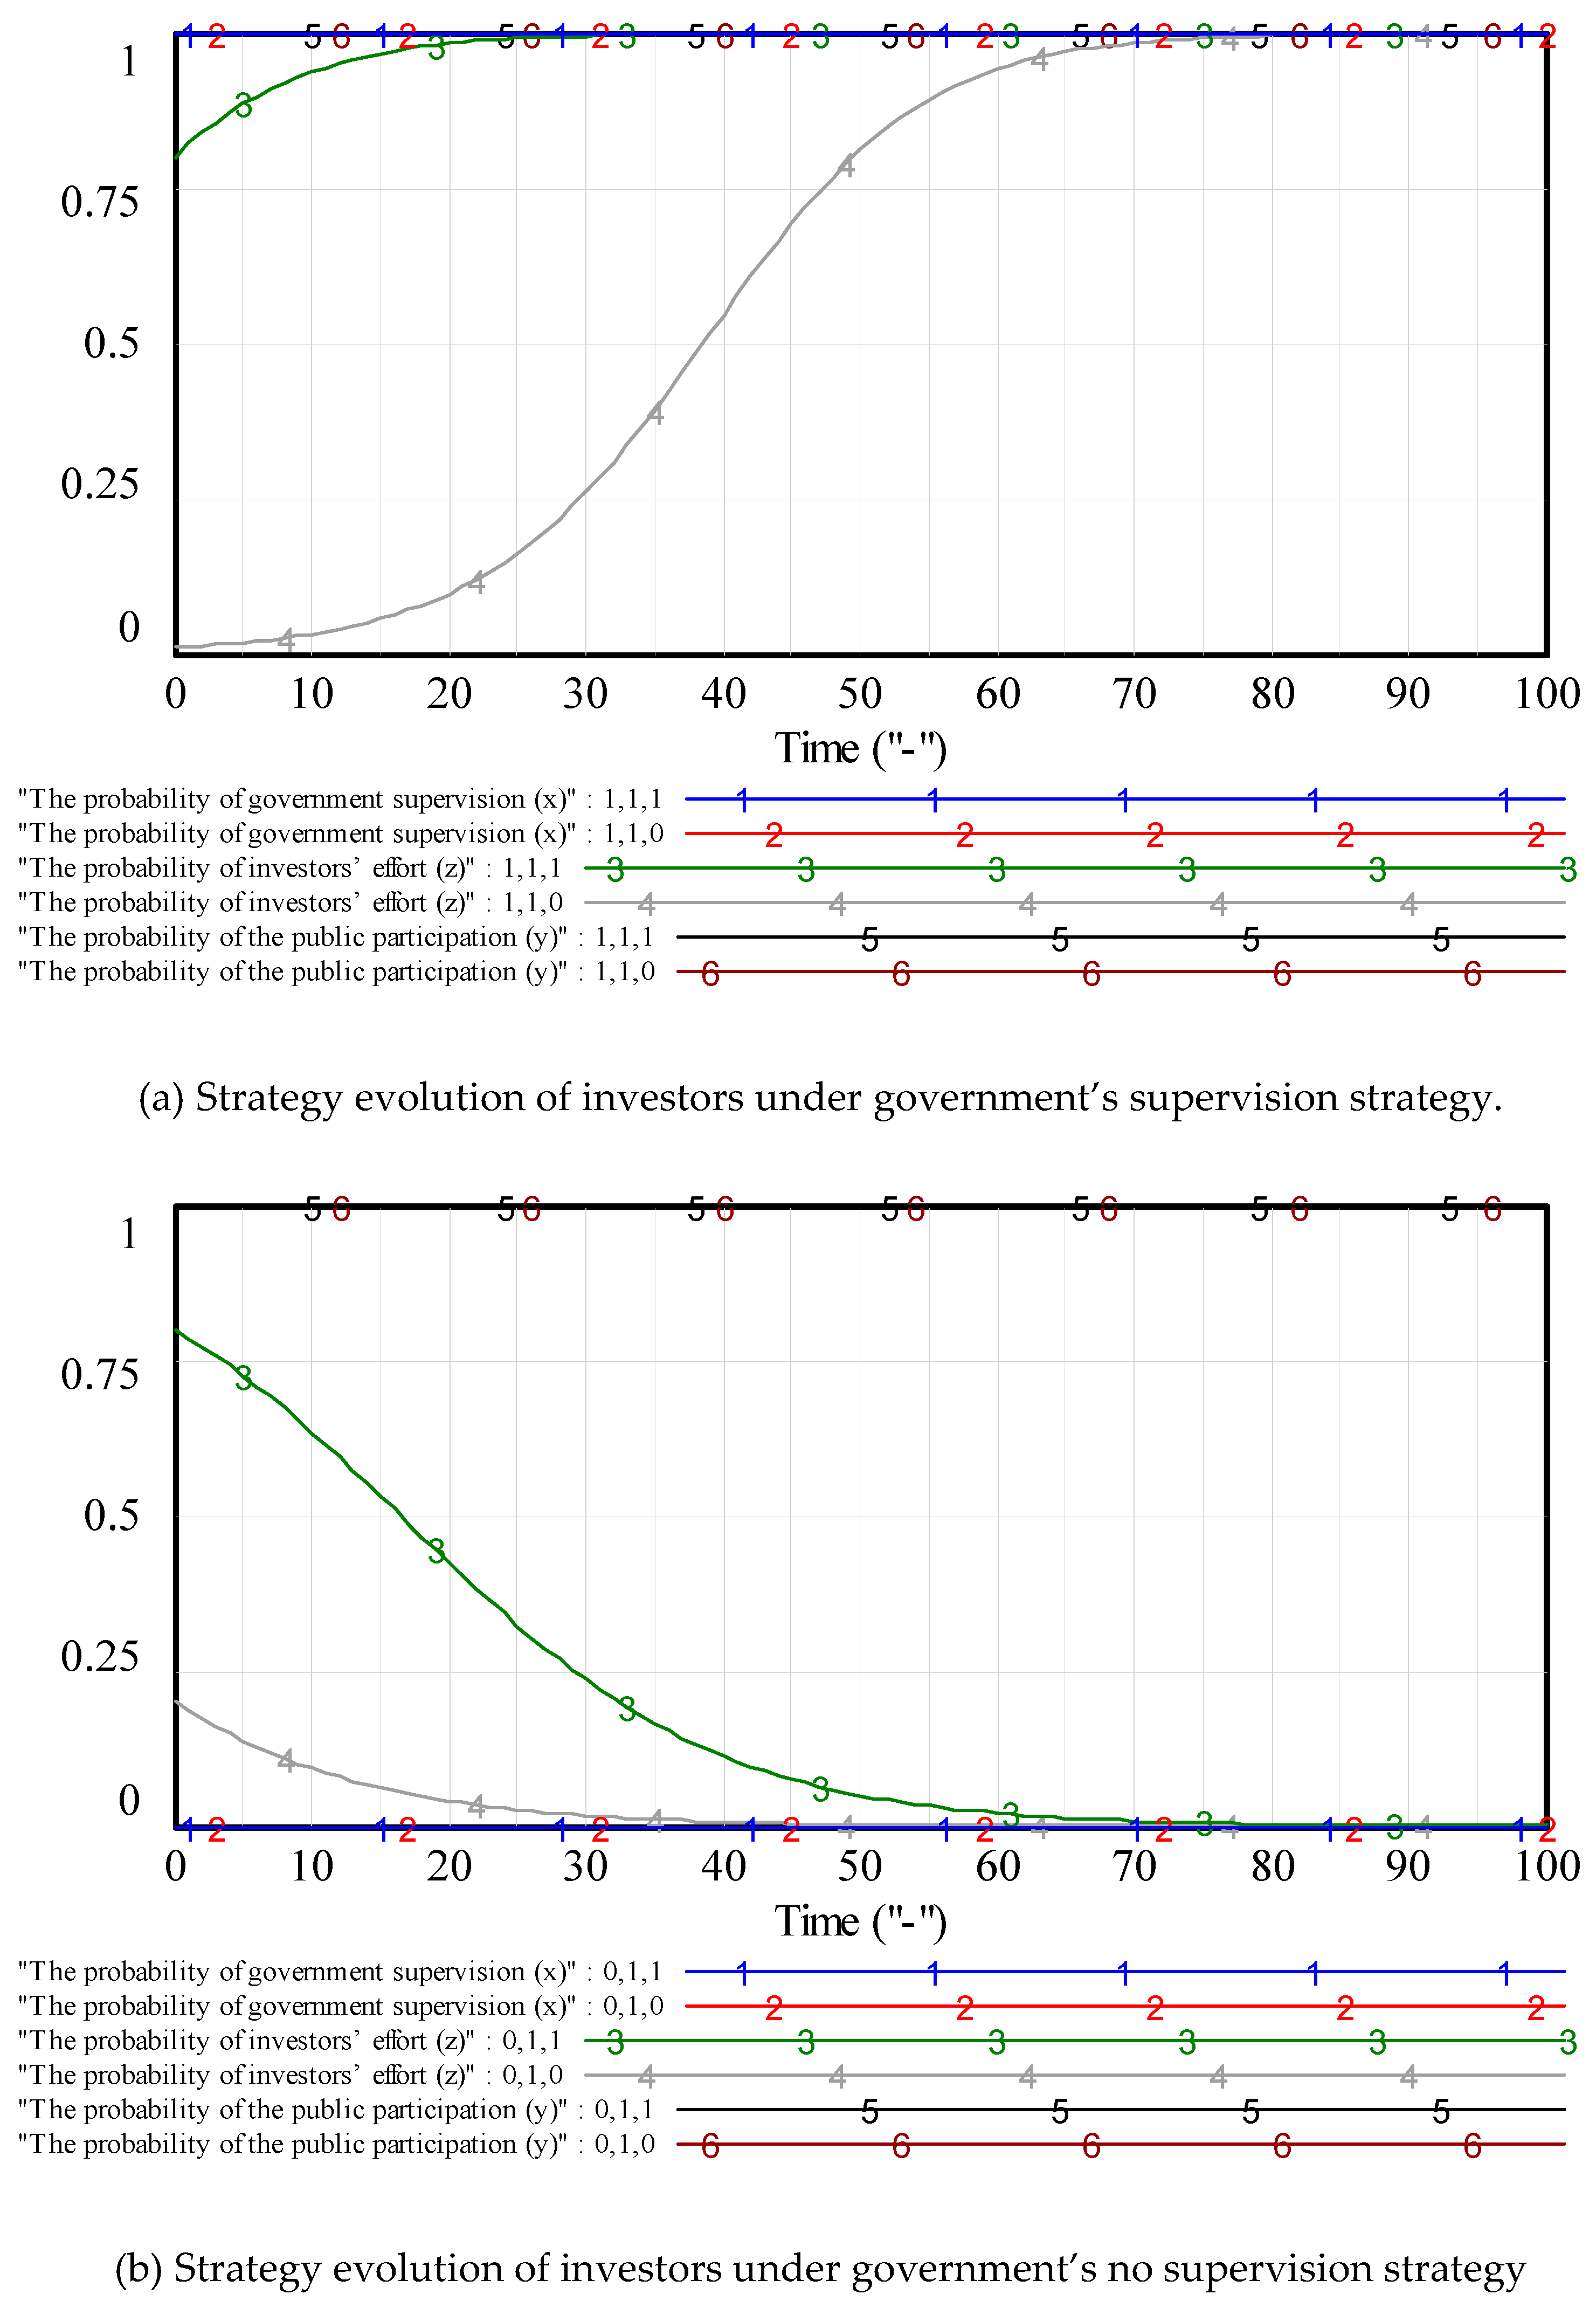
In summary, in the outsourcing of PPP projects, the government’s choice of strategies is {encourage public participation, supervise investors; encourage public participation, not to supervise investors}, and the public’s strategy is {participation; no participation}, investors’ strategy is {effort; no effort}. This study uses x , 1 x , y , 1 y , z , and 1 z to indicate the probability that the government supervises investors, the public participates in the project, and investors make efforts, respectively. Moreover, x , y , z [ 0 , 1 ] x , y , z [ 0 , 1 ] .

2.2. Evolutionary Game Model

2.2.1. Game Payment Function

According to the game relationship analysis above, the selection strategies of the three parties are as follows:
(1) The government chooses the supervision strategy, and the public chooses to participate in the project. If investors choose the “effort” strategy, they can effectively protect the revenue of the government and the public. If investors do not make efforts, they will harm the public interest, and the government will punish investors and compensate the public for damages.
(2) The government chooses the supervision strategy, and the public chooses not to participate in the project. At this time, the public’s income is zero, and the change of investors’ strategy will not affect the public, but it will affect the government’s income. If investors choose the “effort” strategy, it can effectively protect the government’s revenue. If investors do not make efforts, the government will punish investors and require them to pay a certain fine.
(3) The government chooses no supervision strategy, and the public chooses participation strategy. If investors choose the “effort” strategy, they can protect the revenue of the government and the public. If investors do not make efforts, they will do some harm to the public. Since the government does not supervise, the government cannot define and punish the non-effort investors, but the government will require investors to compensate the public for damages, that is, the government’s prior compensation to the public.
(4) The government chooses the non-supervision strategy, and the public chooses not to participate in the strategy. Since the public does not participate in the project, the public’s return is zero, and the change in investors’ strategy will not affect the public. In the government’s view, outsourcing the PPP project will achieve the goal. In our model, it can be understood as obtaining the rated income, and the government does not supervise the operation of investors, thus, investors’ strategic choice will not affect the government’s income. At this point, if investors choose the strategy of “no effort”, it will not be punished by the government.
According to the principle of maximizing benefits, we can get the payment return matrix of tripartite game under the condition of government adopting supervision and non-supervision strategies, the results are shown in Table 1 and Table 2. The first function item in each table represents the government’s revenue, the second function item represents the public’s revenue, and the third function item represents investors’ income. The meaning of each parameter is shown in Table 3.

2.2.2. Evolutionarily Stable Strategy (ESS)

In the model, π m , n represents the return of stakeholder m when he chooses strategy n , and m = g , p , i represents the government, the public, and investors, respectively. n = 1 , 2 represents the strategy’s choice of the player under the “the government supervises investors” and “the government does not supervise investors”, respectively. For example, π g , 1 represents the government’s revenues when the government supervises investors, and π g , 2 represents the government’s revenues when the government does not supervise investors. The dynamic differential equations of government, investors, and the public are shown in Appendix A [29].
In dynamic games, the probabilities of x , y , and z are related to time t , which express as x ( t ) , y ( t ) , z ( t ) [ 0 , 1 ] . Thus, the solution domain of replicated dynamic equations composed of formulas (4), (8), and (12) is [ 0 , 1 ] × [ 0 , 1 ] × [ 0 , 1 ] . Formulas (4), (8), and (12) simultaneously compose X = ( d x d t d y d t d z d t ) T , and let X = 0 , we can obtain the local equilibrium point of the government, the public, and investors, that is, the equilibrium solution of the evolutionary model, which are D 0 ( 0 , 0 , 0 ) , D 1 ( 1 , 0 , 0 ) , D 2 ( 1 , 1 , 0 ) , D 3 ( 0 , 1 , 0 ) , D 4 ( 0 , 1 , 1 ) , D 5 ( 1 , 1 , 1 ) , D 6 ( 1 , 0 , 1 ) , and D 7 ( 0 , 0 , 1 ) . The stability of the local equilibrium point can be obtained by the analysis of the system’s Jacobian if a system of differential equations describing population dynamics is known [21], which is J = | F ( x , y , z ) x F ( x , y , z ) y F ( x , y , z ) z G ( x , y , z ) x G ( x , y , z ) y G ( x , y , z ) z H ( x , y , z ) x H ( x , y , z ) y H ( x , y , z ) z | = | ( 1 2 x ) [ ( 1 z ) F y ( 1 z ) P 2 C 1 ] x ( x 1 ) ( 1 z ) P 2 x ( 1 x ) ( y P 2 F ) y ( 1 y ) ( 1 z ) ( P 2 P 1 ) ( 1 2 y ) [ x ( 1 z ) P 2 + ( 1 x ) ( 1 z ) P 1 ( 1 z ) B 2 + R 2 C 2 ] y ( y 1 ) [ P 2 + ( 1 x ) P 1 B 2 ] z ( 1 z ) ( F y P 1 ) z ( 1 z ) ( 1 x ) P 1 ( 1 2 z ) [ x F + y ( 1 x ) P 1 C 3 ] |
Both determinant ( d e t ( J ) ) and trace ( t r ( J ) ) determines the local stability of linear differential equations:
d e t ( J ) = F ( x , y , z ) z × ( G ( x , y , z ) x × H ( x , y , z ) y G ( x , y , z ) y × H ( x , y , z ) x ) G ( x , y , z ) z × ( F ( x , y , z ) x × H ( x , y , z ) y F ( x , y , z ) y × H ( x , y , z ) x ) + H ( x , y , z ) z × ( F ( x , y , z ) x × G ( x , y , z ) y F ( x , y , z ) y × G ( x , y , z ) x )
t r ( J ) = F ( x , y , z ) x + G ( x , y , z ) y + H ( x , y , z ) z
When d e t ( J ) > 0 and t r ( J ) < 0 , the equilibrium point will reach the local asymptotically stable state, which is ESS. The results of the stability analysis are shown in Table 4.
It can be seen from Table 4 that the stability of eight equilibrium points cannot be determined by the existing conditions. This shows that it is impossible to predict the existence of stable evolutionary equilibrium points only by mathematical derivation because the magnitude of d e t ( J ) and t r ( J ) depends on the value of each parameter. Thus, we use SD simulation to propose a three-party evolutionary game model, and analyze the evolution process of the game.

2.3. SD Simulation Model

We believe that there is a complex nonlinear relationship between the government, investors, and the public according to the above analysis of game players’ relationships and the construction of evolutionary game model. We used Vensim software to build a stock and flow diagram (SFD) of dynamic game corresponding to the above evolutionary game model, which clearly represents the dynamic evolution process of game behaviors, as shown in Figure 3.
There are nearly 30 functional formulas in Figure 1 to express the logical relationships among the various factors, of which the game players’ function relationships have been given above. Next, we will explain the main function relationships involving PPP power construction, and the related variables are explained, as shown in Table 5.
x = x 0 + F ( x , y , z ) d t
y = y 0 + G ( x , y , z ) d t
z = z 0 + H ( x , y , z ) d t
C 1 = A G × G S C × μ
C 2 = A G × p n × μ
C 3 = A G × L C O E × μ
R 1 = A G × E C B × μ
R 2 = A G × E N B × μ
R 3 = A G × p × μ
P 1 = A G × U P 1 × μ
P 2 = A G × U P 2 × μ
F = A G × U F × μ
B 2 = A G × U B 2 × μ
where Formula (7) indicates the cost of public participation in the construction of the project, which can be understood as the public accepting the share of the new energy generation cost in the residential electricity price. Formula (9) indicates the government’s revenue, which can be understood as the economic benefits brought by the new energy power projects to the government. Formula (10) is the public’s benefit, which can be understood as the indirect benefit of new energy power generation to public health by reducing carbon emissions and pollution, and expressed as the environmental benefit of new energy power generation. μ is the economic parameter, which is used to adjust the dimension of values.

3. Case Study

3.1. Basic Sample System

In 1970, the Roman scholar Forrest proposed the world model II based on system dynamics to solve the “human dilemma”. The model simulates the world’s development prospects for the first 200 years (1900–2100) and the last 130 years (1970–2100). Since then, scholars around the world have expanded the model on the basis of this model and combined with the characteristics of the country, in order to study the situation of their own country. This strongly shows that the basic model of system dynamics has expansibility and strong applicability. Therefore, in this section, we will simplify the system dynamics model and use basic data as system examples to illustrate the scalability of the system examples and their strong applicability to different cases. The basic sample system is shown in Figure 4. The assumed base values are shown in Table 6. The simulation results under different conditions are shown in Figure 5.
The results of the basic system show that when there are no restrictive factors among the three parties, the strategies of each party will not affect each other. The only stable point is ( 0 , 0 , 0 ) , which is in line with the actual situation. Only when the interests of the three parties are coordinated, the decisions of the parties can be adjusted according to the strategies of other players. This basic system can adjust the interest relationship among the three parties according to different cases and different factors. Our study takes China’s new energy construction PPP as an example to expand the system.

3.2. A China Case

The most typical PPP project of China’s new energy power construction is waste incineration power generation. Taking this project as an example, this study simulates the tripartite evolutionary game model proposed in this paper based on actual data. In recent years, urban domestic waste has increased rapidly with the acceleration of China’s urbanization process [30]. Waste incineration power generation is the preferred method of waste disposal in many cities in China [31,32]. At present, the main construction mode of PPP project for China’s waste incineration power generation is build-operate-transfer (BOT), which means that investors are authorized to finance, design, build, and operate power plants within a specified period of time, and then transfer them to the government after the expiration of the contract. The data of the study are collated according to references [1,33,34,35,36,37,38,39,40], which mainly come from the relevant research reports and government documents.
The values of variables are shown in Table 7. Here, we explain the acquisition of the data. According to the data of the Statistical Yearbook [33,34], the annual utilization hours of waste incineration power generation vary little with time; thus, we calculate the average annual use hours for nearly 5 years, which are 6000 h. The values of installed capacity and electricity price ( p ) can be obtained directly from [35], which are 5.4 × 10⁶ kW and 0.098 dollar/kWh, respectively. Thus, the annual power generation ( A G ) can be calculated to be 3.24 × 10¹⁰ kWh by multiplying the annual utilization hours with the installed capacity. The formula of L C O E is the annual total investment of the project (4.46 billion dollars) divided by the annual total power generation (3.24 × 10¹⁰ kWh), which can be obtained directly from [1,36]. G S C can be calculated through the Beihai municipal government procurement document [1,37]. The government human resource costs corresponding to the annual power generation are 538 million dollars. E C B and E N B can obtain the economic value of the life cycle annual economic benefits of waste generation and the equivalent conversion of reduced carbon emissions from [38,39], which are 3.24 billion dollars and 3.33 billion dollars, respectively, and these two variables can be calculated. According to the data of China Electricity Council [40], China’s non-water renewable energy accounts for about 12% of the total social electricity consumption. Since the residential electricity price in China is 0.076 dollar/kWh, we calculate the share of new energy in residents’ electricity price ( p n ) is 0.01 dollar/kWh.
In addition, we set that U P 1 is 0.045 dollar/kWh, U P 2 is 0.076 dollar/kWh, U F is 0.091 dollar/kWh, and U B 2 is 0.06 dollar/kW. After repeated tests of model simulation, the reasonable value of economic parameter μ is 4 × 10⁻¹².

3.3. Results and Analysis

Evolutionary game equilibrium analysis shows that the government, the public, and investors will inevitably achieve an evolutionary equilibrium, but the reasons and process of achieving the equilibrium are not clear, nor can it be clear whether the equilibrium is unique and stable. Moreover, even if the equilibrium state is reached in a certain situation, the system may be affected by various uncertainties, thereby breaking the equilibrium state. In order to solve these problems, we use SD method to simulate the dynamic game among three parties by Vensim software. In the simulation process, we set the simulation period as 100, namely INITIAL TIME = 0 and FINAL TIME = 100, and take the probabilities of the three parties’ strategies as the main measurement index to analyze the relevant factors in PPP project. Since the data in this study are the unit value sorted out based on the actual data, the simulation time in SD model generally refers to the general time unit without specific settings (such as year, month).
When the initial probabilistic values of the government, investors, and the public are all of a single strategy, that is only 0 or 1 strategy, there are eight combinations of the parties’ strategies, that are ( 0 , 0 , 0 ) , ( 1 , 0 , 0 ) , ( 1 , 1 , 0 ) , ( 0 , 1 , 0 ) , ( 0 , 1 , 1 ) , ( 1 , 1 , 1 ) , ( 1 , 0 , 1 ) , and ( 0 , 0 , 1 ) . The simulation results show that when the initial state of the three parties is 0 or 1 strategy, no one in the system is willing to change the current state to break the balance. However, this does not mean that these equilibrium states are stable. Once one or more parties take the initiative to make small changes, the equilibrium state will be broken. We first take the ( 1 , 0 , 0 ) strategy as an example. The simulation results are shown in Figure 6.
Figure 6 shows that although the initial probabilities of public participation and investors’ effort (both of them are 0.01) are evolutionary games with a small mutation, once they find that adopting new strategies will lead to higher expected returns, they will quickly switch to new strategies, which can be adjusted by mutations of one or more parties to bring the system to achieve a new equilibrium state. It can be seen that when the public and investors’ strategies change from 0 to 0.01, they will eventually reach an equilibrium state, indicating that public participation and investors’ efforts are the best choices, which are in line with the ultimate goal of government outsourcing to investors and providing PPP projects to the public. Judging from the whole process of PPP project establishment, construction and operation, the government always adopts the supervision strategy. With the promotion of the project, once the public and the investor have the willingness to participate or make efforts, the probability of their participation or efforts will continue to grow in an "S" shape, and the speed will be fast first and then slow, that is, both parties reach a consensus of participation or efforts when the project is approved, and actively participate and cooperate in the process of project construction, and maintain the state of public participation and investors’ efforts when the project starts to operate.
Secondly, we test investors’ strategic choices under public participation. The simulation results are shown in Figure 7. When the government chooses to supervise investors, that are ( 1 , 1 , 0 ) and ( 1 , 1 , 1 ) , it can be seen from Figure 7a that investors’ ultimate strategy is 1 whether their strategy starts from 0 or 1, that is, they finally choose effort strategy. When the government does not choose to supervise investors, that are ( 0 , 1 , 0 ) and ( 0 , 1 , 1 ) , it can be seen from Figure 7b that investors’ ultimate strategy is 0 whether their strategy starts from 0 or 1, that is, they finally choose no effort strategy.
Finally, we test the government’s strategic choices under public participation. If investors choose no effort, the government will eventually choose to supervise investors in any case, leading to investors choosing the effort strategy. If investors choose effort strategy, the government will eventually choose not to supervise investors in any case, leading to investors choosing the no effort strategy, and the stable state is ( 0 , 1 , 0 ) . Under this state, once the government has a desire to supervise, the equilibrium state will be broken, and eventually reaches the stable state ( 1 , 1 , 1 ) .
Thus, we can see that the tripartite players will eventually reach a stable equilibrium state of ( 1 , 1 , 1 ) after evolution whatever the single initial strategy of the tripartite players is. The implication of this stability point is that PPP project of new energy power construction develop continuously and steadily only when the government supervises, investors make efforts, and public participates.
The purpose of studying the tripartite game is to examine the benefits of stakeholders and the overall benefits of the project after the game is stabilized. Thus, according to the above simulation results, we construct an index system to compare the benefits of the government, investors, and the public under different conditions, as well as the economic and environmental benefits of the PPP project of new energy and power construction. The results are shown in Table 8.
It can be seen from the table that when only one party chooses strategy "1", the benefit of each party and the overall benefit of the project are the lowest. When two parties choose the strategy “1”, the benefits of each party and the benefit of the project will be improved. When all three parties choose strategy “1”, the benefit is the highest. This shows that in the process of new energy PPP project construction, the interests of the government, investors and the public are interrelated. When the stability point ( 1 , 1 , 1 ) is reached, the project benefits are the greatest, and all stakeholders achieve a win–win situation.

3.4. Sensitivity Analysis

From the local stability analysis of the equilibrium points in Table 4, we can see that whether the strategy combination is an equilibrium point depends on the size of the game parameters, that is, the value of exogenous variables in the SD model. We use the ( 1 , 0 , 0 ) strategy as an example to study the effect of changes in exogenous variables on simulation results in simulation systems.

3.4.1. Factors Affecting the Government’s Strategy Choice

To analyze the change of the government’s strategy choice probability, we assume that the initial strategy is no supervision, and the evolutionary game is carried out with the mutation of probability 0.1. Through dynamic simulation, we can see that both the unit power generation cost of government supervision G S C and the unit fine U F affect the choice of strategy. The simulation results are shown in Figure 8.
On the one hand, the less the government’s supervision costs to investors, the more willing the government is to implement supervision strategy, and the sooner it will reach the equilibrium state of supervising investors. On the other hand, the more the government fines the investors, the greater the probability that the government will choose to supervise. Comparing with Figure 8a,b, it can be found that U F is higher than C 1 in the similar trend line of strategy selection. When U F and C 1 are equal, the government has little profit from supervision, thus, it is willing to choose no supervision strategy. Once the difference between U F and C 1 is greater than zero, the government will quickly make the most advantageous game choice and implement the supervision strategy. In reality, the government chooses a supervision strategy to safeguard the public interest of the society.
The economic and environmental benefits of PPP projects in several cases are shown in Table 9. It can be seen that although reducing unit supervision costs and increasing fines will increase the government supervision probability and total costs, the environmental and economic benefits of the project are improved, and vice versa. This is because the improvement of the probability of government supervision can urge investors to build projects in order to better meet the needs of the public, and ultimately improve the project efficiency.

3.4.2. Factors Affecting the Public’s Strategy Choice

The public is chosen to evolve from strategy 0.01 mutation. When the initial value of exogenous variables is taken, the strategy will achieve a balance at 1, that is, the public chooses to participate in the project. The simulation results show that the unit power generation cost of environment benefit E N B , the share of new energy in residents’ electricity price p n , investors’ unit damage to the public due to its no effort U B 2 and the unit compensation for damage to the public when the government supervise investors U P 2 have significant effects on the choice of the public’s strategy.
When changing the value of a single variable, that is, increasing E N B or U P 2 or decreasing U B 2 or p n , the public is more willing to participate in the project. The change trend of the public’s strategy choice is shown in Figure 9, which shows an “S” type of growth. When multiple variables change simultaneously, the simulation of the public’s strategies is shown in Figure 10, which shows strategies when U P 2 is greater than, equal to, and less than U B 2 , respectively, when E N B and p n remain unchanged. This shows that the decision-making of the public before choosing to participate in the project is not only affected by its own benefits and costs, but also by the amount of compensation promised by the government and the difference between the estimated value of damage to investors, that is, the greater the difference between compensation and damage, the greater the probability of public participation, and vice versa. Therefore, in order to engage the public actively, the government should not only provide appropriate fixed income, but also commit sufficient amount of compensation. It can be seen that security factors play a crucial role in public strategy selection In PPP outsourcing projects.
The economic and environmental benefits of PPP projects are shown in Table 10. It can be seen that if the government’s protection of the public is insufficient, the enthusiasm of public participation is not high. Although the government’s compensation to the public is reduced, the investors cannot obtain accurate information from the public to reduce the project’s revenue, which ultimately leads to a reduction in the overall efficiency of the project.

3.4.3. Factors Affecting Investors’ Strategy Choice

Investors are chosen to evolve from strategy 0.01 mutation. When the initial value of exogenous variables is taken, the strategy will achieve a balance at 1, that is, investors choose the effect. The simulation results show that both levelized cost of electricity of the new energy project L C O E and unit fine U F affect the strategy choice of investors, as shown in Figure 11. The higher U F , or the less L C O E , the quicker investors reach the steady state of choosing effort.
The economic and environmental benefits of PPP projects in this section are shown in Table 11. It can be seen that increasing the fines increased the cost of the investors, but at the same time increased the quality of the project construction, public satisfaction, and the efficiency of the final project. The reduction of L C O E can directly reduce project construction costs and improve project efficiency.

4. Conclusions

In the process of PPP project outsourcing for new energy and power construction, how to deal with the cooperation among the government, investors, and the public is the key to ensure the outsourcing of PPP projects. In this paper, a three-party evolutionary game model is constructed, and its coordination mechanism is analyzed by system dynamics simulation, which provides policy-makers. It should be noted that the contents and findings of this paper may be extended well beyond the apparently narrow focus of the new energy power construction PPP project, even outside China. The conclusions of our study are as follows:
(1) In the new energy and electric power construction PPP project outsourcing, the three parties eventually reach the balanced state of {government supervision, public participation, investors effort}, the three parties achieve a win–win situation and the project benefits are the highest at this time. Public participation plays an important role in promoting the smooth progress of PPP project outsourcing.
(2) In PPP outsourcing, the government, investors, and the public are sensitive to the changes of their exogenous variables, respectively. Reducing the government’s unit supervision cost and raising the unit fine can promote the government’s choice of supervision strategy; improving the environmental benefits of unit power generation, unit compensation, and reducing the share of new energy in the residential electricity price, unit damage value can promote the public’s participation strategy choice; increasing the unit fine and reducing the levelized cost of electricity of the new energy project can promote effort strategy choices of investors. These changes will improve the economic and environmental benefits of PPP projects.
(3) The decision-making of public participation in projects is not only affected by its own benefits and costs but also by the amount of compensation promised by the government and the difference between the estimated value of damage to investors. To engage the public actively, the government should not only provide appropriate fixed income, but also commit sufficient amount of compensation. Security factors play a crucial role in public strategy selection in PPP outsourcing projects.
The topics analyzed in this paper are so wide and still pioneering that further research avenues naturally emerge; among the many critical issues, the following deserve being mentioned and thoroughly investigated: On the one hand, when studying the influence of exogenous variables on the model, only the influence of changing a single variable on the model was considered. Because of the correlation between exogenous variables, in a follow-up study, the influence of changing multiple exogenous variables on the model can be considered to achieve further optimization of the model. On the other hand, the changes in the factors set and discussed in this paper are static. According to [41,42], in the two-party game system, the dynamic changes of some factors such as fines and subsidies contribute to the stability of the game system. The aforementioned points, which extend well beyond the narrow focus of the investigation of this paper, still lack proper empirical evidence and a comprehensive analysis, thus representing a vital and joint stimulus for both academics and practitioners [43].

Author Contributions

L.G. was mainly responsible for the writing of the full text; Z.-Y.Z. conceived and designed the experiments. All authors have read and agreed to the published version of the manuscript.

Funding

This research was funded by the Fundamental Research Funds for the Central Universities (grant number 2017XS109).

Acknowledgments

This paper is supported by the Fundamental Research Funds for the Central Universities (No. 2017XS109). The authors would like to express their gratitude for the support of these funding authorities.

Conflicts of Interest

The authors declare no conflict of interest.

Appendix A

According to Table 1 and Table 2, and game payment functions, the expected return of “the government supervises investors” is
π g , 1 = y z ( R 1 C 1 ) + y ( 1 z ) ( R 1 C 1 + F P 2 ) + z ( 1 y ) ( R 1 C 1 ) + ( 1 y ) ( 1 z ) ( R 1 C 1 + F ) = R 1 C 1 + ( 1 z ) F y ( 1 z ) P 2
The expected return of “the government does not supervise investors” is
π g , 2 = y z R 1 + y ( 1 z ) R 1 + z ( 1 y ) R 1 + ( 1 y ) ( 1 z ) R 1 = R 1
The average expected return of the government is
π ¯ g = x π g , 1 + ( 1 x ) π g , 2      = R 1 x C 1 + x ( 1 z ) F x y ( 1 z ) P 2
Thus, the replicated dynamic equation of the government’s evolutionary strategy is
F ( x , y , z ) = d x d t = x ( π g , 1 π ¯ g ) = x ( 1 x ) [ ( 1 z ) F y ( 1 z ) P 2 C 1 ]
Similarly, the expected return of “the public participates in the project” is
π p , 1 = x z ( R 2 C 2 ) + x ( 1 z ) ( R 2 C 2 B 2 + P 2 ) + z ( 1 x ) ( R 2 C 2 ) + ( 1 x ) ( 1 z ) ( R 2 C 2 B 2 + P 1 ) = R 2 C 2 ( 1 z ) B 2 + ( 1 x ) ( 1 z ) P 1 + x ( 1 z ) P 2
The expected return of “the public does not participate in the project” is
π p , 2 = 0
The average expected return of the public is
π ¯ p = y π p , 1 + ( 1 y ) π p , 2 = y R 2 y C 2 y ( 1 z ) B 2 + y ( 1 x ) ( 1 z ) P 1 + x y ( 1 z ) P 2
Thus, the replicated dynamic equation of the public’s evolutionary strategy is
G ( x , y , z ) = d y d t = y ( π p , 1 π ¯ p ) = y ( 1 y ) [ x ( 1 z ) P 2 + ( 1 x ) ( 1 z ) P 1 ( 1 z ) B 2 + R 2 C 2 ]
Similarly, the expected return of “investors make efforts” is
π i , 1 = x y ( R 3 C 3 ) + x ( 1 y ) ( R 3 F ) + y ( 1 x ) ( R 3 C 3 ) + ( 1 x ) ( 1 y ) ( R 3 C 3 ) = ( x y y + 1 ) R 3 ( x y x + 1 ) C 3 ( x y ) F
The expected return of “investors do not make efforts” is
π i , 2 = x y ( R 3 F ) + x ( 1 y ) ( R 3 F ) + y ( 1 x ) ( R 3 P 1 ) + ( 1 x ) ( 1 y ) R 3 = ( 1 + x ) R 3 x F y ( 1 x ) P 1
The average expected return of investors is
π ¯ i = z π i , 1 + ( 1 z ) π i , 2 = x ( 1 y ) ( 1 z ) R 3 z ( x y x + 1 ) C 3 + ( y z x ) F y ( 1 x ) ( 1 z ) P 1
Thus, the replicated dynamic equation of invests’ evolutionary strategy is
H ( x , y , z ) = d z d t = z ( π i , 1 π ¯ i ) = z ( 1 z ) [ x F + y ( 1 x ) P 1 C 3 ]

References

  1. Gao, L.; Zhao, Z.Y. System Dynamics Analysis of Evolutionary Game Strategies between the Government and Investors Based on New Energy Power Construction Public-Private-Partnership (PPP) Project. Sustainability 2018, 10, 2533. [Google Scholar] [CrossRef] [Green Version]
  2. Zhao, Z.Y.; Chang, R.D.; Zillante, G. Challenges for China’s energy conservation and emission reduction. Energy Policy 2014, 74, 709–713. [Google Scholar] [CrossRef]
  3. The Central People’s Government of China. Guiding Opinions on Innovating Investment and Financing Mechanism in Key Areas and Encouraging Social Investment. 2014. Available online: http://www.gov.cn/zhengce/content/2014-11/26/content_9260.htm (accessed on 26 November 2014). (In Chinese)
  4. National Energy Administration. Circular on Actively Promoting the Mode of Cooperation between Government and Social Capital in the Field of Energy. 2016. Available online: http://zfxxgk.nea.gov.cn/auto81/201604/t20160413_2232.htm?keywords= (accessed on 31 March 2016). (In Chinese)
  5. Song, J.; Jin, L.; Zhao, Y.; Hu, W. Using bargaining-game model to negotiate compensation for the early termination of BOT highway projects. Transp. Res. Part A Policy Pract. 2017, 105, 197–209. [Google Scholar] [CrossRef]
  6. Jumbe, C.B.L.; Mkondiwa, M. Comparative analysis of biofuels policy development in Sub-Saharan Africa: The place of private and public sectors. Renew. Energy 2013, 50, 614–620. [Google Scholar] [CrossRef]
  7. Zhao, Z.Y.; Zhao, X.J.; Davidson, K.; Zuo, J. A corporate social responsibility indicator system for construction enterprises. J. Clean. Prod. 2012, 29–30, 277–289. [Google Scholar] [CrossRef]
  8. Burke, R.; Demirag, I. Risk transfer and stakeholder relationships in public private partnerships. Account. Forum 2017, 41, 28–43. [Google Scholar] [CrossRef]
  9. Clerck, D.D.; Demeulemeester, E. Creating a More Competitive PPP Procurement Market: Game Theoretical Analysis. J. Manag. Eng. 2016, 32, 04016015. [Google Scholar] [CrossRef]
  10. Gao, R.L.; Bao, Q. Selection of Government Supervision Mode during the Operational Period in PPP Projects based on Evolutionary Game Theory. Oper. Res. Manag. Sci. 2019, 28, 155–162. [Google Scholar]
  11. Zhang, Y.; Chen, T.; Wang, Y. Study on subsidy-punishment mechanism of contractors opportunistic behaviors in public cultural PPP projects based on evolutionary game theory. Hebei J. Ind. Sci. Technol. 2014, 31, 469–473. [Google Scholar]
  12. Yang, X.; Zhang, J. PPP for Existing Building Green Retrofit: Perspective of Evolutionary Game. China Soft Sci. 2019, 339, 188–197. [Google Scholar]
  13. James, O.; Jilke, S.; Petersen, C.; Van de Walle, S. Citizen’ Blame of Politicians for Public Service Failure: Experimental Evidence about Blame Reduction through Delegation and Contracting. Public Adm. Rev. 2016, 76, 83–93. [Google Scholar] [CrossRef] [Green Version]
  14. Zeng, L.; Li, J.; Li, M. A Study on the Validity of Citizens’ Subjective Evaluation of Public Service: Empirical Analysis Based on Ground- level Police Service in Z City. Manag. Rev. 2015, 27, 83–95+104. [Google Scholar]
  15. Jia, X.D.; Hao, G. The Definition of Virtual Government and Its Organization Model Construction Based on Classical Grounded Theory. China Ind. Econ. 2013, 8, 31–43. [Google Scholar]
  16. Li, C.; Li, X.; Wang, Y. Evolutionary Game Analysis of the Supervision Behavior for Public-Private Partnership Projects with Public Participation. Math. Probl. Eng. 2016, 2, 1–8. [Google Scholar] [CrossRef]
  17. Yang, X.; Zhang, J.; Shen, G.Q.; Yan, Y. Incentives for green retrofits: An evolutionary game analysis on Public-Private-Partnership reconstruction of buildings. J. Clean. Prod. 2019, 232, 1076–1092. [Google Scholar] [CrossRef]
  18. Fang, Y.; Wei, W.; Liu, F.; Mei, S.; Chen, L.; Li, J. Improving solar power usage with electric vehicles: Analyzing a public-private partnership cooperation scheme based on evolutionary game theory. J. Clean. Prod. 2019, 233, 1284–1297. [Google Scholar] [CrossRef]
  19. Wang, G.; Xue, Y.; Skibniewski, M.J.; Song, J.; Lu, H. Analysis of Private Investors Conduct Strategies by Governments Supervising Public-Private Partnership Projects in the New Media Era. Sustainability 2018, 10, 4723. [Google Scholar] [CrossRef] [Green Version]
  20. Guo, B.; Li, J. Research on the evolution of participants collaboration mechanism in PPP model based on computer simulation: Based on the old community renovation project. J. Supercomput. 2018, 1–18. [Google Scholar] [CrossRef]
  21. Li, L.; Li, Z.; Jiang, L.; Wu, G.; Cheng, D. Enhanced cooperation among stakeholders in PPP mega-infrastructure projects: A China study. Sustainability 2018, 10, 2791. [Google Scholar] [CrossRef] [Green Version]
  22. Liu, Q.; Li, X.; Meng, X. Effectiveness research on the multi-player evolutionary game of coal-mine safety regulation in China based on system dynamics. Saf. Sci. 2019, 111, 224–233. [Google Scholar] [CrossRef]
  23. Xie, H.; Wang, W.; Zhang, X. Evolutionary game and simulation of management strategies of fallow cultivated land: A case study in Hunan province, China. Land Use Policy 2018, 71, 86–97. [Google Scholar] [CrossRef]
  24. Trevor, L.B.; Matthew, P. Transaction Costs and Institutional Explanations for Government Service Production Decisions. J. Public Adm. Res. Theory 2003, 13, 441–468. [Google Scholar]
  25. Jilek, P.; SILOVSKÁ, H.Č.; KOLAŘÍK, P.; Lukavec, M. Selection of quantitative and qualitative methods for comprehensive evaluation of PPP projects focusing on the Czech Republic. Transylv. Rev. Adm. Sci. 2018, 54, 38–54. [Google Scholar] [CrossRef]
  26. Reynaers, A.M.; Wal, Z.V.D. Do Partners in PPPs view Public and Private Management Differently? Aust. J. Public Adm. 2018, 77, 294–308. [Google Scholar] [CrossRef]
  27. Whitaker, G.P. Coproduction: Citizen Participation in Service Delivery. Public Adm. Rev. 1980, 40, 240–246. [Google Scholar] [CrossRef]
  28. Osei-Kyei, R.; Chan, A.P.; Dansoh, A.; Ofori-Kuragu, J.K.; Oppong, G.D. Strategies for Effective Management of Unsolicited Public-Private Partnership Proposals. J. Manag. Eng. 2018, 34, 04018006. [Google Scholar] [CrossRef]
  29. Friedman, D. Evolutionary games in economics. Econometrica 1991, 59, 637–666. [Google Scholar] [CrossRef] [Green Version]
  30. He, J.; Lin, B. Assessment of waste incineration power with considerations of subsidies and emissions in China. Energy Policy 2019, 126, 190–199. [Google Scholar] [CrossRef]
  31. Yang, N.; Zhang, H.; Chen, M.; Shao, L.M.; He, P.J. Greenhouse gas emissions from MSW incineration in China: Impacts of waste characteristics and energy recovery. Waste Manag. 2012, 32, 2552–2560. [Google Scholar] [CrossRef]
  32. Cheng, H.; Hu, Y. Municipal solid waste (MSW) as a renewable source of energy: Current and future practices in China. Bioresour. Technol. 2010, 101, 3816–3824. [Google Scholar] [CrossRef]
  33. State Statistical Bureau. China Energy Statistical Yearbook 2016; China Statistics Press: Beijing, China, 2017. (In Chinese) [Google Scholar]
  34. State Statistical Bureau. China Environmental Statistics Yearbook 2016; China Statistics Press: Beijing, China, 2017. (In Chinese) [Google Scholar]
  35. Zhao, X.G.; Zhang, Y.Z.; Ren, L.Z.; Zuo, Y.; Wu, Z.G. The policy effects of feed-in tariff and renewable portfolio standard: A case study of China’s waste incineration power industry. Waste Manag. 2017, 68, 711–723. [Google Scholar]
  36. Song, J.; Sun, Y.; Jin, L. PESTEL analysis of the development of the waste-to-energy incineration industry in China. Renew. Sustain. Energy Rev. 2017, 80, 276–289. [Google Scholar] [CrossRef]
  37. Chinese Government Purchase Service Information Platform. Pre-transaction Notice of Competitive Consultation for PPP Project of Domestic Waste Incineration Power Generation in Sishui County. 2018. Available online: http://www.ccgp.gov.cn/cggg/dfgg/jjjggg/201804/t20180411_9771803.htm?flyarg=1&flyarg=2&gt; (accessed on 11 April 2018). (In Chinese)
  38. Lu, J.W.; Zhang, S.; Hai, J.; Lei, M. Status and perspectives of municipal solid waste incineration in China: A comparison with developed regions. Waste Manag. 2017, 69, 170–186. [Google Scholar] [CrossRef] [PubMed]
  39. Zhou, Z.; Tang, Y.; Dong, J.; Chi, Y.; Ni, M.; Li, N.; Zhang, Y. Environmental performance evolution of municipal solid waste management by life cycle assessment in Hangzhou, China. J. Environ. Manag. 2018, 227, 23–33. [Google Scholar] [CrossRef] [PubMed]
  40. China Electricity Council. Statistical Information of China’s Electric Power Data. 2019. Available online: http://www.cec.org.cn/guihuayutongji/tongjxinxi/ (accessed on 21 December 2019). (In Chinese).
  41. Tian, Y.; Govindan, K.; Zhu, Q. A system dynamics model based on evolutionary game theory for green supply chain management diffusion among Chinese manufacturers. J. Clean. Prod. 2014, 80, 96–105. [Google Scholar] [CrossRef]
  42. Zhu, Q.; Wang, Y.; Tian, Y. Analysis of an evolutionary game between local governments and manufacturing enterprises under carbon reduction policies based on system dynamics. Oper. Res. Manag. Sci. 2014, 23, 71–82. [Google Scholar]
  43. Visconti, R.M. Healthcare public-private partnerships in Italy: Assessing risk sharing and governance issues with pestle and swot analysis. Corp. Ownersh. Control 2016, 13, 122–131. [Google Scholar] [CrossRef]
Figure 1. The process and steps of solving problems of system dynamics (SD).
Sustainability 12 01045 g001
Figure 2. System flow graph and its representation symbols.
Sustainability 12 01045 g002
Figure 3. The stock and flow diagram (SFD) of dynamic game among the government, investors, and the public.
Sustainability 12 01045 g003
Figure 4. The basic sample system.
Sustainability 12 01045 g004
Figure 5. The simulation results of the basic sample system.
Sustainability 12 01045 g005
Figure 6. The evolution process when y 0 = 0.01 and z 0 = 0.01 .
Sustainability 12 01045 g006
Figure 7. Investors’ strategy evolution under the public participation.
Sustainability 12 01045 g007
Figure 8. The changing trend of the government’s strategy choice.
Sustainability 12 01045 g008
Figure 9. The impact of E N B , U P 2 , U B 2 and p n on the public’s strategy choice.
Sustainability 12 01045 g009
Figure 10. The impact of the difference between U P 2 and U B 2 on the public’s strategy choice.
Sustainability 12 01045 g010
Figure 11. The impact of U F and L C O E on investors’ strategy choice.
Sustainability 12 01045 g011
Table 1. The payment return matrix in the case of the government adopting a supervision strategy for investors.
Investor
Effort   ( z ) No   Effort   ( 1 z )
The publicParticipation ( y ) ( R 1 C 1 , R 2 C 2 , R 3 C 3 ) ( R 1 C 1 + F P 2 , R 2 C 2 B 2 + P 2 , R 3 F )
no participation ( 1 y ) ( R 1 C 1 , 0 , R 3 C 3 ) ( R 1 C 1 + F , 0 , R 3 F )
Table 2. The payment return matrix in the case of the government adopting a non-supervision strategy for investors.
Investor
Effort   ( z ) No   Effort   ( 1 z )
The publicParticipation ( y ) ( R 1 , R 2 C 2 , R 3 C 3 ) ( R 1 , R 2 C 2 B 2 + P 1 , R 3 P 1 )
no participation ( 1 y ) ( R 1 , 0 , R 3 C 3 ) ( R 1 , 0 , R 3 )
Table 3. The meaning of each parameter.
Game PlayersParametersMeanings
The government R 1 The government’s revenue from project operation
C 1 The government’s supervision costs to investors
F Investors’ fines for the government when investors do not make efforts
P 1 The government’s predetermined compensation for the public when the government does not supervise investors
The public R 2 The public’s revenue when it participates in the project
C 2 The public’s cost when it participates in the project
B 2 Investors’ damage to the public due to its no effort
P 2 Compensation for damage to the public when the government supervise investors
Investors R 3 Investors’ revenue of the project
C 3 Investors’ costs
Table 4. The stability analysis of equilibrium points.
Local Equilibrium Point det ( J ) t r ( J )
( 0 , 0 , 0 ) ( P 1 + C 3 ) ( C 1 F ) ( P 1 B 2 + R 2 C 2 ) F + R 2 B 2 C 1 C 2 C 3
( 0 , 0 , 1 ) C 1 ( P 1 + C 3 ) ( C 2 P 1 R 2 ) 2 P 1 + R 2 C 1 C 2 + C 3
( 0 , 1 , 0 ) C 3 ( K C 1 ) ( P 1 B 2 + R 2 C 2 ) B 2 + K P 1 R 2 C 1 + C 2 C 3
( 0 , 1 , 1 ) C 1 C 3 ( P 1 + R 2 C 2 ) C 2 + C 3 P 1 R 2 C 1
( 1 , 0 , 0 ) ( F C 1 ) ( F C 3 ) ( C 2 + B 2 P 2 R 2 ) R 2 + P 2 + C 1 B 2 C 2 C 3
( 1 , 0 , 1 ) C 1 ( C 2 R 2 ) ( F C 3 ) R 2 + C 1 C 2 + C 3 F
( 1 , 1 , 0 ) ( F C 1 ) ( F C 3 ) ( P 2 + R 2 B 2 C 2 ) C 1 + C 2 C 3 + B 2 P 2 R 2
( 1 , 1 , 1 ) C 1 ( R 2 C 2 ) ( F C 3 ) C 1 + C 2 + C 3 F R 2
Table 5. The related variables and explanations.
VariableExplanationUnit
x 0 The initial value of probability of government supervision-
y 0 The initial value of probability of the public participation-
z 0 The initial value of probability of investors’ effort-
A G Annual power generation of new energy power PPP projectkWh
G S C Unit power generation cost of government supervision
p n The share of new energy in residents’ electricity priceDollar/kWh
L C O E Levelized cost of electricity of the new energy projectDollar/kWh
E C B Unit power generation cost of economic benefitDollar/kWh
E N B Unit power generation cost of environment benefitDollar/kWh
p The on-grid price of the new energy projectDollar/kWh
U P 1 The government’s unit predetermined compensation for the public when the government does not supervise investorsDollar/kWh
U P 2 The unit compensation for damage to the public when the government supervise investorsDollar/kWh
U F Unit fineDollar/kWh
U B 2 Investors’ unit damage to the public due to its no effortDollar/kWh
Table 6. The assumed base values.
Parameter R 1 R 2 R 3 C 1 C 2 C 3
Assumed value8510385
Table 7. Simulation data.
VariableValueUnit
Annual power generation of new energy power PPP project ( A G )3.24 × 10¹⁰kWh
Unit power generation cost of economic benefit ( E C B )0.1Dollar/kWh
Unit power generation cost of environment benefit ( E N B )0.103Dollar/kWh
Unit power generation cost of government supervision ( G S C )0.017Dollar/kWh
Levelized cost of electricity of the new energy project ( L C O E )0.138Dollar/kWh
The on-grid price of the new energy project ( p )0.098Dollar/kWh
The share of new energy in residents’ electricity price ( p n )0.01Dollar/kWh
Table 8. The index system and results under different conditions (unit: million dollars).
The Government’s BenefitThe Public’s BenefitInvestors’ BenefitPPP’s Economic Benefit
( 1 , 0 , 0 ) −60.530.245.490.7
( 1 , 1 , 0 ) 30.2105.975.6166.4
( 0 , 1 , 0 ) 15.1−90.775.6105.9
( 0 , 1 , 1 ) 45.4121.090.7196.6
( 0 , 0 , 1 ) 30.245.460.5105.9
( 1 , 0 , 1 ) 45.430.290.7136.1
( 1 , 1 , 1 ) 90.7166.4136.1242.0
Table 9. The economic and environmental benefits of PPP projects with the changes of factors affecting the government’s strategy choice (unit: million dollars).
Benchmark Scenario The   Change   of   G S C The   Change   of   U F
G S C = 0.017 U F = 0.091 G S C = 0.003 G S C = 0.03 U F = 0.06 U F = 0.121
PPP’s economic benefit242.0272.2211.7196.6257.1
PPP’s environmental benefit272.2302.5226.9211.7287.4
Table 10. The economic and environmental benefits of PPP projects with the changes of factors affecting the public’s strategy choice (unit: million dollars).
U P 2 > U B 2 U P 2 = U B 2 U P 2 < U B 2
PPP’s economic benefit257.1211.760.5
PPP’s environmental benefit287.4242.075.6
Table 11. The economic and environmental benefits of PPP projects with the changes of factors affecting investors’ strategy choice (unit: million dollars).
Benchmark Scenario The   Change   of   U F The   Change   of   L C O E
U F = 0.091 L C O E = 0.138 U F = 0.06 U F = 0.121 L C O E = 0.121 L C O E = 0.151
PPP’s economic benefit242.0226.9257.1257.1226.9
PPP’s environmental benefit272.2242.0287.4287.4257.1

