Evaluation Indexes and Correlation Analysis of Origination–Destination Travel Time of Nanjing Metro Based on Complex Network Method
Abstract
:1. Introduction
2. Overview of Nanjing Metro and Analysis Process
2.1. Development of Nanjing Metro Lines
2.2. Smart Card Big Data of Nanjing Metro
2.3. Correlation Analysis Process
3. Data Preprocessing
4. Evaluation Indexes of OD Travel Time
4.1. Time Index
- (1).
- Use Time Probability
- (2).
- Passenger Flow between Stations
- (3).
- Average Time between Stations
- (4).
- Time Variance between Stations
4.2. Complex Network Index
- (1).
- Space P Model and Minimum Number of Rides
- (2).
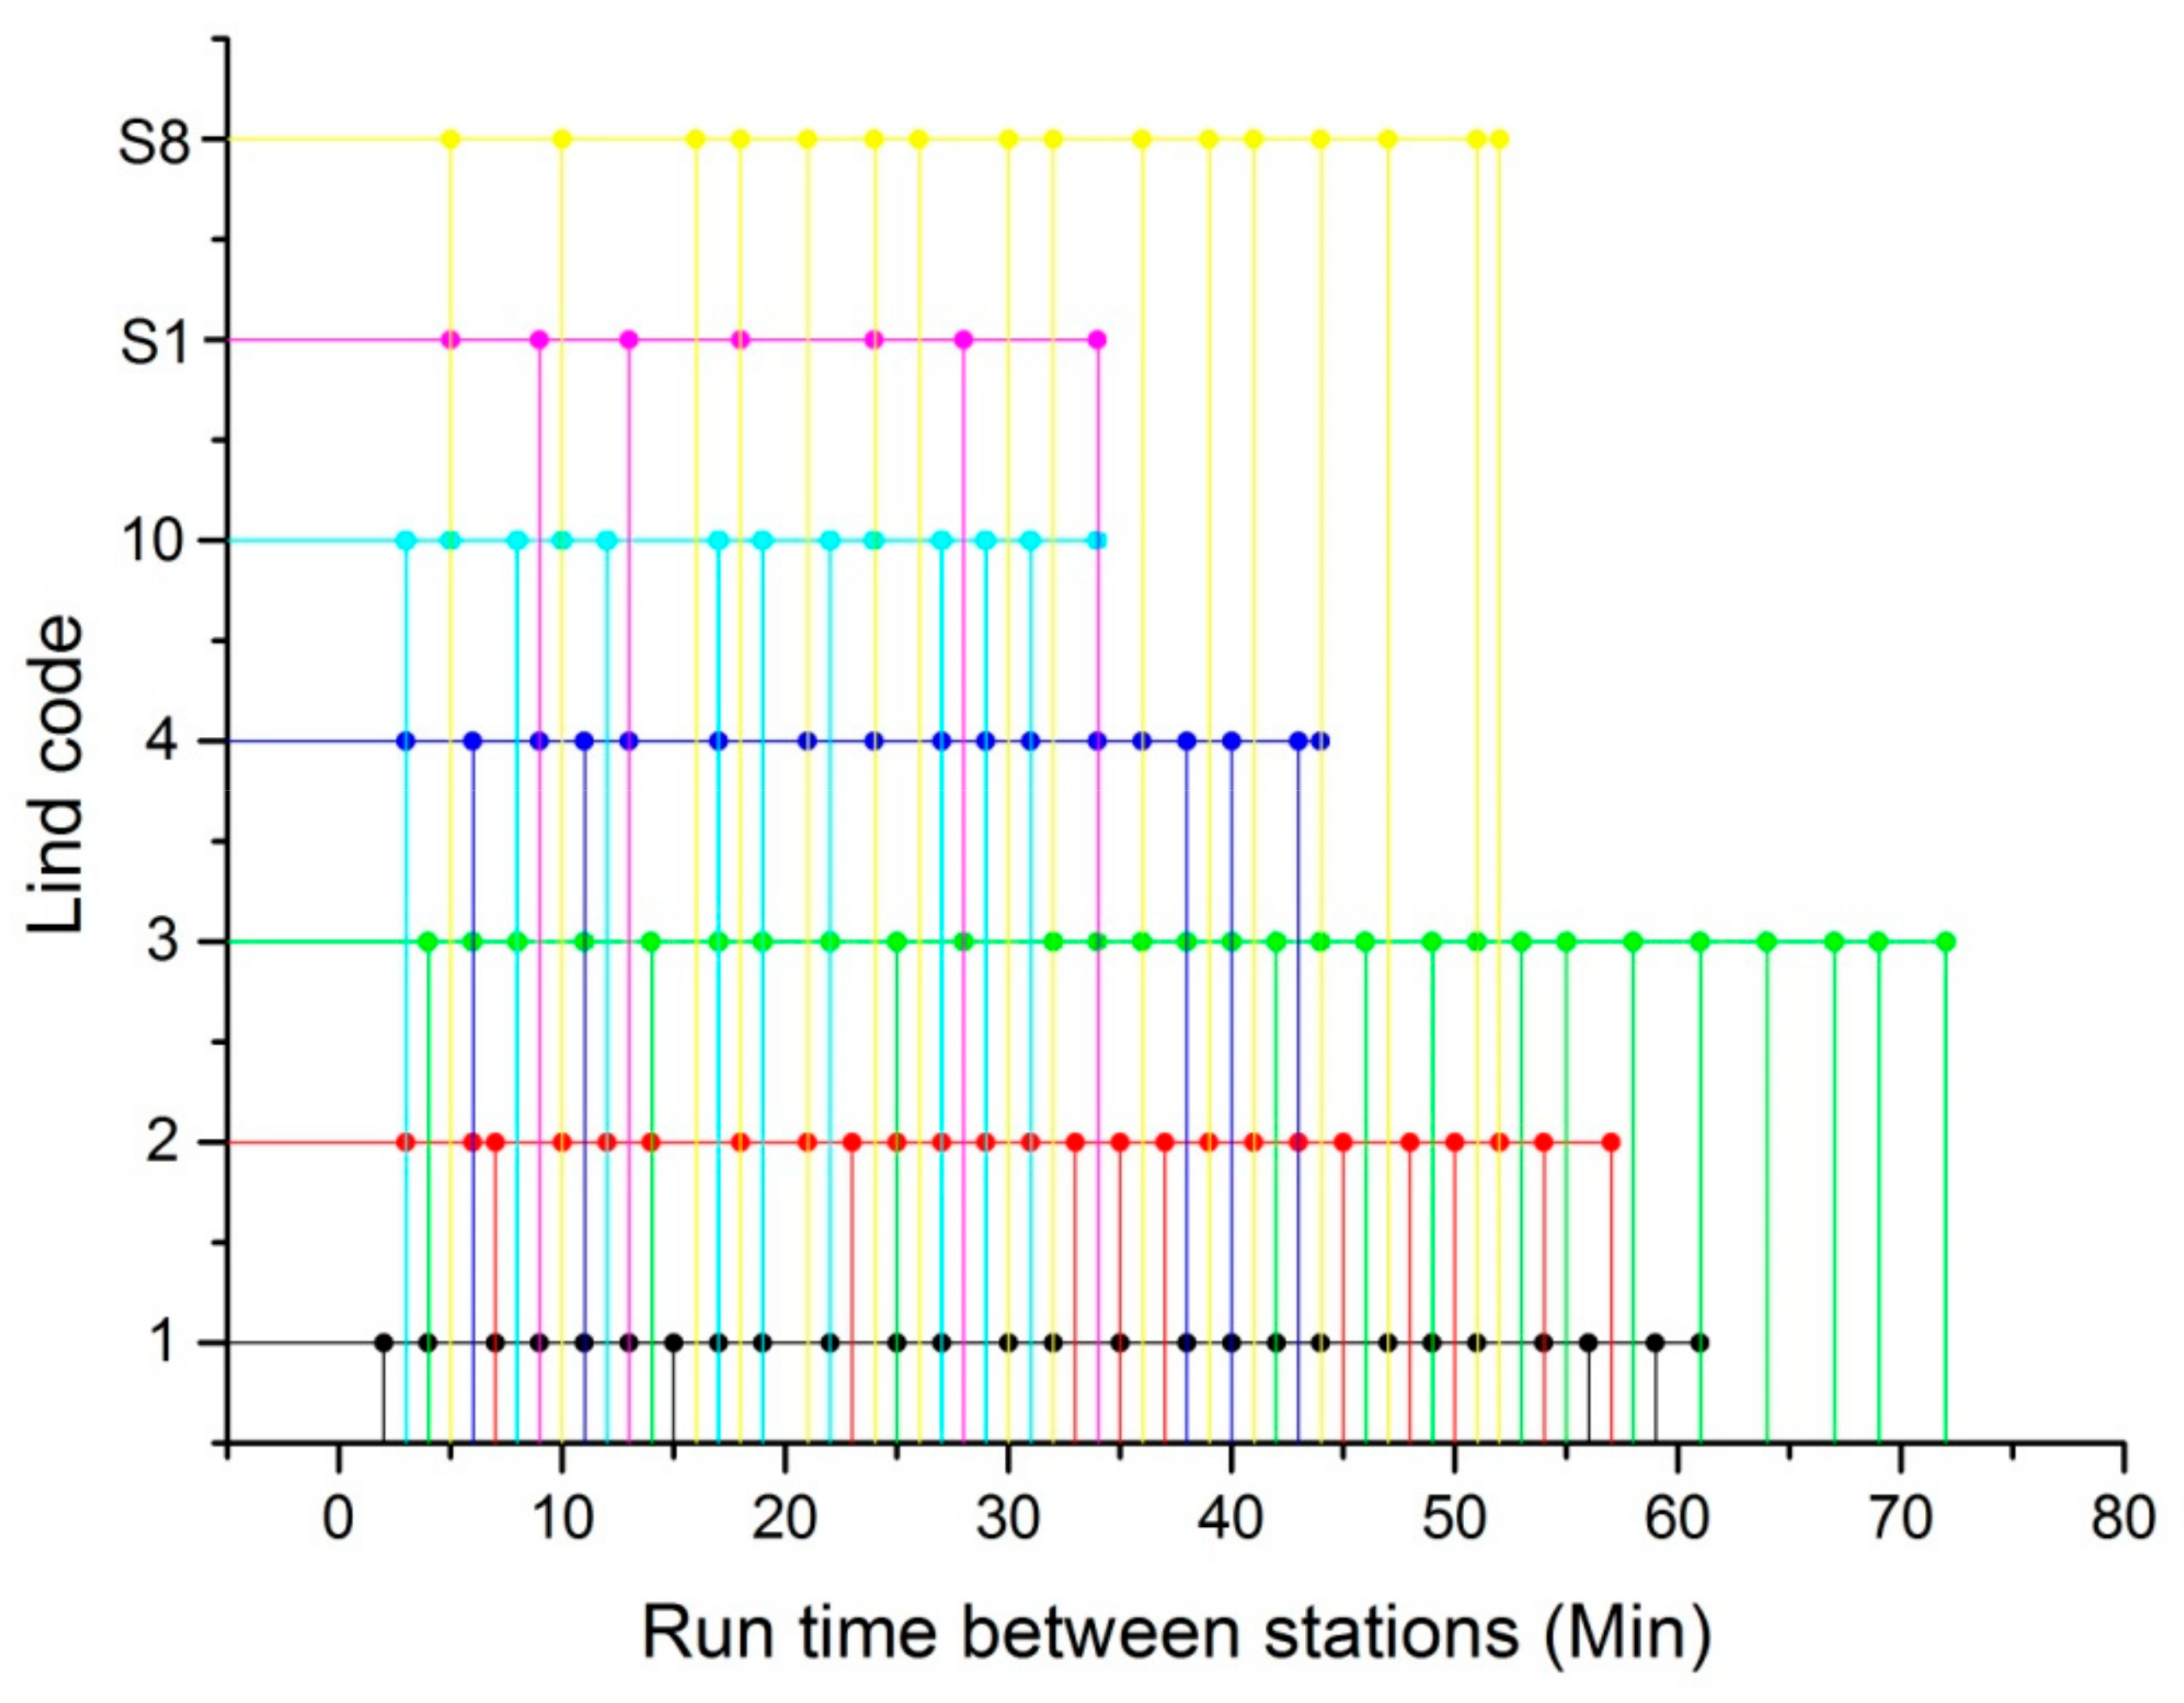
- Ride Time Model and Shortest Ride Time
4.3. Composite Index
- (1).
- Flow Efficiency between Stations
- (2).
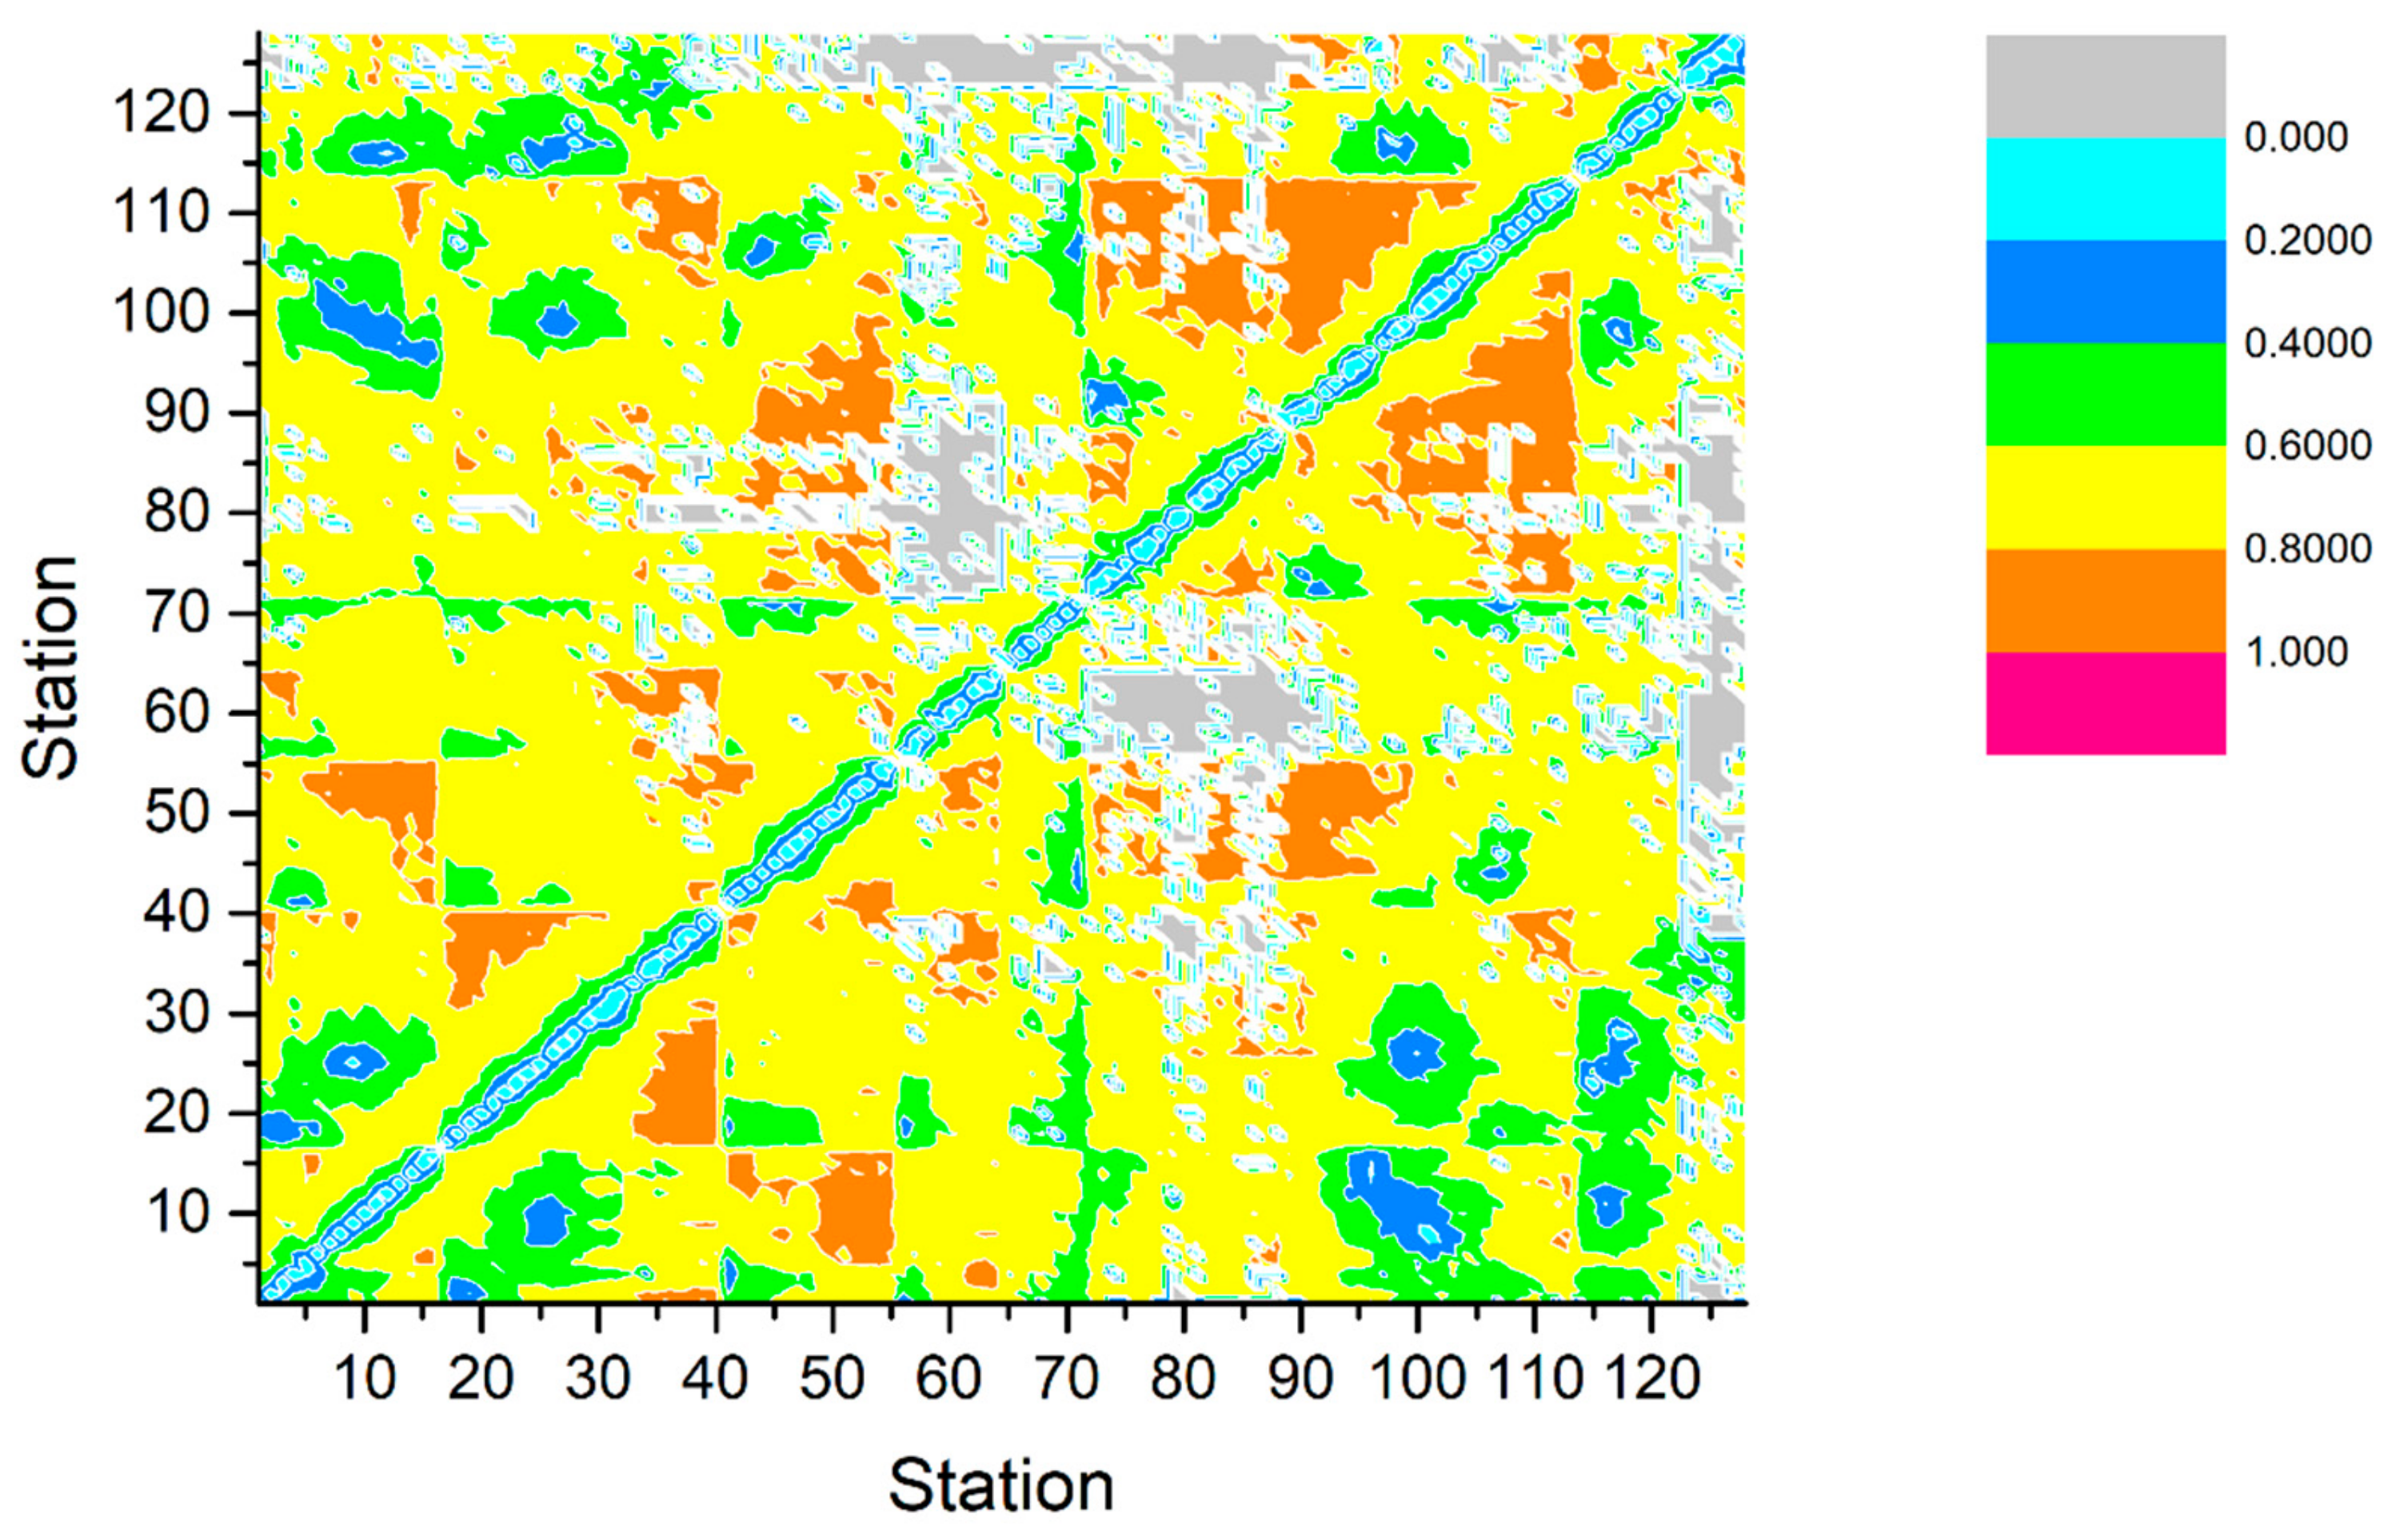
- Network Flow Efficiency
5. Correlation Analysis
5.1. Pearson Correlation Model
5.2. Correlation Analysis of Travel Time between Stations
5.3. Correlation Analysis of Waiting Time between Stations
5.4. Correlation Analysis of Flow Efficiency between Stations
6. Conclusions
Author Contributions
Funding
Acknowledgments
Conflicts of Interest
References
- Kim, H.; Nam, D.; Suh, W.; Cheon, S.H. Origin-destination trip table estimation based on subarea network OD flow and vehicle trajectory data. Transp. Plan. Technol. 2018, 41, 265–285. [Google Scholar] [CrossRef]
- Kim, K.; Kim, V.; Kim, H. Spatiotemporal auto-regressive model for origin–destination air passenger flows. J. R. Stat. Soc. Ser. A 2019, 182, 1003–1016. [Google Scholar] [CrossRef]
- Zhang, C.; Wang, J.; Lai, J.; Yang, X.; Su, Y.; Dong, Z. Extracting origin-destination with vehicle trajectory data and applying to coordinated ramp metering. J. Adv. Transp. 2019, 8, 8469316. [Google Scholar] [CrossRef] [Green Version]
- Liu, L.; Qiu, Z.; Li, G.; Wang, Q.; Ouyang, W.; Lin, L. Contextualized spatial-temporal network for taxi origin-destination demand prediction. Ieee Trans. Intell. Transp. Syst. 2019, 20, 3875–3887. [Google Scholar] [CrossRef] [Green Version]
- Bachir, D.; Khodabandelou, G.; Gauthier, V.; El Yacoubi, M.; Puchinger, J. Inferring dynamic origin-destination flows by transport mode using mobile phone data. Transp. Res. Part C Emerg. Technol. 2019, 101, 254–275. [Google Scholar] [CrossRef] [Green Version]
- Bachir, D.; Khodabandelou, G.; Gauthier, V.; El Yacoubi, M.; Puchinger, J. Constructing time-dependent origin-destination matrices with adaptive Zoning scheme and measuring their similarities with taxi trajectory data. IEEE Access 2019, 7, 77723–77737. [Google Scholar]
- Javani, B.; Babazadeh, A. Origin-destination-based truncated quadratic programming algorithm for traffic assignment problem. Transp. Lett. Int. J. Transp. Res. 2016, 9, 166–176. [Google Scholar] [CrossRef]
- Mehrabipour, M.; Hajibabai, L.; Hajbabaie, A. A decomposition scheme for parallelization of system optimal dynamic traffic assignment on urban networks with multiple origins and destinations. Comput. Aided Civ. Infrastruct. Eng. 2019, 34, 915–931. [Google Scholar] [CrossRef]
- Hoang, N.H.; Vu, H.L.; Panda, M.; Lo, H.K. A linear framework for dynamic user equilibrium traffic assignment in a single origin-destination capacitated network. Transp. Res. Part B Methodol. 2019, 126, 329–352. [Google Scholar] [CrossRef]
- Wang, Y.; Ma, X.; Liu, Y.; Gong, K.; Henricakson, K.C.; Xu, M.; Wang, Y. A two-stage algorithm for origin-destination matrices estimation considering dynamic dispersion parameter for route choice. PLoS ONE 2016, 11, e0146850. [Google Scholar]
- Li, D.; Miwa, T.; Xu, C.; Li, Z. Non-linear fixed and multi-level random effects of origin-destination specific attributes on route choice behavior. Iet Intell. Transp. Syst. 2019, 13, 654–660. [Google Scholar] [CrossRef]
- Ou, J.; Lu, J.; Xia, J.; An, C.; Lu, Z. Learn, assign and search: Real-time estimation of dynamic origin-destination flows using machine learning algorithms. IEEE Access 2019, 7, 26967–26983. [Google Scholar] [CrossRef]
- Duan, Z.; Zhang, K.; Chen, Z.; Liu, Z.; Tang, L.; Yang, Y.; Ni, Y. Prediction of city-scale dynamic taxi origin-destination flows using a hybrid deep neural network combined with travel time. IEEE Access 2019, 7, 127816–127832. [Google Scholar] [CrossRef]
- Yang, S.; An, C.; Wu, Y.J.; Xia, J. Origin-destination-based travel time reliability. Transp. Res. Rec. J. Transp. Res. Board 2017, 2643, 139–159. [Google Scholar] [CrossRef]
- Margaretic, P.; Thomas-Agnan, C.; Doucet, R. Spatial dependence in (origin-destination) air passenger flows. Pap. Reg. Sci. 2017, 96, 357–380. [Google Scholar] [CrossRef] [Green Version]
- Hanseler, F.S.; Molyneaux, N.A.; Bierlaire, M. Estimation of pedestrian origin-destination demand in train stations. Transp. Sci. 2017, 51, 981–997. [Google Scholar] [CrossRef] [Green Version]
- Nigro, M.; Cipriani, E.; Giudice, A. Exploiting floating car data for time-dependent Origin-Destination matrices estimation. J. Intell. Transp. Syst. 2017, 22, 159–174. [Google Scholar] [CrossRef]
- Ma, W.; Qian, Z. Statistical inference of probabilistic origin-destination demand using day-to-day traffic data. Transp. Res. Part C Emerg. Technol. 2018, 88, 227–256. [Google Scholar] [CrossRef] [Green Version]
- Dai, X.; Sun, L.; Xu, Y. Short-term origin-destination based metro flow prediction with probabilistic model selection approach. J. Adv. Transp. 2018, 2018, 5942763. [Google Scholar] [CrossRef]
- Wang, J.; Deng, W.; Guo, Y. New bayesian combination method for short-term traffic flow forecasting. Transp. Res. Part C Emerg. Technol. 2014, 43, 79–94. [Google Scholar] [CrossRef]
- Zhu, S.; Zheng, H.; Peeta, S.; Guo, Y.; Cheng, L.; Sun, W. Optimal heterogeneous sensor deployment strategy for dynamic origin-destination demand estimation. Transp. Res. Rec. J. Transp. Res. Board 2016, 2567, 18–27. [Google Scholar] [CrossRef]
- Zhu, N.; Ma, S.; Zheng, L. Travel time estimation oriented freeway sensor placement problem considering sensor failure. J. Intell. Transp. Syst. 2017, 1, 26–40. [Google Scholar] [CrossRef]
- Hobson, B.; Lowcay, D.; Gunay, H.B. Opportunistic occupancy-count estimation using sensor fusion: A case study. Build. Env. 2019, 159, 1061154. [Google Scholar] [CrossRef]
- Moslem, S.; Ghorbanzadeh, O.; Blaschke, T.; Duleba, S. Analysing stakeholder consensus for a sustainable transport development decision by the fuzzy AHP and interval AHP. Sustainability 2019, 11, 3271. [Google Scholar] [CrossRef] [Green Version]
- Ghorbanzadeh, O.; Moslem, S.; Blaschke, T.; Duleba, S. Sustainable urban transport planning considering different stakeholder groups by an interval-AHP decision support model. Sustainability 2019, 11, 9. [Google Scholar] [CrossRef] [Green Version]
- Duleba, S.; Moslem, S. Sustainable urban transport development with stakeholder participation, an AHP-Kendall model: A case study for Mersin. Sustainability 2018, 10, 3647. [Google Scholar] [CrossRef] [Green Version]
- Duleba, S.; Moslem, S. Examining Pareto optimality in analytic hierarchy process on real Data: An application in public transport service development. Expert Syst. Appl. 2019, 116, 21–30. [Google Scholar] [CrossRef]
- Moslem, S.; Duleba, S. Sustainable urban transport development by applying a Fuzzy-AHP model: A case study from Mersin, Turkey. Urban Sci. 2019, 3, 55. [Google Scholar] [CrossRef] [Green Version]
- Jiang, X.; Wang, H.; Guo, X.; Gong, X. Using the FAHP, ISM, and MICMAC approaches to study the sustainability influencing factors of the last mile delivery of rural E-commerce logistics. Sustainability 2019, 11, 3937. [Google Scholar] [CrossRef] [Green Version]
- Guo, Y.; Wang, J.; Peeta, S. Impacts of internal migration, household registration system, and family planning policy on travel mode choice in China. Travel Behav. Soc. 2018, 13, 128–143. [Google Scholar] [CrossRef]
- Ruan, Y.; Zhu, D.; Lu, J. Social adaptation and adaptation pressure among the “drifting elderly” in China: A qualitative study in Shanghai. Int. J. Health Plan. Manag. 2019, 34, 1149–1165. [Google Scholar] [CrossRef]
- Guo, Y.; Peeta, S. Impacts of personalized accessibility information on residential location choice and travel behavior. Travel Behav. Soc. 2020, 19, 99–111. [Google Scholar] [CrossRef]
- Li, Y.; Guo, Y.; Lu, J.; Peeta, S. Impacts of congestion pricing and reward strategies on automobile travelers’ morning commute mode shift decisions. Transp. Res. Part A Policy Pr. 2019, 125, 72–88. [Google Scholar] [CrossRef]
- Wang, D.; Lin, T. Built environment, travel behavior, and residential self-selection: A study based on panel data from Beijing, China. Transportation 2019, 46, 51–74. [Google Scholar] [CrossRef]
- Cheng, G.; Zhao, S.; Li, J. The effects of latent attitudinal variables and sociodemographic differences on travel behavior in two small, underdeveloped cities in China. Sustainability 2019, 11, 1306. [Google Scholar] [CrossRef] [Green Version]
- Guo, Y.; Wang, J.; Peeta, S.; Anastasopoulos, P.C. Personal and societal impacts of motorcycle ban policy on motorcyclists’ home-to-work morning commute in China. Travel Behav. Soc. 2020, 19, 137–150. [Google Scholar] [CrossRef]
- Feng, J.; Li, X.; Mao, B.; Xu, Q.; Bai, Y. Weighted complex network analysis of the different patterns of metro traffic flows on weekday and weekend. Discret. Dyn. Nat. Soc. 2016, 2016, 9865230. [Google Scholar] [CrossRef]
- Saberi, M.; Mahmassani, H.S.; Brockmann, D.; Hosseini, A. A complex network perspective for characterizing urban travel demand patterns: Graph theoretical analysis of large-scale origin-destination demand networks. Transportation 2017, 44, 1383–1402. [Google Scholar] [CrossRef]
- Zhang, J.; Wang, S.; Wang, X. Comparison analysis on vulnerability of metro networks based on complex network. Phys. A Stat. Mech. Its Appl. 2019, 496, 72–78. [Google Scholar] [CrossRef]
- Wu, X.; Dong, H.; Tse, C.K.; Ho, I.W.; Lau, F.C. Analysis of metro network performance from a complex network perspective. Phys. A Stat. Mech. Its Appl. 2018, 492, 553–563. [Google Scholar] [CrossRef]
- Wei, Y.; Ning, S. Establishment and analysis of the supernetwork model for Nanjing metro transportation system. Complexity 2018, 2018, 4860531. [Google Scholar] [CrossRef]
- Yu, W.; Chen, J.; Yan, X. Space-time evolution analysis of the Nanjing metro network based on a complex network. Sustainability 2019, 11, 523. [Google Scholar] [CrossRef] [Green Version]
- Yu, W.; Wang, T.; Zheng, Y.; Chen, J. Parameter Selection and Evaluation of Robustness of Nanjing Metro Network Based on Supernetwork. IEEE Access 2019, 7, 70876–70890. [Google Scholar] [CrossRef]
- Kanwar, K.; Kumar, H.; Kaushal, S. Complex network based comparative analysis of Delhi Metro network and its extension. Phys. A Stat. Mech. Its Appl. 2019, 526, 120991. [Google Scholar] [CrossRef]
- Yang, M.; Liu, X.; Wang, W.; Li, Z.; Zhao, J. Empirical analysis of a mode shift to using public bicycles to access the suburban metro: Survey of Nanjing, China. J. Urban Plan. Dev. 2016, 12, 05015011. [Google Scholar] [CrossRef]
- Li, J.; Li, X.; Chen, D.; Godding, L. Assessment of metro ridership fluctuation caused by weather conditions in Asian context: Using archived weather and ridership data in Nanjing. J. Transp. Geogr. 2018, 66, 356–368. [Google Scholar] [CrossRef]
- Zhao, D.; Wang, W.; Li, C.; Ji, Y.; Hu, X.; Wang, W. Recognizing metro-bus transfers from smart card data. Transp. Plan. Technol. 2019, 42, 70–83. [Google Scholar] [CrossRef]
- Yu, W.; Bai, H.; Chen, J.; Yan, X. Analysis of space-time variation of passenger flow and commuting characteristics of residents using smart card data of Nanjing metro. Sustainability 2019, 11, 4989. [Google Scholar] [CrossRef] [Green Version]
- Yu, W.; Bai, H.; Chen, J.; Yan, X. Anomaly detection of passenger OD on Nanjing metro based on smart card big data. IEEE Access 2019, 7, 138624–138636. [Google Scholar] [CrossRef]
- Yu, J.; Ji, Y.; Gao, L.; Gao, Q. Optimization of metro passenger organizing of alighting and boarding processes: Simulated evidence from the metro station in Nanjing, China. Sustainability 2019, 11, 3682. [Google Scholar] [CrossRef] [Green Version]






| Opening Sequence | Number of Stations | Length (km) | Opening Year |
|---|---|---|---|
| 1 | 27(16) | 38.9 | 2005 |
| 2 | 26 | 37.9 | 2010 |
| 10 | 14 | 21.6 | 2014 |
| S1 | 8 | 37.3 | 2014 |
| S8 | 17 | 45.2 | 2014 |
| 3 | 29 | 44.9 | 2015 |
| 4 | 18 | 33.8 | 2017 |
| Line Code | Origination | Destination | Station Code |
|---|---|---|---|
| 1 | maigaoqiao | zhongguoyaokedaxue | [16, 15, 14, 13, 12, 11, 10, 9, 8, 7, 6, 5, 41, 42, 43, 44, 45, 46, 47, 48, 49, 50, 51, 52, 53, 54, 55] |
| 2 | jingtianlu | youfangqiao | [40, 39, 38, 37, 36, 35, 34, 33, 32, 31, 30, 29, 28, 27, 26, 9, 25, 24, 23, 22, 21, 20, 19, 2, 18, 17] |
| 3 | linchang | mouzhoudonglu | [89, 90, 91, 73, 92, 93, 94, 95, 96, 14, 97, 98, 99, 26, 100, 101, 102, 103, 104, 105, 106, 44, 107, 108, 109, 110, 111, 112, 113] |
| 4 | xianlinhu | longjiang | [128, 127, 126, 125, 124, 123, 34, 122, 121, 120, 119, 118, 117, 98, 11, 116, 115, 114 |
| 10 | yushanlu | andemen | [64, 63, 62, 61, 60, 59, 58, 57, 56, 1, 2, 3, 4, 5] |
| S1 | nanjingnanzhan | lukoujichang | [44, 71, 70, 69, 68, 67, 66, 65] |
| S8 | jinniuhu | taishanxincun | [88, 87, 86, 85, 84, 83, 82, 81, 80, 79, 78, 77, 76, 75, 74, 73, 72] |
| Date | Week | Whole Number | Number After Filtering | Inbound Before Yesterday | Inbound After Today | Negative Use Time | More than 300 min | 0-1min | Inbound and Outbound on Same Stations |
|---|---|---|---|---|---|---|---|---|---|
| 2.13 | Monday | 1,228,131 | 1,218,423 | 93 | 29 | 15 | 1240 | 1886 | 6445 |
| 2.14 | Tuesday | 1,305,521 | 1,294,948 | 176 | 44 | 10 | 1315 | 2012 | 7016 |
| 2.15 | Wednesday | 1,240,308 | 1,229,704 | 248 | 25 | 12 | 1295 | 2137 | 6887 |
| 2.16 | Thursday | 1,201,713 | 1,192,083 | 68 | 28 | 11 | 1311 | 1999 | 6213 |
| 2.17 | Friday | 1,324,342 | 1,313,340 | 72 | 28 | 6 | 1313 | 2119 | 7464 |
| Date | Whole Number | Average Time (min) | Number of Early Peak | Average Time of Early Peak (min) | Number of Evening Peak | Average Time of Evening Peak (min) |
|---|---|---|---|---|---|---|
| 2.13 | 1,218,423 | 28.41 | 275,284 | 26.62 | 292,466 | 26.51 |
| 2.14 | 1,294,948 | 28.13 | 270,291 | 26.26 | 322,736 | 26.37 |
| 2.15 | 1,229,704 | 28.61 | 271,899 | 26.93 | 293,062 | 26.60 |
| 2.16 | 1,192,083 | 28.31 | 265,427 | 26.28 | 286,648 | 26.59 |
| 2.17 | 1,313,340 | 29.00 | 268,915 | 26.58 | 320,664 | 27.42 |
| Date | Whole Number | Average Travel Time (min) | Travel Time Variance | Average Waiting Time (min) | Waiting Time Variance | Network Flow Efficiency |
|---|---|---|---|---|---|---|
| 2.13 | 1,218,423 | 28.41 | 285.41 | 8.89 | 59.26 | 0.6871 |
| 2.14 | 1,294,948 | 28.13 | 283.47 | 9.01 | 62.03 | 0.6797 |
| 2.15 | 1,229,704 | 28.61 | 290.60 | 9.12 | 64.15 | 0.6812 |
| 2.16 | 1,192,083 | 28.31 | 280.05 | 8.88 | 56.82 | 0.6863 |
| 2.17 | 1,313,340 | 29.00 | 305.17 | 9.30 | 63.60 | 0.6793 |
| Travel Time | Travel Time Variance | |||||
|---|---|---|---|---|---|---|
| Date | Ride Time | Number of Rides | Passenger Flow | Ride Time | Number of Rides | Passenger Flow |
| 2.13 | 0.9654 | 0.6374 | −0.3147 | −0.0196 | −0.0034 | −0.0234 |
| 2.14 | 0.9657 | 0.6438 | −0.3066 | −0.0196 | 0.0146 | −0.0217 |
| 2.15 | 0.9637 | 0.6437 | −0.3220 | −0.0182 | 0.0039 | −0.0303 |
| 2.16 | 0.9633 | 0.6345 | −0.3162 | −0.0073 | 0.0128 | −0.0278 |
| 2.17 | 0.9665 | 0.6431 | −0.3163 | −0.0131 | −0.0049 | −0.0290 |
| Waiting Time | Waiting Time Variance | |||
|---|---|---|---|---|
| Date | Number of Rides | Passenger Flow | Number of Rides | Passenger Flow |
| 2.13 | 0.6386 | −0.2630 | −0.0034 | −0.0234 |
| 2.14 | 0.6573 | −0.2566 | 0.0146 | −0.0217 |
| 2.15 | 0.6523 | −0.2781 | 0.0039 | −0.0303 |
| 2.16 | 0.6249 | −0.2604 | 0.0128 | −0.0278 |
| 2.17 | 0.6517 | −0.2690 | −0.0049 | −0.0290 |
| Flow Efficiency | |||
|---|---|---|---|
| Date | Ride Time | Number of Rides | Passenger Flow |
| 2.13 | 0.6481 | 0.0752 | −0.1007 |
| 2.14 | 0.6460 | 0.0714 | −0.1096 |
| 2.15 | 0.6442 | 0.0695 | −0.0873 |
| 2.16 | 0.6484 | 0.0716 | −0.1013 |
| 2.17 | 0.6472 | 0.0774 | −0.1115 |
© 2020 by the authors. Licensee MDPI, Basel, Switzerland. This article is an open access article distributed under the terms and conditions of the Creative Commons Attribution (CC BY) license (http://creativecommons.org/licenses/by/4.0/).
Share and Cite
Yu, W.; Ye, X.; Chen, J.; Yan, X.; Wang, T. Evaluation Indexes and Correlation Analysis of Origination–Destination Travel Time of Nanjing Metro Based on Complex Network Method. Sustainability 2020, 12, 1113. https://doi.org/10.3390/su12031113
Yu W, Ye X, Chen J, Yan X, Wang T. Evaluation Indexes and Correlation Analysis of Origination–Destination Travel Time of Nanjing Metro Based on Complex Network Method. Sustainability. 2020; 12(3):1113. https://doi.org/10.3390/su12031113
Chicago/Turabian StyleYu, Wei, Xiaofei Ye, Jun Chen, Xingchen Yan, and Tao Wang. 2020. "Evaluation Indexes and Correlation Analysis of Origination–Destination Travel Time of Nanjing Metro Based on Complex Network Method" Sustainability 12, no. 3: 1113. https://doi.org/10.3390/su12031113
APA StyleYu, W., Ye, X., Chen, J., Yan, X., & Wang, T. (2020). Evaluation Indexes and Correlation Analysis of Origination–Destination Travel Time of Nanjing Metro Based on Complex Network Method. Sustainability, 12(3), 1113. https://doi.org/10.3390/su12031113


