Article

Extreme Temperature Events during 1960–2017 in the Arid Region of Northwest China: Spatiotemporal Dynamics and Associated Large-Scale Atmospheric Circulation

1
State Key Laboratory of Desert and Oasis Ecology, Xinjiang Institute of Ecology and Geography, Chinese Academy of Sciences, Urumqi 830011, China
2
University of Chinese Academy of Sciences, Beijing 100049, China
3
School of Urban and Environment Science, Huaiyin Normal University, Huai’an 223300, China
4
College of Resource and Environment Sciences, Xinjiang University, Urumqi 830046, China
*
Authors to whom correspondence should be addressed.
Sustainability 2020, 12(3), 1198; https://doi.org/10.3390/su12031198
Submission received: 11 December 2019 / Revised: 29 January 2020 / Accepted: 2 February 2020 / Published: 7 February 2020

Abstract

:
Studying the dynamic changes of extreme temperatures and associated large-scale atmospheric circulation is important for predicting the occurrence of extreme temperatures and reducing their adverse impact and damage. Based on the surface temperature data sets collected from 87 weather stations over the arid region of Northwest China (ARNC) during 1960–2017, the Sen’s slope estimator, Mann–Kendall test, Cumulative anomaly, Moving t-test, and Synthetic analysis methods were used to analyze the spatiotemporal dynamics and breaking-point change characteristics of extreme temperatures, and to discuss its associated large-scale atmospheric circulation. The results revealed that at the temporal scale, summer days (SU25), warm days (TX90p), warm nights (TN90p), and warm spell duration indicator (WSDI) showed a remarkable increasing trend at the rates of 2.27, 1.49, 3, and 2.28 days/decade, respectively. The frost days (FD), cold days (TX10p), cold nights (TN10p), and cold spell duration indicator (CSDI) significantly decreased at the rates of −3.71, −0.86, −1.77, and −0.76 days/decade, respectively, during the study period. Spatially, the warming trend in the study area is very obvious as a whole, despite pronounced spatial differences in warming rate. After the breakpoint years, the frequency and probability distribution for extreme warm and cold indices were all inclined to the hotter part of the density distribution. This indicates that the climate over the study region shifted sharply and tended to be warmer. The analysis of large-scale atmospheric circulation indicates that the warming trend in the arid region of Northwest China (ARNC) is positively correlated with geopotential height at 500 hPa and negatively correlated with total cloudiness. The findings from this study have important implications for forecasting extreme temperature events and mitigating the impacts of climatological disasters in this region.

1. Introduction

In recent decades, the frequent occurrence of extreme weather events such as heatwaves, cold surges, droughts, floods, and snowstorms has caused considerable casualties and immeasurable economic losses, which have received great attention worldwide [1,2,3,4]. According to the estimation by the relevant departments of the United Nations, weather-related disasters account for 90% of the major disasters worldwide, and the number of people affected by extreme climate disasters in the world is 4.1 billion. This figure is seven times as many as those affected by wars and conflicts, resulting in property losses of about $100 billion every year globally, only in the 21 years from 1995 to 2015 [5]. Since entering the 21st century, a series of extreme temperature events that have occurred worldwide have caused a large number of casualties. For example, the heat wave in Europe in 2003 caused more than 70,000 deaths [6,7]. In the summer of 2010, a heat wave in Russia resulted in nearly 56,000 deaths [8]. A record-breaking cold temperature event led to 790 additional deaths in 2006 in Europe [8]. Meanwhile, extreme temperatures and their changes have been confirmed to affect the rice yield in southern China [9], land use management and planning [10], soil and vegetation processes [11,12,13], regional hydrologic cycle and drought [14,15], sustainable development of the city [16], extreme air pollution events in the United States [17], environmental degradation [18,19], and human health [20,21]. Changes in extreme temperature affect the water cycle and hydrological process by changing the interaction and evaporation between the land and atmosphere, which in turn influences the spatial distribution of water resources. This means that better understanding the extreme temperature events is not only an important scientific issue in the field of climate change research, but also an urgent requirement for the sustainable development of the natural ecosystem, society, and economy [22,23].
Extreme temperature is one of the most important indicators for the study of climate change. It has been researched on national, regional, and global scales in recent years, including in Russia [24], Canada [25], the Middle East [26], Europe [27], southern and western Africa [28], India [29,30], as well as on a global scale [31,32,33,34]. These studies concluded that the extreme temperatures showed a pronounced increasing tendency in intensity and frequency in the past few decades [35,36]. This warming trend was closely correlated with global warming, especially for extreme cold indices related to daily minimum temperature [37,38,39]. Like other regions of the world, China has experienced significant temperature changes in recent decades. Liu et al. [40] suggested that the daily maximum and minimum temperatures in China have increased at rates of 0.13 and 0.32 °C/decade during 1955–2000, respectively, and the increasing is most pronounced in northeast China and least in the southwest. You et al. [41] analyzed the characteristics of extreme temperature indices at 303 meteorological stations in China from 1961–2013 and found that the cold/warm nights are larger than cold/warm days in trend magnitudes. The trends in extreme indices derived from daily minimum temperature are more rapid than those derived from daily maximum temperature. Shi et al. [42] found significant spatial differences in decreasing magnitudes of cold extremes and increasing magnitudes of warm extremes throughout China from 1961–2015. All cold extremes were correlated with Atlantic multidecadal oscillation (AMO) and Arctic oscillation (AO), and all warm extremes had a teleconnection with AMO and dipole mode index (DMI). Besides, many researchers have studied extreme climate changes in Inner Mongolia [43], Songhua River Basin [36], Loess Plateau [44,45], northeastern China [46], Hengduan Mountains [47], and Poyang Lake Basin [38]. These research results generally indicated that the extreme warm indices related to high temperatures, including summer days (SU25), warm days (TX90p), and warm nights (TN90p) increased, while extreme cold indices related to low temperatures such as frost days (FD), cold days (TX10p), and cold nights (TN10p) decreased. In addition, the decrease of extreme low temperature in frequency and intensity and the significant increase in daily lowest temperature were closely associated with regional and global warming, and the increase in night temperature was more obvious than that of daytime.
The arid region of Northwest China is located in the center of the Eurasia continent, and is also the transition zone between westerly circulation and monsoon [48,49]. It is one of the most sensitive areas to climate change in the world due to vast desert basin, high mountains, and being far away from the ocean [49]. The climate is extremely dry and the ecological environment is very fragile. The main land use/cover types are desert, wilderness, and grassland [50]. Although the land area in the study region is large, the land area worthy for humans to transform and utilize is very small. The effect of land-use changes across the whole region on extreme temperatures is negligible. So, scholars are concerned more about the climate change itself in the arid region of Northwest China (ARNC). In recent years, global warming has exacerbated the deterioration of the ecological environment, and the extreme weather events have occurred frequently [51,52]. Zhang et al. [53] studied the precipitation extremes in Xinjiang from 1957–2009 and found the precipitation extremes exhibiting a wetting tendency after 1980, and this tendency is more obvious in the north than in the south. Wang et al. [54] analyzed the climate extremes at 59 meteorological stations in the arid region of Northwest China over the period 1960–2003. They found that there are significant negative correlations between warm extreme trends and mean temperature. All temperature extremes show a warming trend and most precipitation indices present increasing trends across the region. At present, previous researches on climate change in the ARNC mostly focus on the variations in frequency, intensity and magnitude of extreme precipitations, and preliminary analysis in spatiotemporal characteristics of annual mean temperature and extreme temperature indices [48,55,56]. Few researches were conducted to explore the dynamic variations of extreme temperature events and to discuss its associated large-scale atmospheric circulation with long-term periods, so further discussion was needed.
The objectives of this study were to (1) present the spatiotemporal dynamics of extreme temperatures over the ARNC in the past 58 years; (2) detect and verify the breakpoint year, ensuring its high reliability by various methods; (3) analyze the extreme temperature changes and associated large-scale atmospheric circulation.

2. Data and Methodology

2.1. Study Area

The arid region of Northwest China (ARNC) is located in the central hinterland of the Eurasian continent and covers an area of approximately 2.53 million km2 (34.4~49.2° N and 73.5~107.2° E; Figure 1). Its total area occupies 26.4% of China. It mainly includes Xinjiang Uygur Autonomous Region, the southwestern part of the Alashan Plateau, and the northern part of the Qilian Mountains. Bounded by the Tianshan Mountains, the southern region is called southern Xinjiang, and the northern region is called northern Xinjiang. The Hexi-Alashan region includes the Hexi Corridor, the southwest of Alashan Plateau, and the north of Qilian Mountains. The main deserts from the west to the east are the Taklimakan Desert, Gurbantunggut Desert, Kumtag Desert, and Badain Jaran Desert, with a total area about 330,000, 48,800, 22,000, and 49,200 km2, respectively. The climates in widespread desert regions are characterized as arid.
The research area is far away from the oceans, with complex terrain. It is difficult for moist airflow to penetrate into this region and the prevailing inland climate is dominated by drought. The winter in the study area is mainly controlled by the cold high pressure of Mongolia–Siberia, resulting in low temperatures in winter. In summer, the surface of the earth heats up rapidly after strongly absorbing solar radiation, resulting in high temperatures. The spring and autumn seasons are often affected by cold air, causing the heat and cold conditions to change. In addition, the temperature in this region is significantly affected by the rugged topography, and the climate in the ARNC is very complex.

2.2. Data

The temperature data from 87 meteorological stations (Appendix A; Figure 1) in the ARNC from 1960–2017 were obtained from the National Meteorological Information Center of the China Meteorological Administration (http://cdc.cma.gov.cn). The temperature time series for which the data gap was more than 15 days of every year or with incomplete data were excluded. When the data gap was less than 15 days of every year, interpolation was performed by average temperature from two or more nearby meteorological stations [57]. Then, we used the RclimDex software package to control the quality of data, including: (1) checking errors in the temperature data, such as Tmax < Tmin; (2) finding out the outlier value that the temperature data exceeds 3 times the standard deviation of the recorded value, that is, the value deviates seriously from the actual meteorological condition of the site. The reasonable data were retained by manual visual inspection and compared with the records of adjacent stations. The unreasonable data were processed according to the missing values. Finally, 87 meteorological stations over the ARNC from 1960–2017 were selected and all stations passed the homogeneity check. The homogeneity test recommended by the World Meteorological Organization (WMO) was used to examine the data quality control and check unavoidable errors in data acquisition and processing due to observation methods, measuring instruments, external environment, and other factors [44,58]. This test has been widely used in the fields of meteorology and hydrology. The NCEP–NCAR reanalysis data (http://www.cdc.noaa.gorv/), including monthly mean geopotential height at 500 hPa and total cloudiness data with a spatial resolution of 2.5 × 2.5° during 1960–2017, were selected to analyze the changes in atmospheric circulation.

2.3. Methods

Extreme temperature indices recommended by the Expert Team on Climate Change Detection and Indices (ETCCDI) have been widely used to study the extreme climate changes worldwide [59,60,61]. In this study, eight temperature extreme indices were selected to study the extreme temperature changes in the ARNC (Table 1). These indices can better reflect the different characteristics of cold and warm extremes and can be also divided into three categories: (1) absolute-based indices, including summer days and frost days, are the number of days with a temperature value above or below a fixed threshold; (2) percentile-based indices, including cold days, cold nights, warm days, and warm nights, are defined as the number of days on which the daily minimum or maximum temperature value exceeds the 10% and 90% percentile thresholds of the whole time series; (3) consecutive day temperature indices represent the duration of excessive cold or warm. The period for the percentiles was 1960–2017 and all of the indices were calculated at each station on an annual basis. We used the RClimDex 1.1 software to calculate extreme temperatures, and the software is available at http://etccdi.pacifcclimate.org/software.shtml. Detailed methods for calculating these indices can be obtained at the website http://etccdi.pacificclimate.org/list_27_indices.shtml, as well as in previous research [43,58].
The non-parametric Mann–Kendall (M–K) trend test and Sen’s slope estimator test were employed to quantify and detect the trend in annual series of extreme temperature indices [62,63,64]. We used the Z value from the result of Mann–Kendall trend test to analyze the trend variation. The annual series show an upward trend when Z > 0, while indicating a downward trend when Z < 0. The absolute value of Z determines whether the trend of the annual series is significant. The trend is significant at 0.05 significance level when |Z| > 1.96, while the trend is significant at 0.01 significance level when |Z| > 2.58. Breaking-point change in climate is one of the most important phenomena prevailing in the climate system. It refers to the climate change from warm (arid) state to cold (wet) state, or vice versa [65]. It can also be expressed as a climate change from one statistical characteristic jumping into another statistical characteristic. In this paper, the Mann–Kendall test, Cumulative sum chart anomaly test, and Moving t-test were adopted to detect the breakpoint year of extreme temperature events in the ARNC to ensure its credibility.

3. Results

3.1. Temporal Trends of Extreme Temperature Indices

3.1.1. Extreme Warm Indices: SU25, TX90p, TN90p, and Warm Spell Duration Indicator (WSDI)

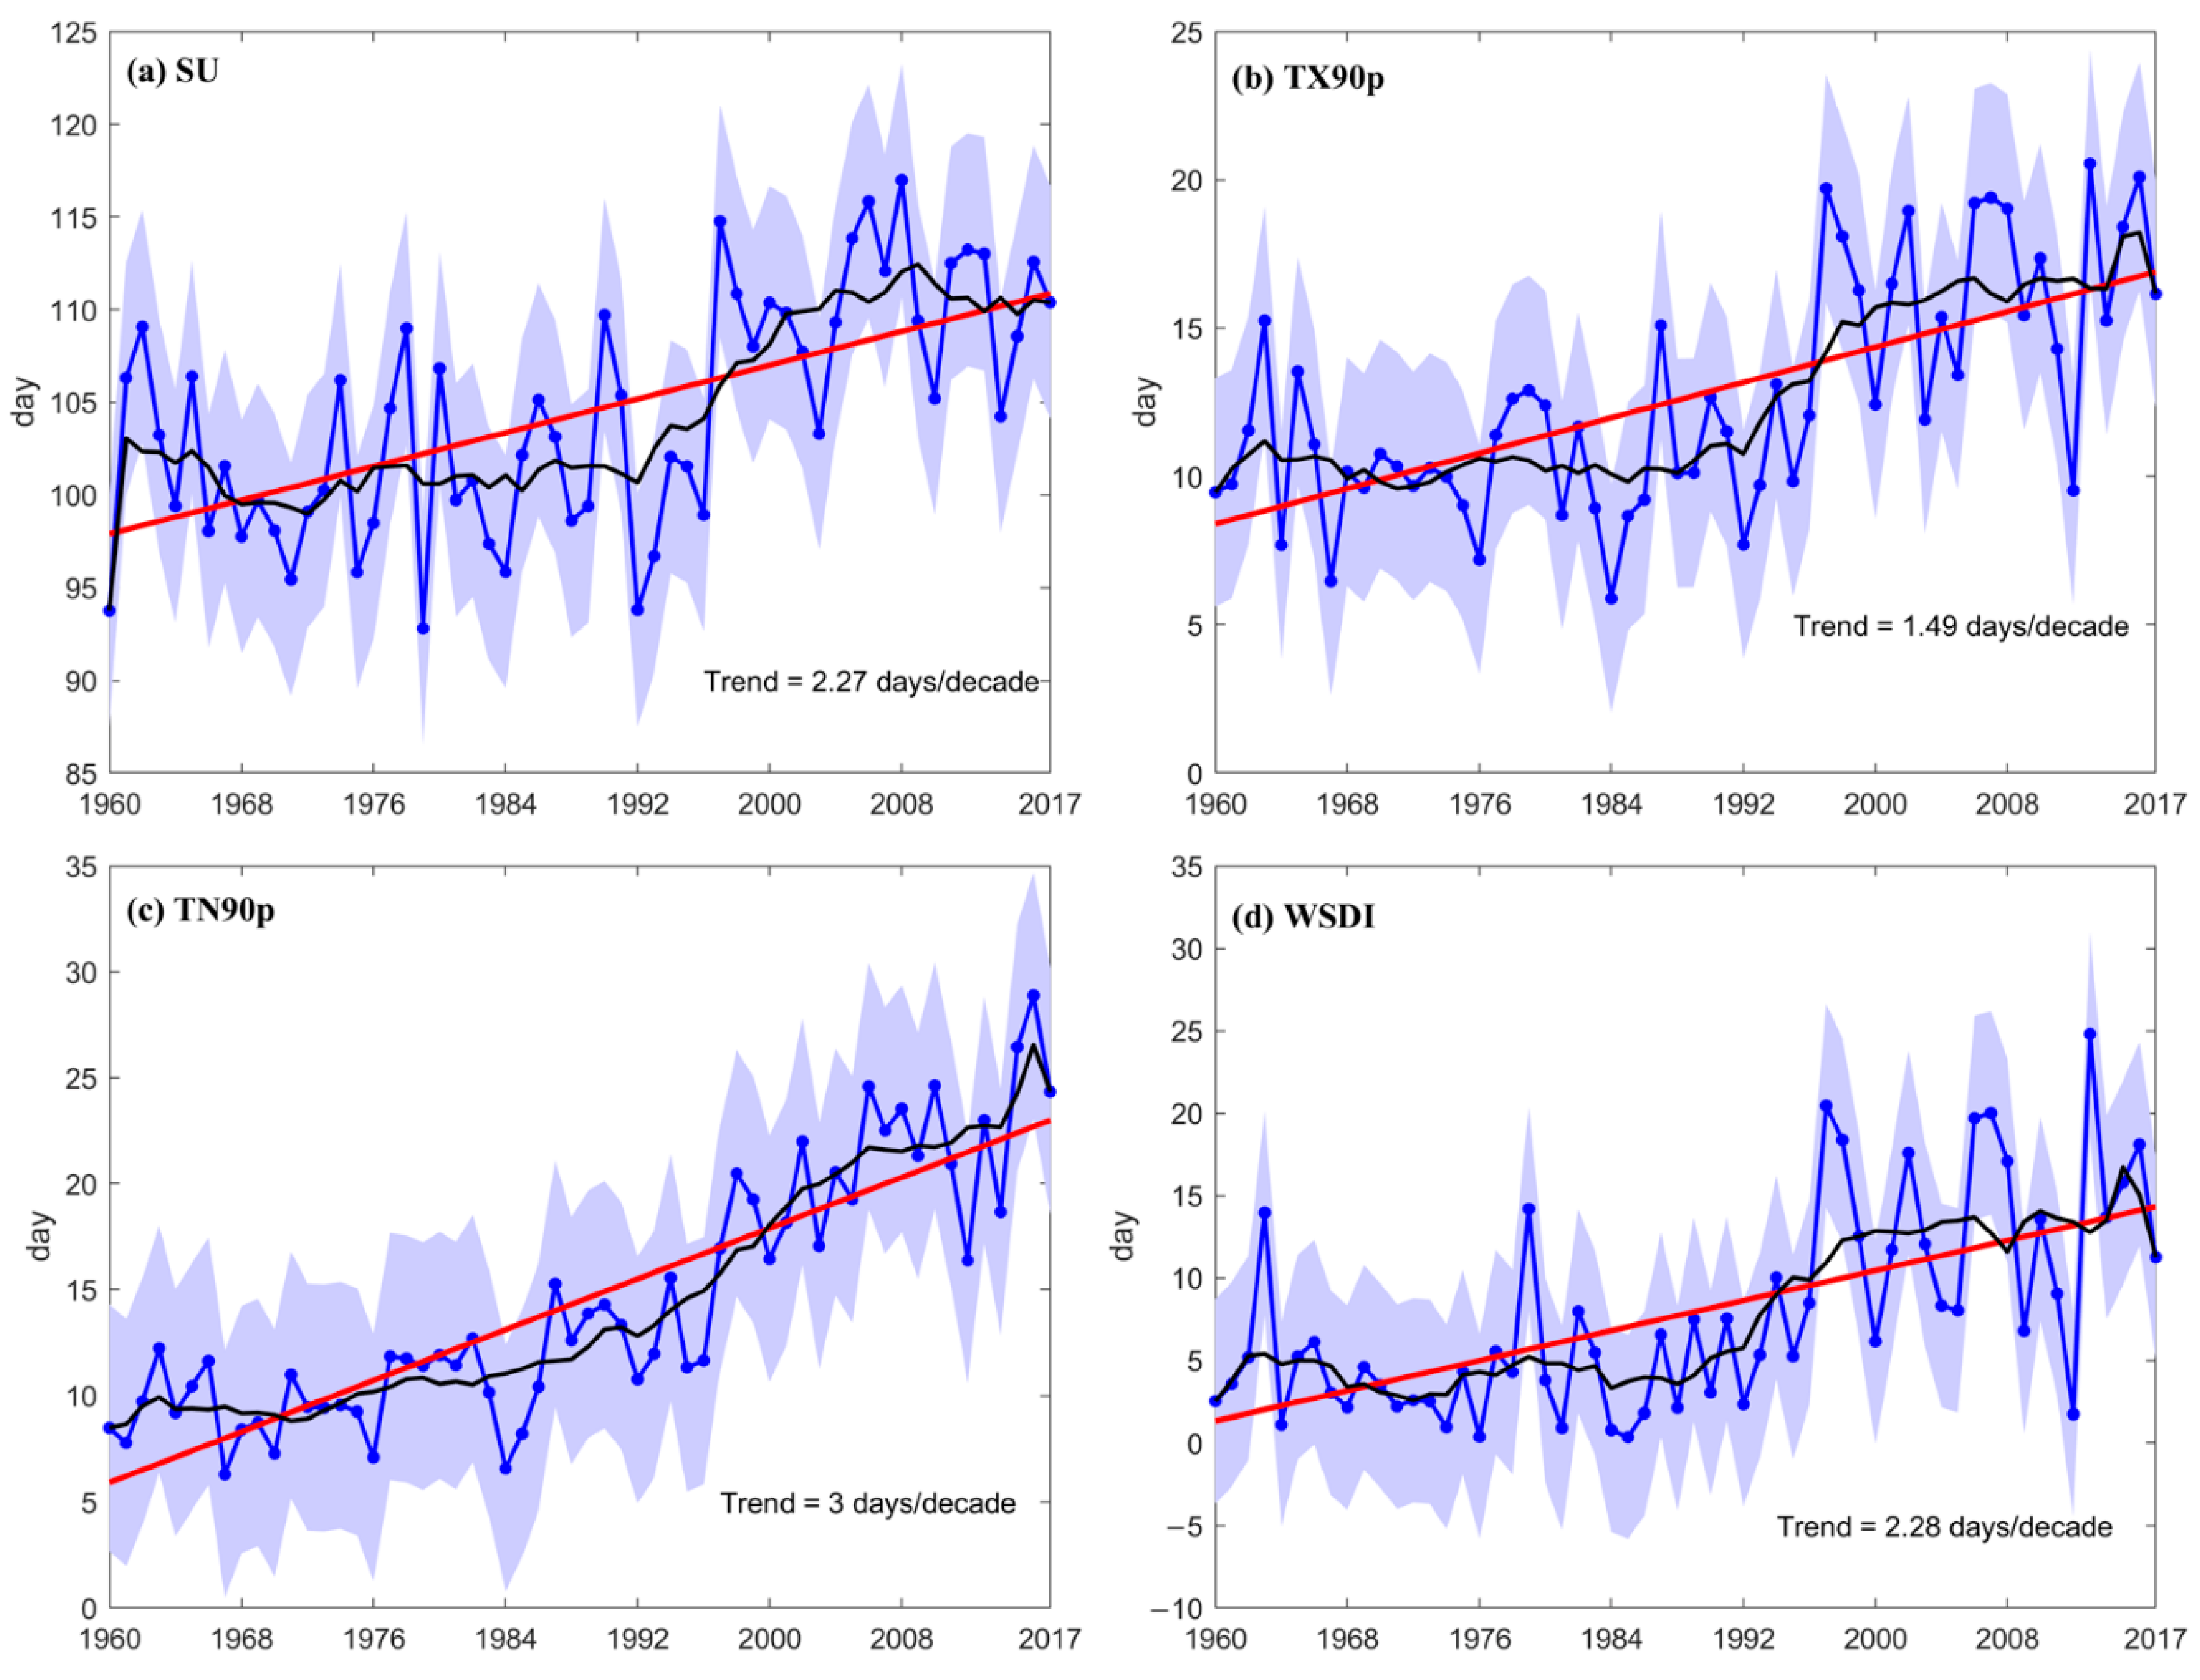
The trends of extreme warm indices for SU25, TX90p, TN90p, and WSDI exhibited significant increasing trends (p < 0.01) from 1960 to 2017 at the rates of 2.27, 1.49, 3, and 2.28 days/decade, respectively (Figure 2). From the curve of 9-year smoothing averages reflecting the interdecadal variation, extreme warm indices for SU25, TX90p, TN90p, and WSDI did not significantly change during the 1960s–1990s, and from then increased rapidly, and the average after the 1990s was significantly larger than that of the 1960s–1990s. For SU25 (Figure 2a), the maximum annual average was 110.5 days during 2001–2017 and the minimum decadal average was 100.9 days during 1970–1980. TX90p (Figure 2b) increased quickly after 1990, with a maximum annual average of 16.53 days during 2001–2017 and a lower decadal average of 10.1 days during 1980–1990. The largest value of TX90p was 32.33 days at Yinchuan meteorological station (1110.9 m above sea level) of Ningxia province in 2013. For TN90p (Figure 2c), there was a slow increasing trend generally from 1960 to 2000 and a sharply increasing trend after 2000, with a maximum annual average of 21.9 days during 2001–2017 and a lower decadal average of 9.1 days in the 1960s. The largest value of TN90p was 66.9 days at Turpan meteorological station (34.5 m.a.s.l) of Xinjiang province in 2017. WSDI (Figure 2d) had no obvious change during 1960–1995, and then increased rapidly, with a maximum annual average of 13.5 days during 2001–2017 and a minimum decadal average of 3.6 days found in the 1980s. The largest value of WSDI was 76 days at Maigaiti meteorological station (1178.2 m.a.s.l) of Xinjiang province in 2007.

3.1.2. Extreme Cold Indices: FD, TX10p, TN10p, and Cold Spell Duration Indicator (CSDI)

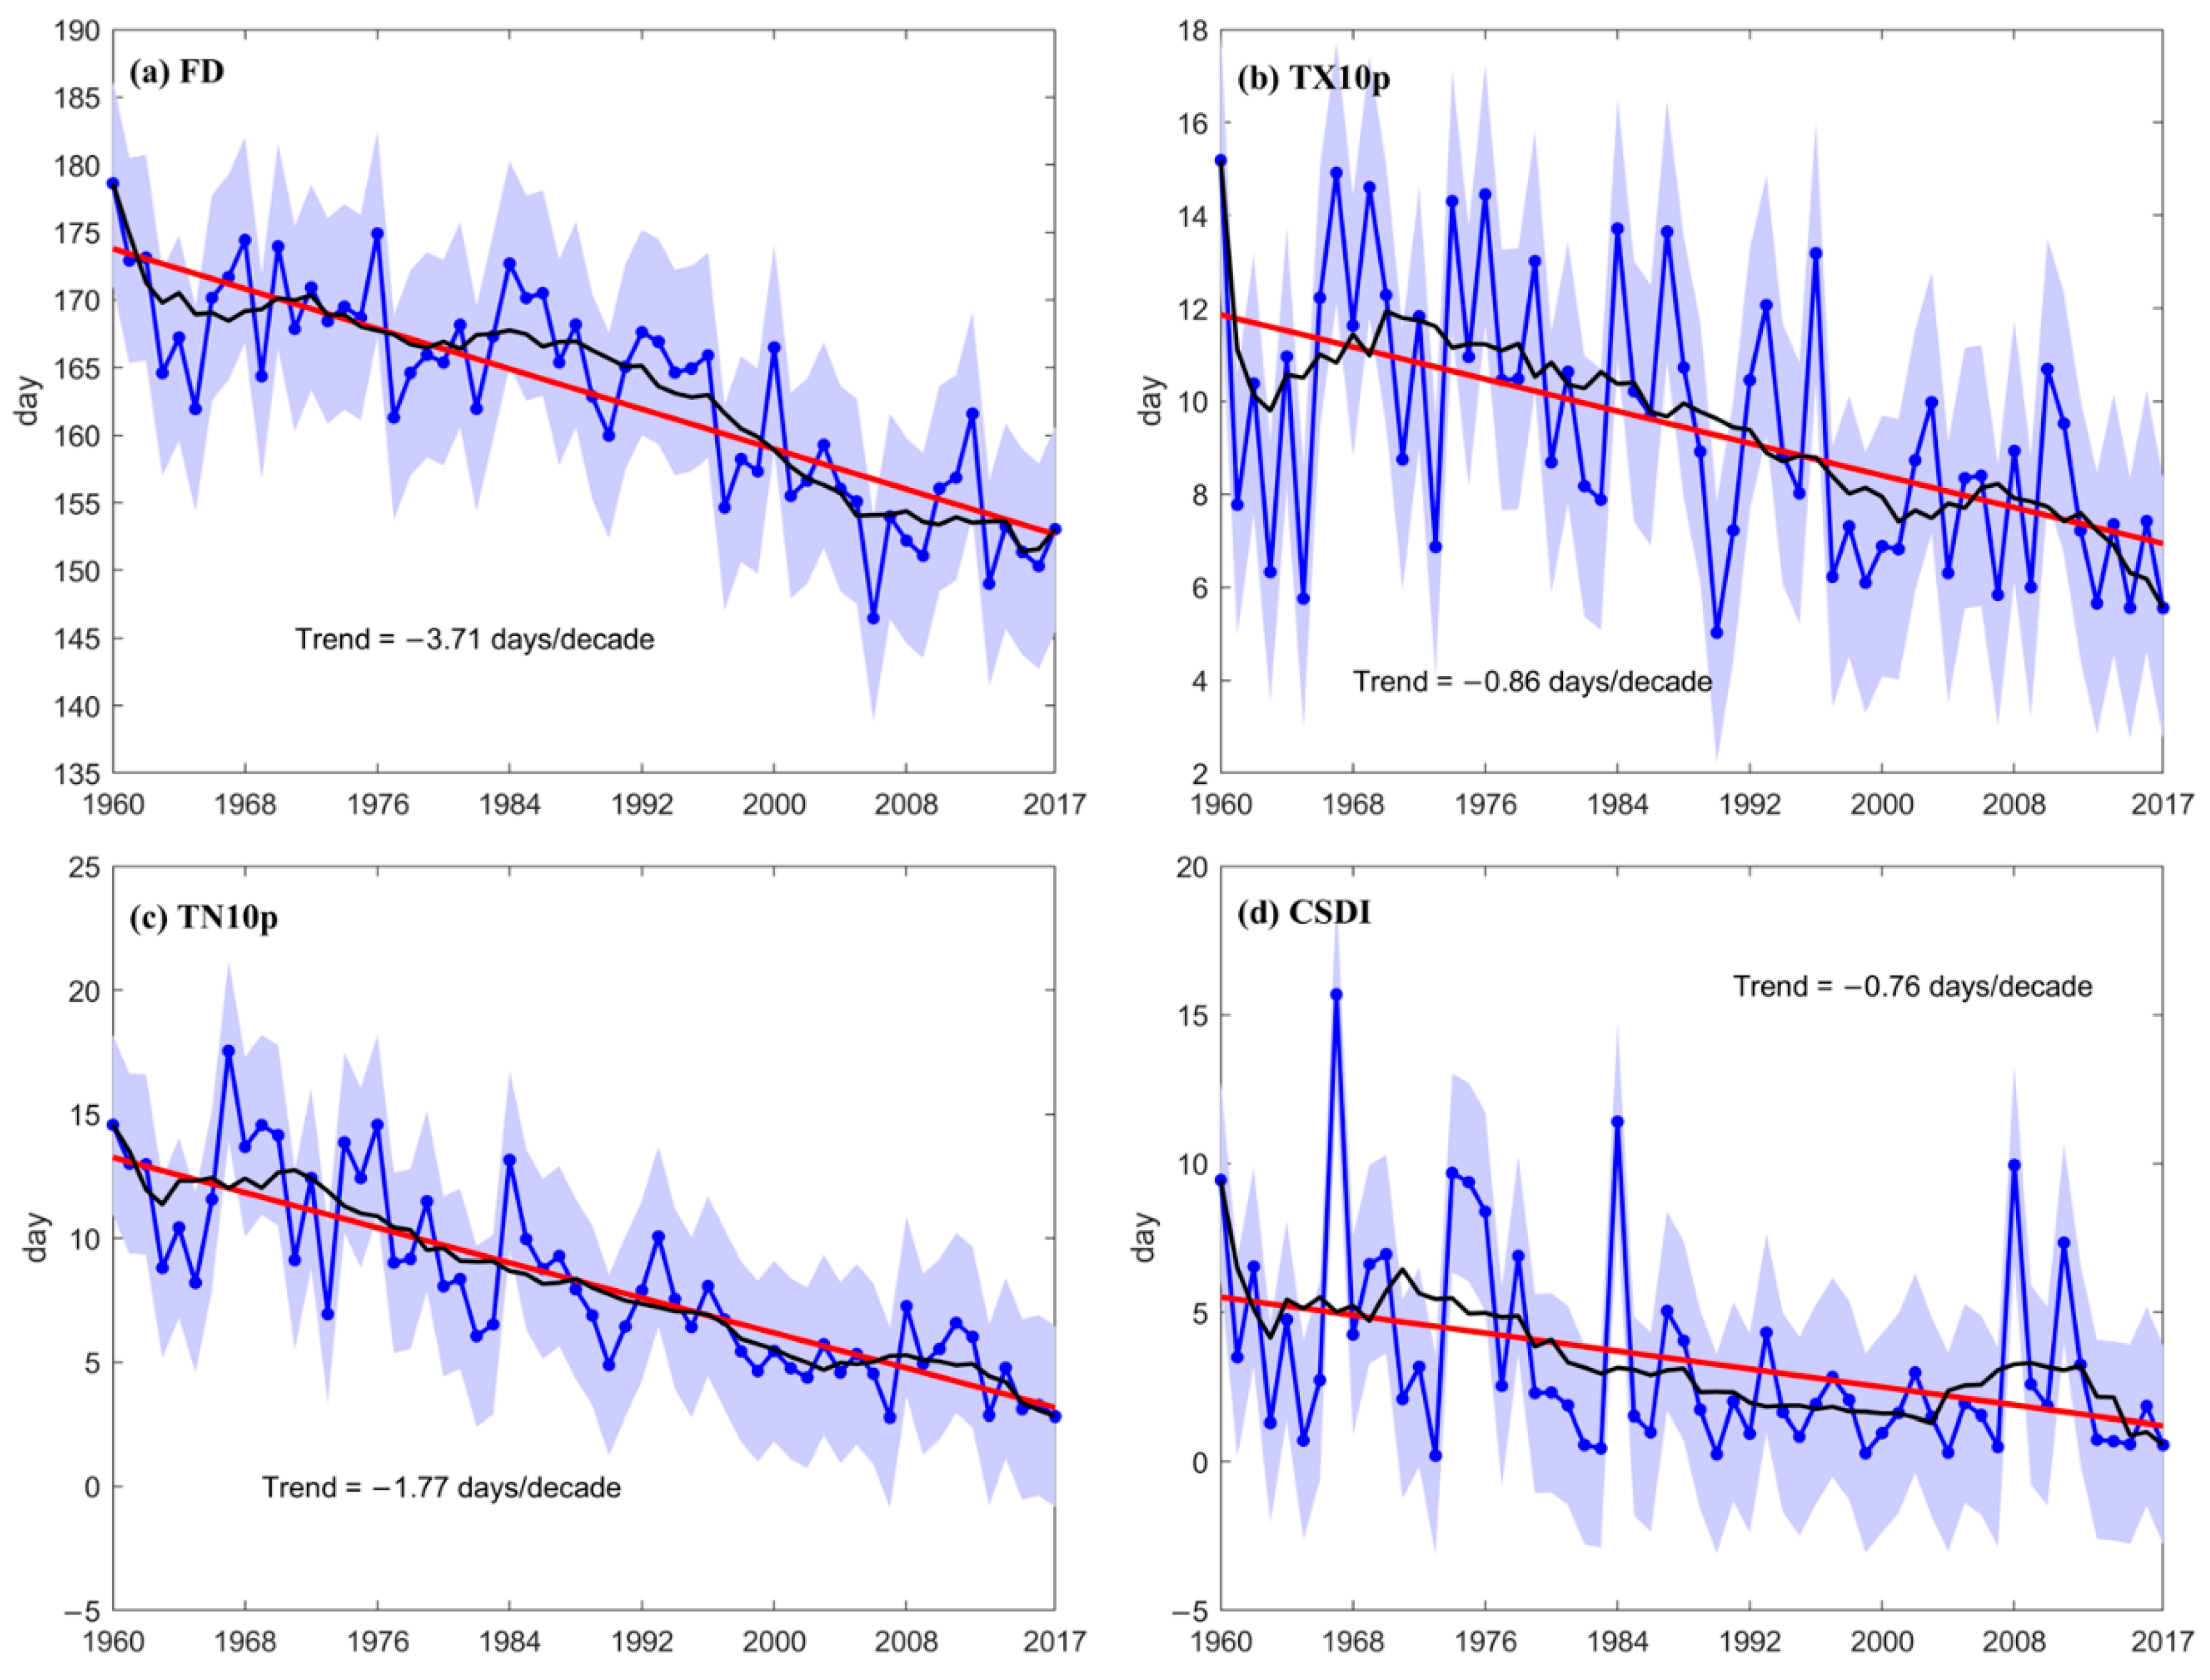
The trends of extreme cold indices for FD, TX10p, TN10p, and CSDI exhibited significant decreasing trends (p < 0.01) from 1960 to 2017 at the rates of −3.71, −0.86, −1.77, and −0.76 days/decade, respectively. In the curve of 9-year smoothing averages, extreme cold indices for FD, TX10p, TN10p, and CSDI had a decreased trend in fluctuation after the 1970s. FD (Figure 3a) showed a decreasing trend since 1960 and then decreased rapidly after 1996, with a maximum decadal average of 170.3 days in the 1960s and a minimum annual average of 154 days during 2001–2017. The largest value of FD was 323 days and occurred at Tuergate station (3504 m.a.s.l) of Xinjiang in 1965. TX10p (Figure 3b) increased in fluctuation firstly during 1961–1970, and then continued to decline significantly, with a maximum decadal average of 11.1 days in the 1960s and a lower annual average of 7.5 days during 2001–2017. The maximum value of TX10p was 40.3 days at Fuyun meteorological station (807.5 m.a.s.l) of Xinjiang in 1960. TN10p (Figure 3c) showed a decreasing trend generally from 1960 to 2017, and the decreasing trend was very clear after the 1970s, with a maximum decadal average of 12.7 days in the 1960s and a minimum annual average of 4.7 days during 2001–2017. The largest value of TN10p was 29.2 days, and occurred at Fuyun station (807.5 m.a.s.l) of Xinjiang province in 1961. CSDI (Figure 3d) had a fluctuating downward trend as a whole on the curve of 9-year smoothing averages between 1960 and 2017, with a maximum decadal average of 5.7 days in the 1960s and a minimum decadal average of 1.8 days in the 1990s. The largest value of CSDI was 59 days at Turpan meteorological station (34.5 m.a.s.l) of Xinjiang in 1960.

3.2. Spatial Trends of Extreme Temperature Indices

3.2.1. Temperature Indices Based on Absolute Threshold: FD, SU25

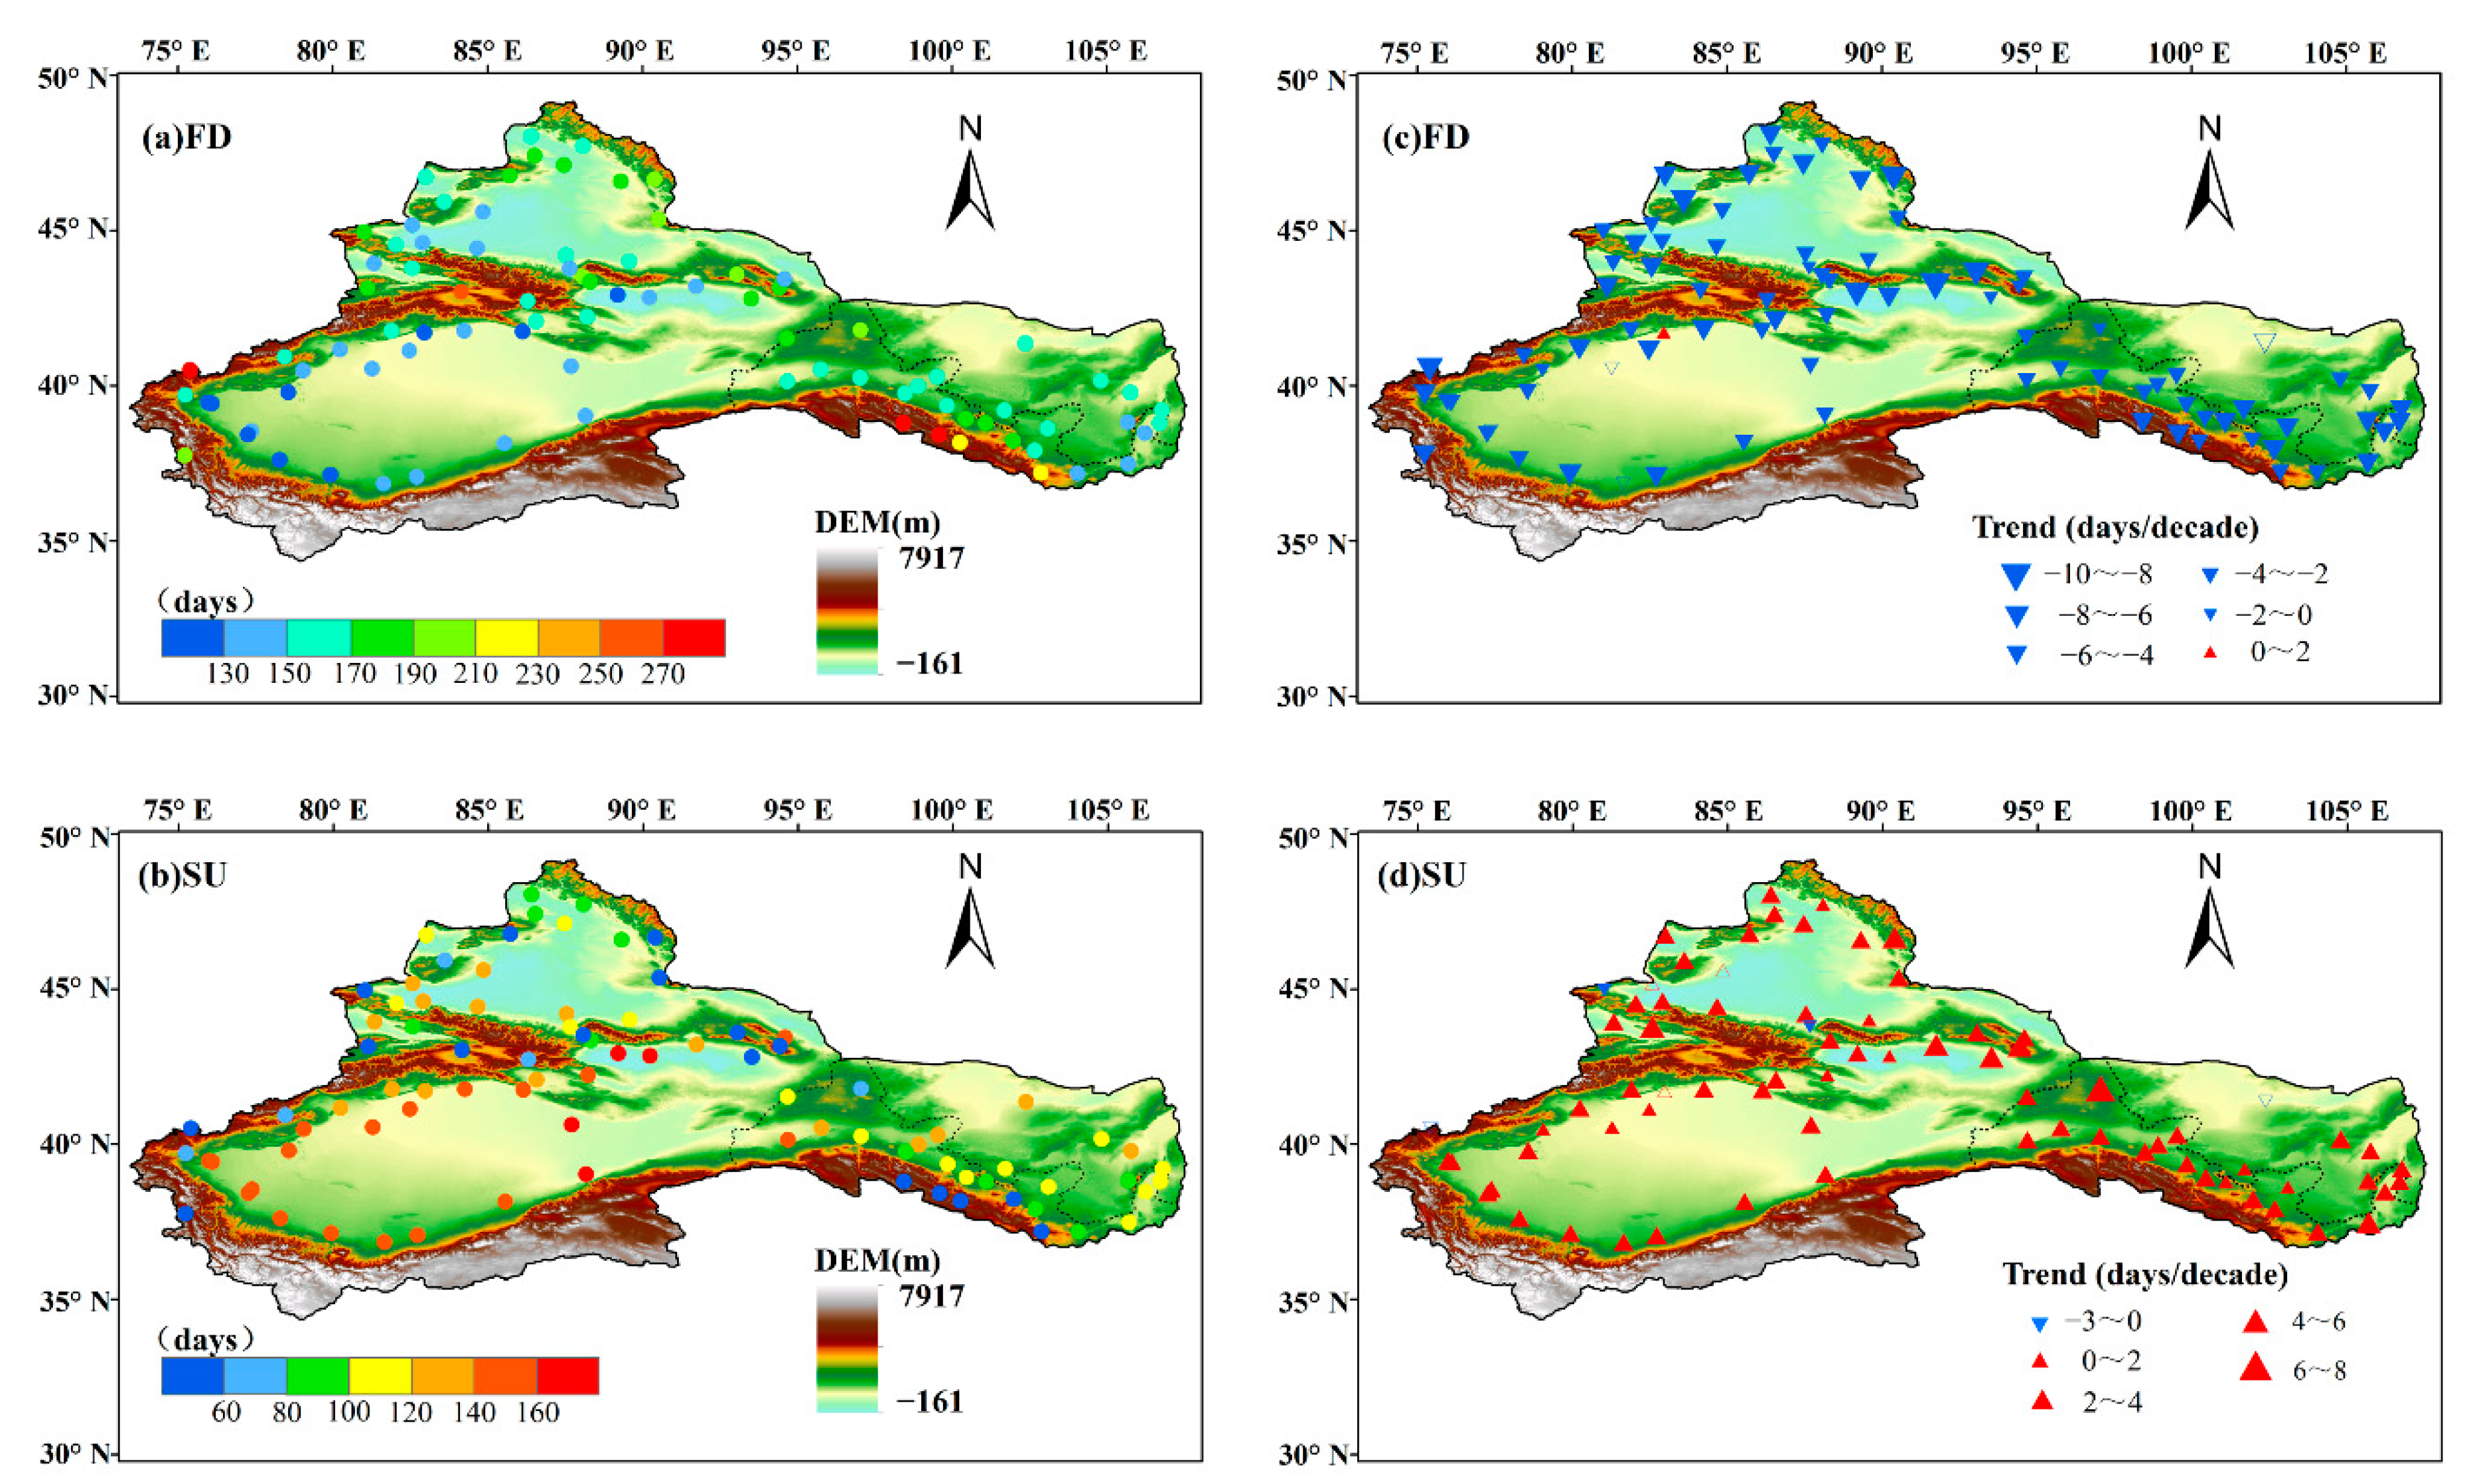
Figure 4 is the spatial distribution of the average and trend for FD and SU25; the FD in Southern Xinjiang, Northern Xinjiang, and Hexi-Alasha region were about 140, 160, and 170 days, respectively, and in some mountain areas with high elevation could reach 230–250 days. To some extent, the warming trend of the desert area in Southern Xinjiang was more obvious compared with other areas. The trend of FD in Southern Xinjiang, Northern Xinjiang, and Hexi-Alasha area were −3.48, −3.89, and −3.87 days/decade, respectively (Figure 4c). For FD, 98.9% (86 stations) of stations showed robust decreasing trends, and nearly 94.3% (82 stations) of them showed a significant decreasing trend (p < 0.05) over the study region from 1960 to 2017 (Table 2).
SU25 were as high as 140 days in Southern Xinjiang. The SU25 in Northern Xinjiang and Hexi-Alasha region were about 100 days. The SU25 in the northern mountains of Tianshan, Altai and Qilian Mountains were generally less than 60 days. The trend of SU25 was more obvious in Hexi-Alasha region (2.51 days/decade), followed by Southern Xinjiang (2.32 days/decade) and Northern Xinjiang (1.93 days/decade) (Figure 4d). In general, for SU25, nearly 95.4% (83 stations) of the total stations exhibited an increasing trend in study region (Table 2), and 79.3% (69 stations) of them showed a significant increasing trend (p < 0.05).
In summary, the spatial distribution of the mean for FD was roughly opposite to that of SU25. The high value area of the average for FD corresponded to the low value area of the average for SU25, and vice versa. In terms of climate trend, although there existed a significant spatial difference over the whole region, the magnitude of decreasing FD was much larger than that of SU25. It revealed that the warming trend was pronounced in the ARNC from 1960 to 2017.

3.2.2. Temperature Indices Based on Percentile Threshold: TX10p, TN10p, TX90p, and TN90p

In Figure 5a, the averages of TX10p were less than 9 days in very few areas, and most other regions were more than 9 days. The trend for TX10p was −0.86 days/decade over the whole region. The average trend in Southern Xinjiang, Northern Xinjiang, and Hexi-Alasha was −0.83, −0.86 and −0.92 days/decade, respectively. Moreover, the results of the M–K test showed that 98.9% (86 stations) of total stations for TX10p displayed decreasing trend, out of which 88.5% (77 stations) of stations exhibited significant decreasing trends (p < 0.05).
The mean TN10p in most areas was more than 6 days (Figure 5b). The average TN10p in the southwestern and Eastern parts of Southern Xinjiang were 6–8 days, approximately. The average number of cold nights in Northern Xinjiang, central and Eastern parts of Southern Xinjiang, and Western parts of Hexi-Alasha was about 8–10 days. The decreasing trend of TN10p was −1.77 days/decade as a whole. The trend in Southern Xinjiang, Northern Xinjiang, and Hexi-Alasha region was −1.73, −1.92, and −1.7 days/decade, respectively. According to the M–K test results, 97.7% (85 stations) of total stations for TN10p exhibited decreasing trend, of which 94.3% (82 stations) stations showed a significant decreasing trend (p < 0.05).
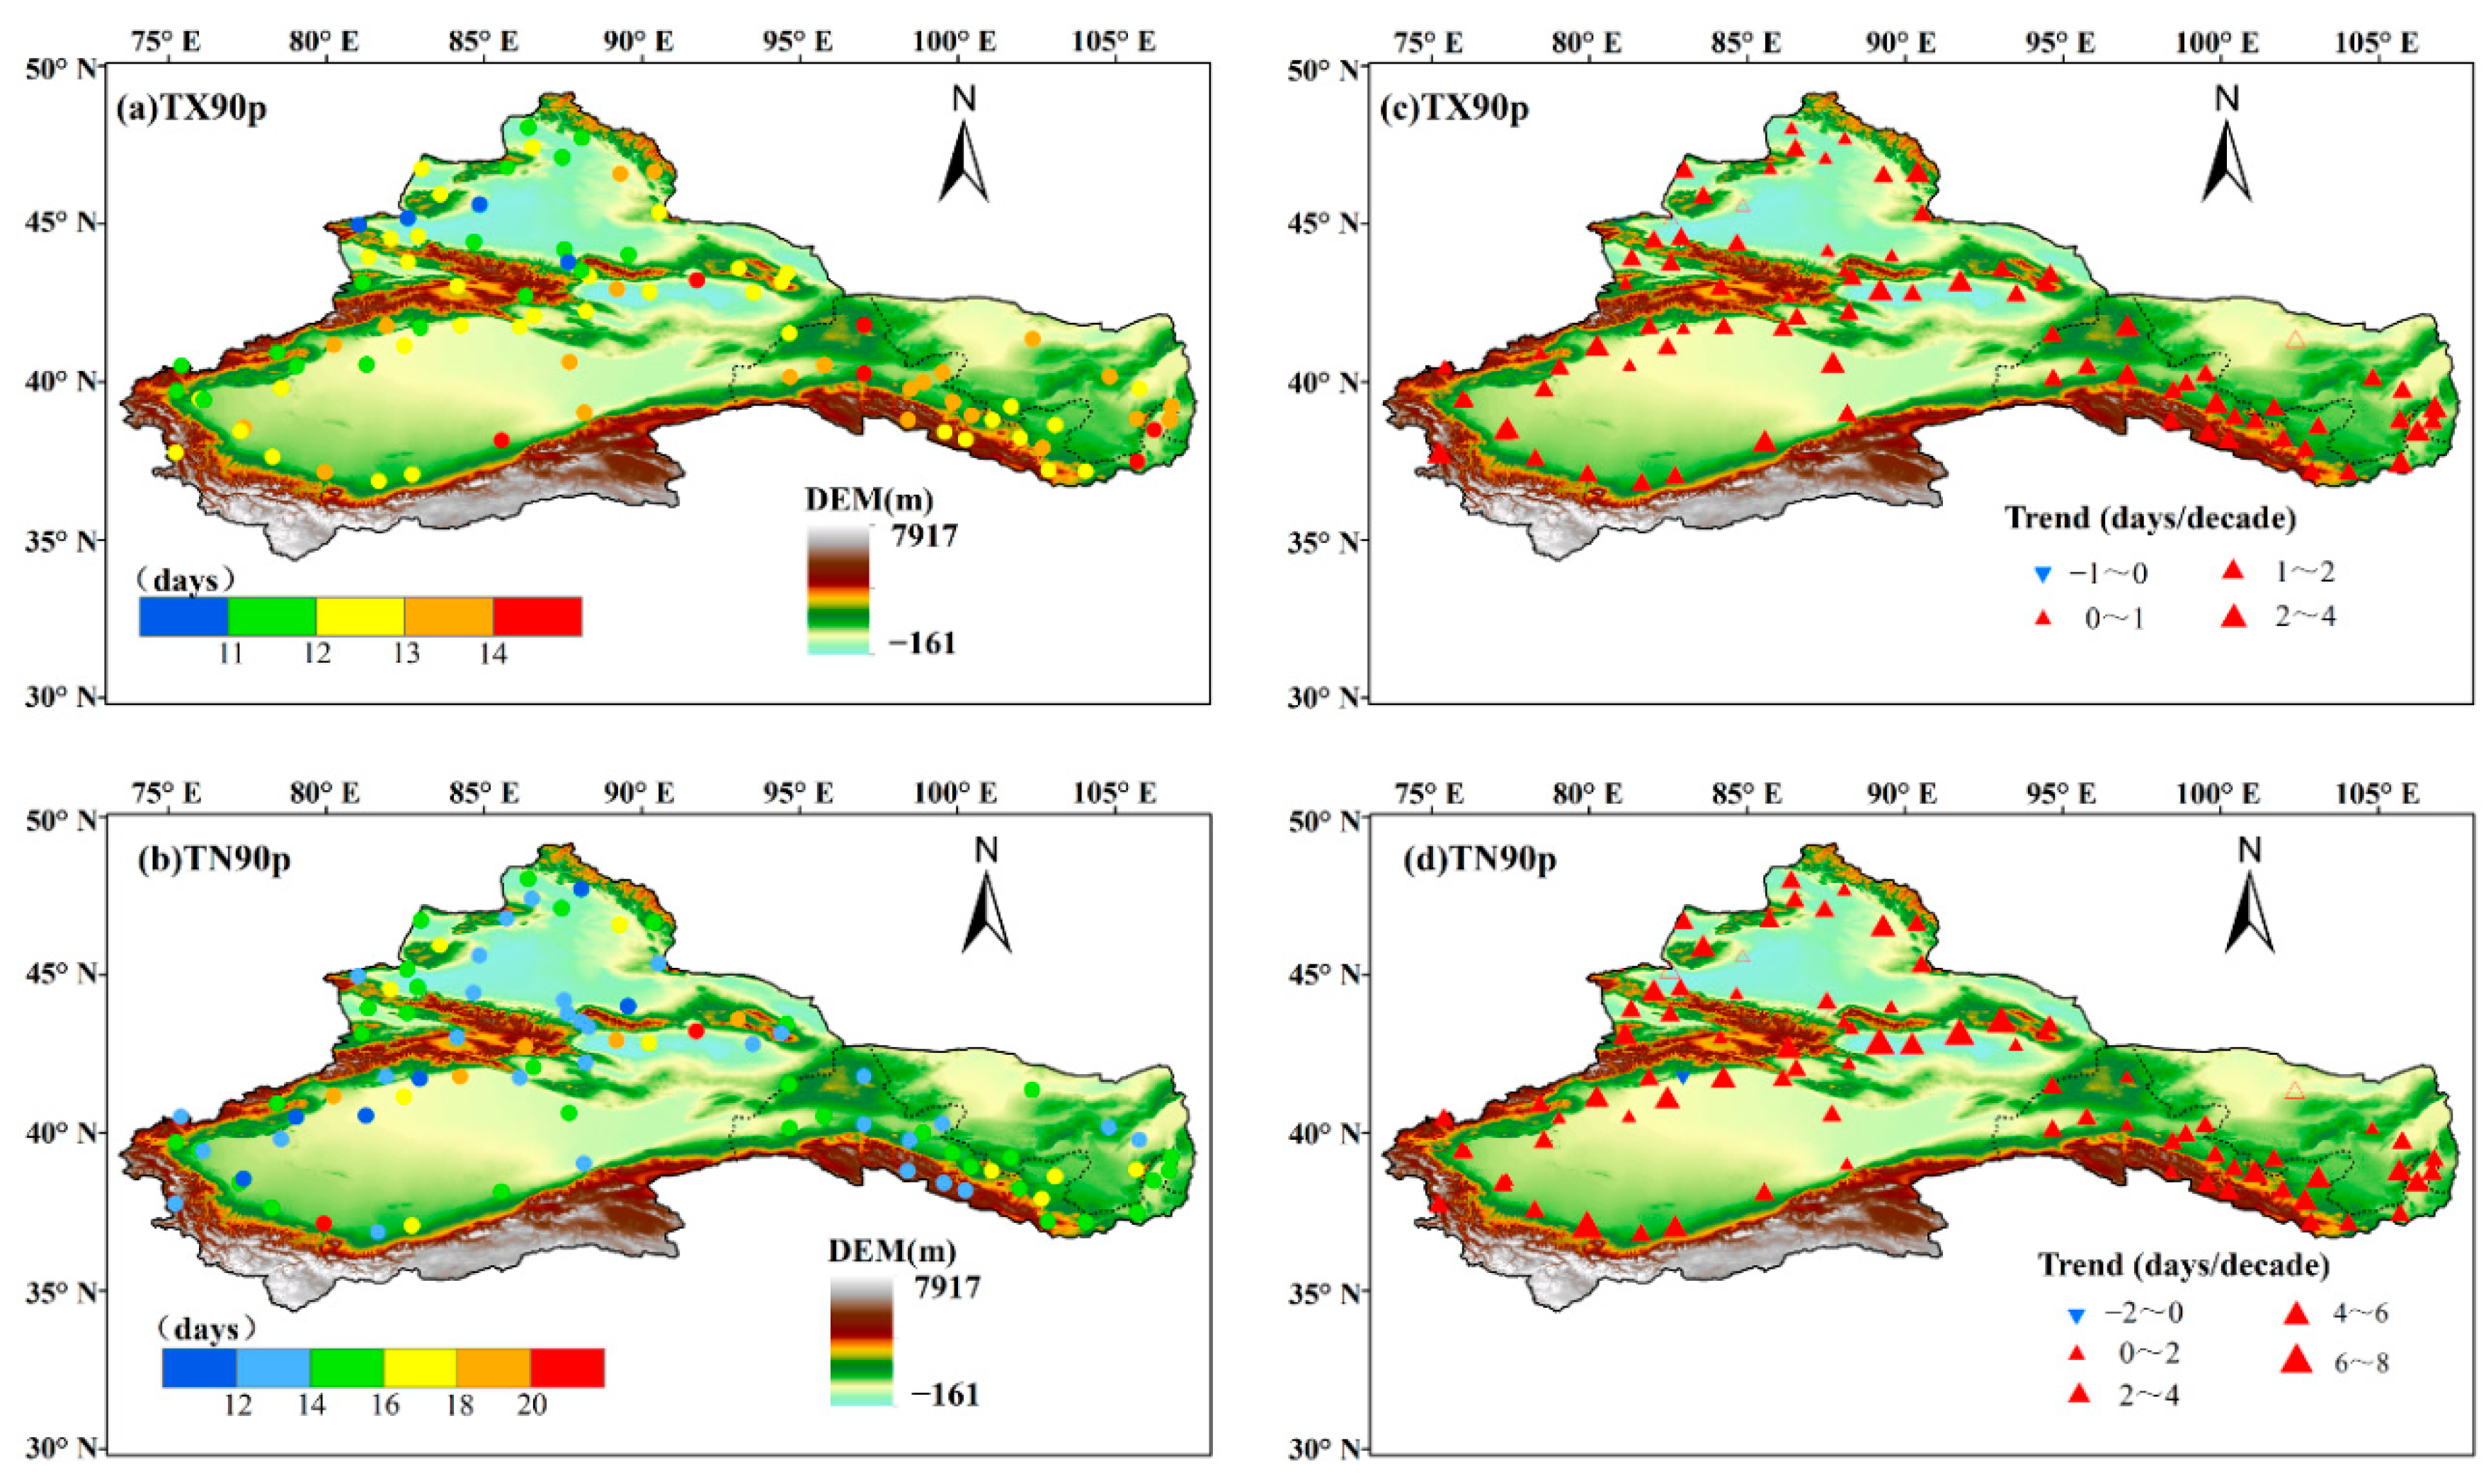
The average of TX90p in the ARNC was more than 11 days (Figure 6a). It was obviously larger than the average of TX10p. The mean of TX90p in the southeastern part of Southern Xinjiang and Hexi-Alasha was more than 13 days, and of the central part of Northern Xinjiang was around 11–12 days for the average TX90p. The trend for the whole region was 1.49 days/decade. The trend of TX90p was more obvious in Hexi-Alasha region (1.84 days/decade), followed by Southern Xinjiang (1.53 days/decade) and Northern Xinjiang (1.01 days/decade). The M–K test result shows that 93.1% (81 stations) of stations for TX90p exhibited an obvious positive trend (p < 0.05).
The mean TN90p in most regions was 12–16 days (Figure 6b) and it was higher than the average of TN10p. The trend of TN90p increased significantly across the study region at the rate of 3 days/decade. The trend of TN90p was more obvious in Southern Xinjiang (3.17 days/decade), followed by Hexi-Alasha (3 days/decade) and Northern Xinjiang (2.71 days/decade). TN90p exhibited an increasing trend in almost all of the study region, accounting for 97.7% (85 stations) of stations that exhibited significant increasing trends at the 0.05 significance level.
Overall, TX10p and TN10p were dominated by an evident downward trend, and the TN10p decreased more significant. TX90p and TN90p experienced a notable increasing trend, and the TN90p increased more significant. The magnitude for TX90p and TN90p was much larger than TX10p and TN10p in climate trend, and the warming trend at night was larger than that during the day. The results above show that the warming trend in the ARNC was significant from 1960 to 2017.

3.2.3. Consecutive Day Temperature Indices: CSDI, and WSDI

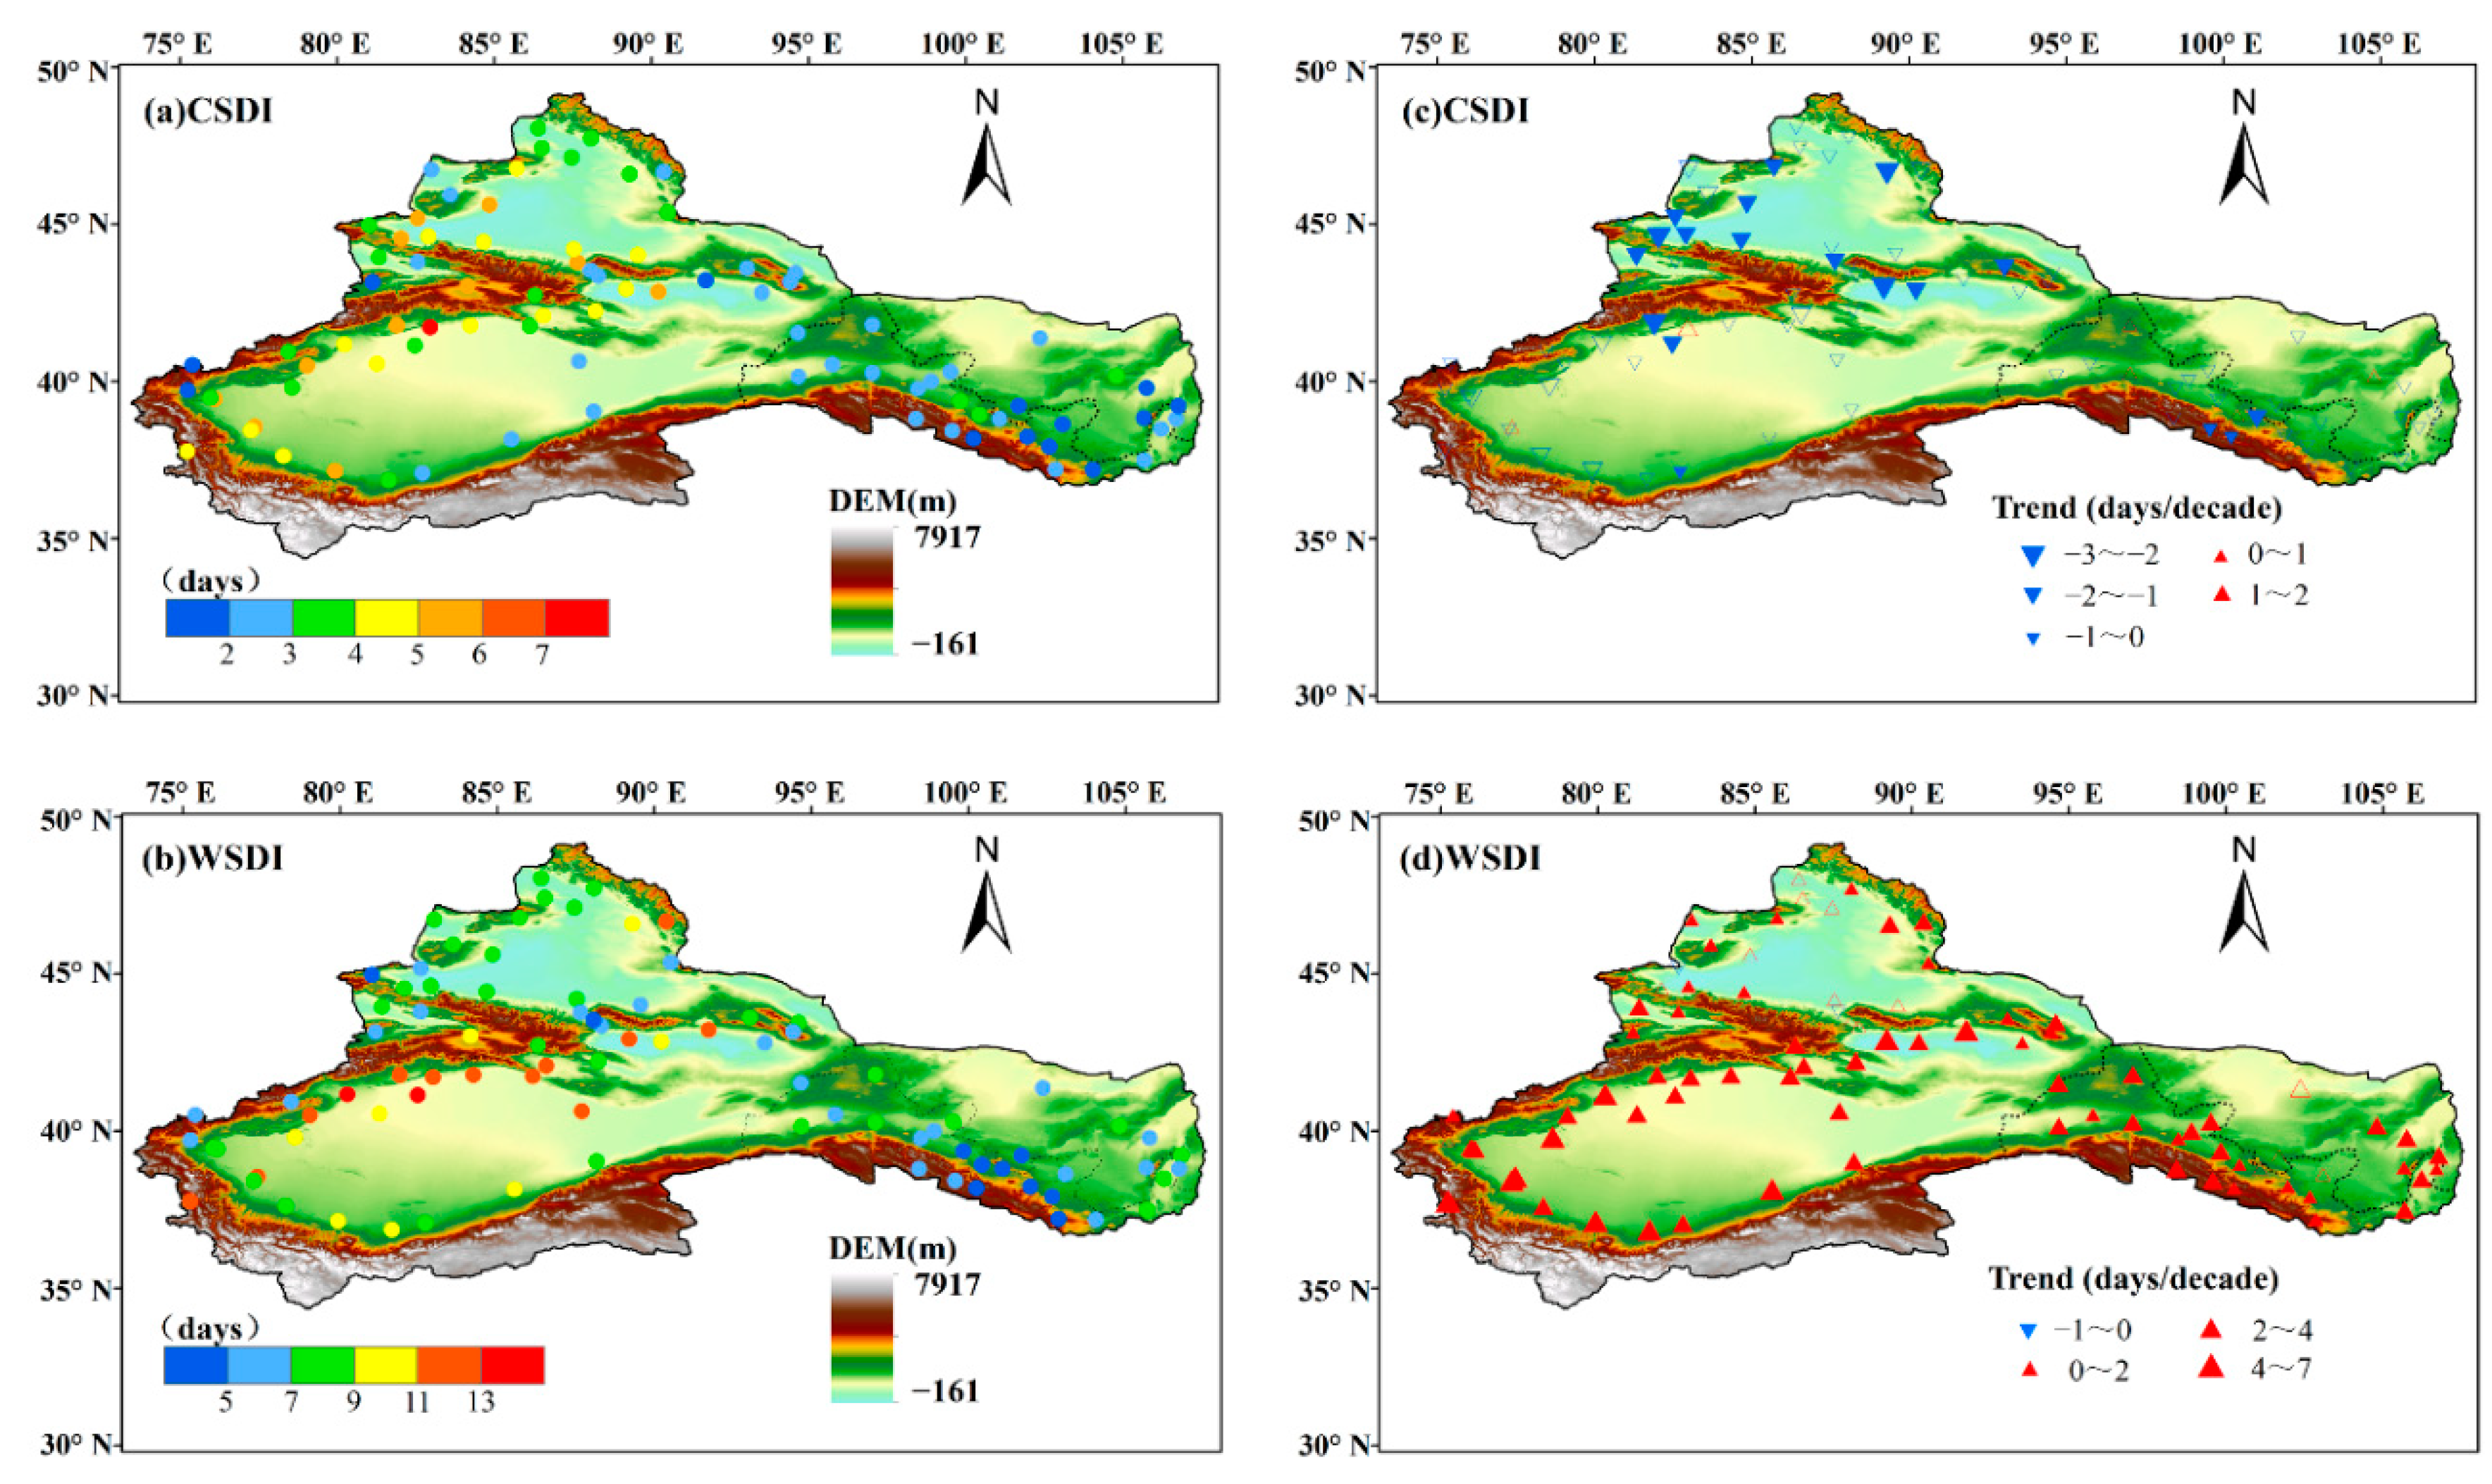
The spatial distribution of average and trend for CSDI and WSDI is shown in Figure 7. The average of CSDI in a few areas of Tianshan Mountains was 6 days. The mean of CSDI in Southern and Northern Xinjiang was 3–5 days and the Hexi-Alasha region was about 2 days. The trend of CSDI was −0.76 days/decade over the whole region. The trends in Southern Xinjiang, Northern Xinjiang, and Hexi-Alasha region were −0.77, −1.1, and −0.44 days/decade, respectively. For CSDI, nearly 92% (80 stations) of total stations showed robust decreasing trends. The average for WSDI in most areas was more than 5 days, which was significantly higher than the average values of CSDI.
The average of WSDI in Southern Xinjiang, Northern Xinjiang, and Hexi-Alasha region was 10, 8, and 6 days, respectively. The trend of WSDI was 2.28 days/decade over the entire region. The trend of WSDI was more obvious in Southern Xinjiang (3.05 days/decade), followed by Hexi-Alasha region (2.15 days/decade) and Northern Xinjiang (1.18 days/decade). Furthermore, 97.7% (85 stations) of the total stations for WSDI increased significantly over the study region (Table 3). According to the M–K test results, 77% (67 stations) of total meteorological stations for WSDI exhibited a statistically significant positive trend (p < 0.05).
In summary, CSDI showed a declining trend in the study area, except for a few stations, especially in Tianshan mountains and Northern Xinjiang. WSDI was dominated by increasing trends over the entire region. The magnitude of climate trend for WSDI was also much larger than that of CSDI.

4. Breaking-Point Change of Extreme Temperature Indices

The breakpoint years of selected indices detected by different methods are shown in Table 3. The breakpoint years of extreme warm indices (SU25, TX90p, TN90p, and WSDI) were all detected in 1996. Besides, we also detected significant breaking-point changes of the extreme cold indices: FD and TX10p in 1996; TN10p in 1987; and CSDI in 1988. These dates differ from the breaking-point change (1986) for cold indices found by Wang [66]. The possible reason for the inconsistency in the detection results of the breakpoint year may be that the selected extreme indices and the study period are different. Significant and credible breakpoint years were detected in both cold and warm indices during the study period. The cold indices decreased and the warm indices increased significantly after the breakpoint year. This implies that climate warming is remarkable in the ARNC.
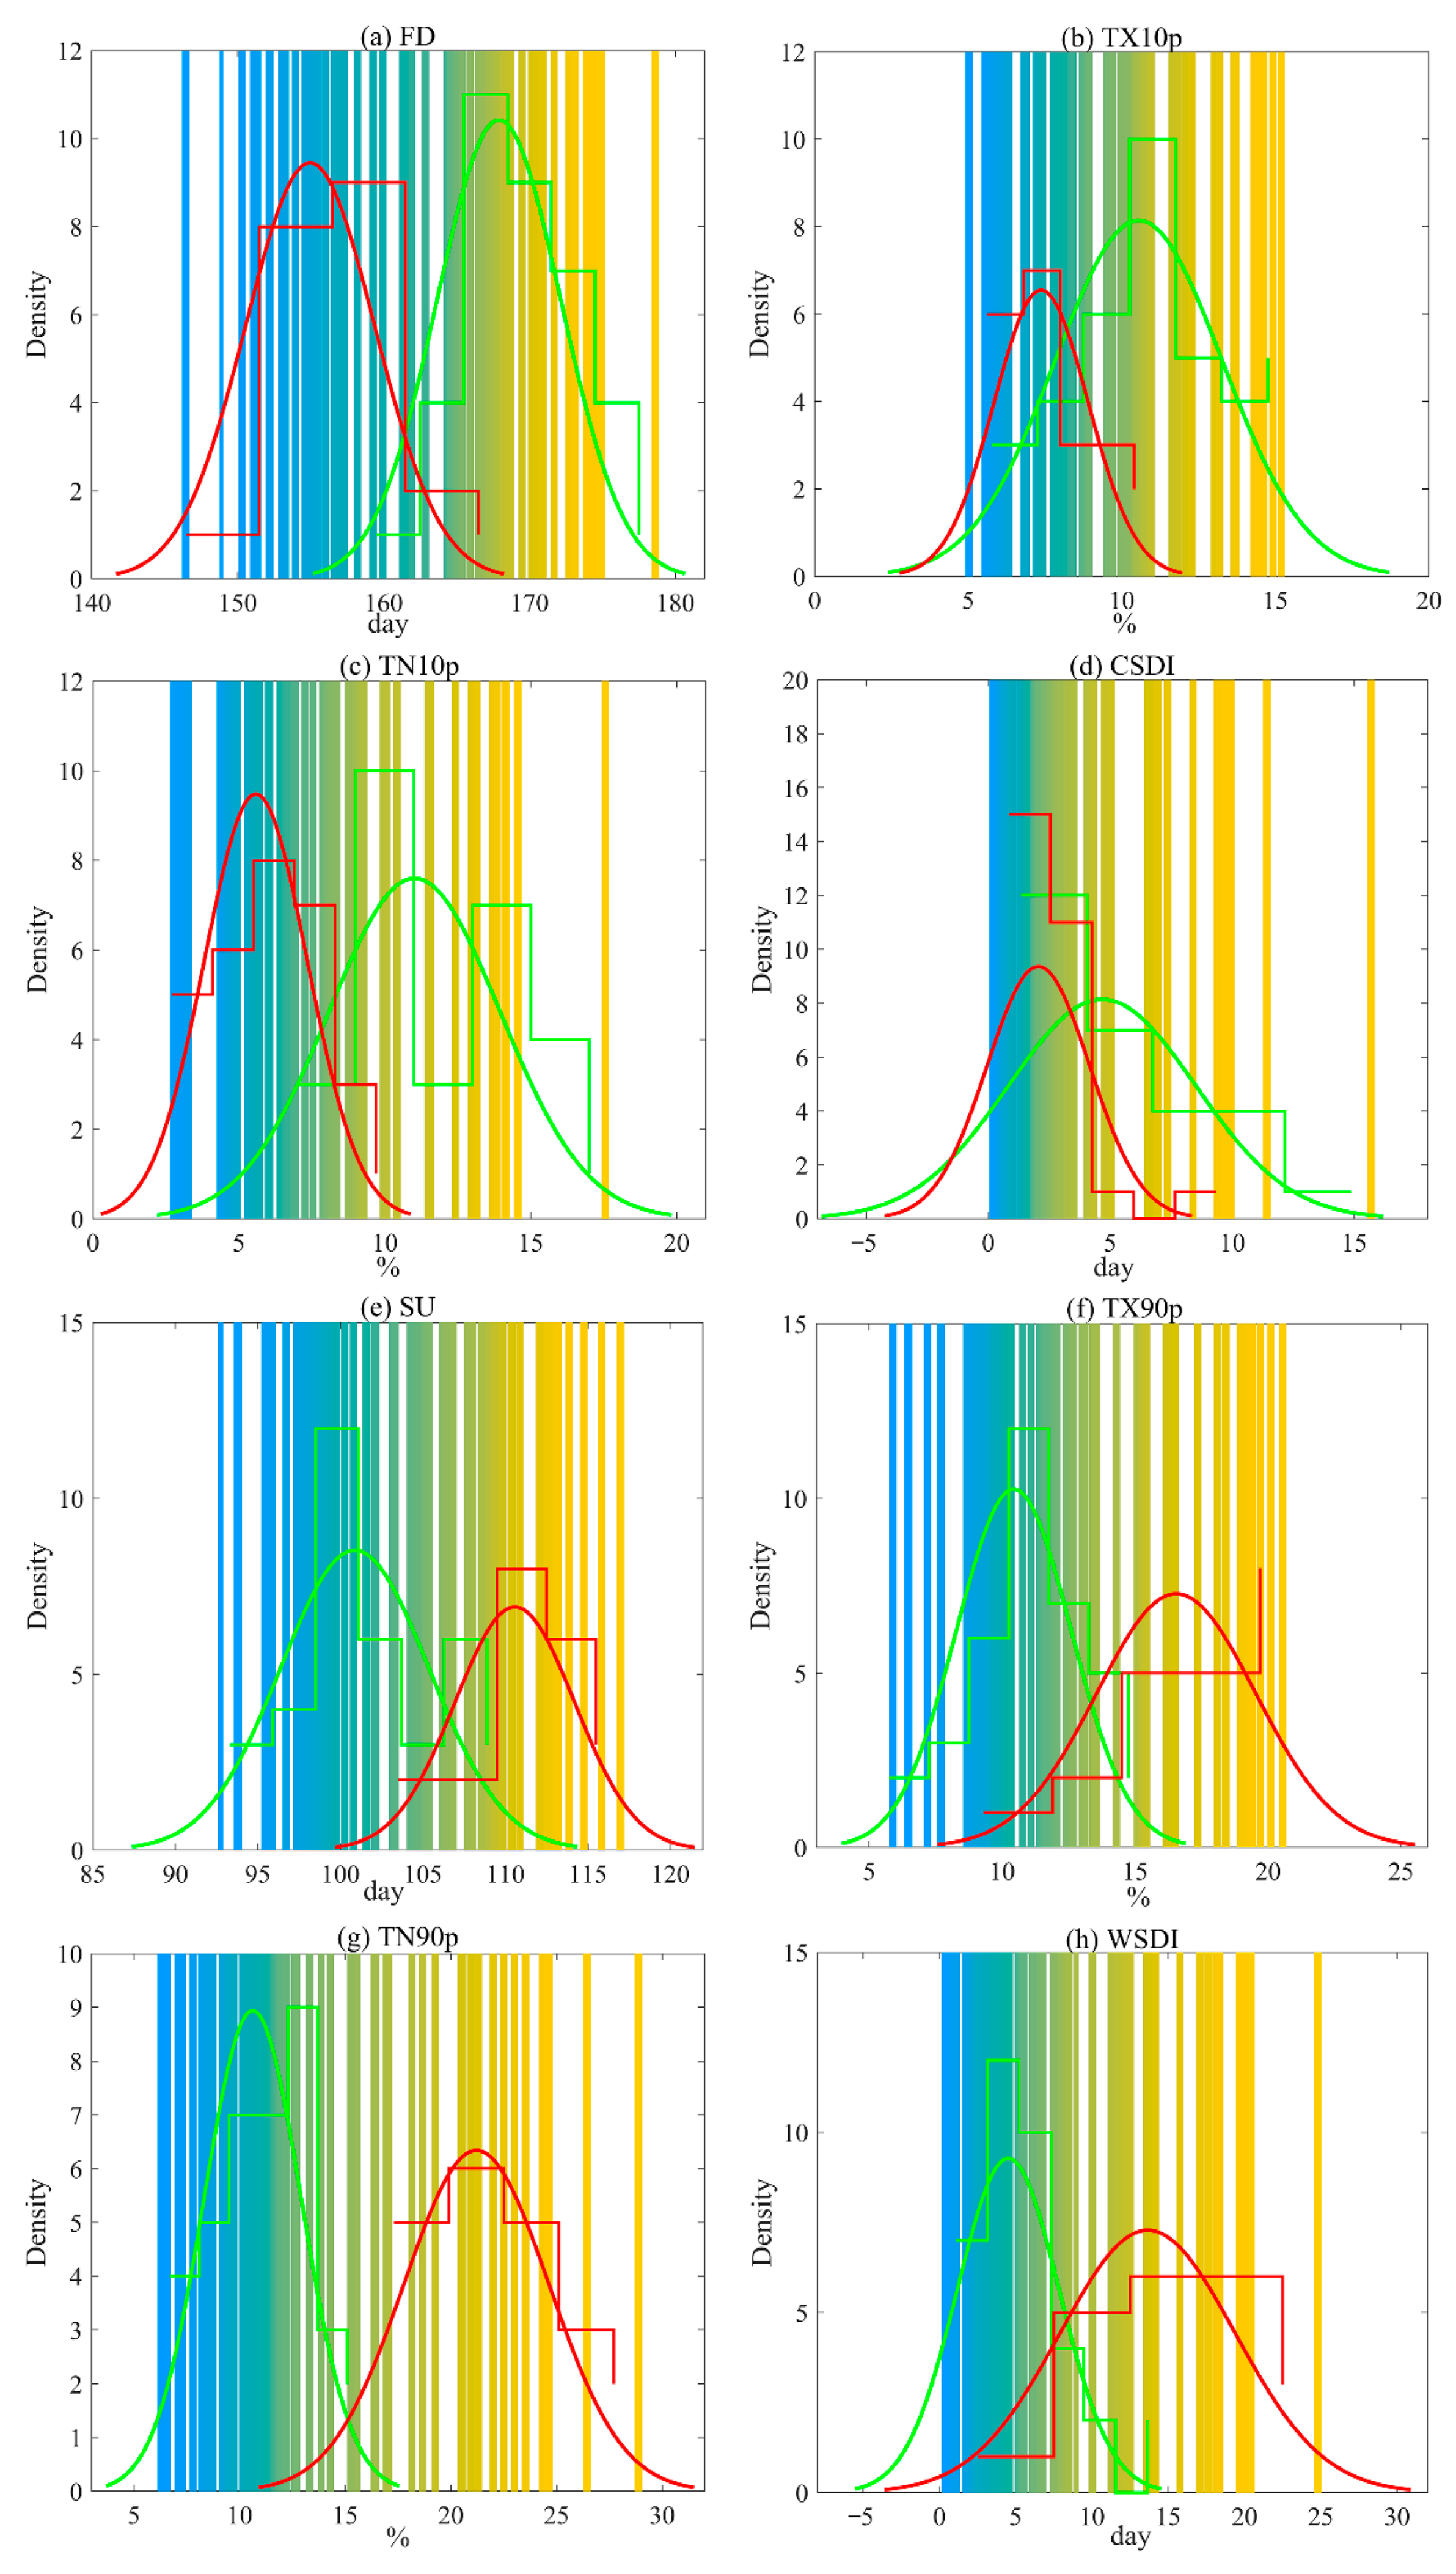
The probability and density distribution of extreme cold and warm indices before and after the breakpoint year were also researched in this paper. For extreme cold indices, the mean values for FD, TX10p, TN10p, and CSDI all decreased in varying degrees after the breakpoint year. The dispersion degree of FD did not change much before and after the breakpoint year. While the dispersion degree for TX10p, TN10p, and CSDI became significantly smaller after the breakpoint year. This indicates that the regional warming was very significant generally for the period 1997–2017 (before the breakpoint year) compared to 1960–1996 (after the breakpoint year) (Figure 8a–d). For extreme warm indices, a remarkable shift can be observed before and after the breakpoint year. The average for SU25, TX90p, TN90p, and WSDI all increased at different degrees after the breakpoint year on the whole. The dispersion degree for SU25, TX90p, TN90p, and WSDI became larger after the breakpoint year. This indicates that there was a significant difference in the magnitude of regional warming (Figure 8e–h). It is clear that a small variation in the mean value can lead to an obvious change in the extreme frequency. The average values of extreme warm indices were all inclined to the higher value, while the mean values of extreme cold indices were all obliqued to the lower value after the breakpoint years. It means that the warming trend of climate is significant sharply after the breakpoint year.

5. Discussion and Conclusions

The temporal characteristics for temperature extremes indicate that the extreme warm indices are dominated by a significant increasing trend, while the extreme cold indices represent a pronounced decreasing trend over the study region during 1960–2017. The results are consistent with previous findings [41,42,67]. The results of spatial analysis show that the ARNC has experienced a pronounced warming trend as a whole during the study period. Most meteorological stations observe an increasing trend in the warm indices and a decreasing trend in the cold indices during 1960–2017. However, there is a significant difference in the climatic tendency for the extreme warm/cold indices of meteorological stations. The possible reason is that the study area is far away from the ocean, and the influence of water vapor from the ocean varies from place to place due to the obstruction by high mountains around the study area. In addition, the extremely dry climate and widespread desert have a great impact on extreme temperatures in different regions. The decrease (increase) for extreme cold (warm) indices illustrates that the climate change influenced by global warming is significant over the study area. The pronounced warming trend in the extreme temperature indices in the ARNC could have potential effects on the society and natural environment in many respects. Some effects are conductive to the society development and environmental evolution. For instance, the warming trend may accelerate the melting of snow and glaciers in the mountain areas, which provides more water for agriculture irrigation, industry, and urban residents. However, excessive melting of glaciers and snow in mountain areas may cause catastrophic flooding in the lower reaches of the river and a decrease in glacial reserves, which is not conducive to the sustainable development of the study area.
The breakpoint years detected in this paper for most extreme temperature indices (1996) are in line with that of the breaking-point change of climate in the Northern Hemisphere studied by previous researchers [68,69,70,71]. A remarkable shift for the location parameter and the scale parameter of the frequency and probability distribution of extreme warm and cold indices can be observed before and after the breakpoint year. The averages of extreme warm (cold) indices are all inclined to the hotter part of the density distribution. This indicates that the climate over the study region shifts sharply toward a warmer trend after the breakpoint year. The extreme warm (cold) indices significantly increase (decrease) after the breakpoint year. These changes may be affected by atmospheric circulation. Therefore, to investigate the possible influence of atmospheric field anomalies and temperature variation, we calculated and detected the differences in atmosphere circulation between the two periods before and after the breakpoint year in geopotential heights at 500 hPa and total cloudiness obtained from NCEP/NCAR reanalysis data by subtracting the mean values before and after the breakpoint year in 1996 over the selected area ranges from 0–70° N and 70–150° E.
Figure 9a shows the mean differences of the geopotential heights at 500 hPa before and after the breakpoint year. The analysis reveals that a positive anomaly of geopotential height at 500 hPa corresponds to temperature increasing uniformly over the ARNC. The positive anomaly of potential height in the upper air corresponds to the increase of near-surface temperature, forming a low-pressure center, resulting in the increasing of extreme warm indices for SU25, TN90p, TX90p, and WSDI, and decreasing in extreme cold indices for FD, TN10p, TX10p, and CSDI. In addition, as can be seen from Figure 9b, the mean difference of the total cloudiness before and after the breakpoint year indicates that the total cloudiness is less over the ARNC. This enables more solar radiation to reach the ground through the atmosphere and increases the near-surface temperature. The above studies show that there is a positive feedback relationship between the warming trend and the geopotential height field at 500 hPa, and there also exists a negative connection between the total cloudiness and temperature increasing, and vice versa.
In this study, we analyzed the statistical characteristics of extreme temperature indices and detected statistically significant correlations between extreme temperature and geopotential height at 500 hPa and total cloudiness, and we obtained some meaningful research results. However, we have not yet investigated the dynamics and physical mechanisms for the relationships between the temperature extreme events and large-scale atmospheric circulation, such as North Atlantic Oscillation, Arctic Oscillation, El Niño-Southern Oscillation, but plan to be addressed in future study. Additionally, the cloud is an important regulating factor of energy change in the land–atmosphere system. It regulates the balance of energy in the land–atmosphere system by reflecting the solar radiation and absorbing long-wave radiation from the ground. There are complex positive and negative feedback relationships between temperature and cloudiness interacted with each other through the process of water vapor transport and radiation. The influence of cloudiness on temperature depends on the factors in many aspects of cloudiness. The cloudiness at other heights, low cloudiness, cloud depth, and type of cloud are also playing an important role in regulating temperature. It needs to be further researched as a topic in future work. Meanwhile, temperature extremes are affected by various factors such as local heat fluxes, sea surface temperature, and anthropogenic activities, which is considered to be a non-stationary and non-linear dynamic change process, especially in arid regions with diverse topography and landforms. Therefore, more detailed research is needed to thoroughly study the relationship between extreme temperature changes and various external drivers. The relationship between extreme temperatures and extreme precipitations should also be considered in the context of climate warming, because the types of extremes do not always exist independently.

Author Contributions

conceptualization, Y.P.; data curation, Y.P.; writing—original draft, Y.P.; writing—review and editing, Y.Y.; supervision, Y.Z., C.X., and R.Y. All authors have read and agreed to the published version of the manuscript.

Funding

This research was funded by the Strategic Priority Research Program of Chinese Academy of Sciences, Pan-Third Pole Environment Study for a Green Silk Road, grant number XDA20060303; the ’’High-level Talents Project’’ of Xinjiang Institute of Ecology and Geography, Chinese Academy of Sciences, grant number Y871171 and the fund of CAS “Light of West China” Program, grant number 2018-XBQNXZ-B-017.

Acknowledgments

Special thanks to the anonymous reviewers for their invaluable suggestions and the work of editor, which have led to a significant improvement of this manuscript.

Conflicts of Interest

The authors declare no conflict of interest.

Appendix A

Table A1. Information of selected meteorological stations in the ARNC.
NumberStation NameProvinceLatitudeLongitudeELEVATION (m)
51053HabaheXinjiang48.0586.40532.6
51060BuerjinXinjiang47.4286.52473.9
51068FuhaiXinjiang47.1287.47500.9
51076AltaiXinjiang47.7388.08735.3
51087FuyunXinjiang46.5989.31807.5
51133TachengXinjiang46.7383.00534.9
51156HebukesaierXinjiang46.7885.721291.6
51186QingheXinjiang46.6790.381218.2
51232AlashankouXinjiang45.1882.57336.1
51238BoleXinjiang44.5482.04532.2
51241TuoliXinjiang45.9383.601077.8
51243KelamayiXinjiang45.6284.85449.5
51288BeitashanXinjiang45.3790.531653.7
51330WenquanXinjiang44.9781.021357.8
51334JingheXinjiang44.6282.90329.2
51346WusuXinjiang44.4384.67478.7
51365CaijiahuXinjiang44.2087.53440.5
51379QitaiXinjiang44.0289.57793.5
51431YiningXinjiang43.9581.33662.5
51433NilekeXinjiang43.8082.571105.3
51437ZhaosuXinjiang43.1581.131851
51463UrumqiXinjiang43.7887.65935
51467BaluntaiXinjiang42.7386.301732.4
51470TianchiXinjiang43.5388.071942.5
51477DabanchengXinjiang43.3588.321103.5
51495QijiaojingXinjiang43.2291.73721.4
51526KumishiXinjiang42.2388.22922.4
51542BayinbulukeXinjiang43.0384.152458
51567YanqiXinjiang42.0886.571055.3
51573TurpanXinjiang42.9389.2034.5
51581ShanshanXinjiang42.8590.23398.6
51628AkesuXinjiang41.1780.231103.8
51633BaichengXinjiang41.7881.901229.2
51639ShayaXinjiang41.1482.47980.4
51642LuntaiXinjiang41.7884.25982
51644KucheXinjiang41.7282.971081.9
51656KuerleXinjiang41.7586.13931.5
51701TuergateXinjiang40.5275.403504.4
51704AtushiXinjiang39.4376.101298.7
51705WuqiaXinjiang39.7275.252175.7
51709KashgarXinjiang39.4775.981385.6
51711AheqiXinjiang40.9378.451985.1
51716BachuXinjiang39.8078.571116.5
51720KepingXinjiang40.5079.051161.8
51730AlaerXinjiang40.5581.271012.2
51765TieganlikeXinjiang40.6387.70846
51777RuoqiangXinjiang39.0388.17887.7
51804TashikuerganXinjiang37.7775.233090.1
51810MaigaitiXinjiang38.5577.381178.2
51811ShacheXinjiang38.4377.271231.2
51818PishanXinjiang37.6278.281375.4
51828HetianXinjiang37.1379.931375
51839MinfengXinjiang37.0782.721409.5
51855QiemoXinjiang38.1585.551247.2
51931YutianXinjiang36.8581.651422
52101BalitangXinjiang43.6093.051679.4
52112ZhuomaohuXinjiang43.4594.59479
52118YiwuXinjiang43.1694.421728.6
52203HamiXinjiang42.8293.52737.2
52313HongliuheXinjiang41.5394.671573.8
52323MazongshanGansu41.8097.031770.4
52418DunhuangGansu40.1594.681139
52424AnxiGansu40.5395.771170.9
52436YumenzhenGansu40.2797.031526
52446DingxinGansu40.3099.521177.4
52447JintaGansu40.0098.901270.5
52495BayinmaodaoInner Mongolia40.17104.801323.9
52533JiuquanGansu39.7798.481477.2
52546GaotaiGansu39.3799.831332.2
52576AlashanyouqiInner Mongolia39.22101.681510.1
52633TuoleQinghai38.8098.423367
52645YeniugouQinghai38.4299.583314
52652ZhangyeGansu38.93100.431461.1
52657QilianQinghai38.18100.252787.4
52661ShandanGansu38.80101.081765.5
52674YongchangGansu38.23101.971976.9
52679WuweiGansu37.92102.671531.5
52681MinqinGansu38.63103.081367.5
52787WuqiaolingGansu37.20102.873045.1
52797JingtaiGansu37.18104.051630.9
53502JilantaiInner Mongolia39.78105.7511031.8
53519HuinongNingxia39.22106.771092.5
53602AlashanzuoqiInner Mongolia38.83105.671561.4
53614YinchuanNingxia38.48106.221110.9
53615TaoleNingxia38.80106.701101.6
53705ZhongningNingxia37.48105.681183.4
52378GuaizihuInner Mongolia41.37102.37960

References

  1. Doktycz, C.; Abkowitz, M. Loss and Damage Estimation for Extreme Weather Events: State of the Practice. Sustainability 2019, 11, 4243. [Google Scholar] [CrossRef] [Green Version]
  2. Vincent, L.A.; Peterson, T.C.; Barros, V.R.; Marino, M.B.; Rusticucci, M.; Carrasco, G.; Ramirez, E.; Alves, L.M.; Ambrizzi, T.; Berlato, M.A.; et al. Observed trends in indices of daily temperature extremes in South America 1960–2000. J. Clim. 2005, 18, 5011–5023. [Google Scholar] [CrossRef]
  3. Choi, G.; Collins, D.; Ren, G.Y.; Trewin, B.; Baldi, M.; Fukuda, Y.; Afzaal, M.; Pianmana, T.; Gomboluudev, P.; Huong, P.T.T.; et al. Changes in means and ex-treme events of temperature and precipitation in the Asia-Pacific Network region, 1955–2007. Int. J. Climatol. 2009, 29, 1906–1925. [Google Scholar] [CrossRef]
  4. Mutiibwa, D.; Vavrus, S.J.; McAfee, S.A.; Albright, T.P. Recent spatiotemporal patterns in temperature extremes across conterminous United States. J. Geophys. Res.-Atmos. 2015, 120, 7378–7392. [Google Scholar] [CrossRef]
  5. Centre for Research on the Epidemiology of Disasters (CRED), United Nations Office for Disaster Risk Reduction (UNISDR). The Human Cost of Weather-Related Disasters 1995–2015; UNISDR: Geneva, Switzerland, 2015; Volume 30. [Google Scholar]
  6. Robine, J.M.; Cheung, S.L.K.; Le Roy, S.; Van Oyen, H.; Griffiths, C.; Michel, J.P.; Herrmann, F.R. Death toll exceeded 70,000 in Europe during the summer of 2003. C. R. Biol. 2008, 331, 171–178. [Google Scholar] [CrossRef] [PubMed]
  7. Garcia-Herrera, R.; Diaz, J.; Trigo, R.M.; Luterbacher, J.; Fischer, E.M. A review of the European summer h-eat wave of 2003. Crit. Rev. Environ. Sci. Technol. 2010, 40, 267–306. [Google Scholar] [CrossRef]
  8. Wolfgang, K.; Petra, L.; Zbigniew, W.K. Changes in risk of extreme weather events in Europe. Environ. Sci. Policy 2019, 100, 74–83. [Google Scholar] [CrossRef]
  9. Zhang, S.; Tao, F.L.; Zhang, Z. Changes in extreme temperatures and their impacts on rice yields in southern China from 1981 to 2009. Field. Crops Res. 2016, 189, 43–50. [Google Scholar] [CrossRef] [Green Version]
  10. Huang, W.C.; Lee, Y.Y. Strategic Planning for Land Use under Extreme Climate Changes: A Case Study in Taiwan. Sustainability 2016, 8, 53. [Google Scholar] [CrossRef] [Green Version]
  11. Hatfeld, J.L.; Prueger, J.H. Temperature extremes: Effect on plant growth and development. Weather Clim. Extrem. 2015, 10, 4–10. [Google Scholar] [CrossRef] [Green Version]
  12. Crabbe, R.A.; Dash, J.; Rodriguez-Galiano, V.F.; Janous, D.; Pavelka, M.; Marek, M.V. Extreme warm temperatures alter forest phe-nology and productivity in Europe. Sci. Total. Environ. 2016, 563–564, 486–495. [Google Scholar] [CrossRef] [PubMed]
  13. Li, C.; Wang, J.; Hu, R.; Yin, S.; Bao, Y.; Ayal, D.Y. Relationship between vegetation change and extreme climate in-dices on the Inner Mongolia Plateau, China, from 1982 to 2013. Ecol. Indic. 2018, 89, 101–109. [Google Scholar] [CrossRef]
  14. Ye, L.; Shi, K.; Xin, Z.; Wang, C.; Zhang, C. Compound Droughts and Heat Waves in China. Sustainability 2019, 11, 3270. [Google Scholar] [CrossRef] [Green Version]
  15. Bala, G.; Caldeira, K.; Nemani, R. Fast versus slow response in climate change: Implications for the global hydrological cycle. Clim. Dyn. 2010, 35, 423–434. [Google Scholar] [CrossRef]
  16. Kao, L.S.; Chiu, Y.H.; Tsai, C.Y. An Evaluation Study of Urban Development Strategy Based on of Extreme Climate Conditions. Sustainability 2017, 9, 284. [Google Scholar] [CrossRef] [Green Version]
  17. Zhang, H.; Wang, Y.; Park, T.W.; Deng, Y. Quantifying the relationship between extreme air pollution events and extreme weather events. Atmos. Res. 2017, 188, 64–79. [Google Scholar] [CrossRef]
  18. Sanz-Lazaro, C. A Framework to Advance the Understanding of the Ecological Effects of Extreme Climate Events. Sustainability 2019, 11, 5954. [Google Scholar] [CrossRef] [Green Version]
  19. Rammig, A.; Mahecha, M.D. Ecosystem responses to climate extremes. Nature 2015, 527, 315–316. [Google Scholar] [CrossRef]
  20. Yang, Z.M.; Wang, Q.; Liu, P.F. Extreme temperature and mortality: Evidence from China. Int. J. Biometeorol. 2018, 63, 29–50. [Google Scholar] [CrossRef]
  21. Orimoloye, I.R.; Mazinyo, S.P.; Kalumba, A.M.; Ekundayo, O.Y.; Nel, W. Implications of climate variability and change on urban and human health: A review. Cities 2019, 91, 213–223. [Google Scholar] [CrossRef]
  22. Mernild, S.H.; Hanna, E.; Yde, J.C.; Cappelen, J.; Malmros, J.K. Coastal Greenland air temperature extremes and trends 1890–2010: Annual and monthly analysis. Int. J. Climatol. 2014, 34, 1472–1487. [Google Scholar] [CrossRef]
  23. Barrett, B.; Charles, J.W.; Temte, J.L. Climate change, human health, and epidemiological transition. Prev. Med. 2015, 70, 69–75. [Google Scholar] [CrossRef] [Green Version]
  24. Trenberth, K.E.; Fasullo, J.T. Climate extremes and climate change: The Russian heat wave and ot-her climate extremes of 2010. J. Geophys. Res.-Atmos. 2012, 117, 17103. [Google Scholar] [CrossRef]
  25. Wijngaarden, V.W.A. Temperature trends in the Canadian arctic during 1895–2014. Theor. Appl. Climatol. 2015, 120, 609–615. [Google Scholar] [CrossRef]
  26. Zhang, X.B.; Aguilar, E.; Sensoy, S. Trends in Middle East climate extreme indices from 1950 to 2003. J. Geophys. Res. 2005, 110, 3159–3172. [Google Scholar] [CrossRef]
  27. Scaife, A.A.; Folland, C.K.; Alexander, L.V.; Moberg, A.; Knight, J.R. European climate extremes and the North Atlantic Oscillation. J. Clim. 2008, 21, 72–83. [Google Scholar] [CrossRef]
  28. New, M.; Hewitson, B.; Stephenson, D.B.; Tsiga, A.; Kruger, A.; Manhique, A.; Mbambalala, E. Evidence of trends in daily climate extremes over southern and west Africa. J. Geophys. Res.-Atmos. 2006, 111, 3007–3021. [Google Scholar] [CrossRef]
  29. Rupa Kumar, K.; Krishna Kumar, K.; Pant, G.B. Diurnal asymmetry of surface temperature trends over India. Geophys. Res. Lett. 1994, 21, 677–680. [Google Scholar] [CrossRef]
  30. Kothawale, D.R.; Rupa Kumar, K. On the recent changes in surface temperature trends over India. Geophys. Res. Lett. 2005, 32, L18714. [Google Scholar] [CrossRef]
  31. Frich, P.; Alexander, L.V.; Della-Marta, P.; Gleason, B.; Haylock, M.; Tank, A.M.G. Observed coherent changes in climatic extremes during 2nd half of the 20th century. Clim. Res. 2002, 19, 193–212. [Google Scholar] [CrossRef] [Green Version]
  32. Alexander, L.V.; Zhang, X.B.; Peterson, T.C.; Caesar, J.; Vazquez-Aguirre, J.L. Global observed changes in daily climate extremes of temperature and precipitation. J. Geophys. Res.-Atmos. 2006, 111, 1042–1063. [Google Scholar] [CrossRef] [Green Version]
  33. Brown, S.J.; Caesar, J.; Ferro, C.A.T. Global changes in extreme daily temperature since 1950. J. Geophys. Res.-Atmos. 2008, 113, D05115. [Google Scholar] [CrossRef] [Green Version]
  34. Kenyon, J.; Hegerl, G.C. Influence of modes of climate variability on global temperature extremes. J. Clim. 2008, 21, 3872–3889. [Google Scholar] [CrossRef]
  35. Lelieveld, J.; Proestos, Y.; Hadjinicolaou, P.; Tanarhte, M.; Tyrlis, E.; Zittis, G. Strongly increasing heat extremes in the Middle East and North Africa (MENA) in the 21st century. Clim. Chang. 2016, 137, 245–260. [Google Scholar] [CrossRef] [Green Version]
  36. Zhong, K.; Zheng, F.; Wu, H.; Qin, C.; Xu, X. Dynamic changes in temperature extremes and their association with atmospheric circulation patterns in the Songhua River Basin, China. Atmos. Res. 2017, 190, 77–88. [Google Scholar] [CrossRef]
  37. Christidis, N.; Stott, P.A.; Brown, S.; Hegerl, G.C.; Caesar, J. Detection of changes in temperature extremes during the second half of the 20th century. Geophys. Res. Lett. 2005, 32, 242–257. [Google Scholar] [CrossRef] [Green Version]
  38. Tao, H.; Fraedrich, K.; Menz, C.; Zhai, J. Trends in extreme temperature indices in the Poyang Lake Basin, China. Stoch. Environ. Res. Risk A 2014, 28, 1543–1553. [Google Scholar] [CrossRef]
  39. Wang, X.L.; Hou, X.Y. Analysis of spatiotemporal variations and regional differences in extreme temperature events in the coastal area of China during 1961–2014. Acta Ecol. Sin. 2017, 37, 7098–7113. [Google Scholar] [CrossRef]
  40. Liu, B.; Xu, M.; Henderson, M.; Qi, Y.; Li, Y. Taking China’s temperature: Daily range, warming trends, and regional variations, 1955–2000. J. Clim. 2004, 17, 4453–4462. [Google Scholar] [CrossRef]
  41. You, Q.; Kang, S.; Aguilar, E.; Pepin, N.; Flugel, W.A.; Yan, Y.; Xu, Y.; Zhang, Y.; Huang, J. Changes in daily climate extremes in China and their connection to the large-scale atmospheric circulation during 1961–2003. Clim. Dyn. 2011, 36, 2399–2417. [Google Scholar] [CrossRef]
  42. Shi, J.; Cui, L.L.; Ma, Y.; Du, H.Q.; Wen, K.G. Trends in temperature extremes and their associati-on with circulation patterns in china during 1961–2015. Atmos. Res. 2018, 212, 259–272. [Google Scholar] [CrossRef]
  43. Tong, S.; Li, X.; Zhang, J.; Bao, Y.; Bao, Y.; Na, L.; Si, A. Spatial and temporal variability in extreme temperature and precipitation events in Inner Mongolia (China) during 1960–2017. Sci. Total Environ. 2019, 649, 75–89. [Google Scholar] [CrossRef] [PubMed]
  44. Sun, W.Y.; Mu, X.M.; Song, X.Y.; Wu, D.; Cheng, A.F.; Qiu, B. Changes in extreme temperature and precipitation events in the Loess Plateau (China) during 1960–2013 under global warming. Atmos. Res. 2016, 168, 33–48. [Google Scholar] [CrossRef]
  45. Yan, G.; Qi, F.; Wei, L.; Aigang, L.; Yu, W.; Jing, Y.; Aifang, C.; Yamin, W.; Yubo, S.; Li, L.; et al. Changes of daily climate extremes in Loess Plateau during 1960–2013. Quat. Int. 2015, 371, 5–21. [Google Scholar] [CrossRef]
  46. Yu, Z.; Li, X.L. Recent trends in daily temperature extremes over northeastern China (1960–2011). Quat. Int. 2015, 380–381, 35–48. [Google Scholar] [CrossRef]
  47. Li, Z.; He, Y.; Wang, C.; Wang, X.; Xin, H.; Zhang, W.; Cao, W. Spatial and temporal trends of temperature and precipitation during 1960–2008 at the Hengduan Mountains, China. Quat. Int. 2011, 236, 127–142. [Google Scholar] [CrossRef]
  48. Qian, Z.A.; Wu, T.; Song, M.; Ma, X.; Cai, Y.; Liang, X. Arid disaster and advances in arid climate resources over northwest China. Adv. Earth. Sci. 2001, 16, 28–38. (In Chinese) [Google Scholar]
  49. Shi, Y.; Shen, Y.; Kang, E.; Li, D.; Ding, Y.; Zhang, G.; Hu, R. Recent and Future Climate Change in Northwest China. Clim. Chang. 2007, 80, 379–393. [Google Scholar] [CrossRef]
  50. Jiang, C.; Liu, J.; Zhang, H.; Zhang, Z.; Wang, D. China’s progress towards sustainable land degradation control: Insights from the northwest arid regions. Ecol. Eng. 2019, 127, 75–87. [Google Scholar] [CrossRef]
  51. Yao, J.; Tuoliewubieke, D.; Chen, J.; Huo, W.; Hu, W.F. Identification of drought events and correlations with large-Scale ocean-atmospheric patterns of variability: A case study in Xinjiang, China. Atmosphere 2019, 10, 94. [Google Scholar] [CrossRef] [Green Version]
  52. Jiang, X.F.; Li, W.; You, Q.L. Probability projection and uncertainties of the temperature extreme indices change over China. Clim. Chang. Res. 2018, 14, 228–236. [Google Scholar] [CrossRef]
  53. Zhang, Q.; Singh, V.P.; Li, J.; Jiang, F.; Bai, Y. Spatio-temporal variations of precipitation extremes in Xinjiang, China. J. Hydrol. 2012, 434–435, 7–18. [Google Scholar] [CrossRef]
  54. Wang, H.; Chen, Y.; Xun, S.; Lai, D.; Fan, Y.; Li, Z. Changes in daily climate extremes in the arid area of northwestern China. Theor. Appl. Climatol. 2013, 112, 15–28. [Google Scholar] [CrossRef]
  55. Deng, H.J.; Chen, Y.N.; Shi, X.; Li, W.H.; Wang, H.J.; Zhang, S.H.; Fang, G.H. Dynamics of temperature and precipitation extremes and their spatial variation in the arid region of northwest China. Atmos. Res. 2014, 138, 346–355. [Google Scholar] [CrossRef]
  56. Chen, Y.; Deng, H.; Li, B.; Li, Z.; Xu, C. Abrupt change of temperature and precipitation extremes in the arid region of Northwest China. Quat. Int. 2014, 336, 35–43. [Google Scholar] [CrossRef]
  57. Martínez, M.D.; Serra, C.; Burgueño, A.; Lana, X. Time trends of daily maximum and minimum temperatures in Catalonia (ne Spain) for the period 1975–2004. Int. J. Climatol. 2010, 30, 267–290. [Google Scholar] [CrossRef] [Green Version]
  58. Ullah, S.; You, Q.; Ullah, W.; Ali, A.; Xie, W.; Xie, X. Observed changes in temperature extremes over China–Pakistan Economic Corridor during 1980–2016. Int. J. Climatol. 2018, 39, 1457–1475. [Google Scholar] [CrossRef]
  59. You, Q.L.; Ren, G.Y.; Fraedrich, K.; Kang, S.C.; Ren, Y.Y.; Wang, P.L. Winter temperature extremes in China and their possible causes. Int. J. Climatol. 2013, 33, 1444–1455. [Google Scholar] [CrossRef]
  60. Guan, Y.H.; Zhang, X.C.; Zheng, F.L.; Wang, B. Trends and variability of daily temperature extremes during 1960–2012 in the Yangtze River Basin, China. Glob. Planet Chang. 2015, 124, 79–94. [Google Scholar] [CrossRef] [Green Version]
  61. Rahimi, M.; Hejabi, S. Spatial and temporal analysis of trends in extreme temperature indices in Iran over the period 1960–2014. Int. J. Climatol. 2017, 38, 272–282. [Google Scholar] [CrossRef]
  62. Mann, H.B. Non-parametric tests against trend. Econometrica 1945, 13, 245–259. [Google Scholar] [CrossRef]
  63. Sen, P.K. Estimates of the regression coefficient based on Kendall’s tau. J. Am. Stat. Assoc. 1968, 63, 1379–1389. [Google Scholar] [CrossRef]
  64. Yue, S.; Wang, C. The Mann–Kendall test modified by effective sample size to detect trend in serially correlated hydrological series. Water Resour. Manag. 2004, 18, 201–218. [Google Scholar] [CrossRef]
  65. Dansgaard, W.; Clausen, H.B.; Gundestrup, N.; Hammer, C.U.; Johnsen, S.F.; Kristinsdottir, P.M.; Reeh, N. A new greenland deep ice core. Science 1982, 218, 1273–1277. [Google Scholar] [CrossRef] [PubMed]
  66. Wang, H.J.; Pan, Y.P.; Chen, Y.N.; Ye, Z.W. Linear trend and abrupt changes of climate indices in the arid region of northwestern China. Atmos. Res. 2017, 196, 108–118. [Google Scholar] [CrossRef]
  67. Wang, B.; Zhang, M.; Wei, J.; Wang, S.; Li, S.; Ma, Q.; Li, X.; Pan, S. Changes in extreme events of temperature and precipitation over Xinj-iang northwest China, during 1960–2009. Quat. Int. 2013, 298, 141–151. [Google Scholar] [CrossRef]
  68. Renom, M.; Rusticucci, M.; Barreiro, M. Multidecadal changes in the relationship between extreme temperature events in Uruguay and the general atmospheric circulation. Clim. Dyn. 2011, 37, 2471–2480. [Google Scholar] [CrossRef] [Green Version]
  69. Hong, C.C.; Wu, Y.K.; Li, T.; Chang, C.C. The climate regime shift over the Pacifc during 1996/1997. Clim. Dyn. 2014, 43, 435–446. [Google Scholar] [CrossRef] [Green Version]
  70. Yan, P.C.; Hou, W.; Feng, G.L. Transition process of abrupt climate change based on global sea s-urface temperature over the past century. Nonlinear Proc. Geophys. 2016, 23, 115–126. [Google Scholar] [CrossRef] [Green Version]
  71. Dong, B.W.; Sutton, R.T.; Chen, W.; Liu, X.D.; Lu, R.Y.; Sun, Y. Abrupt summer warming and changes in temperature extremes over northeast Asia since the mid-1990s: Drivers and physical processes. Adv. Atmos. Sci. 2016, 33, 1005–1023. [Google Scholar] [CrossRef] [Green Version]
Figure 1. Study area and the distribution of meteorological stations in the arid region of Northwest China (ARNC).
Sustainability 12 01198 g001
Figure 2. Regional annual series of extreme warm indices during 1960–2017 in the ARNC. The black line represents the 9-year smoothing averages. The red line is the linear trend. The blue shadow areas are the 95% confidence interval envelope. (a) Summer days; (b) Warm days; (c) Warm nights; (d) Warm spell duration indicator.
Sustainability 12 01198 g002
Figure 3. Regional annual series of extreme cold indices during 1960–2017 in the ARNC. The black line represents the 9-year smoothing averages. The red line is the linear trend. The blue shadow areas are the 95% confidence interval envelope. (a) Frost days; (b) Cold days; (c) Cold nights; (d) Cold spell duration indicator.
Sustainability 12 01198 g003
Figure 4. Spatial distribution of average and trend for (a,c) frost days and (b,d) summer days based on absolute threshold indices during 1960–2017 in the ARNC. (The solid dots of different colors reflect average changes for many years. The upward and downward triangles represent the increase trend and the decrease trend, respectively. The size of triangles indicates the magnitudes of decadal variations. Solid and hollow triangles represent statistically significant and insignificant at the 0.05 significance level, respectively. These notations also apply to Figure 5, Figure 6 and Figure 7.)
Sustainability 12 01198 g004
Figure 5. Spatial distribution of average and trend for (a,c) cold days and (b,d) cold nights based on percentile threshold indices during 1960–2017 in the ARNC. The symbol annotation is the same as in Figure 4.
Sustainability 12 01198 g005
Figure 6. Spatial distribution of average and trend for (a,c) warm days and (b,d) warm nights based on percentile threshold indices during 1960–2017 in the ARNC. The symbol annotation is the same as in Figure 4.
Sustainability 12 01198 g006
Figure 7. Spatial distribution of average and trend for (a,c) cold spell duration indicator and (b,d) warm spell duration indicator during 1960–2017 in the ARNC. The symbol annotation is the same as in Figure 4.
Sustainability 12 01198 g007
Figure 8. Statistical probability density distribution of extreme cold and warm indices over the ARNC from 1960–2017; the bold lines are the probability distribution with a Gaussian fit before (green lines) and after (red lines) the breakpoint year. The transparent lines are empirical frequency distribution; (a) Frost days; (b) Cold days; (c) Cold nights; (d) Cold spell duration indicator; (e) Summer days; (f) Warm days; (g) Warm nights; (h) Warm spell duration indicator.
Sustainability 12 01198 g008
Figure 9. Differences of (a) the geopotential heights at 500 hPa, (b) the total cloudiness before and after the breakpoint year in 1996.
Sustainability 12 01198 g009
Table 1. Definition of extreme temperature indices selected in this study (unit: day).
CategoriesIndicesIndicator NameDefinitions
Warm indicesSU25Summer daysAnnual count when Tmax > 25 °C
TX90pWarm daysNumber of days when Tmax > 90th percentile
TN90pWarm nightsNumber of days when Tmin > 90th percentile
WSDIWarm spell duration indicatorAnnual count of days with at least 6 consecutive days when Tmax > 90th percentile
Cold indicesFDFrost daysAnnual count when Tmin < 0 °C
TX10pCold daysNumber of days when Tmax < 10th percentile
TN10pCold nightsNumber of days when Tmin < 10th percentile
CSDICold spell duration indicatorAnnual count of days with at least 6 consecutive days when Tmin < 10th percentile
Tmax: daily maximum temperature; Tmin: daily minimum temperature.
Table 2. The number of stations with variation trends for selected temperature indices in the ARNC.
IndicesIncreasing TrendDecreasing TrendStationary Trend
TotalSNon-STotalSNon-STotal
SU258369143211
TX90p868151010
TN90p868511100
WSDI8567182020
FD110868240
TX10p110867790
TN10p110858231
CSDI7078018620
S: Trend is significant at the 0.05 level of significance; Non-S: Trend is not significant at the 0.05 level of significance.
Table 3. Breakpoint year of selected extreme temperature indices with different methods in the ARNC.
IndicesMann–KendallCumulative AnomalyMMTComprehensive Results
SU25199619961996 **1996
TX90p199619961996 **1996
TN90p1995 **19961996 **1996
WSDI199519961996 *1996
FD1996 **1988, 1990, 19961996 *1996
TX10p19951995, 19961996 *1996
TN10p1990 **, 1991 **19871987 **1987
CSDI1981, 198419881988 **1988
* denotes that the trend is significant at the 0.05 level of significance; ** denotes that the trend is significant at the 0.01 level of significance.