1. Introduction
Cities are as living organisms, and thus they have their own dynamics, transforming over time to adapt to the ever-changing context, new community needs, and new paradigms [
1]. Today, in particular, in this period of growing unsustainability (that is characterized by growing urbanization, social inequalities, and ecological and economic crisis), international organizations (i.e., United Nations) are calling for new urbanization strategies in order to achieve sustainable development of cities and human settlements, making them more “inclusive, safe, resilient and sustainable” (goal 11 of the 2030 Agenda for Sustainable Development) [
2,
3]. Urban transformation and regeneration produce multidimensional impacts on the city, on its environmental, economic, and social systems. An aspect that can be considerably affected by urban dynamics is linked to the real estate market. Furthermore, social, cultural, environmental, and economic factors affect demand and supply of real estate. There is a very close relationship between the dynamics of urban development and the real estate market, and so analysing real estate dynamics is useful for decision-makers in the elaboration of urban regeneration plans and projects, and thus orient their choices [
4].
In Europe, since the late 1990s, a growing increase in real estate values has occurred. It has been interrupted since 2008, following the American housing bubble. In 2014, the European Central Bank (ECB)’s liquidity supply made the access to credit for businesses and consumers easier, and thus they regained confidence. This, together with the convenient transaction costs on the market, led to 18.6% increase in transactions in 2016. Prices reached stability in 2017. Since the second half of the 1990s, the Italian real estate market, in particular, has had a positive trend. The reason is linked to the low level of interest rates on mortgages, following the introduction of the single currency, generating a greater propensity to borrowing and consequently a growing demand for housing; the volatility that has affected the financial markets should be also considered in this framework [
5]. The combination of all these events has led to an increase in sale volumes, with a peak in 2006 (with almost 845 thousand transactions) and an increase in values until 2007, when the Italian real estate market reversed its trend due to the real estate bubble of the American subprime.
The downward trend of the real estate cycle began in fact in the second half of 2007, when for the first time, property prices reported a contraction. In the last ten years, property prices in big cities have fallen by over 40% [
6,
7]. However, the percentage of decrease in real estate values of some major Italian cities such as Florence (−28.3%), Milan (−26.3%), Palermo (−39.3%), Rome (−35.8%), and Verona (−36.0%) has recorded a lower decrease than the national average [
8,
9]. The greatest decrease in property values, almost uniform in the different areas of the city, has been recorded in Genoa (−53.3%). Naples, instead, is at the third place in the ranking (−47.0%) after Genoa and Bari during the decade 2009–2018 [
10].
Despite of the above described negative situation in Italy, there are some cases of urban transformation and regeneration projects positively affecting the real estate market values. Milan (+3.8%) and Turin (+2.4%) represent the two cases of greater increase. Milan is becoming more and more attractive, attentive to ecological and energy needs, and also capable of accepting new challenges regarding important and international events (i.e., the World Exposition Milan 2015, Expo). The city of Turin, on the other hand, is the one that has most successfully exploited the European funds to “rethink and reshape” the spaces of a territory historically linked to big industries (related to car production—FIAT—and its satellite activities).
Focusing attention on the of the city of Naples (Italy), the aim of this paper is to analyse in detail the real estate dynamics in this city and propose an integrated evaluation approach for a better understanding and interpretation of urban dynamics, and thus to orient and activate future appropriate planning policies. This work can be useful for decision makers to understand what happened in the city of Naples in a synoptic way and with a high level of definition, such as that of census sections. It can represent a framework that allows linking the real estate dynamics with other information collected for the same sections for the census.
After the literature review (
Section 2) and the introduction of the case study of the city of Naples (
Section 3), the methodological process is explained, identifying four main steps and integrating a Multi-Criteria Decision Analysis (MCDA) and Geographical Information System (GIS) for the analysis of the real estate dynamic in Naples, both for housing and commercial properties (
Section 4). The results are analysed, showing through many maps the outcome of the different elaborations and studies implemented (
Section 5,
Section 6 and
Section 7).
2. Literature Review
Evaluation processes play a key role in decision-making processes related to urban regeneration, in the implementation of urban projects and plans, and in orienting development strategies. In particular, here the attention is focused on understanding and evaluating real estate dynamics. The evaluation of real estate assets is important for supporting and orienting urban strategies and choices to make cities more competitive [
11,
12]. The real estate price represents a useful indicator to evaluate urban performances, and many studies highlight the relationships between the real estate values and urban regeneration [
13,
14,
15,
16].
Geographical Information System (GIS) is a widely used tool for representing the status quo of an area and planning the future scenarios of urban regeneration. This tool can support and facilitate decision-making processes, both for urban planners and for the other actors involved in the process.
Many studies use GIS as a basic tool for mapping and analysing the distribution of various issues in different fields [
17,
18,
19,
20]. Territorial statistical analyses are possible to be carried out by GIS linking a given issue to the territory. The use of statistical techniques for the analysis of spatial autocorrelation has led to important results in different research fields, ranging from natural to social and economic sciences. Different types of geostatistical techniques are used in practice. These allow us to determine groupings according to specific criteria in a given study area. For example, the Hot Spot (Gi* de Getis-Ord) analysis [
21] is used for determining spatial clusters, referred to as high values (hot spots) or low values (cold spots), and the cluster and outlier (Anselin local Moran’s I) analysis [
22] is used for identifying concentrations of values and spatial outliers [
23]. These techniques are used in relevant researches from 1980s for studies on finding synthetic, local, and geostatistical indicators [
23].
Sánchez-Martín et al. [
23], for example, use the hotspot analysis (based on Gi* de Getis-Ord) and the cluster and outlier analysis (based on Anselin local Moran’s I) to analyze the accommodation distribution patterns in ExtremAdura (Spain). Las Casas et Al. [
24] use geostatistical techniques for the analysis of the migration flows in Italy. Curto and Fregonara [
25] start from data organized in GIS to monitor and analyse real estate market in a social perspective, applying the methodology in the city of Turin (Italy).
In some cases, GIS tool is integrated with other tools in order to achieve more complete and detailed results. For example, it is integrated with 3D data visualization to produce a visual representation of data and information and give more depth of the field [
19]. Furthermore, the integration between GIS and MCDA is a useful tool for supporting urban planners and, in general, decision makers, both in ex-ante and ex-post evaluation and monitoring [
26].
The Multi-Criteria Decision Analysis (MCDA) methods are “useful tool developed to support the decision makers in their unique and personal decision process. MCDA methods provide stepping-stones and techniques for finding a compromise solution. They have the distinction of placing the decision maker at the centre of the process. They are not automatable methods that lead to the same solution for every decision maker, but they incorporate subjective information” ([
24], p. 2).
The MCDA allows assessing alternative projects on the basis of several criteria to be considered simultaneously in a complex situation, including different actors/stakeholders and points of view [
27,
28]. They are used in different fields from management, to social science, to economics, etc. [
27,
29,
30]. It is widely used, as it can contribute to solve any problem in which a significant decision needs to be made [
27].
There are different multicriteria methods that have been developed [
27,
31] (about 100 to date, [
29]) and tested in different sectors to support decision-making processes [
32].
Guarini et al. [
29], in their study about the selection of multi-criteria decision analysis methods for real estate/land management processes, identify (based on the analyses of Guitoni et al. [
33] and Ishizaka and Nemery [
27]) the following methods as the most frequent used: ELimination Et Choix Traduisant la REalitè (ELECTRE) [
34]; Multi-attribute utility theory (MAUT) [
35]; Analytic Network Process (ANP) [
36]; Measuring Attractiveness by a Categorical Based Evaluation (MACBETH) [
37]; Analytic Hierarchy Process (AHP) [
38]; Technique for Order of Preference by Similarity to Ideal Solution (TOPSIS) [
39]; Preference Ranking Organization Method for Enrichment Evaluations (PROMETHEE) [
40]. These MCDA methods are used in a wide range of decision making processes, and in the last decade there are several experiences highlighting the increased interest in the use of MCDA using structured and comprehensive databases in urban planning and real estate sector and land management [
29]. Bottero et al. [
41], for example, uses the PROMETHEE method to support decisions in urban planning and regeneration processes, comparing different scenarios of the City of Collegno (Italy).
The use of MCDA-GIS integration has increased significantly over the last twenty years, demonstrating its usefulness in several fields (e.g., urban planning, ecological areas) [
42,
43,
44].
The MCDA allow understanding of a complex issue and, at the same time, the GIS tool makes the results clearer and easier to read for policy makers and less expert people, allowing also the elaboration of statistical analyses. There are different levels of integration of these two tools: Indirect, built-in, and complete integration [
26]. The complete integration is the only one allowing the use of the same database, interface, and access simultaneously [
26,
45]. As Boggia et al. highlight [
26], applications in strategic sustainable planning are still rare [
46,
47,
48]. Malcezewski underlines, in his literature reviews about MCDA and GIS from 1991 to 2006 [
45,
49], this lack of MCDA included in GIS [
50]. He underlines that only a few papers describe a complete integration between these two tools, above all due to the scarce amount of MCDA software implemented in GIS [
50], thus considering the two software in independent phases of the research. Furthermore, other reasons are both related to the unfamiliarity (often) of GIS experts with decision-making processes and to the lack of open source methods available [
50].
Boggia et al. [
26], for example, use MCDA-GIS integration as an approach for sustainability assessment that represents a complex issue, including different dimensions (economic, social, environmental dimensions). Sobrie and Pirlot [
50] integrate GIS and ELECTRE TRI for analysing the problem to determine policies to prevent further damages in a degraded landscape in Burkina Faso (Africa). Omidipoor et al. [
18] use a GIS-based decision support system for facilitating participatory urban renewal process. Massei [
51] integrate MCDA in GIS framework for environmental evaluations. De Toro and Iodice [
52] carry out a multi-criteria evaluation using the geoTOPSIS algorithm for applying the concept of ecosystem health to the Metropolitan Area of Naples, classifying the territory according to its urban health.
GIS tool and the MCDA-GIS integration are here used to understand the real estate dynamics of the city of Naples, with a particular focus on the neighbourhood in which urban projects have been planned or implemented in the last ten years. There are many works dealing with this issue, demonstrating, through case studies, the correlation between these two phenomena [
13,
14,
15,
53]. This topic has been recently addressed during the conference “Urban regeneration and real estate market” [
16], highlighting that urban regeneration projects can affect the real estate market from different points of view (legal, economic, urban). Considering that many factors affect the real estate sector (i.e., location attributes, services availability, accessibility, urban quality), its evaluation is important for addressing urban strategies [
12,
54].
3. The Case Study: The City of Naples, Italy
This work focuses on the real estate dynamics in the city of Naples, a municipality of almost one million inhabitants, part of the metropolitan port city of Naples, in the South of Italy (
Figure 1). The city calls the homonymous gulf that extends from the Sorrento peninsula to the volcanic area of the Phlegraean fields. It is rich in valuable cultural and nature heritage, and its historic centre was on the UNESCO World Heritage List since 1995.
The economic and social framework of Italy, in which the case study is located, is characterized by persistent uncertainties about economic development and structural problems affecting the country’s growth potential and medium and long-term sustainability conditions. In an international scenario of generalized slowdown in 2018, the Italian economy decelerated sharply compared to 2017, experiencing a nearly stagnant trend during the year, with signs of decline in the second half of the year. The slight recovery recorded in the first part of 2019 is associated with a further expansion of the production and employment base [
55].
Third largest municipality in Italy by population, Naples, is, with Florence, Rome, Venice, and Milan, one of the top Italian “destinations”. With 3,700,000 visitors in 2018, the city has come out from the severe tourist depression of past decades (due for example to the image damage caused by the media, the Irpinia earthquake of 1980, and the waste crisis) [
56].
Unlike other Italian cities such as Rome and Milan (to which it is comparable in terms of population), the City of Naples has a lower average income, of about 20,000 euros [
57]. Moreover, in Naples, employment rate is lower than in Rome, and the differences between districts are much more marked. With reference to the real estate market, Naples is the city in southern Italy that is growing most in terms of real estate sales. The Neapolitan market was the only one, in fact, to recover following the decline in real estate transactions began with the economic crisis, which in the South of Italy led to halving sales. At the end of 2018, the real estate market of Naples returned almost to the values of the pre-crisis period, with a growth of 10.5% of transactions compared to the previous year.
As the study by Scenari Immobiliari (Independent Institute of Studies and Research) points out, in the next decade the city will have to implement the initiatives started more than ten years ago and which have been blocked in progress due to lack of funds or other types of difficulties [
58]. The city will have to increase its supply of social housing, which are at the moment inadequate and far from the standards of other European cities, so as to face the phenomenon of illegality and respond to the hardships of the population.
As underlined in the Metropolitan Strategic Plan of the Metropolitan City of Naples [
59], in order to compete with other cities, Naples will have to carry out strategic actions related to different issues such as encouraging sustainable mobility, improving accessibility, and valorising cultural and natural heritage. Furthermore, a widespread energy redevelopment of its building stock, which is largely obsolete, is required. In the coming years, in fact, as highlighted by Scenari Immobiliari, the real estate market will tend to “downgrade” the value of buildings without sustainability requirements and to “reward” buildings of new generation, or low energy impact [
58]. Moreover, the success of the short tourist lease (Naples is the first city in Southern Italy and the fourth in Italy) shows how demand has changed, and that there is space for new economies.
4. Material and Methods
The methodological process of this work is divided in four main steps (
Figure 2):
- -
First step: During this phase, data about market prices of housing and commercial properties have been acquired. Furthermore, the cartography (based on census sections) by Italian National Institute of Statistics (ISTAT) [
60] has been acquired to georefer data, and a database has been elaborated.
- -
Second step: This phase refers to the georeferencing of all data by means of a Geographical Information System (GIS).
- -
Third step: During this phase, different geostatistical analyses have been developed (showed and developed in §§ 4.1; 4.2; 4.3). Furthermore, a Multi-Criteria Decision Analysis (MCDA) method has been carried out by means a plugin of QGIS.
- -
Fourth step: Analysis and discussion of results.
The change in market prices of housing and commercial properties has been analysed in relation to the 2009–2018 period (after the 2008 crisis). In particular, four years have been selected so that the variations are more evident: 2009, 2012, 2015, 2018. A time interval of 3 years has been chosen, otherwise it would have been difficult to appreciate the variations which, considering also the intermediate years, would have been less significant, and considering also the amount of data to be considered.
The data have been deduced from the Official List of the Naples Real Estate Exchange [
61,
62,
63,
64]. The Naples Real Estate Exchange, a company established by the Naples Chamber of Commerce in 2005, supports initiatives in favour of transparency in real estate transactions and protection of the parties involved. It is also a transparent and dynamic system to support professional operators. The Naples Real Estate Exchange is established in order to regulate, enhance, and make transparent the local real estate market, through the implementation of specific initiatives that facilitate and make faster and guaranteed the meeting between supply and demand in both the purchase and sale of real estate. It is also set up to carry out research activities aimed at observing the real estate market, developing real estate investment initiatives and urban regeneration; it also carries out training, verification, and control activities in the sector. Every six months, it draws up the Official Price List, a tool for operators in the sector that shows the prices per square metre of properties, relating to municipalities, neighbourhoods, areas of the city, and the province of Naples. It contains actual buying and selling real estate data provided by sales agents. It is available online and in printed edition starting from the first half of 2007. The data of the Official Price List are not georeferenced. So, the first step after data retrieval was their georeferencing. To this end, the cartographic base divided into census sections by the Italian National Institute of Statistics (ISTAT) was used. According to ISTAT, Naples is divided in 5.216 census sections.
The real estate data available have been classified by the Naples Real Estate Exchange (2009–2018) in Unitary Market Values (in Italian: VMU). They are expressed per square meter (€/sqm) and, concerning housing properties, they refer to “standard properties”: Flat for residential use, moderately renovated, located on an intermediate floor, with a floor area of 100 square meters, not furnished. With regard to commercial properties, shops on the ground floor and with an area of approximately 50 square meters are considered. These values by the Naples Real Estate Exchange have been deduced from the transaction prices that actually occurred, and are the average of the minimum and maximum values. Unbalanced or atypical situations have been excluded from the pricing. In fact, those values referring to properties of particular value or degradation (or that in any case have non-ordinary characteristics) have not been considered for developing the database. In addition, the prices considered refer to “free properties”, that is to be understood as having no legal constraints. Furthermore, they are related to individual housing units and not to real estate complexes. The processed data are referred to the Unitary Market Values (VMU) of both residential and commercial properties for each census section (5.216 census sections) in reference to the four years considered (for a total of 41.728 processed data). The 5.216 census sections include the following 10 districts:
- –
district no. 1, including San Ferdinando, Chiaia, Posillipo neighbourhoods (432 census sections);
- –
district no. 2, including Porto, Pendino, Montecalvario, San Giuseppe, Avvocata, Mercato neighbourhoods (1.025 census sections);
- –
district no. 3, including Stella and San Carlo all’Arena neighbourhoods (454 census sections);
- –
district no. 4, including San Lorenzo, Vicaria, Poggiorele neighbourhoods (632 census sections);
- –
district no. 5, including Vomero and Arenella neighbourhoods (416 census sections);
- –
district no. 6, including San Giovanni a Teduccio, Barra, Ponticelli neighbourhoods (654 census sections);
- –
district no. 7, including Miano, Secondigliano, San Pietro a Patierno neighbourhoods (428 census sections);
- –
district no. 8, including Piscinola, Chiaiano, Scampia neighbourhoods (375 census sections);
- –
district no. 9, including Soccavo and Pianura neighbourhoods (357 census sections);
- –
district no. 10, including Fuorigrotta and Bagnoli neighbourhoods (443census sections).
The database of house and commercial properties’ prices has been then georeferenced by means the GIS tool, producing a total of 8 maps (4 about house prices and 4 about commercial properties’ prices) referring to 4 years (2009, 2012, 2015, 2018), showing the price trend during the period considered. So, a merge between the ISTAT cartography and the data coming from the Naples Real Estate Exchange has been carried out. The georeferencing of data is essentially a way to link the various phenomena to the territory (in our case, with reference to the change in market prices).
After mapping these price trends, different analyses and elaborations have been conducted by means of the GIS tool [
65,
66].
4.1. Cluster and Outlier Analysis (COA)
The first analysis elaborated is the Cluster and Outlier Analysis (COA) in the ArcGIS framework for identifying concentrations of values and spatial outliers. In fact, it has been conducted in order to identify similarities of behavior between data spatially close to each other. This uses the Anselin Local Moran Statistics I to determine the relationships among data [
67]. This is calculated by the “Local Moran Index” [
22] that highlights areas where high values or low values are grouped in “clusters”, and areas in which there are values that are very different from those surrounding (“outlier”).
The Moran Index is defined as the measure of the spatial autocorrelation which, in turn, can be defined as a territorial cluster of similar parameter values [
68]. Its values range from −1 to 1. A positive value of the Moran Index indicates that the area considered (in our case the census sections) has neighboring areas with similar values (either high or low), and therefore there are clusters. If the value of the index is instead negative, it means that there is a spatial proximity of dissimilar values (spatial heterogeneity), and in this case they are “outlier”, that is, an anomalous value that is distant from the other values taken into consideration. The zero value instead indicates perfect spatial randomness [
69,
70].
More generally, there is positive spatial autocorrelation if the intensity of a phenomenon in an area is similar to the intensity of the phenomenon in contiguous areas, while there is a negative autocorrelation in the case in which two contiguous zones have different intensities. By means of ArcGIS, this statistical analysis has been geoprocessed, returning maps as the result.
This analysis is defined according to the following Formula (1) about the Local Moran’s I statitistc of spatial association [
71]:
where:
- –
xi is an attribute for feature i;
- –
is the mean of the corresponding attribute;
- –
wi,j is the spatial weight between feature
i and
j; and
with
n equating to the number of feature.
4.2. Hot Spot Analysis (HSA)
After the aforementioned analysis, another elaboration has been carried out. The Hot Spot Analysis (HSA) has been conducted (by means of ArcGIS software) using the Getis–Ord Gi* statistic [
21] for determining if spatial clusters are referring to high values (hot spots) or low values (cold spots). A hotspot is “an area that has higher concentration of events compared to the expected number given a random distribution of events” [
72].
The HSA is a spatial analysis and mapping technique whose results are a z-score and a p-value that indicate where high or low value clusters are spatially. It can be positive (if values are higher than the global average), negative (if values are lower than the global average), or equal to zero (if values are the same as the global values). Additionally, the results of this analysis have been reported in the maps produced by ArcGIS software.
The Getis-Ord local statistic is given by the following Formula (3) [
73]:
where:
- –
xi is the attribute value for feature j;
- –
wi,j is the spatial weight between feature I and j;
- –
n is equal to the total number of features; and (4,5)
After that, an analysis of the percentage variation of the house and commercial property prices (euro/sqm) has been investigated in reference to the years 2009–2018. The results of this elaboration have been two maps (house and commercial property maps) showing percentage variation considering nine classes.
4.3. The Integration of MCDA and GIS: the Implementation of the TOPSIS Method
The last analysis was to understand which census sections, in the period considered, have had the best/worst performance. To this end, a Multi-Criteria Decision Analysis (MCDA) method has been carried out, that is the Technique for Order of Preference by Similarity to Ideal Solution (TOPSIS) method [
39,
74,
75,
76]. In particular, the “geoTOPSIS” algorithm (whose functioning is based on the TOPSIS method) included in an open source QGIS plugin, named “Vector MCDA”, which has been used [
77]. The plugin uses different MCDA algorithms to implement multi-criteria analysis in a GIS framework. This TOPSIS method is based on the ideal point approach, that is based on the idea that the preferable choice has to have the shortest geometric distance (in Euclidean space) from the ideal point (positive solution) and the longest geometric distance from the anti-ideal point (negative solution). The method returns a hierarchy of preferences with respect to close/distance to the ideal point.
The GeoTOPSIS returns a map (in QGIS that we have transformed into an ArcGIS map for a clearer reading of the results) that shows the geographical arrangement of the performances of the census sections, that is, which census sections have maintained higher values (best performance) or lower values (worst performance) during the whole time interval considered. The criteria of this case study are the market values of house and commercial properties related to the four years considered. No different weights were assigned to the criteria of this case study. This elaboration allows understanding of how each census section is placed in relation to the “ideal value” (the maximum value) and the “anti-ideal value” (the minimum value). In this case, the minimum value is zero-value because it is the lowest one that can be used as market value.
5. Results
Working with georeferenced data in an environment that provides rapid spatial visualizations allows for almost immediately obtaining very interesting representations.
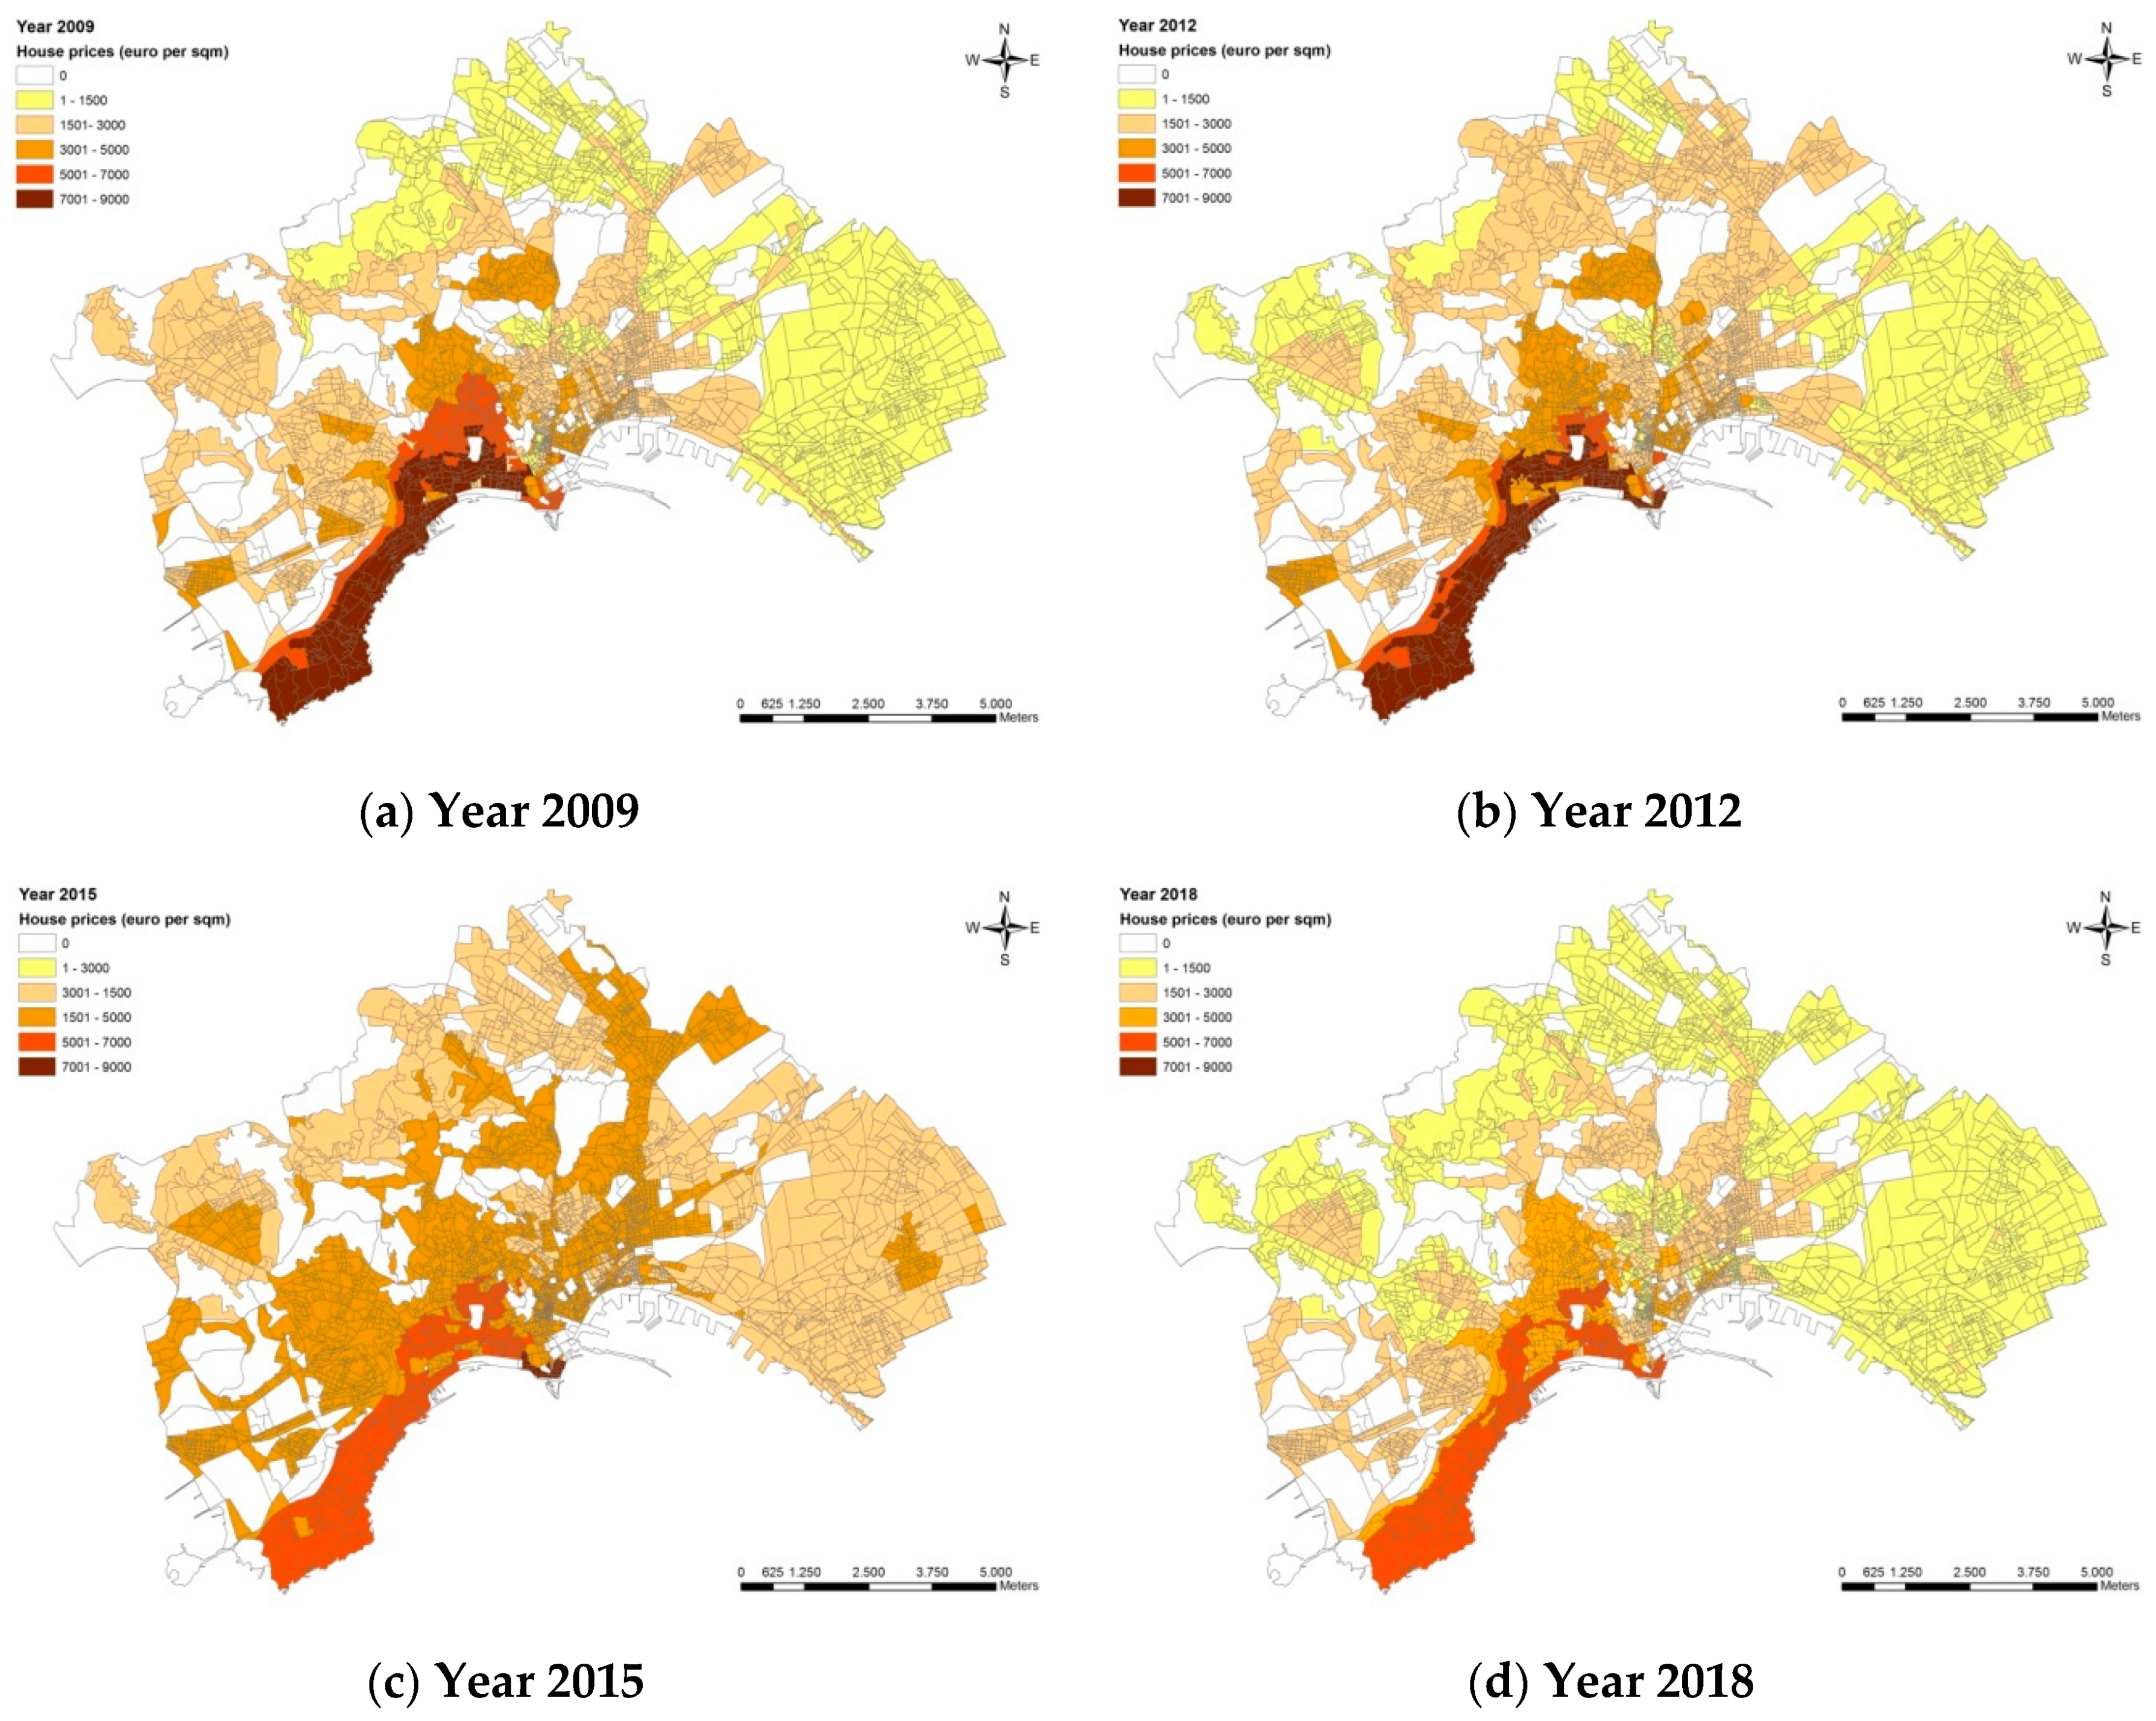
The maps resulting from the georeferencing of data referred to market values of housing and commercial properties (deduced from the Official List of the Naples Real Estate Exchange) show how the market values are changed in the 2009–2018 period (
Figure 3 and
Figure 4). The values have been organized into six classes: 0, 1–1500 €/sqm, 1501–3000 €/sqm, 3001–5000 €/sqm, 5001–7000 €/sqm, 7001–9000 €/sqm. The 0 value refers to the public spaces and assets for which there is no market. The six classes come from the Jenks Natural Breaks Classification System [
78] and a subsequent manual adjustment to obtain more defined classes. The map with the highest values was the starting point for elaborating the classes in order to always get the same range of values for all the four years considered. A similar procedure was adopted to determine the six classes of commercial property prices: 0, 1–2500 €/sqm, 2501–5000 €/sqm, 5001–8000 €/sqm, 8001–12,000 €/sqm, 12,001–17,000 €/sqm.
As the resulting maps show (
Figure 3 and
Figure 4), during the analysed period, a decrease in the house prices actually occurred, consistent with what is highlighted in paragraph 1. For example, the dark brown colour (corresponding to the class of values 7001–9000 €/sqm) that characterized the area of Posillipo and the historic centre of the city has “become lighter” (5001–7000 €/sqm) over the four years, thus highlighting a decrease in property prices. The area of Via Partenope (pedestrian seafront) is excluded from this decreasing trend, registering, in 2015, prices in the highest class (7001–9000 €/sqm) (
Figure 3).
In some neighbourhoods, a somewhat different phenomenon is instead linked to the commercial properties market, where the dynamics show that they are not strictly related to the residential ones (
Figure 4). For example, analysing the area of the Vomero neighbourhood, it is possible to note that the prices of commercial properties have maintained high values. The same is valid again for the area of Via Partenope. It can be pointed out that prices have remained high over the years in pedestrian areas.
The first analysis, the Cluster and Outlier Analysis (COA), allows us to understand if the variation of real estate prices (decreased in the recent years) refers to the entire city or not, that is, understanding if it is a phenomenon distributed in an uneven manner or if there are some clusterizations. To this end, the function used by the ArcGIS software has returned maps that allow a clear reading of the results. Indeed, there are areas that are clustered, but it is significant how the shape and size of these areas have changed over time (
Figure 5 and
Figure 6). For example, the Ponticelli-San Giovanni a Teduccio area in the years 2009, 2012, 2015 has been characterized by quite homogeneous values and, instead, in the last year analysed (2018), the phenomenon has been more varied. Most likely, this variation is due to some significant urban redevelopment interventions that have been implemented recently. Suffice it to consider that the Apple Developer Academy has been established in this neighbourhood; this inevitably has defined new mechanisms.
The results also show that in the neighbourhoods of Vomero and Posillipo, and in the historic centre, there is a quite homogeneous clustering. These considerations are also very similar with regard to commercial properties.
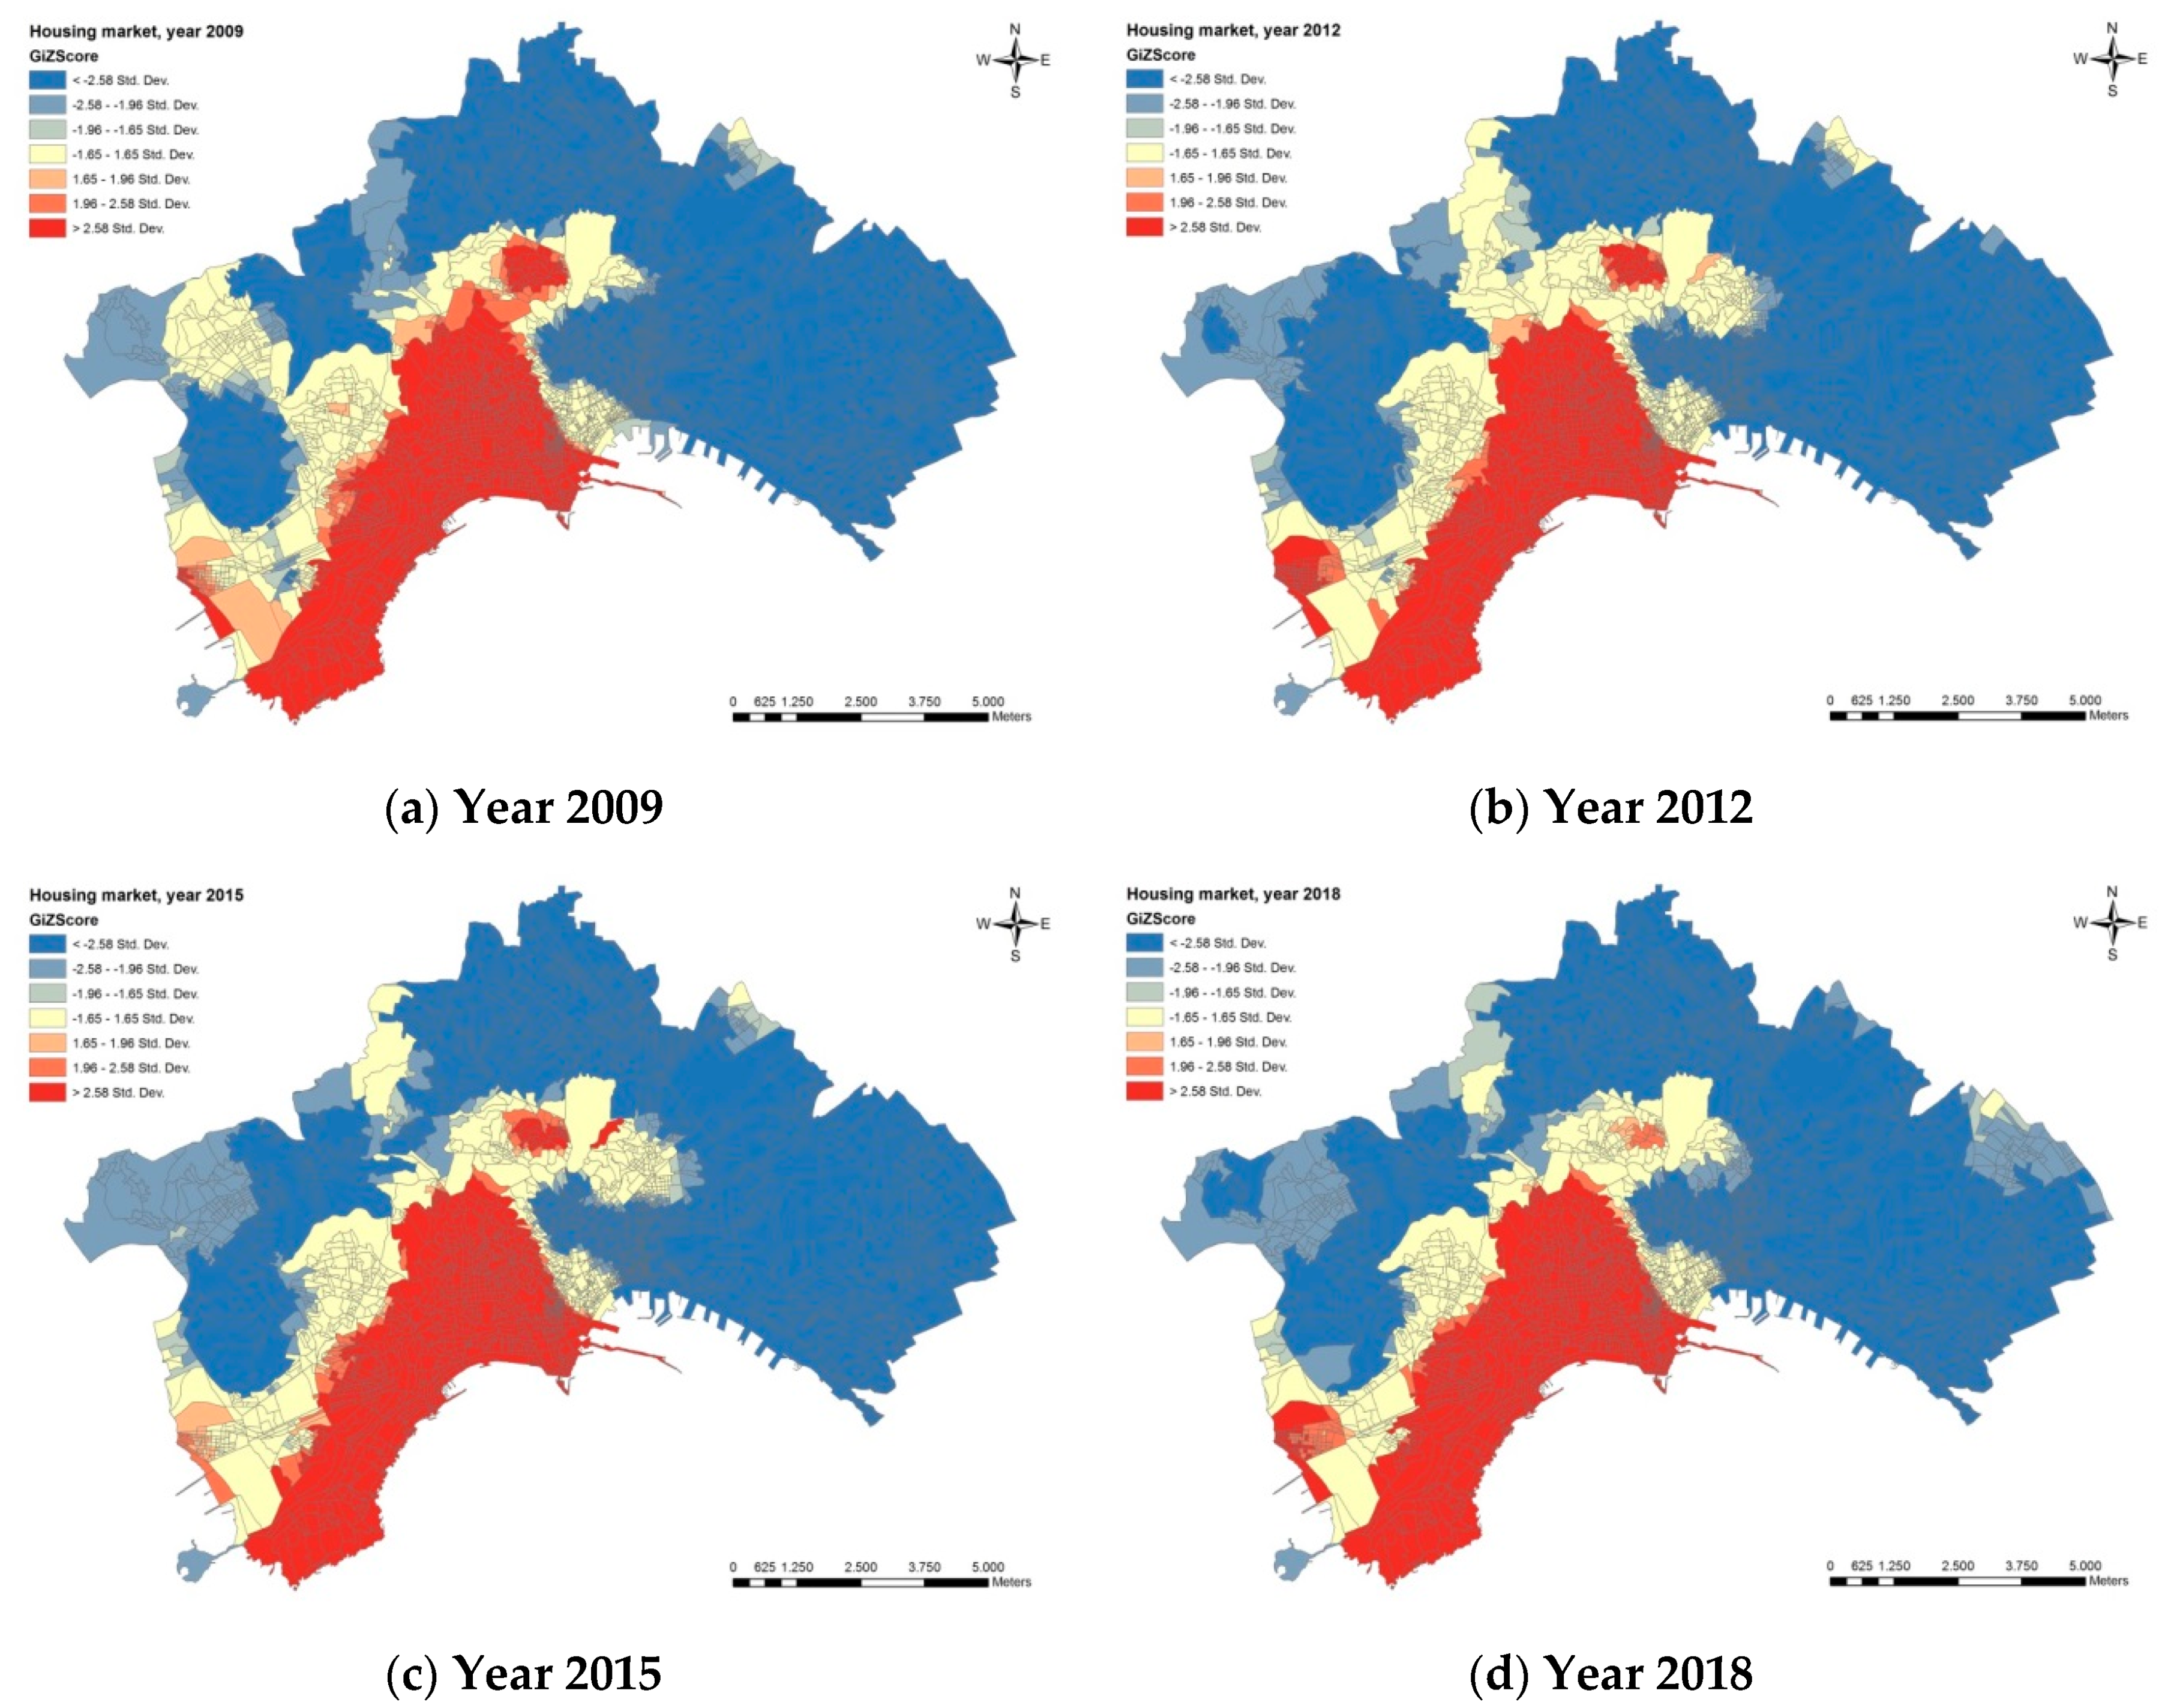
After that, in order to understand if these clusters are referring to high or low values, the second elaboration has been carried out (Hot Spot Analysis using the Getis–Ord Gi* statistic).
The maps (
Figure 7) relating to the residential market resulting from the aforementioned analysis show that (albeit with some minor changes to the shape) the ancient centre, and the Vomero and Posillipo neighbourhoods are clustered for high values. On the other hand, the entire peripheral area is grouped together for low values. As the maps show, there is a “buffer zone” that changes slightly over the years and represents a “hinge” between the two clusters (hot and cold spots).
This dynamic is a bit richer for commercial properties (
Figure 8). Probably, this is due to the fact that the commercial market is more dynamic than the residential one. So, there are more sales data, thus making the dynamics more clearly pointed out than in the residential real estate market (which does not have a strong dynamic like the commercial one).
Then the maps related to the percentage variation of the house and commercial property prices (euro/sqm) have been analysed in reference to the period 2009–2018 (
Figure 9 and
Figure 10). The results show that there are few areas in which the crisis has not been felt (which therefore have no negative or positive variations) and that therefore this crisis in real estate market has affected almost the entire city.
It is possible to note, for example, that the area of San Giovanni a Teduccio (where the Apple Developer Academy has been located) has good results, more in the commercial than in the residential market. Probably this difference is due both to the fact that the students mainly make use of commercial services (and thus there was a trade revival) and the fact that the students do not buy the house to stay, but either they are commuters or they rent the house (and this analysis is only on sales data and not related to rents). The same phenomenon also occurred in the ancient centre. Further analyses would be needed to analyse the different causes (such as the localization of numerous B & B) of the results.
By means of the last analysis (geoTOPSIS functioning based on the TOPSIS method), the overall performance of the census sections has been investigated, that is, which census particles have maintained higher values (best performance) or lower values (worst performance) during the whole time interval considered. The resulting map in QGIS framework has been transferred in ArcGIS framework to be clearly analysable (
Figure 11 and
Figure 12).
Even through this analysis, the residential market shows a high performance in the areas of the historic centre, Vomero, and Posillipo neighbourhoods (high values). All the more peripheral areas, on the other hand, have had a medium-low performance that worsens moving away from the city centre. The white spaces in the maps represent the 0 value and correspond to the public spaces and assets (i.e., airport, railway station). In the resulting map of the commercial property market, it is pointed out that the areas with low performance decrease, probably due to some phenomena already highlighted in the previous analyses (such as the case of Apple).
6. Real Estate Values and Urban Projects in Seven Selected Neighbourhoods
Starting from the previous analyses, seven neighbourhoods of the city of Naples have been selected and examined. The selected neighbourhoods are those in which significant urban regeneration interventions have been implemented (or planned) over the period of time considered, and positive variation percentage has been recorded despite the general negative context of the real estate market in the city (−47% during the decade 2009–2018).
We considered the trend of the values of each area and put them in relation to the trend of the entire city of Naples. The aim is to observe the trend in the values of these neighbourhoods where interventions of urban regeneration have been implemented compared to the general trend of the city.
The historic centre has been analysed in its entirety as the main interventions concern both the port area and the “Mercato” area (
Figure 14).
The neighbourhoods included in this area fall within the limits of the Great Project “Historical Centre of Naples, enhancement of the UNESCO site”. The main objective of this project is to redevelop the area, not only limited to the recovery of the built environment (by monofunctional interventions). While aiming at the conservation of the heritage, it acts on the urban, building, environmental, and social fabric, developing first of all the reorganization and the redesign of the land and infrastructure, and intervening on the space between the buildings, on the roadways, on the public space, linking together the different components in a single system.
The analysed interventions concern the redevelopment of Porta Capuana through the recovery of the Gloria and S. Anna towers and part of the Aragonese walls carried out together with the urban redevelopment of the area, the restyling of the gardens of Castel Capuano, the redevelopment of Piazza Mercato (for which, to date, only the paving has been removed), and the recovery and the re-functionalisation of the Girolamini complex (aimed at increasing the supply of spaces for educational, training, and reception activities).
In addition to these actions, already carried out or in progress, there are also the works relating to the introduction of the Limited Traffic Zone (LTZ) in 2012, which has contributed to limit vehicle traffic and encourage the pedestrianisation of the area, having positive impacts on the properties’ prices of this area. Finally, the construction of the Università and Garibaldi metro stations has given greater usability to the 4 districts, encouraging an increase in value of the buildings. Analysing the trend of values (
Figure 3 and
Figure 4), it emerges that, outside a peak in 2012, the trend of this area follows the entire city.
The San Carlo all’Arena neighbourhood is one of the neighbourhoods of Naples that has suffered the most from the fall in prices in the post-crisis decade, with a loss of about 800 €/sqm (about 25% compared to the average value in 2009) (
Figure 3 and
Figure 4). Analysing the trend of this area, it emerges that the average value of the neighbourhood has never been above the average of the city of Naples in the last ten years. Nevertheless, the San Carlo all’Arena neighbourhood has some positive sections. Probably, they are related to the recent restyling of Piazza Carlo III, the re-opening in 2016 of Piazza Poderico, and the redevelopment of several streets within the neighbourhood through repaving and improvement of lighting (
Figure 15). In addition, in the Ponti Rossi area, about 200 new homes were built in 2012 within the former industrial complex of “Visconti ceramics”. These redevelopment works can have affected the properties’ prices in the area.
The trend in real estate values in the Vomero neighbourhood (
Figure 16), on the other hand, has always been significantly higher than that of the city, despite a decline in 2012 (
Figure 3 and
Figure 4).
In addition to the existence of five rail connections (two metro lines and three funicular lines), the Villa Floridiana (important “green lung” of the neighbourhood) and the Certosa of San Martino, is added the partial pedestrianisation of Via Luca Giordano in 2010 that connects with the already pedestrian Via Scarlatti, characterizing the neighbourhood by two main central arteries dedicated to trade, socialization, and leisure. Even the ancient “borgo Antignano” has been placed at the centre of a functional reorganization of the neighbourhood: A new lighting system has been designed and has been pedestrianised, allowing an area (that has always been used only as a neighbourhood market) to enjoy a renewed mix of functions that has contributed to the increase in real estate values.
Traffic congestion and lack of parking spaces are among the main problems affecting the Vomero neighbourhood. The Municipality has partly tried to solve these problems by the implementation of two projects in Via Rossini and Via Andrea da Salerno (near Piazza Quattro Giornate), providing about 150 new underground car parks with the consequent reorganization of the areas close to the interventions. Finally, in the re-organization of public spaces of the neighbourhood there is also Piazza Muzzi, a square located in the adjacent Arenella neighbourhood, where the building of an underground parking lot has given new life to the square. So, in this neighbourhood characterized by the presence of positive census sections, many interventions of urban redevelopment have been implemented in the period of reference.
Even the San Ferdinando neighbourhood (
Figure 17), rich in cultural and recreational attractions, has recorded real estate values higher than the average of the city over the years, resisting the crisis that has hit the city in the period considered (
Figure 3 and
Figure 4). This neighbourhood, despite having recorded a 20% drop in real estate values over the decade, has some positive sections. The part of the neighbourhood showing the most significant increase is “borgo” Santa Lucia in which the works for the redevelopment of Mount Echia (thanks to the funds of the “Pact for Naples”, an investment programme aimed at regenerating the territory and strengthening urban transport systems over a period of no more than seven years) are underway, and in which the next Chiaia station of the metro line 6 is expected to be opened. Positive census sections are near the pedestrianisation of Via Toledo and Via Verdi, Municipio metro station (building in 2015), with the consequent restyling of Piazza Municipio.
The real estate trend in the Chiaiano neighbourhood (
Figure 18) has not been affected by excessive falls but, however, in the period considered, it has never been above or at least in line with the city average values (
Figure 3 and
Figure 4). Despite of the presence of considerable positive census sections, the projects taking place in the last ten years are not such as, in our opinion, to justify such increases from a strictly urban point of view. Over the years, about 30 new houses (for the re-buildings after the earthquake) have been constructed in this neighbourhood. Moreover, it is at the centre of the “Parco delle Colline” project (by which a new opening was made in via dei Guantai ad Orsolona to support the Camaldoli Urban Park), including the “Selva di Chaiano” which, despite its “rethinking” as a “green lung”, is still in disastrous condition. In addition, since 2014, the project “A bridge over the walls” (“Un ponte oltre i muri”) has started, and an open-air art gallery has been realized. It has been planned through the Murales technique on the approximately 7000 sqm of the concrete wall of the Chiaiano metro station.
The Poggioreale neighbourhood has critical values that have suffered a drop of about 20% compared to 2009, with a contraction in values close to 600 € / sqm (
Figure 3 and
Figure 4).
Despite few positive census sections, the Poggioreale neighbourhood shows critical situations (
Figure 19). It has been significantly penalized by bureaucratic slowdowns because the Urban Regeneration Plan (URP) has been blocked. This Plan dates back to a programme agreement signed in 1994 among the Municipality, the Region, and the Ministry of Public Works. It provided, within the S. Alfonso neighbourhood, for the construction of equipment (such as a business incubator and a nursery school), the redevelopment and re-organization of the road system, and the recovery of the building of the former “Milk Plant”.
To date, the project has not been started (the first tender was not successful because of irregularities in the conclusion of the contract that led to a very long dispute), and today, many years later, the economic conditions that made that design possible at the time have evidently changed.
Therefore, the current Urban Regeneration Plan is the subject of a series of redistribution of equipment. They maintain the same standards, but they are distributed over a different size. The only equipment to have been sacrificed is the large underground car park; however, parking areas will be ensured at ground level. At the moment, the Plan is being remodelled by the Region, and only after this phase it will be possible to proceed to a new tender. The implementation of the projects provided in Urban Regeneration Plan could contribute to a rise in market prices in this neighbourhood, which, to date, are still falling.
Finally, the San Giovanni a Teduccio neighbourhood (
Figure 20) shows, from a residential point of view, a negative trend below the average of Naples (
Figure 3 and
Figure 4). Instead, from a commercial point of view, it shows signs of recovery since the establishment of Apple Developer Academy and the new pole of the University of Naples Federico II. Probably, since these changes occurred in 2016, they have not yet had repercussions on the residential real estate market, which, compared to the commercial one, is affected more slowly by the effects of urban changes.
7. Conclusions
As showed in the previous paragraphs, the implemented projects have been quite one-off and heterogeneous (there have been no comprehensive urban strategies) in the period analysed. In the neighbourhoods where urban regeneration projects have been implemented (the seven selected neighbourhoods), even if they are punctual projects, real estate values have remained at least stable (if not increased). The best performances have been recorded where regeneration projects have included a mix of actions, from redevelopment, to accessibility, to the enhancement of infrastructures, to the valorization of cultural heritage.
The integrated evaluation approach proposed in this study aims to provide support for a better understanding and interpretation of urban dynamics, and to orient and activate, consequently, the appropriate planning policies, implementing actions, and projects that are more appropriate to the “vocation” of each area. Sometimes urban regeneration projects and the consequent increase in real estate values can have negative effects, such as the phenomenon of gentrification: Prices rise too much and therefore sales transactions (or rents) decrease, and a “touch and go” tourism develops [
79]. In order to prevent that, urban development processes increase economic attractiveness, but cause negative impacts on other dimensions (for example, by changing the social composition of neighbourhoods), and social and cultural components must be taken into account in regeneration strategies and policies (i.e., through bottom-up approaches). Revitalizing a poor or degraded neighbourhood economically, without also considering social impacts (and therefore the phenomenon of gentrification, for example), only “moves” the problem of poverty to another area of the city. To this end, the MCDA methods are a useful tool for evaluating alternative projects considering different criteria and including various actors/stakeholders and points of view.
In this study, the integration of a Multi-Criteria Decision Analysis (MCDA) and Geographical Information System (GIS) allowed us to map and analyse the territory, linking a specific issue (the real estate dynamics) to the territory itself, and to analyse it according to specific criteria. In particular, here the use of geoTOPSIS allows classifying and discretizing urban areas in order to understand which ones have maintained the best or worst performance during the period considered. This can support decision makers in a clearer and more detailed reading of the territory in order to identify the areas in which to plan new interventions.
Furthermore, the analysis at a high level of definition, such as that of census sections, can be useful for future steps of the research, representing a base for elaborating analysis linking the real estate dynamics with other information collected for the same sections for the census. This integrated approach can support the governance of cities and the development of strategies for enhancing the comprehensive territorial productivity.

