Article

A Sensitivity and Robustness Analysis of GPR and ANN for High-Performance Concrete Compressive Strength Prediction Using a Monte Carlo Simulation

1
University of Transport Technology, Hanoi 100000, Vietnam
2
The Ohio State University, Columbus, OH 43210, USA
3
Faculty of Engineering, Vietnam National University of Agriculture, Gia Lam, Hanoi 100000, Vietnam
4
Institute of Research and Development, Duy Tan University, Da Nang 550000, Vietnam
*
Authors to whom correspondence should be addressed.
Sustainability 2020, 12(3), 830; https://doi.org/10.3390/su12030830
Submission received: 6 December 2019 / Revised: 31 December 2019 / Accepted: 17 January 2020 / Published: 22 January 2020

Abstract

:
This study aims to analyze the sensitivity and robustness of two Artificial Intelligence (AI) techniques, namely Gaussian Process Regression (GPR) with five different kernels (Matern32, Matern52, Exponential, Squared Exponential, and Rational Quadratic) and an Artificial Neural Network (ANN) using a Monte Carlo simulation for prediction of High-Performance Concrete (HPC) compressive strength. To this purpose, 1030 samples were collected, including eight input parameters (contents of cement, blast furnace slag, fly ash, water, superplasticizer, coarse aggregates, fine aggregates, and concrete age) and an output parameter (the compressive strength) to generate the training and testing datasets. The proposed AI models were validated using several standard criteria, namely coefficient of determination (R2), Root Mean Squared Error (RMSE), and Mean Absolute Error (MAE). To analyze the sensitivity and robustness of the models, Monte Carlo simulations were performed with 500 runs. The results showed that the GPR using the Matern32 kernel function outperforms others. In addition, the sensitivity analysis showed that the content of cement and the testing age of the HPC were the most sensitive and important factors for the prediction of HPC compressive strength. In short, this study might help in selecting suitable AI models and appropriate input parameters for accurate and quick estimation of the HPC compressive strength.

1. Introduction

High-Performance Concrete (HPC) is known as the third generation of concrete material [1] and its definition was adopted in the early 1970s. Compared with the second generation of concrete, such as High-Strength Concrete (HSC), HPC exhibits not only high compression strength, but also other important characteristics—for instance, high flow ability, high elastic modulus, high flexural strength, low permeability, high abrasion resistance, and high durability [1]. The improvement of these mechanical properties has made HPC widely used in long-term construction applications, especially in tall buildings, roadway construction, long-span bridges, and tunnels [2]. The key technology in the manufacturing process of HPC is to make it as dense as possible [2]. Consequently, the main rules that differentiate the manufacture of HPC compared with normal concretes are: (i) The use of smaller aggregate size, (ii) the addition of supplementary cementitious materials such as silica-fume, and (iii) the most important one is the application of superplasticizer to reduce the water/binder ratio [2]. In order to fabricate HPC, the constituent materials as well as their proportions need to be carefully selected and controlled. A number of investigations in the literature have proposed mix design methods for HPC [3,4,5]. The main objective of these works is to obtain the combination of constituent materials and the corresponding proportions to produce HPC with improved mechanical properties.
The compressive strength of HPC has particularly attracted researchers as an important mechanical property that reflects the quality of this material. The current practice is based primarily on carrying out laboratory experiments to obtain the desired compressive strength as a function of all of the constituent materials. This experimental procedure is very time consuming, costly, and always requires some equipment that might not be at disposal. As a consequence, researchers have been trying to propose some formulations which indicate the practical correlation between HPC compressive strength and several related mechanical properties or parameters. Zhou et al. [6] investigated the effect of aggregates on the HPC compressive strength and deduced that it could be predicted by several formulations, except for the cases of aggregates with very low and very high moduli. Duval and Kadri [7] investigated the effect of silica fume on HPC compressive strength and presented a prediction model a with correlation coefficient equal to 0.991. Chan et al. [8] proposed a model to relate the strength and porosity of HPC after exposure to high temperatures. Rashid et al. [9] studied the correlation of several mechanical properties, including modulus of elasticity, tensile strength, and the influence of the specimen size on the compressive strength. Ramezanianpour et al. [10] presented formulas relating the concrete compressive strength to water penetration, concrete resistivity, and rapid chloride penetration.
In general, these papers provide empirical formulas based on experimental results for quick but approximate determination of the HPC compressive strength. However, a drawback of this approach is that it can be achieved only with a limited number of parameters for constructing the relationship functions. Thus, the empirical equation approach becomes impractical and crude when the number of input parameters is large.
Since the first journal article on the civil engineering applications of neural networks (NNs) three decades ago by Adeli and Yesh [11], the penetration of neurocomputing into civil engineering has steadily increased. A review of civil engineering applications of neural networks up to 2000 is presented by Adeli [12] and from then up to 2016 by Amezquita-Sanchez et al. [13]. In recent years, a number of authors have used NNs and other artificial intelligence (AI) approaches to predict the mechanical properties of HPC. Erdal et al. [14] used Gradient-Boosted Artificial Neural Networks (GBANNs) and Bagged Artificial Neural Networks (BANNs) to predict the compressive strength of HPC. Chou and Pham [15] compared NNs, Support Vector Machines (SVMs), Chi-squared Automatic Interaction Detector (CAID), Linear Regression (LR), and Classification and Regression Trees (CART) for predicting the compressive strength of HPC. The ensemble models used in this research have shown good performance compared to previous studies; the value of coefficient determination (R2) [14] is equal to or higher than 93.3% for all models, and the error rates are significantly improved from 4.2% to 69.7%. In another attempts, Cheng et al. [16] used a Genetic Weighted Pyramid Operation Tree (GWPOT), whereas Erdal [17] developed two hybrid ensemble decision trees for the prediction of HPC compressive strength. In general, the aforementioned studies affirmed the effectiveness of the AI models for predicting the compressive strength of HPC more accurately and quickly compared with traditional approaches [18,19,20,21,22,23,24].
In the past three years, deep NN machine learning (ML) algorithms have been used in a variety of complicated civil engineering problems such as pavement crack detection [25,26,27], structural damage detection [28,29,30,31,32,33,34,35,36,37], structural image data augmentation [38], health monitoring of structures [39,40], shield tuning lining effects [41], real-time traffic network management [42], reliability analysis of transportation networks [43], flocculation-dewatering prediction of fine mineral tailings [44], measurement of traffic air pollution [45], post-disaster inspection of reinforced concrete bridges using recorded images [46], and capturing and understanding construction workers’ activities in surveillance videos [47].
Rafiei et al. [48] present a novel deep restricted Boltzmann machine for estimating concrete properties based on mixture proportions and compared its effectiveness with backpropagation (BP) NN and SVM. They report a maximum accuracy of 98% for the new model using the concrete test data from the ML repository of UC Irvine. Nguyen et al. [49] use a deep NN model for the prediction of foamed concrete strength. Rafiei et al. [50] presented an innovative approach for the concrete mix design problem through fusion of an optimization algorithm, the patented neural dynamics optimization model of Adeli and Park [51,52], and an ML classification algorithm used as a virtual lab to predict whether desired constraints are satisfied in each iteration or not. The authors assert: “The outcome of this research is an entirely new paradigm and methodology for concrete mix design for the 21st century” and note the cost savings for large-scale projects, such as a high-rise building structure, can be in the millions of dollars. These modern approaches will have a transformative impact on the engineering practice in the coming decade.
To the best of our knowledge, no systematic investigation has been performed to fully analyze the accuracy of a given AI algorithm in predicting the HPC compressive strength. It is well known that the latter greatly depends on the construction of a given dataset for both training and testing parts. As an example, for a given dataset, the accuracy of an AI model might vary within a wide range and be conditioned by the random sampling procedure. A robust approach that possesses the ability to take into account such an effect is therefore indispensable. Moreover, the study of how the uncertainty in the predicted outputs can be influenced by different sources of uncertainty in the input space is also of great importance. The reliable identification of the most important factor is thus crucial.
The main objective of this study is to propose an effective way to fully evaluate the performance of AI algorithms for predicting the compressive strength of HPC. Two AI models have been selected to perform the case studies: Gaussian Process Regression (GPR) and an Artificial Neural Network (ANN) with the Levenberg–Marquardt Algorithm. The proposed model was tested using a total of 1030 compressive strength tests gathered from the available literature, with eight input parameters (i.e. the contents of cement, fly ash, blast furnace slag, water, superplasticizer, fine and coarse aggregates, and the age of the HPC) with the compressive strength as the prediction target. The Monte Carlo approach was then applied for the assessment of the performance of the proposed AI models along with various criteria such as the Mean Absolute Error (MAE), Root Mean Squared Error (RMSE), and Coefficient of Determination (R2). Finally, a sensitivity analysis was carried out to determine the contribution of each input parameter to the prediction capability of the AI models. The results were finally compared with those reported in the literature.

2. Research Novelty and Significance

As discussed in the introduction section, the estimation of the compressive strength of HPC is crucial in civil engineering applications. Although miscellaneous experimental works have reported this problem, it is difficult to quantify a generalized formulation taking into account all the factors that influence the compressive strength of HPC. The application of AI algorithms could help in revealing the nonlinear relationships between the HPC compressive strength and the corresponding mixture components. That way, the impacts on HPC compressive strength of input variables could be fully achieved and determined. Moreover, numerical techniques such as Monte Carlo simulations could be applied to deduce the robustness of the prediction models, taking into account the variability of the input space. Therefore, once constructed, the developed machine learning models can be efficient tools which could help researchers and engineers to save cost and time in experiments when studying the compressive strength of HPC.

3. Materials and Methods

3.1. Preparation of Data

A total of 1030 HPC samples collected from the UC Irvine repository and published in published papers [53,54,55,56,57] was evaluated in this study. Research data for this article is also included as Supplementary Materials. All of the samples were fabricated with ordinary Portland cement (OPC) and cured under normal conditions. The available HPC testing data in the literature used specimens of different sizes and shapes. They were converted into unique 150 mm cylinders based on existing guidelines, such as IS 516 1959 [58] and GB 50205 2001 [59]. The HPC compressive strength is obtained as a function of eight inputs: Contents of cement (denoted as X1), blast furnace slag (denoted as X2), fly ash (denoted as X3), water (denoted as X4), superplasticizer (denoted as X5), coarse aggregate (denoted as X6), fine aggregate (denoted as X7), and the HPC age (denoted as X8). Table 1 presents the ranges of these components in the database.
The database containing 1030 records was divided into two subsets: The training set (70% of the data) and the testing set (the remaining 30% of the data), which were randomly chosen from the initial database under a uniform distribution. Each dataset contained 8 vectors—corresponding to each of the 8 input parameters—and one output, the compressive strength of HPC. While various train/test ratios can be used, in this paper, the 70/30 ratio for training/testing datasets was selected, as suggested in published papers [60] and [61]. It is observed that all input variables cover a wide range of values. Statistical analysis was performed to demonstrate that the choice of these input parameters was relevant, i.e., no major cross-correlation was found in the eight-dimensional input space [53,54,55,56,57]. Therefore, the AI models can be trained with a good generalization capability.

3.2. Artificial Intelligence Approaches

3.2.1. Gaussian Process Regression

In the present study, Gaussian Process Regression (GPR), a nonparametric Bayesian approach to regression, was applied to predict the compressive strength of HPC. An advantage of GPR is that it has an ability to provide uncertainty measurements on the predicted values, unlike many supervised ML algorithms. A feature of GPR is that it directly defines a prior probability over a latent function. GPR is expressed as a Gaussian process of its mean function, denoted as m ( x ) , and covariance kernel function, denoted as k ( x , x ) [62,63]:
f ( x ) = Gaussian   Process   of   [ m ( x ) , k ( x , x ) ] .
The mean vector represents the central tendency of function f ; normally, it is assumed to be zero [63]. The covariance matrix describes the structure and the shape of the function. The relation between the input parameters and output variable is defined as:
y = f ( x ) + ε ,
where ε is the independent noise, which is covered by a distribution of a zero mean and a variance σ n 2 , such as:
ε = ( 0 , σ n 2 ) .
From Equation (2), the likelihood function is obtained as:
L ( y | f ) = ( y | f , σ n 2 I ) ,
where
y = [ y 1 , y 2 , , y n ] T
f = [ f ( x 1 ) , f ( x 2 ) , , f ( x n ) ] T ,
and I is the diagonal identity matrix of dimension M × M . The marginal distribution L ( f ) is defined by a Gaussian with a zero mean and a covariance matrix based on a Gram matrix by the relationship: L ( f ) = ( f | 0 , K ) , as deduced from the definition of the Gaussian process in the work of Mackay [64]:
L ( y | f ) = ( y | f , σ n 2 I ) ,
where K = k ( x i , x j ) is the covariance matrix corresponding to the covariance function k . The term “marginal” was used to indicate a non-parametric model. It can be seen that Equation (4) obeys the distribution of the Gaussian type, so that the marginal distribution of y could be defined as:
L ( y ) = ( f | 0 , K y ) ,
where K y = K + σ n 2 I . Let us define f * = f ( x ) as the vector of function values corresponding to the input variables x and ε as the corresponding noise. The joint Gaussian distribution is then defined as:
[ y y ] = ( [ f f ] + [ ε ε ] ) ( 0 , [ K y K K T K + σ n 2 ] ) ,
where K = [ k ( x , x 1 ) ,     , k ( x , x M ) ] T and K = k ( x , x ) . The predictive distribution L ( y | y ) is a Gaussian distribution, where the mean and covariance are defined as follows [65]:
m ( x ) = K T K y 1 y
σ 2 ( x ) = K K T K y 1 K + σ n 2 .
The inverse of the covariance matrix K y can be determined using the Cholesky decomposition [66]. The covariance (kernel) function is a very important factor in GPR, as it defines the similarity of the data, which has a major impact on the prediction results [63]. In this study, the following five types of covariance functions are used for predicting the compressive strength of HPC [67]:
Matern 3/2:
k ( x i , x j | θ ) = σ f 2 ( 1 + 3 r σ l ) exp [ 3 r σ l ]
Matern 5/2:
k ( x i , x j | θ ) = σ f 2 ( 1 + 5 r σ l + 5 r 2 3 σ l 2 ) exp [ 5 r σ l ]
Exponential:
k ( x i , x j | θ ) = σ f 2 exp [ r σ l ]
Squared Exponential:
k ( x i , x j | θ ) = σ f 2 exp [ 1 2 ( x i x j ) T ( x i x j ) σ l 2 ]
Rational quadratic:
k ( x i , x j | θ ) = σ f 2 ( 1 + r 2 2 α σ l 2 ) α ,
where “r” is the Euclidean distance between variables x i and x j :
r = ( x i x j ) T ( x i x j ) ,
where σ l and σ f are the characteristic length scale and the signal standard deviation, respectively. The hyper-parameter θ of the covariance function can be calculated by several methods [68]. In the rest of the paper, GPR algorithms using different kernel functions are designated as follows: GPR using Matern 3/2 as GPR-32, GPR using Matern 5/2 as GPR-52, GPR using the exponential kernel as GPR-EXP, GPR using the squared exponential kernel as GPR-SQEXP, and GPR using the rational quadratic kernel as GPR-RSQ.

3.2.2. Artificial Neural Network (ANN)

Hammoudi et al. [69] showed that the ANN technique is superior to the Response Surface Methodology in predicting compressive strength of recycled concrete aggregates. The prediction performance of the ANN technique for predicting the concrete compressive strength has also been reported in several other studies [70,71].
Such artificial nodes process information from the input space and propagate it towards the output. A typical ANN architecture has three layers: Input, hidden, and output layers (Figure 1). In most cases, the hidden layer performs a nonlinear transformation in order to capture the nonlinear behavior between the input and output variables of the considered problem [72,73,74,75]. In this study, the well-known sigmoid function was employed as the nonlinear transformation of the signal for a given neuron in the hidden layer as follows [76,77,78,79,80]:
y = f ( x ) = 1 1 + e x ,
where x = ( x 1 , x 2 , , x n ) are the received signals coming from the previous neurons and y is the output signal of the considered neuron. In the output layer, a linear transformation function is applied to calculate the response of the prediction problem, which is the compressive strength of HPC in this study.
The optimal number of neurons in the hidden layer depends on each specific problem. If the number of artificial neurons in the hidden layer is too big or too small, it may result in over- or underfitting [81]. In this study, after several tests, eight hidden neurons—a number equal to the dimension in the input space—were selected, which is in line with the number suggested by Behnood and Golafshani [71]. Finally, the Levenberg–Marquardt learning algorithm was chosen for the training process of the model due to its higher efficiency ([70,82] or [83]). In the rest of the paper, the ANN model is denoted as LMNN.

3.3. Monte Carlo Approach and Statistical Analysis

For typical construction and building materials such as concrete, many studies involving Monte Carlo technique have been introduced in the literature, taking into account the variability in the input space. For instance, Wang et al. [84] quantified the size effect of random aggregates and pores on the mechanical properties of concrete. Jaskulski and Wilinski [85] proposed a probabilistic analysis for concrete subjected to shear. Kostic et al. [86] optimized the response surface methodology in predicting the compressive strength of concrete based on a Monte Carlo framework. Numerical prediction models involving the Monte Carlo method can explain the variation of the output results through a statistical analysis.
The Monte Carlo method is extremely robust and efficient for calculating the propagation of the input variability on the output results, especially using numerical AI models [87,88,89,90]. The main idea behind the Monte Carlo method is to repeat realizations in the input space randomly and then calculate the corresponding output through a simulation model [91,92]. Therefore, this numerical technique lends itself to parallel [93,94,95] and distributed [96,97,98] computing effectively. A concept of the Monte Carlo method involving a two-dimensional input space with a typical probability distribution is presented in Figure 2. The robustness of the model and sensitivity of the input variables can be investigated through a statistical characterization of the output results (Figure 2).
In this paper, the statistical convergence of Monte Carlo simulations was investigated using the following equation [100,101,102]:
normdiff ( n M C ) = 1 G _ 1 n M C i = 1 n M C G i ,
where G _ is the mean value of the considered random variable G and n MC is the number of Monte Carlo runs. This convergence function provides efficient information about the computational time and reliable results for the later statistical analysis.

3.4. Quality Assessment

For the evaluation of the results given by the AI models, several criteria, such as Coefficient of determination (R2), Root Mean Squared Error (RMSE), and Mean Absolute Error (MAE), were used in this research.
R2 is a key output in regression analysis. It is interpreted as the square of the correlation (R) between the predicted and the actual outputs, which varies from 0 to 1. A high value of R2 indicates a good correlation between the predicted and the target values. The RMSE is another error measure of the average squared difference between the predicted and actual outputs of an AI model [103,104,105], whereas MAE measures the average error between them [106]. In contrast to R2, lower values of RMSE and MAE indicate a better performance of an AI algorithm [107,108]. The quantities R2, RMSE, and MAE are defined as follows [100]:
R 2 = 1 i = 1 N ( x i y i ) i = 1 N ( x i y ¯ )
RMSE = 1 N i = 1 N ( x i y i ) 2
MAE = 1 N i = 1 N ( x i y i ) ,
where N is the number of samples; x i and y i are the actual and predicted outputs, respectively; and y ¯ is the mean of the predicted output.

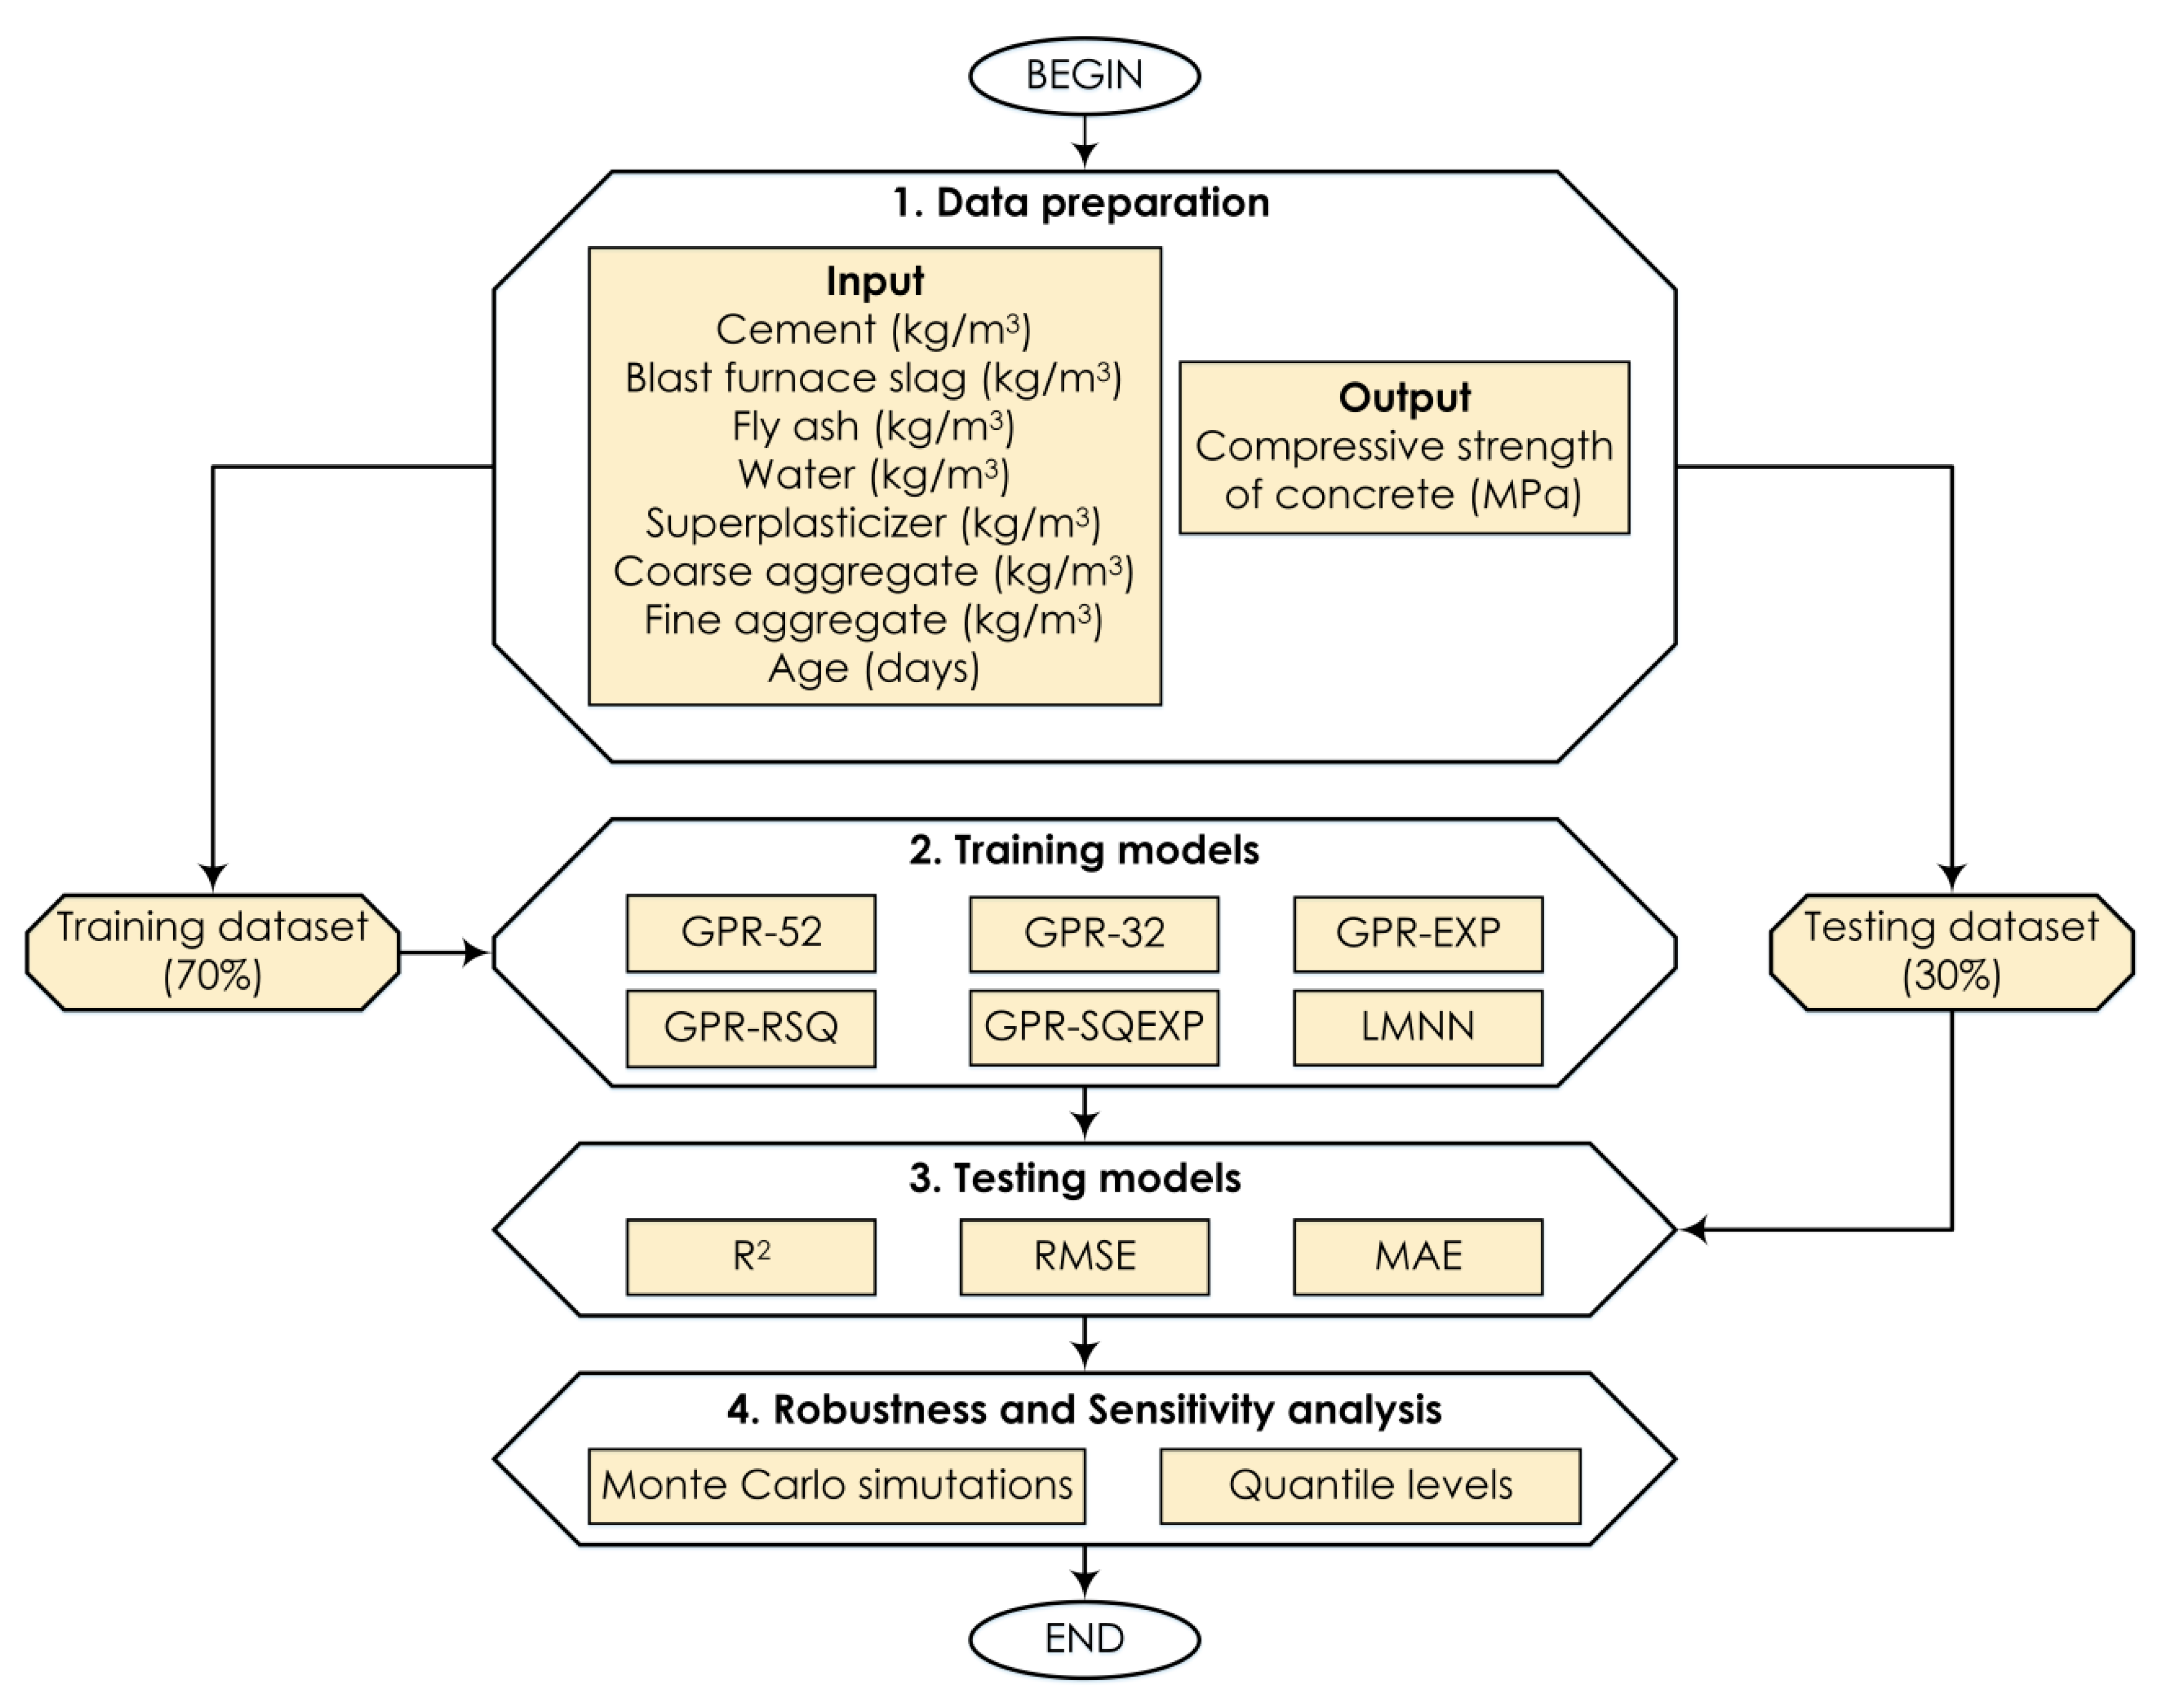
3.5. Methodology Flowchart

The methodology of the present study for predicting the compressive strength of HPC consists of four main steps as follows (Figure 3):
Step 1: Data preparation. A database containing data for 1030 samples of compressive strength laboratory experiments was used, including input parameters and the compressive strength of HPC as the output variable. The dataset was divided into two parts for the training and validation procedures of the AI models.
Step 2: Model training. In this second step, the proposed AI models such as Gaussian Process Regression with different covariance functions (i.e., GPR-52, GPR-32, GPR-EXP, GPR-SQEXP, GPR-RSQ) and LMNN were trained using the training dataset.
Step 3: Model testing. In this third step, the trained AI models were validated using the testing data set (30% of the initial data). Statistical measures R2, RMSE, and MAE were applied in this step to evaluate the performance of the AI models.
Step 4: Robustness and sensitivity analysis. In this final step, the robustness of the AI algorithms was investigated using Monte Carlo simulations. Precisely, 500 Monte Carlo simulations were performed to evaluate the prediction capabilities of the AI models and to provide a statistical comparison between them. Thus, 500 values of each error criteria such as R2, RMSE, or MAE were calculated and the convergence of each model was studied. In terms of the sensitivity analysis, the response of each AI model to the input variability was studied. For this purpose, Monte Carlo simulations were executed while respectively taking input variables out of the problem one by one.

4. Results and Discussion

4.1. Prediction Capability of the AI Models

In this section, the performance of six AI models (GPR-52, GPR-32, GPR-EXP, GPR-SQEXP, GPR-RSQ, and LMNN) for predicting the HPC compressive strength is investigated (Figure 4 and Figure 5). The errors between the predicted and experimental values of the compressive strength for both training and testing parts are plotted as a function of the sample index (Figure 4a,c). The probability distributions of the errors in the training and testing datasets are presented in Figure 4b,d, respectively. Figure 5 presents the predicted outputs versus the corresponding testing targets for GPR-52, GPR-32, GPR-EXP, GPR-SQEXP, GPR-RSQ, and LMNN models associated with the testing part. The fitted linear lines are also highlighted in each case in order to demonstrate the performance of the six AI models.
The analysis of errors shows that for the training part, all of the AI models yield good results within a reasonable range (i.e., an error standard deviation variation of less than 10 MPa). It can be seen in Figure 4b that there is a high concentration of error around zero. However, GPR-32 and GPR-EXP models yield the highest value for the error distribution peak around 0, showing that the two models are good performers. Similarly, for the testing part, GPR-32 and GPR-EXP models provided the best prediction results with respect to statistical analysis of errors (Figure 4d). For the prediction quality based on linear fit lines, Figure 5 shows that all of the AI models possess a strong linear correlation between predicted and actual compressive strength values (i.e., the linear fit lines are very close to the diagonal line with ±2° of the slope angle). The performance of all AI algorithms is summarized in Table 2. Based on the prediction quality assessment and error analysis, GPR-32 is found to be slightly better than other models for the prediction of the compressive strength of HPC.

4.2. Robustness Analysis of the AI Models

In this section, the performance of the six proposed AI algorithms is evaluated using the Monte Carlo simulations. It has been previously demonstrated that the random sampling procedure for both training and testing datasets greatly affects the prediction performance of AI algorithms [87,88]. Therefore, the robustness analysis of AI models should be carried out with a sufficient number of cases in order to make the obtained results more representative. A total number of 3000 Monte Carlo simulations was performed (500 simulations for six algorithms), and the results are plotted in Figure 6. Only results from the testing parts were considered, as they reflect the prediction performance of algorithms [88]. The Monte Carlo simulation results obtained for R2, RMSE, and MAE exhibit significant variations, especially the highest standard deviation (StD) values for the case of the LMNN algorithm (Table 3). In terms of the mean values of criteria, GPR-32 performed better than other methods with values of mean(R2) = 0.893, mean(RMSE) = 5.46, and mean(MAE) = 3.86. The standard deviation values obtained by GPR-32 were also the smallest (i.e., StD(R2) = 0.015, StD(RMSE) = 0.37 and StD(MAE) = 0.21), demonstrating that GPR-32 was the most stable method. In addition, the min and max values of the R2, RMSE, and MAE of all AI methods are given in Table 3.
The convergence behavior of the six AI algorithms is displayed in Figure 7, considering R2, RMSE, and MAE as random variables (see Equation (19) for the expression of the normdiff function). It is observed that at least 100 Monte Carlo runs are required to ensure statistical convergence of R2, RMSE, and MAE for GPR-based methods, whereas at least 200 Monte Carlo runs are required to ensure statistical convergence results for LMNN. The converged values of R2, RMSE, and MAE are presented in Table 3. It can be concluded that the most accurate AI model for predicting the compressive strength of HPC with respect to R2 is GPR-32, following by GPR-52, GPR-RSQ, GPR-SQEXP, GPR-EXP, and LMNN. A similar trend was also noticed regarding the converged statistical values of RMSE and MAE—GPR-32 was found to be the best predictor in terms of accuracy, followed by GPR-EXP, GPR-52, GPR-RSQ, GPR-SQEXP, and LMNN. The maximum fluctuation of GPR methods was smaller (0.2%) than that of the LMNN algorithm (1.5%).
Various investigations have been introduced in the literature in order to predict the compressive strength of HPC based on AI approaches. A highlight of previous studies involving the reference, the number of data, the prediction models used, and the average value of R2 is given in Table 4. Various AI methods have been employed, such as well-known ANN or SVM. Most recently, several hybrid models have been developed in the field of HPC compressive strength prediction; for instance, the authors of [18] have combined Least Squares Support Vector Regression and the global optimization technique called the Firefly Algorithm. In terms of the average value of the coefficient of determination R2, our model brings the compressive strength prediction closer and makes it even better than previously published results.

4.3. Input Parameter Sensitivity Analysis

In this section, a sensitivity analysis of the input variables on the prediction accuracy of AI algorithms for the compressive strength of HPC is presented. The selected model for the investigation is GPR-32, as its prediction accuracy was shown to be the best in the previous sections with respect to both average and standard deviation values. Indeed, the GPR-32 model provided 7%, 13%, and 33% lower standard deviation values than those of GPR-52, GPR-EXP, and LMNN, as indicated in Table 3. In terms of the average values, the GPR-32 model exhibited the most efficient values regarding all criteria such as R2, RMSE, and MAE. In addition, the LMNN model has also been selected in this section for the sensitivity analysis of inputs.
The sensitivity analysis was conducted by successively replacing all values of each input in the eight-dimensional input space with a constant (equal to zero in this study). That way, the statistical behavior of the excluded input is reduced to zero, allowing the prediction models to quantify the influence of this input on the predicted targets, even in the case of highly nonlinear relationships. Monte Carlo simulations were conducted in order to ensure statistical convergence of the sensitivity analysis. Eight groups of Monte Carlo simulations were performed with a number of 500 realizations for each case (i.e., successively excluding the influence of X1 to X8). Statistical measures such as R2, RMSE, and MAE were employed to quantify the change of prediction accuracy compared with the case of full simulation (i.e., including all input variables).
A total of 4000 simulations for 8 groups were performed and the convergence functions over 500 Monte Carlo simulations for each group were evaluated using Equation (19). All convergence functions reached the stationary solution within an acceptable range of error. The probability density functions of quality assessment criteria (i.e., R2, RMSE, and MAE) over 500 runs successively excluding the statistical properties of X1 to X8 are shown in Figure 8 using LMNN and GPR-32. Finally, the sensitivity indexes of inputs were obtained by calculating the difference of the considered quality assessment criterion between the case of full simulation and the case of excluding an input. All eight sensitivity indexes were then scaled by their sum and shown in Figure 9, classified in descending order with respect to R2, RMSE, and MAE, respectively.
It is observed in Figure 9 that the most sensitive input is X8 (the age of concrete) (i.e., its probability distribution exhibits a major difference compared with others seen in Figure 8, so the change of the mean value in the case of excluding X8 was the most important compared to others). This conclusion is reached using both the LMNN and GPR-32 models, with respect to the three statistical criteria R2 (Figure 9a), RMSE (Figure 9b), and MAE (Figure 9c). The age of concrete (X8) is then the most important input affecting the prediction accuracy of HPC compressive strength in a considerable manner. Additionally identified in Figure 9, the second most important input is the cement content (X1).

5. Conclusions

In this study, the sensitivity and robustness analyses of two AI models, including GPR and LMNN, were done for the prediction of the compressive strength of the HPC using the Monte Carlo approach. Various kernel functions—namely, Matern32, Matern52, Exponential, Squared exponential, and Rational quadratic—were employed to construct various GPR models (GPR-32, GPR-52, GPR-EXP, GPR-SQEXP, and GPR-RSQ, respectively). The predictive capabilities of the AI models were evaluated using criteria such as RMSE, R2, and MAE. In addition, the Monte Carlo approach with 500 runs was used to deduce the converged statistical values of the criteria for analyzing the robustness of the AI models and to carry out the sensitivity analyses of the input parameters.
The results showed that the AI models developed in this study performed well in predicting the HPC compressive strength, but GPR-32 (R2 = 0.893, RMSE = 5.46, MAE = 3.86) is the most efficient model compared with other algorithms. The Monte Carlo simulation results show that two parameters, namely the content of cement and the testing age of HPC, were found to be the most sensitive and important factors for predicting the compressive strength of the HPC. Therefore, it can be concluded that GPR-32 is a promising approach for prediction of the compressive strength of the HPC, which can be applied to predict other important properties of HPC such as tensile strength, flexural strength, or modulus of elasticity. However, it was also noticed that this model is sensitive to the selection of input parameters; thus, sensitivity analysis should be carried out to evaluate the importance of input parameters, which might help in the suitable selection of input factors for better performance of the predictive models. In general, this study might help engineers to select suitable AI models and appropriate parameters for the fabrication process of HPC.

Supplementary Materials

The data associated with this publication are available online at https://www.mdpi.com/2071-1050/12/3/830/s1.

Author Contributions

Conceptualization, D.V.D., H.-B.L., and H.A.; Methodology, D.V.D.; H.-B.L., B.T.P., and T.-T.L.; Validation, D.V.D., H.-B.L., and H.A.; Formal Analysis, T.-T.L., L.M.L., and H.-B.L.; Data Curation, V.M.L., L.M.L., and H.-B.L.; Writing-Original Draft Preparation, D.V.D., B.T.P., H.-B.L., V.M.L., L.M.L., and T.-T.L.; Writing-Review & Editing, D.V.D., B.T.P., H.-B.L., and H.A.; Visualization, V.M.L., L.M.L., and T.-T.L.; Supervision, D.V.D., H.-B.L., B.T.P., and H.A.; Project Administration, D.V.D. and H.-B.L.; Funding Acquisition, D.V.D. All authors have read and agreed to the published version of the manuscript.

Conflicts of Interest

The authors declare no conflict of interest.

References

  1. Aïtcin, P.-C. High Performance Concrete; CRC Press: Boca Raton, FL, USA, 1998; ISBN 1-135-82357-X. [Google Scholar]
  2. Nawy, E.G. Fundamentals of High-Performance Concrete; John Wiley & Sons: Hoboken, NJ, USA, 2001. [Google Scholar]
  3. Huchante, S.R.; Chandupalle, S.; Ghorpode, V.G. Mix design of high performance concrete using silica fume and superplasticizer. Pan 2014, 18, 100. [Google Scholar]
  4. Chang, P.-K.; Peng, Y.-N. Influence of mixing techniques on properties of high performance concrete. Cem. Concr. Res. 2001, 31, 87–95. [Google Scholar] [CrossRef]
  5. Tran, V.Q.; Nguyen, H.L.; Dao, V.D.; Hilloulin, B.; Nguyen, L.K.; Nguyen, Q.H.; Le, T.-T.; Ly, H.-B. Temperature effects on chloride binding capacity of cementitious materials. In Magazine of Concrete Research; ICE: London, UK, 2019; pp. 1–39. [Google Scholar]
  6. Zhou, F.P.; Lydon, F.D.; Barr, B.I.G. Effect of coarse aggregate on elastic modulus and compressive strength of high performance concrete. Cem. Concr. Res. 1995, 25, 177–186. [Google Scholar] [CrossRef]
  7. Duval, R.; Kadri, E.H. Influence of Silica Fume on the Workability and the Compressive Strength of High-Performance Concretes. Cem. Concr. Res. 1998, 28, 533–547. [Google Scholar] [CrossRef]
  8. Chan, Y.N.; Luo, X.; Sun, W. Compressive strength and pore structure of high-performance concrete after exposure to high temperature up to 800 °C. Cem. Concr. Res. 2000, 30, 247–251. [Google Scholar] [CrossRef]
  9. Rashid, M.A.; Mansur, M.A.; Paramasivam, P. Correlations between Mechanical Properties of High-Strength Concrete. J. Mater. Civ. Eng. 2002, 14, 230–238. [Google Scholar] [CrossRef]
  10. Ramezanianpour, A.A.; Pilvar, A.; Mahdikhani, M.; Moodi, F. Practical evaluation of relationship between concrete resistivity, water penetration, rapid chloride penetration and compressive strength. Constr. Build. Mater. 2011, 25, 2472–2479. [Google Scholar] [CrossRef]
  11. Adeli, H.; Yeh, C. Perceptron Learning in Engineering Design. Comput. Aided Civ. Infrastruct. Eng. 1989, 4, 247–256. [Google Scholar] [CrossRef]
  12. Adeli, H. Neural networks in civil engineering: 1989–2000. Comput. Aided Civ. Infrastruct. Eng. 2001, 16, 126–142. [Google Scholar] [CrossRef]
  13. Amezquita-Sanchez, J.P.; Valtierra-Rodriguez, M.; Aldwaik, M.; Adeli, H. Neurocomputing in civil infrastructure. Sci. Iran. Trans. A Civ. Eng. 2016, 23, 2417. [Google Scholar] [CrossRef] [Green Version]
  14. Erdal, H.I.; Karakurt, O.; Namli, E. High performance concrete compressive strength forecasting using ensemble models based on discrete wavelet transform. Eng. Appl. Artif. Intell. 2013, 26, 1246–1254. [Google Scholar] [CrossRef]
  15. Chou, J.-S.; Pham, A.-D. Enhanced artificial intelligence for ensemble approach to predicting high performance concrete compressive strength. Constr. Build. Mater. 2013, 49, 554–563. [Google Scholar] [CrossRef]
  16. Cheng, M.-Y.; Firdausi, P.M.; Prayogo, D. High-performance concrete compressive strength prediction using Genetic Weighted Pyramid Operation Tree (GWPOT). Eng. Appl. Artif. Intell. 2014, 29, 104–113. [Google Scholar] [CrossRef]
  17. Erdal, H.I. Two-level and hybrid ensembles of decision trees for high performance concrete compressive strength prediction. Eng. Appl. Artif. Intell. 2013, 26, 1689–1697. [Google Scholar] [CrossRef]
  18. Pham, A.D.; Hoang, N.D.; Nguyen, Q.T. Predicting Compressive Strength of High-Performance Concrete Using Metaheuristic-Optimized Least Squares Support Vector Regression. J. Comput. Civ. Eng. 2016, 30, 06015002. [Google Scholar] [CrossRef]
  19. Asteris, P.G.; Roussis, P.C.; Douvika, M.G. Feed-Forward Neural Network Prediction of the Mechanical Properties of Sandcrete Materials. Sensors 2017, 17, 1344. [Google Scholar] [CrossRef] [Green Version]
  20. Asteris, P.G.; Moropoulou, A.; Skentou, A.D.; Apostolopoulou, M.; Mohebkhah, A.; Cavaleri, L.; Rodrigues, H.; Varum, H. Stochastic Vulnerability Assessment of Masonry Structures: Concepts, Modeling and Restoration Aspects. Appl. Sci. 2019, 9, 243. [Google Scholar] [CrossRef] [Green Version]
  21. Asteris, P.G.; Apostolopoulou, M.; Skentou, A.D.; Moropoulou, A. Application of artificial neural networks for the prediction of the compressive strength of cement-based mortars. Comput. Concr. 2019, 24, 329–345. [Google Scholar]
  22. Cavaleri, L.; Chatzarakis, G.E.; Di Trapani, F.; Douvika, M.G.; Roinos, K.; Vaxevanidis, N.M.; Asteris, P.G. Modeling of surface roughness in electro-discharge machining using artificial neural networks. Adv. Mater. Res. 2017, 6, 169–184. [Google Scholar]
  23. Pham, B.T.; Le, L.M.; Le, T.-T.; Bui, K.-T.T.; Le, V.M.; Ly, H.-B.; Prakash, I. Development of advanced artificial intelligence models for daily rainfall prediction. Atmos. Res. 2020, 237, 104845. [Google Scholar] [CrossRef]
  24. Dao, D.V.; Jaafari, A.; Bayat, M.; Mafi-Gholami, D.; Qi, C.; Moayedi, H.; Phong, T.V.; Ly, H.-B.; Le, T.-T.; Trinh, P.T.; et al. A spatially explicit deep learning neural network model for the prediction of landslide susceptibility. CATENA 2020, 188, 104451. [Google Scholar] [CrossRef]
  25. Bang, S.; Park, S.; Kim, H.; Kim, H. Encoder–decoder network for pixel-level road crack detection in black-box images. Comput. Aided Civ. Infrastruct. Eng. 2019. [Google Scholar] [CrossRef]
  26. Maeda, H.; Sekimoto, Y.; Seto, T.; Kashiyama, T.; Omata, H. Road damage detection and classification using deep neural networks with smartphone images. Comput. Aided Civ. Infrastruct. Eng. 2018, 33, 1127–1141. [Google Scholar] [CrossRef]
  27. Zhang, A.; Wang, K.C.; Li, B.; Yang, E.; Dai, X.; Peng, Y.; Fei, Y.; Liu, Y.; Li, J.Q.; Chen, C. Automated pixel-level pavement crack detection on 3D asphalt surfaces using a deep-learning network. Comput. Aided Civ. Infrastruct. Eng. 2017, 32, 805–819. [Google Scholar] [CrossRef]
  28. Gao, Y.; Mosalam, K.M. Deep transfer learning for image-based structural damage recognition. Comput. Aided Civ. Infrastruct. Eng. 2018, 33, 748–768. [Google Scholar] [CrossRef]
  29. Kang, D.; Cha, Y.-J. Autonomous UAVs for Structural Health Monitoring Using Deep Learning and an Ultrasonic Beacon System with Geo-Tagging. Comput. Aided Civ. Infrastruct. Eng. 2018, 33, 885–902. [Google Scholar] [CrossRef]
  30. Lin, Y.; Nie, Z.; Ma, H. Structural damage detection with automatic feature-extraction through deep learning. Comput. Aided Civ. Infrastruct. Eng. 2017, 32, 1025–1046. [Google Scholar] [CrossRef]
  31. Ly, H.-B.; Pham, B.T.; Dao, D.V.; Le, V.M.; Le, L.M.; Le, T.-T. Improvement of ANFIS Model for Prediction of Compressive Strength of Manufactured Sand Concrete. Appl. Sci. 2019, 9, 3841. [Google Scholar] [CrossRef] [Green Version]
  32. Chen, H.; Asteris, P.G.; Jahed Armaghani, D.; Gordan, B.; Pham, B.T. Assessing Dynamic Conditions of the Retaining Wall: Developing Two Hybrid Intelligent Models. Appl. Sci. 2019, 9, 1042. [Google Scholar] [CrossRef] [Green Version]
  33. Asteris, P.G.; Mokos, V.G. Concrete compressive strength using artificial neural networks. In Neural Computing and Applications; Springer: Berlin/Heidelberg, Germany, 2019. [Google Scholar]
  34. Asteris, P.G.; Ashrafian, A.; Rezaie-Balf, M. Prediction of the compressive strength of self-compacting concrete using surrogate models. Comput. Concr. 2019, 24, 137–150. [Google Scholar]
  35. Asteris, P.G.; Armaghani, D.J.; Hatzigeorgiou, G.D.; Karayannis, C.G.; Pilakoutas, K. Predicting the shear strength of reinforced concrete beams using Artificial Neural Networks. Comput. Concr. 2019, 24, 469–488. [Google Scholar]
  36. Apostolopoulou, M.; Armaghani, D.J.; Bakolas, A.; Douvika, M.G.; Moropoulou, A.; Asteris, P.G. Compressive strength of natural hydraulic lime mortars using soft computing techniques. Procedia Struct. Integr. 2019, 17, 914–923. [Google Scholar] [CrossRef]
  37. Armaghani, D.J.; Hatzigeorgiou, G.D.; Karamani, C.; Skentou, A.; Zoumpoulaki, I.; Asteris, P.G. Soft computing-based techniques for concrete beams shear strength. Procedia Struct. Integr. 2019, 17, 924–933. [Google Scholar] [CrossRef]
  38. Gao, Y.; Kong, B.; Mosalam, K.M. Deep leaf-bootstrapping generative adversarial network for structural image data augmentation. Comput. Aided Civ. Infrastruct. Eng. 2019, 34, 755–773. [Google Scholar] [CrossRef]
  39. Huang, Y.; Beck, J.L.; Wu, S.; Li, H. Robust Bayesian compressive sensing for signals in structural health monitoring. Comput. Aided Civ. Infrastruct. Eng. 2014, 29, 160–179. [Google Scholar] [CrossRef] [Green Version]
  40. Rafiei, M.H.; Adeli, H. A novel unsupervised deep learning model for global and local health condition assessment of structures. Eng. Struct. 2018, 156, 598–607. [Google Scholar] [CrossRef]
  41. Xue, Y.; Li, Y. A fast detection method via region-based fully convolutional neural networks for shield tunnel lining defects. Comput. Aided Civ. Infrastruct. Eng. 2018, 33, 638–654. [Google Scholar] [CrossRef]
  42. Hashemi, H.; Abdelghany, K. End-to-end deep learning methodology for real-time traffic network management. Comput. Aided Civ. Infrastruct. Eng. 2018, 33, 849–863. [Google Scholar] [CrossRef]
  43. Nabian, M.A.; Meidani, H. Deep learning for accelerated seismic reliability analysis of transportation networks. Comput. Aided Civ. Infrastruct. Eng. 2018, 33, 443–458. [Google Scholar] [CrossRef] [Green Version]
  44. Qi, C.; Ly, H.-B.; Chen, Q.; Le, T.-T.; Le, V.M.; Pham, B.T. Flocculation-dewatering prediction of fine mineral tailings using a hybrid machine learning approach. Chemosphere 2020, 244, 125450. [Google Scholar] [CrossRef]
  45. Ly, H.-B.; Le, L.M.; Phi, L.V.; Phan, V.-H.; Tran, V.Q.; Pham, B.T.; Le, T.-T.; Derrible, S. Development of an AI Model to Measure Traffic Air Pollution from Multisensor and Weather Data. Sensors 2019, 19, 4941. [Google Scholar] [CrossRef] [PubMed] [Green Version]
  46. Liang, X. Image-based post-disaster inspection of reinforced concrete bridge systems using deep learning with Bayesian optimization. Comput. Aided Civ. Infrastruct. Eng. 2019, 34, 415–430. [Google Scholar] [CrossRef]
  47. Luo, X.; Li, H.; Yang, X.; Yu, Y.; Cao, D. Capturing and Understanding Workers’ Activities in Far-Field Surveillance Videos with Deep Action Recognition and Bayesian Nonparametric Learning. Comput. Aided Civ. Infrastruct. Eng. 2019, 34, 333–351. [Google Scholar] [CrossRef]
  48. Rafiei, M.H.; Khushefati, W.H.; Demirboga, R.; Adeli, H. Supervised Deep Restricted Boltzmann Machine for Estimation of Concrete. ACI Mater. J. 2017, 114, 237–244. [Google Scholar] [CrossRef]
  49. Nguyen, T.; Kashani, A.; Ngo, T.; Bordas, S. Deep neural network with high-order neuron for the prediction of foamed concrete strength. Comput. Aided Civ. Infrastruct. Eng. 2019, 34, 316–332. [Google Scholar] [CrossRef]
  50. Rafiei, M.H.; Khushefati, W.H.; Demirboga, R.; Adeli, H. Novel Approach for Concrete Mixture Design Using Neural Dynamics Model and Virtual Lab Concept. ACI Mater. J. 2017, 114, 117–127. [Google Scholar] [CrossRef]
  51. Adeli, H.; Park, H.S. A neural dynamics model for structural optimization—Theory. Comput. Struct. 1995, 57, 383–390. [Google Scholar] [CrossRef]
  52. Park, H.S.; Adeli, H. A neural dynamics model for structural optimization—Application to plastic design of structures. Comput. Struct. 1995, 57, 391–399. [Google Scholar] [CrossRef]
  53. Yeh, I.-C. Modeling concrete strength with augment-neuron networks. J. Mater. Civ. Eng. 1998, 10, 263–268. [Google Scholar] [CrossRef]
  54. Yeh, I.-C. Design of high-performance concrete mixture using neural networks and nonlinear programming. J. Comput. Civ. Eng. 1999, 13, 36–42. [Google Scholar] [CrossRef]
  55. Yeh, I.-C. A mix proportioning methodology for fly ash and slag concrete using artificial neural networks. Chung Hua J. Sci. Eng. 2003, 1, 77–84. [Google Scholar]
  56. Yeh, I.-C. Analysis of strength of concrete using design of experiments and neural networks. J. Mater. Civ. Eng. 2006, 18, 597–604. [Google Scholar] [CrossRef]
  57. Yeh, I.-C. Modeling of strength of high-performance concrete using artificial neural networks. Cem. Concr. Res. 1998, 28, 1797–1808. [Google Scholar] [CrossRef]
  58. Indian Standard Code of Practice-Methods of Test for Strength of Concrete; BIS: Basel, Switzerland, 1959.
  59. Code for Acceptance of Construction Quality of Steel Structures; National Standard of the People’s Republic of China: Beijing, China, 2001.
  60. Khorsheed, M.S.; Al-Thubaity, A.O. Comparative evaluation of text classification techniques using a large diverse Arabic dataset. Lang Resour. Eval. 2013, 47, 513–538. [Google Scholar] [CrossRef]
  61. Leema, N.; Nehemiah, H.K.; Kannan, A. Neural network classifier optimization using Differential Evolution with Global Information and Back Propagation algorithm for clinical datasets. Appl. Soft Comput. 2016, 49, 834–844. [Google Scholar] [CrossRef]
  62. Banerjee, S.; Gelfand, A.E.; Finley, A.O.; Sang, H. Gaussian predictive process models for large spatial data sets. J. R. Stat. Soc. Ser. B (Stat. Methodol.) 2008, 70, 825–848. [Google Scholar] [CrossRef] [Green Version]
  63. Rasmussen, C.E. Gaussian Processes in Machine Learning. In Advanced Lectures on Machine Learning; Lecture Notes in Computer Science; Springer: Berlin/Heidelberg, Germany, 2003; Volume 3176. [Google Scholar]
  64. MacKay, D.J. Introduction to Gaussian processes. NATO ASI Ser. F Comput. Syst. Sci. 1998, 168, 133–166. [Google Scholar]
  65. Bishop, C.M. Pattern Recognition and Machine Learning; Springer: Berlin/Heidelberg, Germany, 2006. [Google Scholar]
  66. Higham, N.J. Analysis of the Cholesky Decomposition of a Semi-Definite Matrix; Oxford University Press: Oxford, UK, 1990; pp. 161–185. [Google Scholar]
  67. Hofmann, T.; Schölkopf, B.; Smola, A.J. Kernel Methods in Machine Learning. Ann. Stat. 2008, 36, 1171–1220. [Google Scholar] [CrossRef] [Green Version]
  68. Murray, I.; Adams, R.P. Slice sampling covariance hyperparameters of latent Gaussian models. In Advances in Neural Information Processing Systems; NIPS Proceedings; Hyatt Regency: Vancouver, BC, Canada, 2010; pp. 1732–1740. [Google Scholar]
  69. Hammoudi, A.; Moussaceb, K.; Belebchouche, C.; Dahmoune, F. Comparison of artificial neural network (ANN) and response surface methodology (RSM) prediction in compressive strength of recycled concrete aggregates. Constr. Build. Mater. 2019, 209, 425–436. [Google Scholar] [CrossRef]
  70. Alexandridis, A.; Triantis, D.; Stavrakas, I.; Stergiopoulos, C. A neural network approach for compressive strength prediction in cement-based materials through the study of pressure-stimulated electrical signals. Constr. Build. Mater. 2012, 30, 294–300. [Google Scholar] [CrossRef]
  71. Behnood, A.; Golafshani, E.M. Predicting the compressive strength of silica fume concrete using hybrid artificial neural network with multi-objective grey wolves. J. Clean. Prod. 2018, 202, 54–64. [Google Scholar] [CrossRef]
  72. Phong, T.V.; Phan, T.T.; Prakash, I.; Singh, S.K.; Shirzadi, A.; Chapi, K.; Ly, H.-B.; Ho, L.S.; Quoc, N.K.; Pham, B.T. Landslide susceptibility modeling using different artificial intelligence methods: A case study at Muong Lay district, Vietnam. Geocarto Int. 2019. [Google Scholar] [CrossRef]
  73. Bayat, M.; Ghorbanpour, M.; Zare, R.; Jaafari, A.; Thai Pham, B. Application of artificial neural networks for predicting tree survival and mortality in the Hyrcanian forest of Iran. Comput. Electron. Agric. 2019, 164, 104929. [Google Scholar] [CrossRef]
  74. Le, T.-T.; Pham, B.T.; Ly, H.-B.; Shirzadi, A.; Le, L.M. Development of 48-hour Precipitation Forecasting Model using Nonlinear Autoregressive Neural Network. In CIGOS 2019, Innovation for Sustainable Infrastructure; Ha-Minh, C., Dao, D.V., Benboudjema, F., Derrible, S., Huynh, D.V.K., Tang, A.M., Eds.; Springer: Singapore, 2020; Volume 54, pp. 1191–1196. ISBN 9789811508011. [Google Scholar]
  75. Pham, B.T.; Nguyen, M.D.; Ly, H.-B.; Pham, T.A.; Hoang, V.; Van Le, H.; Le, T.-T.; Nguyen, H.Q.; Bui, G.L. Development of Artificial Neural Networks for Prediction of Compression Coefficient of Soft Soil. In CIGOS 2019, Innovation for Sustainable Infrastructure; Ha-Minh, C., Dao, D.V., Benboudjema, F., Derrible, S., Huynh, D.V.K., Tang, A.M., Eds.; Springer: Singapore, 2020; Volume 54, pp. 1167–1172. ISBN 9789811508011. [Google Scholar]
  76. Adeli, H.; Park, H.S. Method and Apparatus for Efficient Design Automation and Optimization, and Structure Produced Thereby. U.S. Patent No 5,815,394, 29 September 1998. [Google Scholar]
  77. Cavaleri, L.; Asteris, P.G.; Psyllaki, P.P.; Douvika, M.G.; Skentou, A.D.; Vaxevanidis, N.M. Prediction of Surface Treatment Effects on the Tribological Performance of Tool Steels Using Artificial Neural Networks. Appl. Sci. 2019, 9, 2788. [Google Scholar] [CrossRef] [Green Version]
  78. Psyllaki, P.; Stamatiou, K.; Iliadis, I.; Mourlas, A.; Asteris, P.; Vaxevanidis, N. Surface treatment of tool steels against galling failure. In Proceedings of the MATEC Web of Conferences; EDP Sciences: Les Ulis, France, 2018; Volume 188. [Google Scholar]
  79. Asteris, P.G.; Argyropoulos, I.; Cavaleri, L.; Rodrigues, H.; Varum, H.; Thomas, J.; Paulo, B.; Lourenço, P.B. Masonry Compressive Strength Prediction using Artificial Neural Networks. In Proceedings of the International Conference on Transdisciplinary Multispectral Modeling and Cooperation for the Preservation of Cultural Heritage, Athens, Greece, 10–13 October 2018; Volume 1, pp. 10–13. [Google Scholar]
  80. Apostolopoulou, M.; Douvika, M.G.; Kanellopoulos, I.N.; Moropoulou, A.; Asteris, P.G. Prediction of Compressive Strength of Mortars using Artificial Neural Networks. In Proceedings of the 1st International Conference TMM_CH, Transdisciplinary Multispectral Modelling and Cooperation for the Preservation of Cultural Heritage, Athens, Greece, 10–13 October 2018; Volume 1, pp. 10–13. [Google Scholar]
  81. Al-Shamiri, A.K.; Kim, J.H.; Yuan, T.-F.; Yoon, Y.S. Modeling the compressive strength of high-strength concrete: An extreme learning approach. Constr. Build. Mater. 2019, 208, 204–219. [Google Scholar] [CrossRef]
  82. Nguyen, H.-L.; Le, T.-H.; Pham, C.-T.; Le, T.-T.; Ho, L.S.; Le, V.M.; Pham, B.T.; Ly, H.-B. Development of Hybrid Artificial Intelligence Approaches and a Support Vector Machine Algorithm for Predicting the Marshall Parameters of Stone Matrix Asphalt. Appl. Sci. 2019, 9, 3172. [Google Scholar] [CrossRef] [Green Version]
  83. Bui, D.-K.; Nguyen, T.; Chou, J.-S.; Nguyen-Xuan, H.; Ngo, T.D. A modified firefly algorithm-artificial neural network expert system for predicting compressive and tensile strength of high-performance concrete. Constr. Build. Mater. 2018, 180, 320–333. [Google Scholar] [CrossRef]
  84. Wang, X.; Yang, Z.; Jivkov, A.P. Monte Carlo simulations of mesoscale fracture of concrete with random aggregates and pores: A size effect study. Constr. Build. Mater. 2015, 80, 262–272. [Google Scholar] [CrossRef]
  85. Jaskulski, R.; Wiliński, P. Probabilistic Analysis of Shear Resistance Assured by Concrete Compression. Procedia Eng. 2017, 172, 449–456. [Google Scholar] [CrossRef]
  86. Kostić, S.; Vasović, N.; Marinković, B. Robust optimization of concrete strength estimation using response surface methodology and Monte Carlo simulation. Eng. Optim. 2017, 49, 864–877. [Google Scholar] [CrossRef]
  87. Pham, B.T.; Nguyen, M.D.; Dao, D.V.; Prakash, I.; Ly, H.-B.; Le, T.-T.; Ho, L.S.; Nguyen, K.T.; Ngo, T.Q.; Hoang, V.; et al. Development of artificial intelligence models for the prediction of Compression Coefficient of soil: An application of Monte Carlo sensitivity analysis. Sci. Total Environ. 2019, 679, 172–184. [Google Scholar] [CrossRef]
  88. Dao, D.V.; Ly, H.-B.; Trinh, S.H.; Le, T.-T.; Pham, B.T. Artificial Intelligence Approaches for Prediction of Compressive Strength of Geopolymer Concrete. Materials 2019, 12, 983. [Google Scholar] [CrossRef] [PubMed] [Green Version]
  89. Ly, H.-B.; Monteiro, E.; Le, T.-T.; Le, V.M.; Dal, M.; Regnier, G.; Pham, B.T. Prediction and Sensitivity Analysis of Bubble Dissolution Time in 3D Selective Laser Sintering Using Ensemble Decision Trees. Materials 2019, 12, 1544. [Google Scholar] [CrossRef] [PubMed] [Green Version]
  90. Ly, H.-B.; Desceliers, C.; Le, L.M.; Le, T.-T.; Pham, B.T.; Nguyen-Ngoc, L.; Doan, V.T.; Le, M. Quantification of Uncertainties on the Critical Buckling Load of Columns under Axial Compression with Uncertain Random Materials. Materials 2019, 12, 1828. [Google Scholar] [CrossRef] [PubMed] [Green Version]
  91. Mordechai, S. Applications of Monte Carlo Method in Science and Engineering; InTech Open: London, UK, 2011; ISBN 978-953-307-691-1. [Google Scholar]
  92. Thanh, T.T.M.; Ly, H.-B.; Pham, B.T. A Possibility of AI Application on Mode-choice Prediction of Transport Users in Hanoi. In Proceedings of the CIGOS 2019, Innovation for Sustainable Infrastructure; Ha-Minh, C., Dao, D.V., Benboudjema, F., Derrible, S., Huynh, D.V.K., Tang, A.M., Eds.; Springer: Singapore, 2020; pp. 1179–1184. [Google Scholar]
  93. Soize, C. Uncertainty Quantification: An Accelerated Course with Advanced Applications in Computational Engineering; Interdisciplinary Applied Mathematics; Springer: Berlin, Germany, 2017; ISBN 978-3-319-54338-3. [Google Scholar]
  94. Cunha, A.; Nasser, R.; Sampaio, R.; Lopes, H.; Breitman, K. Uncertainty quantification through the Monte Carlo method in a cloud computing setting. Comput. Phys. Commun. 2014, 185, 1355–1363. [Google Scholar] [CrossRef] [Green Version]
  95. Le, T.T.; Guilleminot, J.; Soize, C. Stochastic continuum modeling of random interphases from atomistic simulations. Application to a polymer nanocomposite. Comput. Methods Appl. Mech. Eng. 2016, 303, 430–449. [Google Scholar] [CrossRef] [Green Version]
  96. Adeli, H.; Kumar, S. Distributed genetic algorithm for structural optimization. J. Aerosp. Eng. 1995, 8, 156–163. [Google Scholar] [CrossRef]
  97. Adeli, H.; Kumar, S. Distributed Computer Aided Engineering; CRC Press: Boca Raton, FL, USA, 1998; Volume 2. [Google Scholar]
  98. Kumar, S.; Adeli, H. Distributed finite-element analysis on network of workstations—Implementation and applications. J. Struct. Eng. 1995, 121, 1456–1462. [Google Scholar] [CrossRef]
  99. Le, L.M.; Ly, H.-B.; Pham, B.T.; Le, V.M.; Pham, T.A.; Nguyen, D.-H.; Tran, X.-T.; Le, T.-T. Hybrid Artificial Intelligence Approaches for Predicting Buckling Damage of Steel Columns Under Axial Compression. Materials 2019, 12, 1670. [Google Scholar] [CrossRef] [Green Version]
  100. Guilleminot, J.; Le, T.T.; Soize, C. Stochastic framework for modeling the linear apparent behavior of complex materials: Application to random porous materials with interphases. Acta Mech. Sin. 2013, 29, 773–782. [Google Scholar] [CrossRef] [Green Version]
  101. Staber, B.; Guilleminot, J.; Soize, C.; Michopoulos, J.; Iliopoulos, A. Stochastic modeling and identification of a hyperelastic constitutive model for laminated composites. Comput. Methods Appl. Mech. Eng. 2019, 347, 425–444. [Google Scholar] [CrossRef] [Green Version]
  102. Thanh, T.T.M.; Van Dao, D.; Ly, H.-B. Analysis of Tourist Travel Behavior and Recommendation for Active Transport Encouragement Strategies, the Case of Hue City. In CIGOS 2019, Innovation for Sustainable Infrastructure; Ha-Minh, C., Dao, D.V., Benboudjema, F., Derrible, S., Huynh, D.V.K., Tang, A.M., Eds.; Springer: Singapore, 2020; Volume 54, pp. 1049–1055. ISBN 9789811508011. [Google Scholar]
  103. Khosravi, K.; Daggupati, P.; Alami, M.T.; Awadh, S.M.; Ghareb, M.I.; Panahi, M.; Pham, B.T.; Rezaie, F.; Qi, C.; Yaseen, Z.M. Meteorological data mining and hybrid data-intelligence models for reference evaporation simulation: A case study in Iraq. Comput. Electron. Agric. 2019, 167, 105041. [Google Scholar] [CrossRef]
  104. Nguyen, H.-L.; Pham, B.T.; Son, L.H.; Thang, N.T.; Ly, H.-B.; Le, T.-T.; Ho, L.S.; Le, T.-H.; Tien Bui, D. Adaptive Network Based Fuzzy Inference System with Meta-Heuristic Optimizations for International Roughness Index Prediction. Appl. Sci. 2019, 9, 4715. [Google Scholar] [CrossRef] [Green Version]
  105. Pham, B.T.; Son, L.H.; Hoang, T.-A.; Nguyen, D.-M.; Tien Bui, D. Prediction of shear strength of soft soil using machine learning methods. CATENA 2018, 166, 181–191. [Google Scholar] [CrossRef]
  106. Ly, H.-B.; Le, L.M.; Duong, H.T.; Nguyen, T.C.; Pham, T.A.; Le, T.-T.; Le, V.M.; Nguyen-Ngoc, L.; Pham, B.T. Hybrid Artificial Intelligence Approaches for Predicting Critical Buckling Load of Structural Members under Compression Considering the Influence of Initial Geometric Imperfections. Appl. Sci. 2019, 9, 2258. [Google Scholar] [CrossRef] [Green Version]
  107. Dao, D.V.; Trinh, S.H.; Ly, H.-B.; Pham, B.T. Prediction of Compressive Strength of Geopolymer Concrete Using Entirely Steel Slag Aggregates: Novel Hybrid Artificial Intelligence Approaches. Appl. Sci. 2019, 9, 1113. [Google Scholar] [CrossRef] [Green Version]
  108. Ly, H.-B.; Le, T.-T.; Le, L.M.; Tran, V.Q.; Le, V.M.; Vu, H.-L.T.; Nguyen, Q.H.; Pham, B.T. Development of Hybrid Machine Learning Models for Predicting the Critical Buckling Load of I-Shaped Cellular Beams. Appl. Sci. 2019, 9, 5458. [Google Scholar] [CrossRef] [Green Version]
  109. Gupta, R.; Kewalramani, M.A.; Goel, A. Prediction of Concrete Strength Using Neural-Expert System. J. Mater. Civ. Eng. 2006, 18, 462–466. [Google Scholar]
  110. Fazel Zarandi, M.H.; Türksen, I.B.; Sobhani, J.; Ramezanianpour, A.A. Fuzzy polynomial neural networks for approximation of the compressive strength of concrete. Appl. Soft Comput. 2008, 8, 488–498. [Google Scholar] [CrossRef]
  111. Prasad, B.K.R.; Eskandari, H.; Reddy, B.V.V. Prediction of compressive strength of SCC and HPC with high volume fly ash using ANN. Constr. Build. Mater. 2009, 23, 117–128. [Google Scholar] [CrossRef]
  112. Deepa, C.; SathiyaKumari, K.; Sudha, V.P. Prediction of the Compressive Strength of High Performance Concrete Mix using Tree Based Modeling. Int. J. Comput. Appl. IJCA 2010, 6, 18–24. [Google Scholar] [CrossRef]
  113. Chou, J.-S.; Chiu, C.-K.; Farfoura, M.; Al-Taharwa, I. Optimizing the Prediction Accuracy of Concrete Compressive Strength Based on a Comparison of Data-Mining Techniques. J. Comput. Civ. Eng. 2011, 25, 242–253. [Google Scholar] [CrossRef]
  114. Hoang, N.-D.; Pham, A.-D.; Nguyen, Q.-L.; Pham, Q.-N. Estimating Compressive Strength of High Performance Concrete with Gaussian Process Regression Model. Adv. Civ. Eng. 2016, 2016, 2861380. [Google Scholar] [CrossRef] [Green Version]
Figure 1. Architecture of the artificial neural network (ANN) model used in this study involving eight inputs and one output.
Sustainability 12 00830 g001
Figure 2. Concept of the Monte Carlo method for robustness and sensitivity analysis [99].
Sustainability 12 00830 g002
Figure 3. Methodology flowchart of the present study.
Sustainability 12 00830 g003
Figure 4. (a) Error distribution of different models for the training dataset, (b) probability density of errors for the training dataset, (c) Error distribution of different models for the testing dataset, and (d) probability density of errors for the testing dataset,.
Sustainability 12 00830 g004
Figure 5. Correlation results of actual and predicted compressive strength values for the testing part of: (a) GPR-52, (b) GPR-32, (c) GPR-EXP, (d) GPR-SQEXP, (e) GPR-RSQ, and (f) LMNN.
Sustainability 12 00830 g005
Figure 6. Results for the testing dataset over 500 Monte Carlo simulations of different AI algorithms for: (a) coefficient of determination (R2), (b) the corresponding probability density functions for R2, (c) root mean squared error (RMSE), (d) the corresponding probability density functions for RMSE, (e) mean absolute error (MAE), and (f) the corresponding probability density functions for MAE.
Sustainability 12 00830 g006
Figure 7. Statistical results over 500 Monte Carlo simulations using different AI algorithms for the convergence indicators in the cases of: (a) R2, (b) RMSE, and (c) MAE.
Sustainability 12 00830 g007
Figure 8. Probability density functions of quality assessment criteria over 500 MC runs successively excluding the statistical property of X1 to X8, for R2 using (a) LMNN, (b) GPR-32; RMSE using (c) LMNN, (d) GPR-32; MAE using (e) LMNN, (f) GPR-32.
Sustainability 12 00830 g008
Figure 9. Classification of sensitivity of inputs in the prediction of compressive strength, with respect to: (a) R2, (b) RMSE, and (c) MAE.
Sustainability 12 00830 g009
Table 1. Summarized information of input parameters and output in this study.
ComponentMinimumMaximumMeanStD *
X1—Cement (kg/m3)102.00540.00281.17104.51
X2—Blast furnace slag (kg/m3)0.00359.4073.9086.28
X3—Fly ash (kg/m3)0.00200.1054.1964.00
X4—Water (kg/m3)121.80247.00181.5721.35
X5—Superplasticizer (kg/m3)0.0032.206.205.97
X6—Coarse aggregate (kg/m3)801.001145.00872.9277.75
X7—Fine aggregate (kg/m3)594.00992.60773.5880.18
X8—Age (days)1.00365.0045.6663.17
Y—Compressive strength (MPa)2.3382.6035.8216.71
* StD = Standard Deviation.
Table 2. Summary of the performance of artificial intelligence (AI) algorithms.
ComponentR2RMSEMAE
Training part
GPR-52
0.8815.7574.137
GPR-320.8885.5903.996
GPR-EXP0.8735.9534.221
GPR-SQEXP0.8825.7364.143
GPR-RSQ0.8825.7314.184
LMNN0.8935.5114.286
Testing part
GPR-52
0.8845.7024.058
GPR-320.8885.5973.913
GPR-EXP0.8885.6003.924
GPR-SQEXP0.8785.8494.242
GPR-RSQ0.8805.7934.182
LMNN0.8905.4474.274
Table 3. Error values of GPR-32, GPR-52, GPR-EXP, GPR-SQEXP, GPR-RSQ, and LMNN models.
Validation CriteriaR2RMSEMAE
ModelsMinMaxMeanStD *MinMaxMeanStD *MinMaxMeanStD *
GPR-
52
0.7740.9270.8900.0164.657.465.530.383.404.643.960.21
GPR-
32
0.8150.9310.8930.0154.586.755.460.373.304.583.860.21
GPR-
EXP
0.8370.9220.8860.0154.746.835.650.373.334.773.920.22
GPR-
SQEXP
0.7480.9230.8860.0174.757.875.630.373.554.724.100.21
GPR-
RSQ
0.7630.9230.8870.0164.717.645.600.383.484.684.040.21
LMNN0.7800.9230.8760.0204.687.995.870.463.436.204.420.36
* StD refers to Standard Deviation.
Table 4. Highlights of previous works on predicting compressive strength of High-Performance Concrete (HPC) using Artificial-Intelligence-based models.
NrReferenceNumber of DataPrediction Model (Artificial Intelligence Approaches)Average Value of R2Gain in %
1[109]864Neural-Expert System0.760+14.89
2[110]458Fuzzy Polynomial Neural Networks0.8209+8.07
3[111]24Artificial Neural Network0.84+5.94
4[112]300Multilayer Perceptron0.6254+29.97
Linear Regression0.4913+44.98
M5P Model Tree0.7871+11.86
5[113]1030Artificial Neural Network0.9091-1.80
Multiple Regression0.6112+31.56
Support Vector Machine0.8858+0.81
Bagging Regression Trees0.8904+0.29
6[18]239Artificial Neural Network0.81+9.29
Support Vector Machine0.83+7.05
Firefly Algorithm - Least Squares Support Vector Regression0.89+0.34
7[114]239Least Squares Support Vector Machine0.87+2.58
Artificial Neural Network0.81+9.29
8Our study1030Best model: GPR-320.893-

