1. Introduction
Endogenous growth theories are acknowledged for incorporating education, health, and human capital in economic growth analysis, although they do not account for the possible causal interlinks among these human capital components and economic growth. Empirical literature has made remarkable advances by incorporating the associated causal links between education, health, and economic growth, by using advanced causality techniques. Studies that have attempted to examine the causal relationships have mostly looked at bidirectional relationships: education–growth [
1,
2,
3,
4,
5,
6,
7,
8]; health–growth [
9,
10,
11,
12]; or education–health [
13,
14,
15]. These studies produced mixed results, with some observing bidirectional relationships unidirectional from either way and in some cases, no causal links. Less attention, however, has been devoted to the trivariate causality subject for education, health, and economic growth. Empirical studies on the trivariate causality subject are recent and the area has not been vastly explored. The spirit behind the trivariate causality subject is that education and health possibly causally interact in influencing economic growth. As such, it is imperative to model their causal interaction with economic growth in a joint model.
Education is believed to be a health driver, because educated people are more health conscious and likely to invest more resources on healthcare services [
16,
17,
18]. Then again, there is a feedback effect expected from health to education—improved health outcomes are believed to enhance schooling outcomes [
13]. Therefore, an educated and healthy population is more productive and, in turn, expected to contribute more to national output and consequently economic growth, which is, in turn, expected to have a feedback effect on education and health, because improved economic performance implies improved capacity to invest in education, research, and development [
5,
19,
20]. It is therefore reasonable to argue that there are interrelationships between education, health, and economic growth, whereby education is highly associated with health improvements, which, in turn, should fairly associate with driving economic growth, with feedback effects expected to run from either angle. However, as argued earlier, few studies have modeled this interaction in a joint model.
Despite the nation boasting a highly educated population, the Zimbabwean economy has a paradox in that there is a relatively poor health population and low economic growth, which does not accord well with expectations of economic theory. Thus, the focus of this study is to establish whether there is a joint causal interaction between education, health, and economic growth in Zimbabwe, as this will have both empirical and policy significance.
This study is not only interested in correlations but also in causality issues, following the conceptualization that economic growth also has a feedback effect on education and health outcomes. As such, this study uses causality techniques in a multivariate time series framework, where education, health, and economic growth are considered simultaneously in a joint model. Following Poças [
20]), the interaction between the concerned variables under study are explained by a mechanism which is anchored on the cumulative causation characteristic, with increased returns to scale stemming from human health as a contributor to human capital.
Justification of the Study
The trivariate causality among education, health, and economic growth is a recent and thinly-explored area in the empirical literature, with no country-specific study available specifically in Africa. In particular, the subject has only been examined in Africa by [
21] in a panel study, which included Zimbabwe. However, the panel methodological technique used did not quite satisfactorily address the causality subject, as it only produced panel effects/correlations. Such effects are flawed with partiality, because variables might be correlated but not causally linked, as argued by [
22]. In light of this methodological shortcoming, this study uses a vector autoregressive (VAR)/vector error correction model (VECM) methodology which has been successfully applied in accounting for causality issues in the empirical literature. For a Zimbabwean focus, [
23] did a study on health and growth, while [
5] examined the bidirectional causality between education and economic growth. This leaves the trivariate subject an unexplored area, as no standalone study has investigated the joint causality among education, health, and economic growth for Zimbabwe.
2. Overview of the Zimbabwean Economy, Health, and Education Sector
Statistics show that Zimbabwe has been highly characterized by subdued economic performance since the late 1990s. As of 2014, the average growth rate of the Zimbabwean economy stood at 3.17%. Health-wise, life expectancy stood at 55.68 years (which ranks 202 of 220 countries), while in Japan life expectancy averages 84 years. More precisely, a Japanese person is expected to live for 84 years, with 92% of that life in decent health, whereas a baby born in Zimbabwe expects to live for a mere 55 years, with more than five years (about 11%) spent in ill health [
24,
25]. In addition, infant mortality rate in Zimbabwe, as of 2014, stood at 72.3 deaths per 1000 population, which is more than double the global infant mortality rate, averaging 32 deaths per 1000 population [
24]. On the contrary, on the education frontier, the nation ranks top in Africa, boasting a high literacy rate, averaging 98% [
26]. Indeed, Zimbabweans are known worldwide for their educational and skills competency.
Since 1980, the economic performance of Zimbabwe has produced mixed outcomes, as depicted in
Figure 1. Poor policy lapses and adverse weather conditions significantly influenced the agro-based economy, as agricultural output was inconsistent [
27]. In general, economic growth fluctuations were mainly caused by government controls, droughts, and the provision of basic amenities whilst sacrificing increased production capacity, resulting in foreign currency shortages [
27]. Inconsistent policies included the International Monetary Fund (IMF)-backed Economic Structural Adjustment Program (ESAP, 1991–1995) which was abandoned by the government in favor of the Zimbabwe Program for Economic and Social Transformation (ZIMPREST). Consequently, there was an economic crisis in 1997, despite the economy having attained an all-time peak of 9.2% the year earlier. The period 2000–2008 was characterized by hyperinflation, which broke records of modern-day economies and a lowest GDP of −17.56% in 2008 [
24,
25]. Factors which contributed included poor governance, an unstructured land reform program leading to sharp declines in support from international financial institutions, low investment, capital flight, and the Global Financial Crisis. The adoption of the multicurrency regime in 2009, led to a marked recovery in economic growth. The growth rate sharply rose from −17.7% in 2008 to 5.9% in 2009, which further rose to 11.9% in 2011, before subsiding from 2012 onwards.
In terms of education, the government, attempted to redress the imbalances of the colonial regime by improving access to education through the “Growth with Equity” principle and “Education for All” policy. However, the economy was heavily affected by a massive brain drain of teachers and other professionals at the beginning of the 21st century, a trend which subsided after dollarization in 2009 (UNICEF, 2015). Zimbabwe is ranked first on the continent, with the literacy rate at 98% as of 2014 [
26].
The commendable results in the education sector in Zimbabwe cannot be said about investment in the health sector [
28]. The data from the Zimbabwe Demographic and Health Survey 2005/2006 (ZDHS), [
29], Maternal and Perinatal Mortality Study, and other studies reflect that easily preventable and treatable conditions are killing the majority of Zimbabweans. These include malaria, acute respiratory infections, diarrhea, injuries, malnutrition, HIV and AIDS, tuberculosis (TB), pregnancy-related and perinatal complications, hypertension, and mental health disorders, among others. Given the poor health outcomes experienced in the nation, one is prompted to pose a question as to whether the huge investments in health have not been beneficial, as with education investments. Perhaps, the uncertainty and complexity in the health sector, such as the recent cholera and Ebola threats, have disrupted any developmental programs in place. What is worrisome is that the failure of the nation to deal with curable diseases, such as malaria, typhoid, and cholera, is coupled with high cases of tuberculosis. The HIV/AIDS pandemic accounted for about 50% of the disease burden in the nation by 2009. Life expectancy dropped from an average of 60 years to reach 47.8 years in 1997, which worsened to 44.9 years by the end of the decade. By 2009, the life expectancy for women was only 34 years [
28]. Infant mortality similarly worsened. In general, as the economy down spiraled in the early 1990s, so did the health indicators. However, the government managed to decrease the HIV prevalence from around 30% in the 1990s to 14.3% (1.4 million) in 2014, mainly due to the 3% AIDS levy on taxable income which was introduced in 2000. When the economy showed positive growth between 2009 and 2012, relations between the Zimbabwean government and the international donor community also improved, with reengagement and partnership between the two resuscitated [
28].
3. Literature Review
The original exogenous growth model by Solow and Swan frameworks offered a useful starting point for analyzing economic growth but omitted the role of human capital [
30,
31]. Solow’s work was later augmented to include education human capital by Mankiw, Romer, and Weil (MRW) [
32]. However, the human capital introduced by MRW [
32] was narrowly defined as education, yet health also forms part of human capital. Generally, endogenous growth theories introduced the role of human capital and education in the process of economic growth, notably [
33,
34], and later on emphasized in the human capital-augmented Solow model of MRW [
32]. They argued that economies which have a faster growth rate in education will have faster rates of transition, leading to higher incomes. They extended a simple Solow model by imputing human capital as a separate variable into the Cobb–Douglas production function in a labor-augmenting in a Harrod-neutral framework with technological progress. The improved model, commonly referred to as the capital-augmented Solow model, is given by:
where
, and
,
is output,
is capital,
represents stock of human capital (education),
represents technology level, and
is “raw” labor.
and
are output elasticities. A reasonable assumption by MRW (1992) is that
, which implies constant returns to scale (CRTS), although they are diminishing returns to reproducible factors. Introducing logs and differentiating Equation (1) with respect to time yields a growth equation of the form:
where
represents the growth rate of the economy,
and
are growth rates in the stock of physical and education human capital, respectively, and
is some residual constant. However, the MRW extension only incorporated education human capital but did not include the health component. Ram later showed that while education does very well in the MRW framework, as they reported, health (captured by life expectancy) better explains economic growth, if included in the growth regression [
35]. Incorporating health human capital in Equation (1) yields the following intensive form production function:
where
,
,
, and
, with
representing health human capital. As such, the variant of the MRW growth equation that should be estimated becomes:
where
,
, and
are as defined before, while
represent the growth rate in the health human capital stock. In this regard, most empirical literature on the human capital–growth nexus follows the MRW (1992) regression approach.
However, emphasis should be on the fact that the human capital-augmented Solow model by MRW (1992) omitted the possible feedback effect of economic growth on education and health human capital [
33,
34,
36]. Abstracting from MRW’s view that education human capital enters the production function as a separate input, endogenous growth theories earlier on had considered education as a process that changes the production technology itself. In addition, education facilitates the adoption of foreign technology [
36,
37,
38,
39,
40,
41,
42,
43].
Nelson and Phelps [
36] argued that higher human capital levels accelerate technological diffusion, thereby enabling countries lagging behind to ‘catch up’. However, their model identified technology as exogenous and human capital plays the role of narrowing that gap. Romer [
43] extended the concept and highlighted that not only will economies adopt new technologies, but they will also create new ones through observation and research and development [
33]. The implication is that the rate of technological process and growth is a function of human capital stock and not necessarily its accumulation.
Differing from the human capital–growth conceptualization by [
33,
34] argued that human capital should be viewed as cumulative with positive externalities and as the engine of long-run economic growth. The accumulation of human capital increases physical capital and labor productivity. The premise of Lucas’ thinking is that educated people are more efficient, an argument complemented by Poças [
20], who demonstrated that education enhances productivity through the stimulation of physical investment, investment in technology, and improved competencies [
44]. Lucas [
34] considered human capital as entering the production function in a labor-augmenting way. Lucas proposed the following production technology:
where
,
and
represent output, technology, capital, and labor; while
is the proportion of time devoted to work,
represents the level of skill (human capital),
is the average human capital in the economy, and
is the level of technology, which is a constant. Although the Lucas model made a major breakthrough by incorporating human capital in the growth process, it, similar to exogenous models, did not account for the possibility of a feedback effect from economic growth to human capital. However, empirical evidence has conceptualized the idea that economic growth also has the effect of improving human capital accumulation.
Endogenous growth theories consider health and education separately in explaining economic growth, with not much emphasis on the education–health interaction. Following [
37,
38,
39], education and health are likely to interact in affecting economic growth and, as such, it appears imperative to consider their interconnection and effect on economic growth within a joint model. Such a development had earlier on been strongly advocated for [
40]. This paper considers both education and health human capital jointly in explaining economic growth. Apart from narrowly focusing on either education or health in analyzing economic growth, the endogenous growth theories, together with [
32], omitted the possibility of a feedback effect of economic growth on education and health. In this vein, some empirical studies have shown that economic growth indeed has a feedback effect on human capital development (see, for instance, [
1,
2,
3,
7,
8,
9,
10,
38,
41,
42]). The idea is that economic growth is associated with improvements in per capita incomes, which implies improvements in standards of living for the population, thus, individuals should be able to invest more in education and health services.
Generally, education human capital affects economic growth through four main channels. First, and in the sense of [
34], education enhances productivity. The second channel relates to labor market participation. Thus, human capital investment increases the chances of finding a job in the labor market. Thirdly is the argument that a more skilled workforce utilizes domestic and foreign investment more effectively, which will have multiplier effects on the growth of the economy. The fourth link works through the income effect of human capital, which promotes better product variety and innovation, as demonstrated by Romer’s [
43] endogenous growth model.
On the other hand, health affects the growth of the economy through four main channels: productive efficiency, labor supply, education, and capital formation. First, health, like education, conditions the productivity and efficiency of individuals, as healthier workers have more energy and are more creative [
40,
41,
45]. Second, and important in this study, it has been documented that health affects economic growth via its effect on education [
13,
39]. This rests on the notion that improved health in the early phases of life has an indirect contribution to future productivity through increased education and skill acquisition. Health improvements raise the incentive to acquire education, lower absenteeism, and increase cognitive functioning. Third, health has a link with capital formation. In this vein, health affects both the ability and impetus to save [
9,
11,
12,
13,
41]. Fourth, though theoretically ambiguous, health has an impact on labor supply. On one end there is the substitution effect, which states that improvements in health are associated with wage increments and hence the inducements to increase labor supply. On the other end is the income effect, as being healthy allows for higher lifetime earnings [
1,
3,
5,
7,
41].
If these theoretical propositions are true, then there seems to be an apparent paradox in Zimbabwe in that the nation has experienced subdued economic performance over the years, coupled with poor population health in the face of a highly educated population. This seemingly existing paradox prompts a question as to whether there is no causal relationship existing among education, health, and economic growth in Zimbabwe. In addition, there is a documented stylized fact that developing countries are associated with low income growth rates, poor population health, and low educational levels. However, the Zimbabwean situation does not accord well with such findings in that there is low health–low growth, despite the nation being highly endowed with an educated workforce.
Empirically, some studies have attempted to investigate the trivariate causality subject. Firstly, some have used government expenditure on health and education as proxies for education and health human capital [
20,
46,
47,
48,
49]. However, such proxies may not satisfactorily reflect education and health human capital in a country like Zimbabwe, where there are a lot of inefficiencies associated with the use of public funds. Against this backdrop, this study uses tertiary enrolment rates and life expectancy as education and health proxies, respectively. Second, other studies have used panel techniques in analyzing the trivariate interrelationships [
21,
39,
50]. Zimbabwe was included in one such panel study by Eggoh et al. [
21]. Nonetheless, it is well known that two variables may be highly correlated but not automatically causally linked [
22].
4. Methodology
The literature reviewed in this study indicated that no specific theory addressed the possible joint interaction associated with causal links among the three variables under consideration. Thus, this study employed the vector autoregressive (VAR) model because of its ability to capture endogeneity among all variables. It should be noted that the VAR framework is empirically informed and has no theoretical framework [
5]. However, inferences drawn from employing a VAR framework may be sensitive to model specification. Thus, pre-estimation tests to assess the properties of the time series data were conducted. These included unit root tests and Granger Causality tests.
Generally, a variable is integrated of order
k, if it becomes stationary after differencing
k times. With the purpose of identifying any trend(s) in the data, stationarity is vital in avoiding spurious regressions. Spurious regressions arise in time series regressions, where one often obtains a very high R
2 (in excess of 0.9) even though there is no meaningful relationship [
22]. The most common unit root tests are the augmented Dickey–Fuller (ADF) and Phillips–Perron (PP) test. Given that these tests provide the same results, this study used the conventional ADF test for stationarity testing.
Granger causality is a statistical concept of causality that is based on prediction, which is used to test whether one variable is useful in forecasting another variable. Granger causality rests on two assumptions. First, the future cannot cause the past—the past causes the present or the future. Second, a cause contains unique information about an effect not available elsewhere. Put differently, the information relevant to the prediction of the respective variables is solely contained in the time series data on these variables [
22]. The test was offered by Granger and Sims and was motivated by the observation that the existence of a relationship between variables does not prove causality or the direction of influence (correlation does not imply causality) [
51,
52,
53,
54]. This study focused on establishing the nature of causality among economic growth, education, and health.
The mathematical formulation of the Granger causality test is based on linear regression modeling of stochastic processes [
52]. A time series
Granger causes time series
if past values of
provide statistically significant information about the future values of series
. Given:
time series
Granger causes time series
if any or all of
are statistically significant. The proper way to do Granger causality testing is to test the hypothesis:
. Time series
Granger causes time series
if the hypothesis is rejected. The joint testing is done using the F-statistic, where a probability value less than 10% or an absolute F-statistic of at least two confirms the existence of causality claim. In the trivariate regression, joint causality was suggested when the sets of education, health, and economic growth coefficients were statistically significantly different from zero.
The paper employed the vector autoregressive (VAR) model, given that the thrust of the study was on causality issues. Although VAR models do not have sound theoretical frameworks, Zivengwa [
5] argued that they can be used to test interdependent relationships between variables. Unit root and Granger causality tests were outlined before the model specification, as specified by Gujarati [
22]. The augmented Dickey–Fuller (ADF) tests were used in this paper for stationarity tests. The optimal lag,
k, length in the VAR model was determined by the Akaike information criterion (AIC) in order to minimize the possibility of multicollinearity due to too many lagged degrees of freedom, whilst too few lags might also lead to specification errors [
22]. The estimated VAR model consisted of three variables, education, health, and economic growth, and was applied to the data set in the form of a trivariate model. Subsequently, a parsimonious trivariate VAR model of the following form was formulated:
In the specified equations, is economic growth, is education, and is health, while , , and are the related coefficients and the s are white noise disturbances, known as shocks in VAR language. The are constants known as drifts, whereas is the number of lags, with being the optimal lag length.
If all the three variables were integrated of the same order, say one, and there was cointegration, then a vector error correction mechanism (VECM) was constructed, in which case all the variables entered the trivariate regression in their first differenced form. On the other hand, an unrestricted VAR framework was employed if the variables were integrated of different orders, because similar order of integration nullifies cointegration and consequently the use of VECM [
5] Cointegration means that even though individuals are nonstationary, a linear combination of two or more series is stationary; that is, there is a long run or equilibrium relationship between two variables. A cointegration test was performed using the Johansen cointegration test [
37].
The study also provided variance decomposition (VDC) analysis, which informed us of the relative importance of each random shock by showing forecast error variance for each endogenous variable. Moreover, the paper analyzed the impulse response function (IRF) which traced out the response of current and future values of a variable to a one-unit increase in the current value of one of the VAR errors [
55]. The IRF assumes that the associated error returns to zero in subsequent phases. IRF shows the dynamic effects of a shock to both other variables and itself.
Explanation of Variables
The paper employed the rate of growth of real GDP to measure economic growth (
). Real GDP measures the health of the economy and the variable is used extensively in economic literature [
50]. However, similar to most measures of economic growth, real GDP growth omits inequalities in income distribution, which is an issue of concern in developing nations like Zimbabwe. Although literacy is mostly used as an education indicator in most empirical literature, this paper employed tertiary enrolment due to data availability.
This study acknowledged that literacy level as proxied by either primary or secondary enrolment is mostly employed in the majority of empirical literature [
56,
57,
58,
59,
60]. However, this study employed tertiary enrolment because, in line with [
5,
19,
39], it inferred that tertiary enrolment contributes directly to skilled human capital and is closely related to the quality of education in Zimbabwe. In other words, tertiary enrolment was deemed a better proxy for education in the case of Zimbabwe since it captures both quantity and quality of education. According to the 2014 World Bank survey, the literacy rate for Zimbabwe was 88.7%. However, literacy rate could not be employed for time series analysis because it is in surveys (1982, 1992, 2011, and 2014). On the other hand, UNESCO (2019) statistics indicate that the secondary enrolment level for Zimbabwe is around 1,953,352, whilst that of tertiary enrolment is 1,354,863, indicating that 70% of the secondary-enrolled students transition into tertiary level. This is because Zimbabwe is a very small economy with more than 10 universities and an even greater number of diploma-level institutions. Moreover, the secondary going age for Zimbabweans is 13 to 18 years, whilst the tertiary going age is 19 to 23 years. Since the legal age of majority is 18 years, the authors employed the rationale that decisions concerning health matters are made beyond 18. With the exception of [
44] and [
50], it is worth noting that studies on the trivariate subject have mostly used the share of public education and health expenditures to GDP as proxies for education and health human capital. However, in developing countries, there are some inherent inefficiency, corruption, bureaucratic, and governance issues associated with the use of public funds, which jeopardize the achievement of their intended objectives, thereby compromising the expected value-for-money, productivity, and growth effects. Inefficiencies in the utilization of public funds in developing countries, like Zimbabwe, possibly lessen the expected growth-stimulating effect of investment in human capital. Against this backdrop, this study used tertiary enrolment as a proxy for education and life expectancy as a health indicator in establishing whether there is a triangular causality among education, health, and economic growth in Zimbabwe.
Life expectancy at birth (LEB) as a measure of health (
) was employed ahead of other aggregate health indicators like mortality rates. LEB quantifies the expected years an infant is to live if the conditions are to remain
ceteris paribus throughout the life cycle of the child. LEB is an internationally-recognized indicator (used in measuring the Human Development Index (HDI)) as a basic indicator of health and social development. It also indicates the general mortality level, as it summarizes mortality patterns across all ages. Data were sourced from the World Bank Development Indicators [
24], and Zimbabwe Statistics [
26] spanning from 1980 to 2014 were employed due to the availability of consistent data.
5. Results
Descriptive statistics indicated, using 35 observations, that average life expectancy is 53.22 years, the average tertiary enrolment rate is 1.64%, while the economy grew by an estimated 1.86%. The coefficients of skewness were negative for health (LE00) (−0.2718) and economic growth (GDPG) (−0.7073) and positive for education (TERT) (0.7702), indicating that LE00 and GDPG were negatively skewed, whereas TERT was positively skewed. Importantly,
Table 1 shows a reasonable degree of dispersion among sample variables, which suggest that outliers did not exist. Thus, data were not transformed.
In terms of stationarity, the augmented Dickey–Fuller (ADF) results showed that economic growth (GDPG) and health (LE00) were stationary in levels at 5% and 1% significance levels, respectively, while education (TERT) was stationary at first difference, after which it is named DTERT. In terms of integration, GDPG and LE00 were integrated to order zero, whereas DTERT was integrated to the first order, implying no cointegration likelihood because variables were integrated to different orders. Thus, only an unrestricted VAR model could be estimated, whilst nullifying the use of VECM. Therefore, the variables were used to test for pairwise Granger causality and entered the VAR model according to their stationarity level. The AIC showed that the lag-length was 2. The table below shows the Granger causality results.
5.1. Granger Causality
The results indicate that there is a unidirectional causal relationship running from education (DTERT) to health (LE00), since the null hypothesis of non-causation was rejected at the 5% level of significance. This implies that education is a driving force of health improvements, as it results in increased life expectancy. However, the reverse causality from health to education was found to be insignificant. Moreover, the results showed a unidirectional causal relationship from health (LE00) to economic growth (GDPG). This is because the null hypothesis of non-causation was rejected at 10% level of significance. Thus, improvements in health cause improvements in economic growth rate. There was, however, no feedback effect from improved economic growth rate to health. The Granger causality results showed no support of a joint causation among education, health, and economic growth. This is because only two out of six of the non-causation claims were rejected. The results showed no direct causal effect of education on economic growth rate. Based on the causality results, it is reasonable to argue that education affects economic growth via its effect on health.
5.2. Vector Autoregression (VAR) Model Results
The distribution lag coefficients estimated using the VAR model did not offer a rich understanding of the implied dynamic model behavior (see
Supplementary Table S5 for detailed VAR results). Thus, attention was paid to variance decomposition and impulse response function analysis, as argued by [
61] and [
22].
5.2.1. Variance Decomposition (VDC) Analysis
In line with the AIC lag length of 2, the VDC results are presented in
Table 2,
Table 3 and
Table 4 below.
The tables indicate that standard errors (SE) rose steadily to period 10, plausibly resembling the uncertainty effects over time. Of note is that own series shock explained most of the error variance, even though the shock will also impact the other variables in the model. The VDC analysis showed that there was no variable which was entirely self-explained or exogenous, since variables failed to explain all (100%) their shocks or innovations at period 10. More precisely, and as indicated in period 10 across all tables, the forecast error variance for health, education, and economic growth rate were 86.66%, 97.78%, and 58.03% respectively.
Table 1 indicates that over time, education (DTERT) gradually affected more of health (LE00). Interestingly, at period 1, health was entirely exogenous, as it was totally explained by its own innovations. More precisely, 13.1% of LE00 forecast error variance in a ten-year period was explained by disturbances in education. Thus, the variation in health can be explained by past education level in the long-run, while the slightest part (0.23%) of these variations are related to the economic growth rate. This confirms other causality results, which indicated that education Granger causes health.
Table 2 shows that less than 3% of shocks in education (DTERT) were attributed to health (LE00) and economic growth rate (GDPG) shocks throughout the period. Therefore, the predominant source of variation in education is education (DTERT) itself, thereby confirming that neither health nor economic growth rate cause education. From
Table 3, deviations in economic growth rate were as a result of health (LE00) variations, with the health effect on economic growth significantly increasing over time. This attests to the fact that health causes economic growth. Specifically, at period 10, 21.89% of past health levels explained the variation in economic growth rate and 58.03% of past economic growth rates explained the same variation, while 20.07% of past education levels explained the variation in economic growth rate. This means that education shocks play a more significant role in explaining long-run economic growth rate, although health shocks account for about one-quintile.
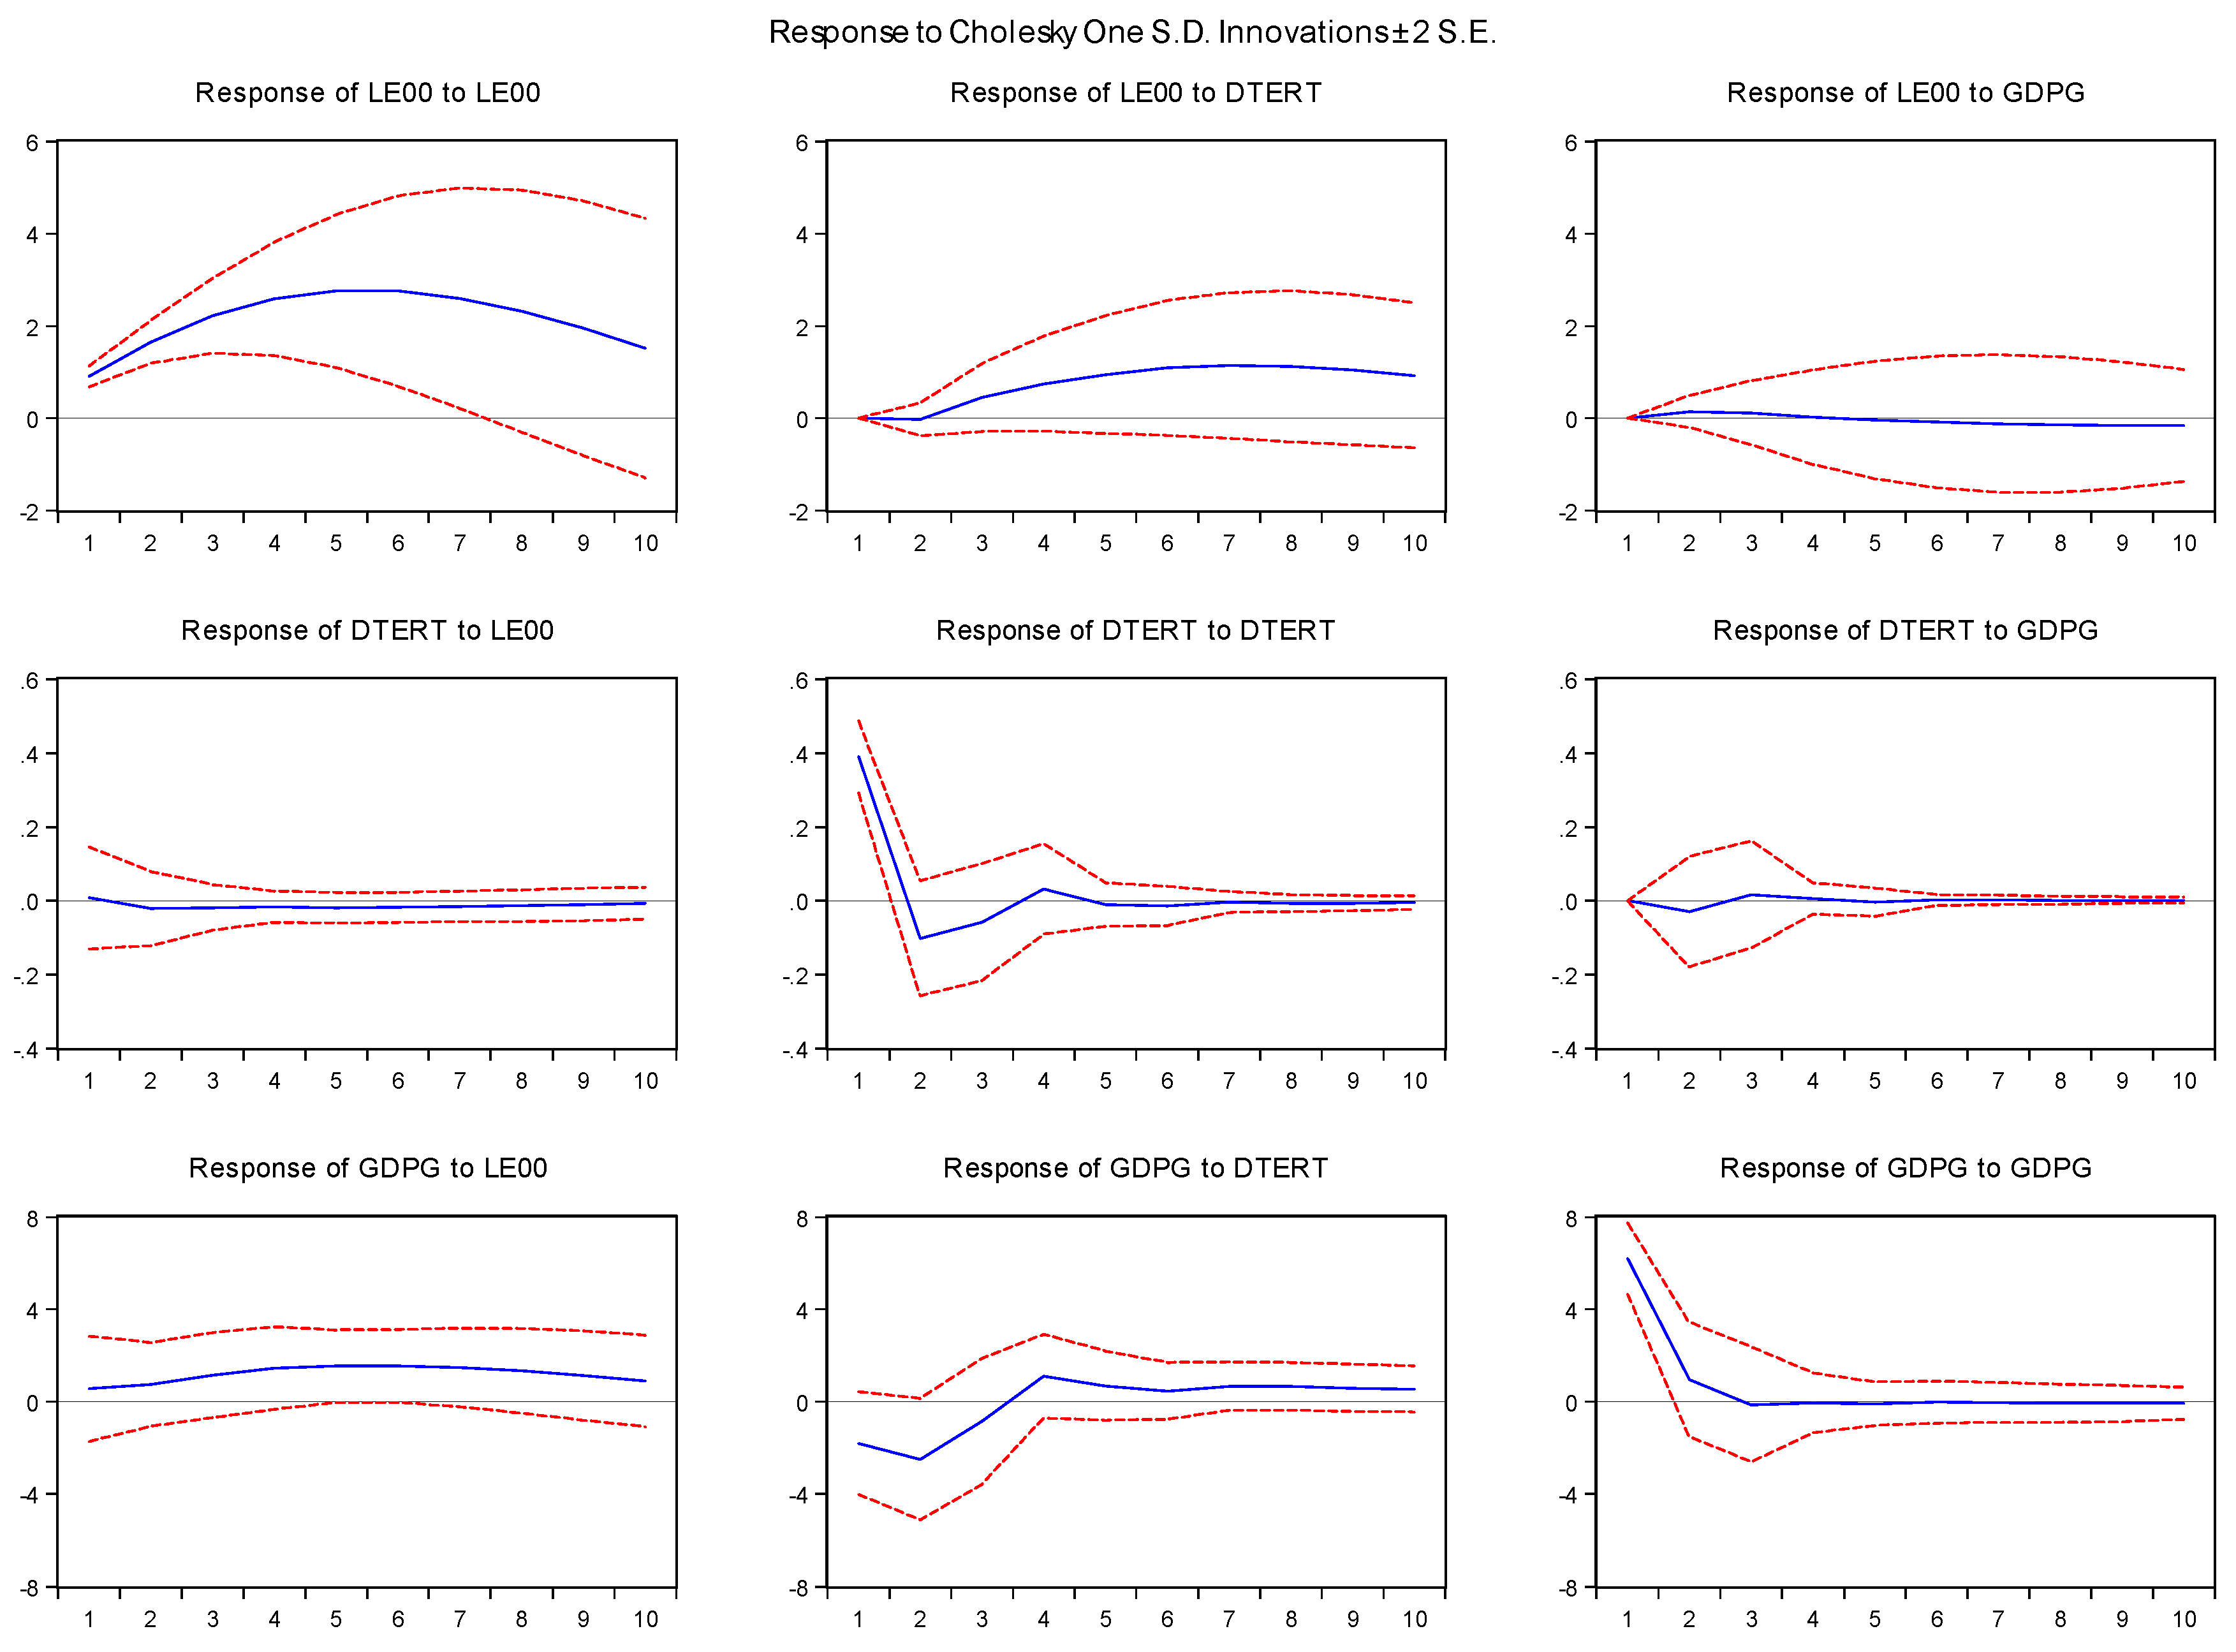
5.2.2. Impulse Response Function (IRF)
The figure below indicates the results of the IRF.
In general, the IRF analysis complemented the Granger causality test results by signifying the dynamic effects of a shock both on itself and other variables. The system of equations was stable if any shock declined to zero; otherwise it was unstable if it produced an explosive time path.
Figure 1 shows the IRFs for education (DTERT), health (LE00), and economic growth rate (GDPG), which are the responses of the three variables to each shock over a ten-year horizon. The following policy recommendations were drawn from the discussed results.
6. Policy Recommendations
The education–health one-way causal interaction is very much significant for policy formulation in Zimbabwe. This is because one may question why, despite Granger causality effects showing education causally affects growth, Zimbabwe is still characterized by poor population health, while it boasts of highly educated people. An immediate response would be because education alone cannot entirely improve population health. For instance, Zimbabweans may be highly educated, which implies being more health-conscious and aware of the significance of investing in quality health services, but may be limited in doing so because of unemployment and low per capita incomes.
Although education was observed to be important for health on one hand, health was also observed to be fairly important for economic growth on the other hand. Thus, the policy implication stemming from the causal interaction is that it is worthwhile for Zimbabwean policy makers to invest in education in order to improve the health of the population, which in turn is considered to be growth-enhancing. The causal effect of education on health would call for education to the extent that externalities exist. Thus, the paper advocates for an ‘Education-for-Health’ policy, which is anchored on the notion that highly educated people may create positive externalities economy-wide. This will provide a healthy life and better awareness to the people of Zimbabwe, which is envisaged to improve workers’ quality of life and consequently their productivity. On the other hand, the Granger causality effects of health on economic growth suggest that policy makers should consider expenditure on health as an investment as opposed to a cost. In this regard, the Zimbabwean government is encouraged to align its expenditures with the Abuja (2001) declaration, which advocates for an allocation of at least 15% of the total budget to the health sector. Given the generally accepted stylized fact that health is a component of human capital, increasing it should, in turn, enhance worker productivity, which would then lead to greater output per worker and, ultimately, enhanced economic growth. In this sense, it is reasonable to argue that education and health policies do not have an effect within their own domain, but rather in a complementary way. These policies should not be looked upon in isolation, but rather in a more comprehensive and integrated way.
7. Conclusions
The major objective of the study was to establish the existence of a joint (trivariate) causation tendency among education, health, and economic growth in Zimbabwe. This was achieved using an unrestricted VAR framework, since unit root tests nullified the possibility of cointegration, and consequently a VECM was deemed inappropriate. More importantly, no specific theory could be attributed to addressing causal links among the three variables. As argued earlier, economic theory is mainly one-faceted in analyzing the human capital–growth nexus, devoting little or no attention to possible causal interlinks. Thus, the VAR/VECM methodological framework was considered suitable, since it requires no a priori theoretical specifications.
Empirical results indicated that education Granger causes health, while health Granger causes economic growth. However, no feedback effect running from health to education or from economic growth to health was observed. The results clearly refute a joint causation among education, health, and economic growth in Zimbabwe. Importantly, the VDC and IRF analyses supported the Granger causality results. These findings are significant because they indicate that none of the concerned variables are purely exogenous, although the degree of endogeneity varied depending on the variable.
An important conclusion drawn from the results is that the effect of education on economic growth is not direct, but works through health. What the results suggest is that better health in the form of higher life expectancy, enabled by better education, may lead to adults participating more extensively in the labor market, allowing them to obtain higher per capita incomes. Since the combined results found no support of a joint causality among education, health, and economic growth, an important conclusion stemming from the Granger causality tests and VAR analysis is that there is an interaction effect of education on health that is significant for economic growth.


