A Study of the Water and Sediment Transport Laws and Equilibrium Stability of Fluvial Facies in the Ningxia Section of the Yellow River under Variable Conditions

Abstract
:1. Introduction
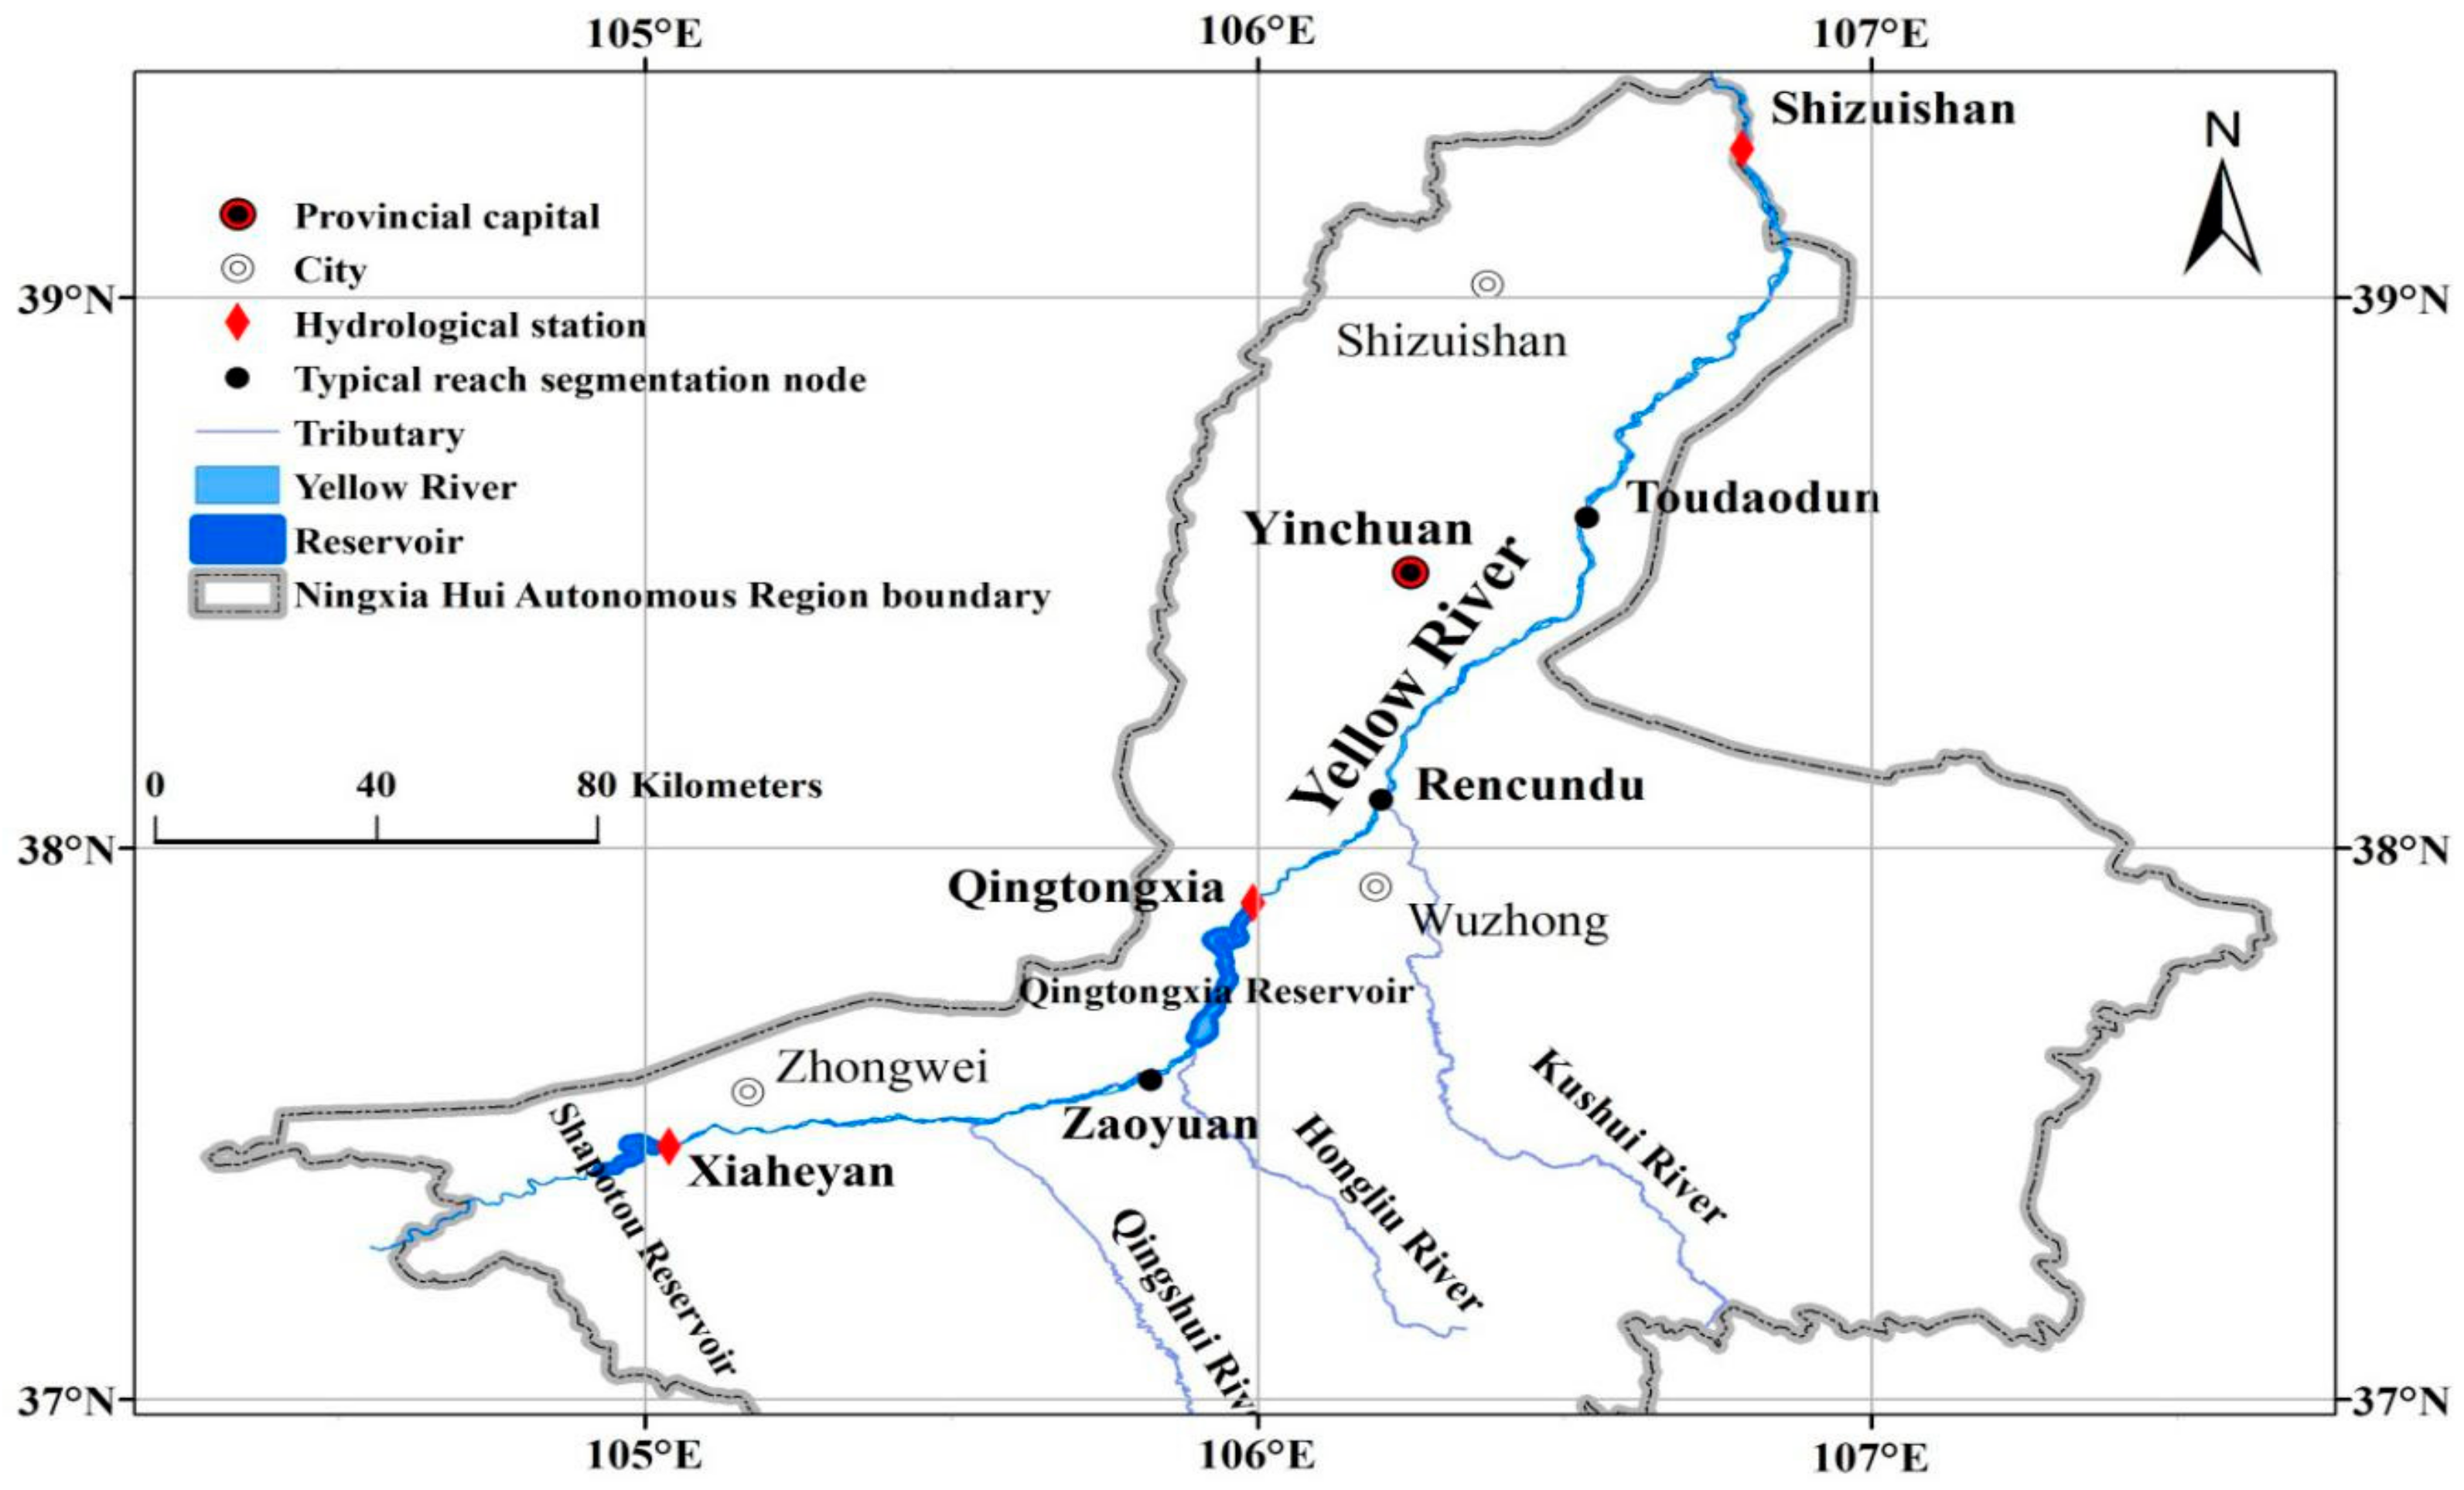
2. Research Area
3. Materials and Methods
3.1. Materials
3.2. Methods
4. Results
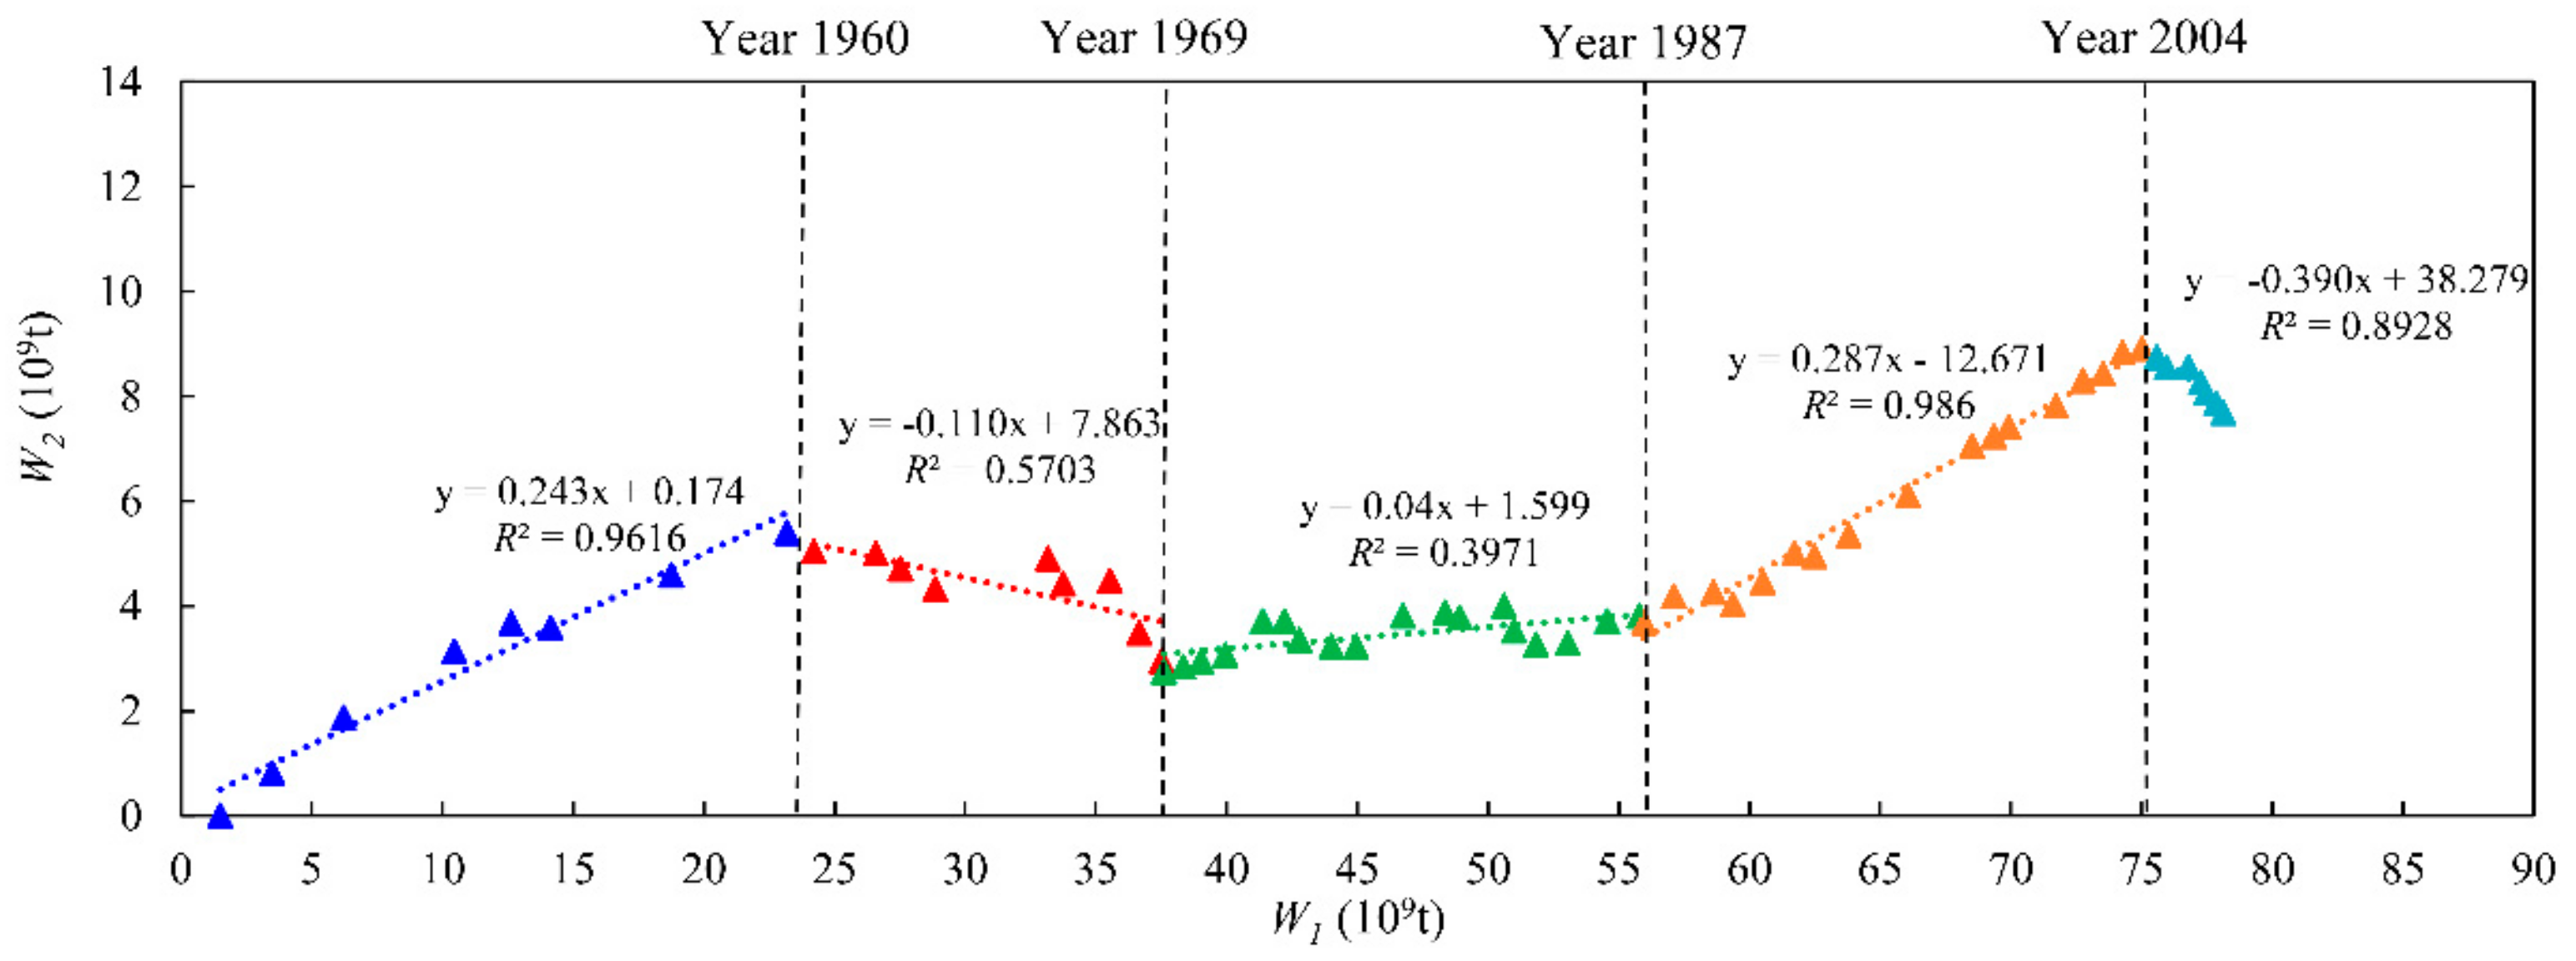
4.1. Relationship between the Annual Amounts of Scouring and Silting and the Water and Sediment
4.2. Variations in the Fluvial Facies Coefficients of the Cross-Section along the Line
4.3. Equilibrium Fluvial Facies Relationship
4.3.1. Variations in the Average River Bottom Elevations in the Typical Sections
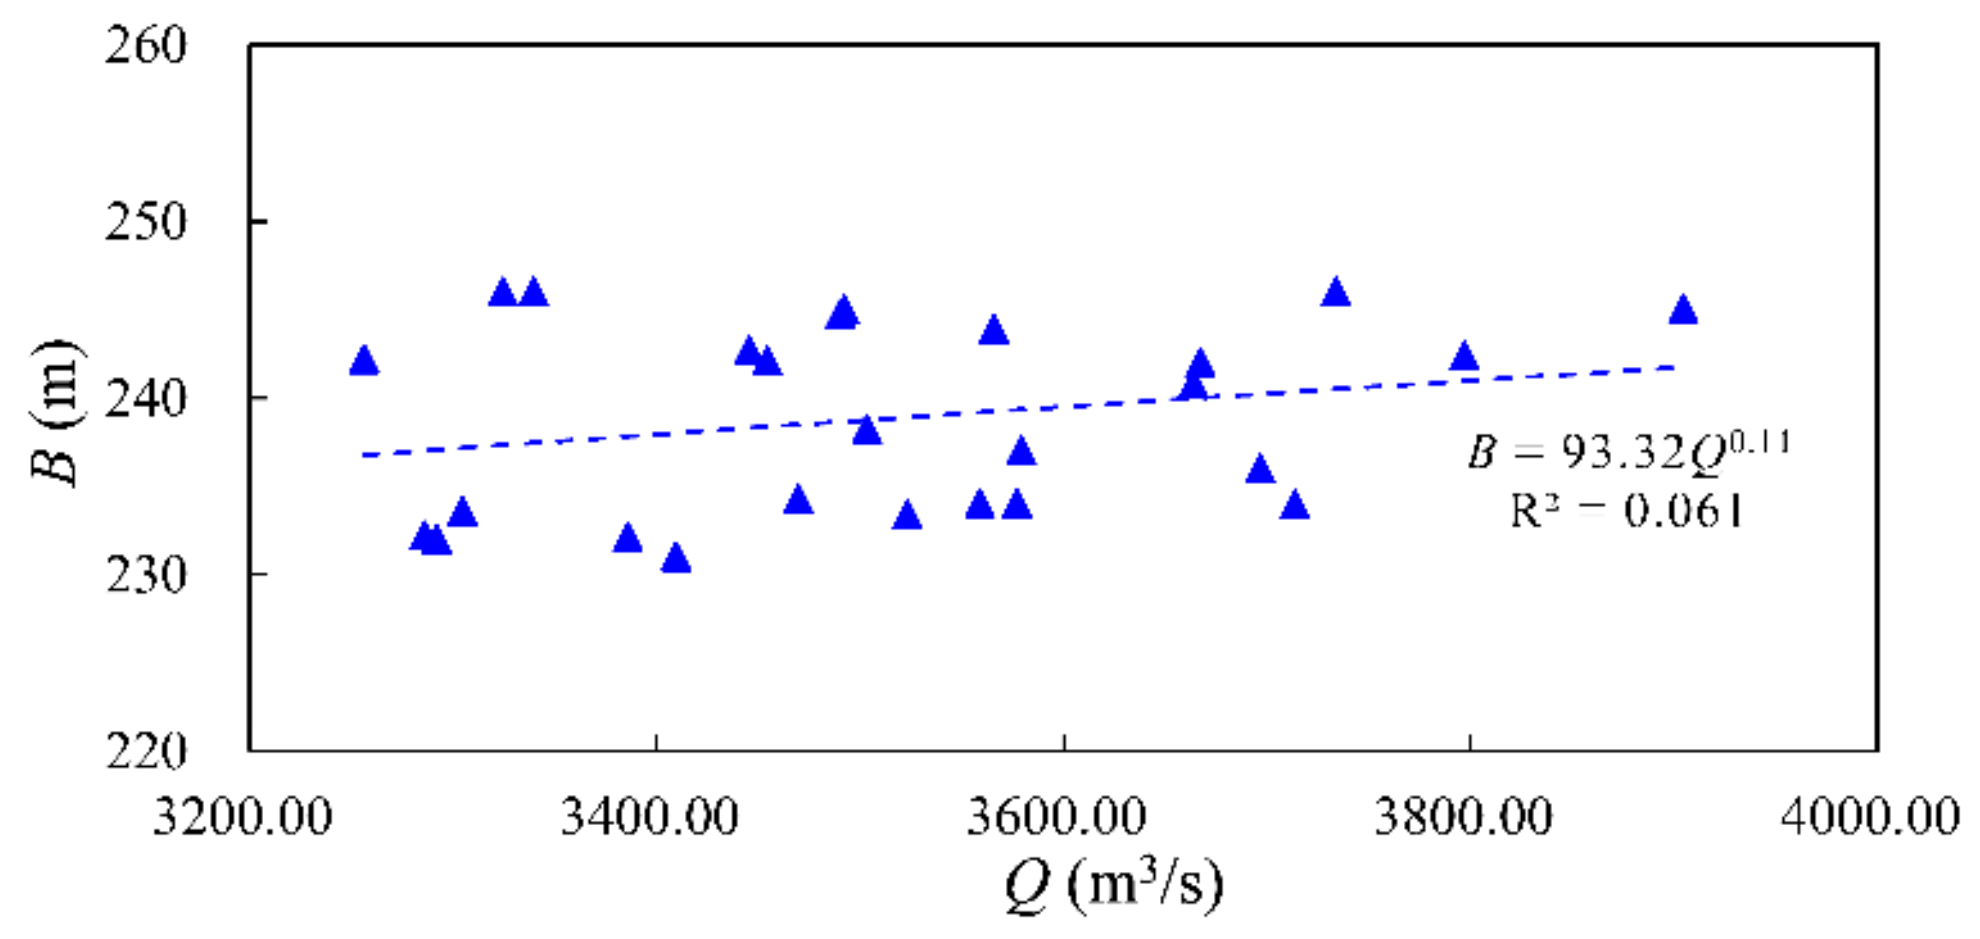
4.3.2. Variations in the Bank Full Channel Areas of the Typical Sections
4.3.3. Change Processes of the Bed-Building Discharge Over Time in the Typical Sections
5. Discussion
5.1. Relationship between the Cumulative Scouring and Silting and the Incoming Sediment in the Qingshi Section of the Ningxia Area
5.2. Variations in the Fluvial Facies Coefficients of the Cross-Sections along the Line
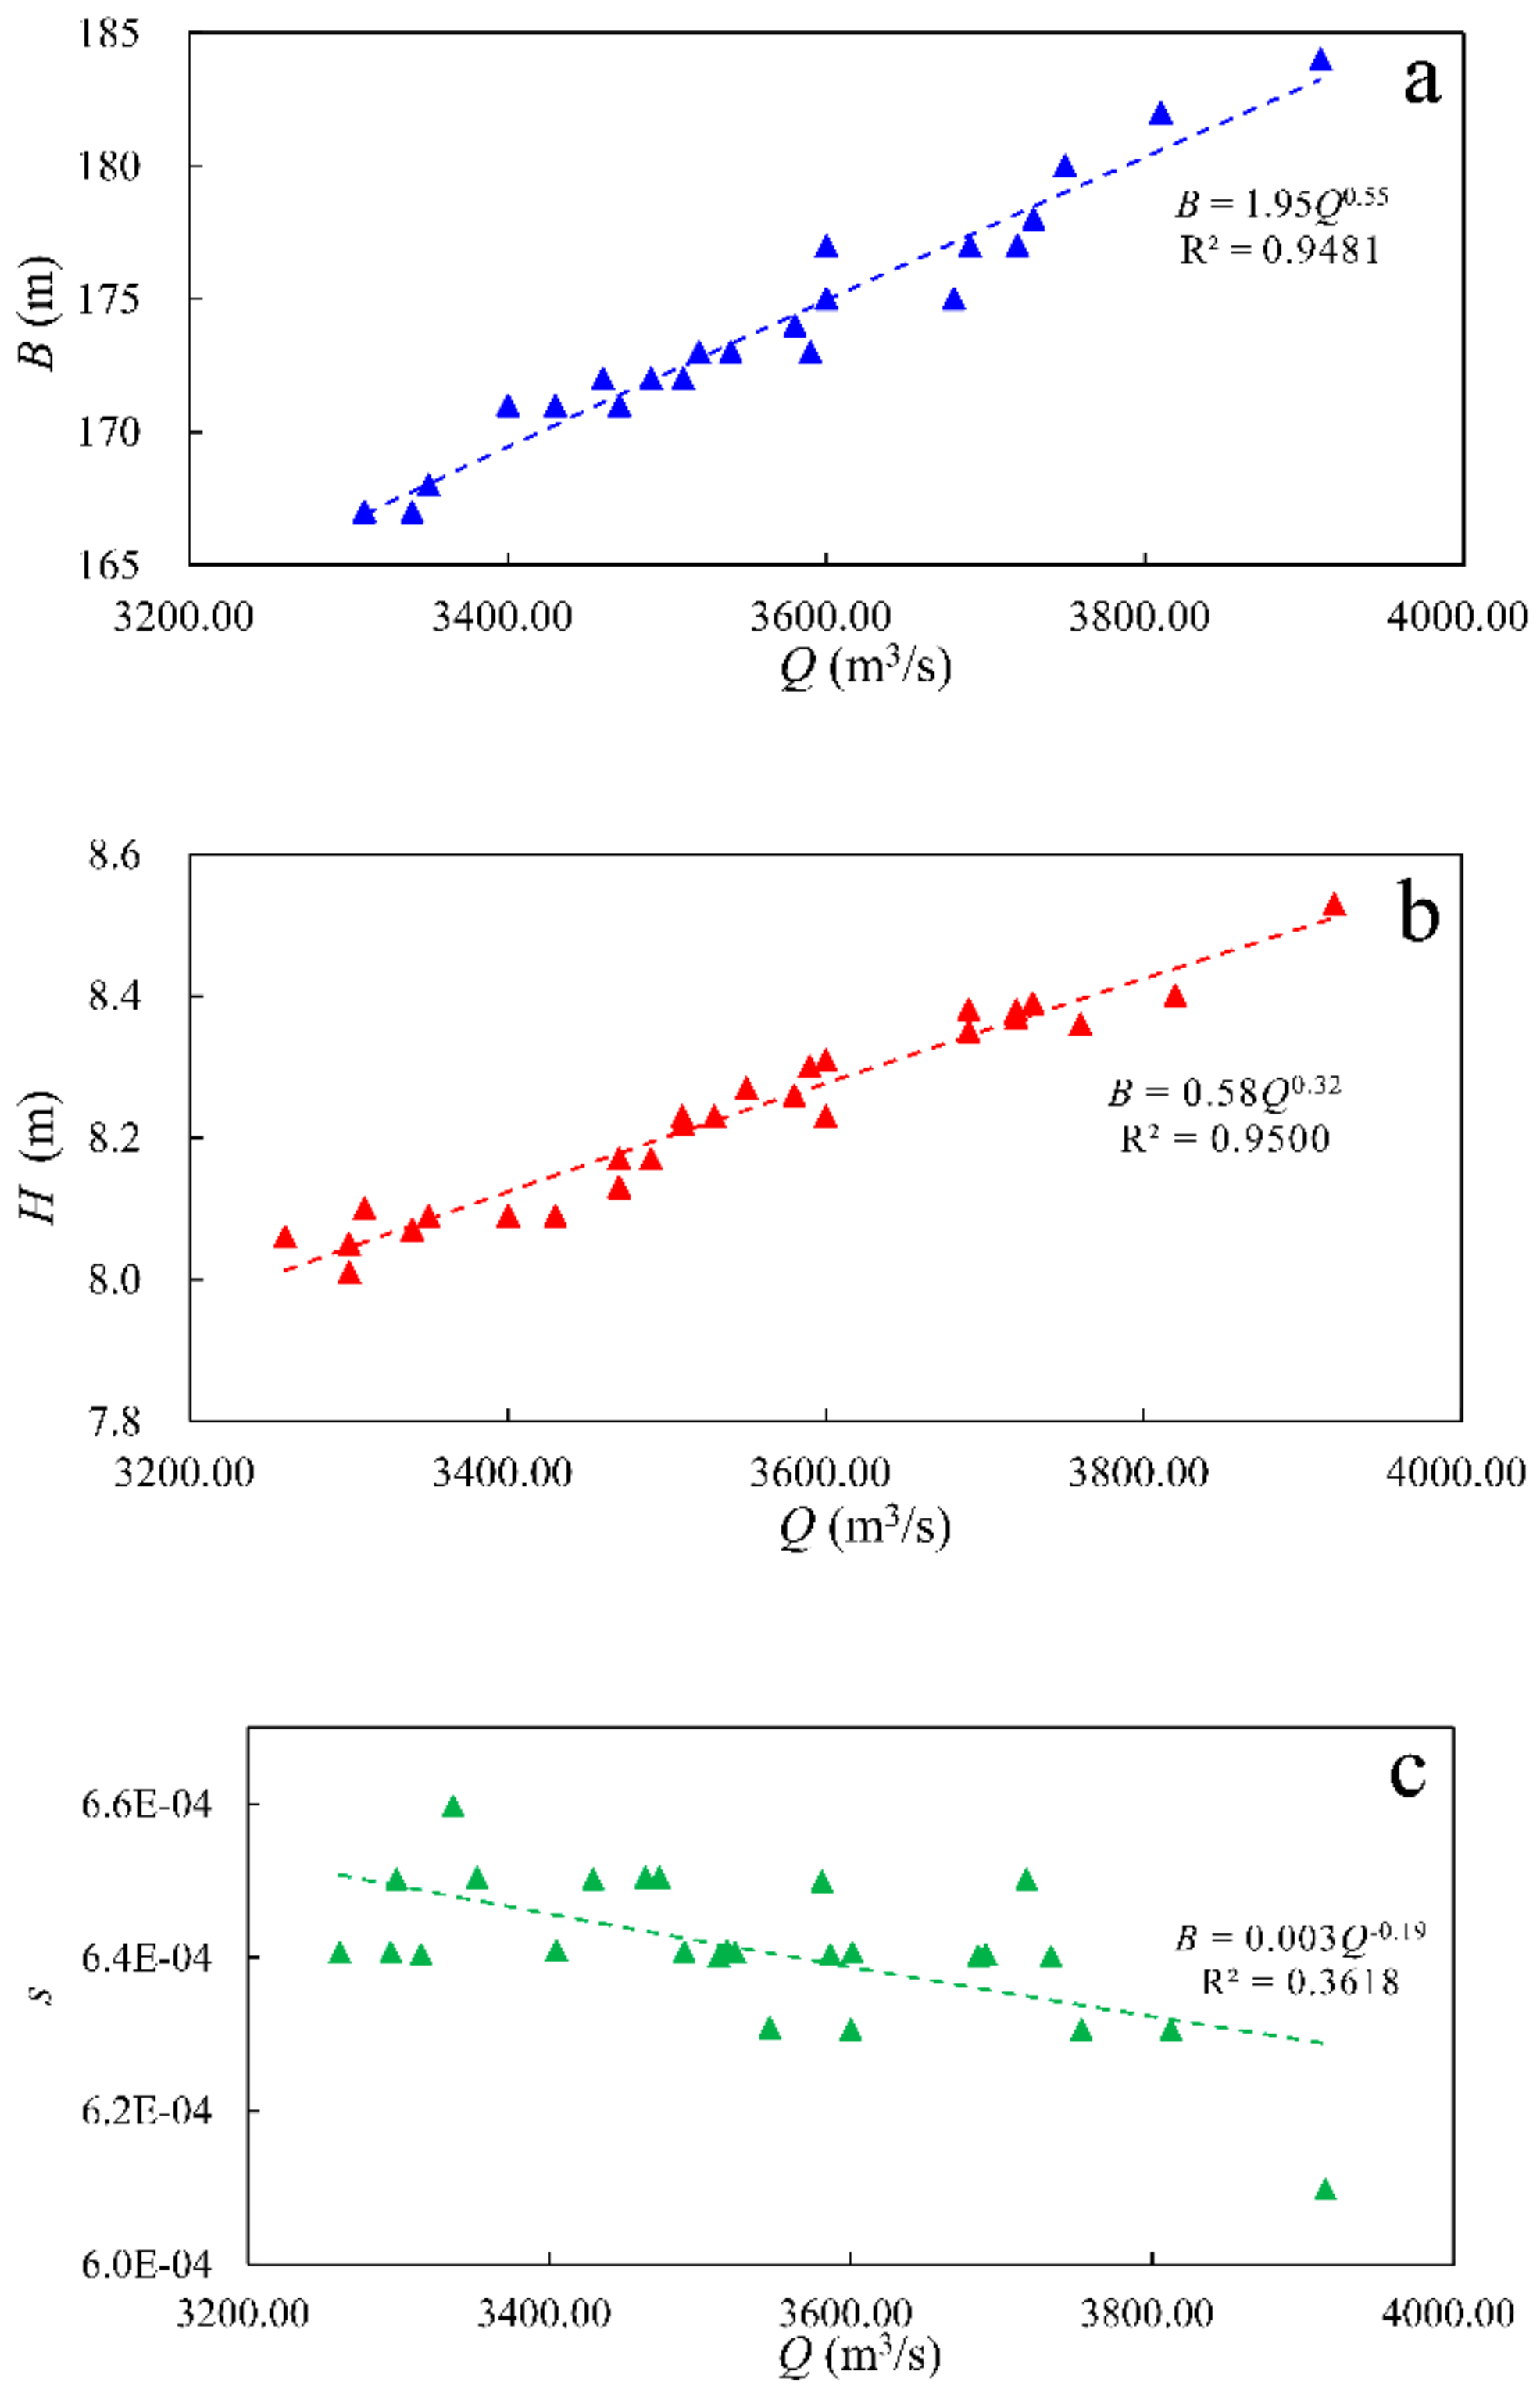
5.3. Relationships Related to the Stability of the Equilibrium Fluvial Facies
5.4. Suggestion on Future Flood Control and Sustainable Development
6. Conclusions
Author Contributions
Funding
Acknowledgments
Conflicts of Interest
References
- Cao, W.H. Relationship between variation of sediment carrying flows and readjustment of riverbed in the lower reaches of Yellow River. J. Hydraul. Eng. 2004, 35, 1–6. [Google Scholar]
- Chang, W.H.; Hou, S.Z.; Wang, P.; Hu, T. Flood influence on deposition-scouring in Inner Mongolia reach of Yellow River. Yellow River 2010, 32, 62–63. [Google Scholar]
- Yue, Z.C.; Ma, X.Y. Flow profile of the Ningxia reach in Yellow River with 2012 flood. J. Sediment. Res. 2016, 1, 36–39. [Google Scholar]
- Wang, X.J.; Yue, Z.C. The impact of flood on the river regime of the Yellow River in 2012. J. Agric. Sci. 2015, 36, 45–48. [Google Scholar]
- Li, Z.W.; Qin, Y.; Chen, X.X.; Wang, W.H.; Wu, Q.Q. Effects of the coarse sediment movement in the flood on Inner Mongolia Reach of Yellow River in 2012. Adv. Water Sci. 2016, 9, 687–695. [Google Scholar]
- Li, Z.W.; Wang, Z.Y.; Tian, S.M.; Zhang, C.D. Variation of streamflow and sediment discharge rate and relationship with temperature change in Yellow River source area. J. Sediment. Res. 2014, 6, 28–32. [Google Scholar]
- Dong, Z.D.; Hu, H.H.; Ji, Z.W.; Wang, D.W. Responses of cross-section shapes to the variations of income water and sediment in Ningxia-Inner Mongolia Reach of the Yellow River. J. Sediment. Res. 2015, 4, 20–25. [Google Scholar]
- Lin, Z.X.; Su, L.S.; Li, T. Critical condition of erosion or deposition during flood season in Inner Mongolia reach of the Yellow River. J. Sediment. Res. 2015, 4, 26–30. [Google Scholar]
- Zhang, H.J.; Lu, J.; Zhou, L.Y.; Qian, S. Analysis of Law of Scour and Fill in Ning-Mong Reach of the Yellow River During Floods. Yellow River 2011, 33, 27–29. [Google Scholar]
- Ran, D.; Yao, W.; Shen, Z.; Ni, Y.; Dong, F. Analysis on the contribution rate of driving factors for the annual water and sediment variations at the Toudaoguai hydrological station in the Yellow River. Adv. Water Sci. 2015, 26, 769–778. [Google Scholar]
- Wu, B.S.; Shen, G.Q. Discussion on the physical meaning of the coefficient of incoming sediment. Yellow River 2008, 30, 15–16. [Google Scholar]
- Shi, H.L.; Hu, C.H.; Wang, Y.G.; Hu, J. Analysis on Variation Trends of Runoff and Sediment of the Yellow River Basin and Reasons Discussion. Yellow River 2014, 36, 1–5. [Google Scholar]
- Zhang, J.L.; Liu, J.X.; Luo, Q.S.; Chen, C.X. Study on the Operation Mechanism of Runoff and Sediment in the Lower Yellow River Under Different Governance Modes. Yellow River 2018, 40, 1–4. [Google Scholar]
- Li, E.H.; Mu, X.M.; Zhao, G.J. Temporal changes in annual runoff and influential factors in the upper and middle reaches of Yellow River from 1919—2010. Adv. Water Sci. 2014, 3, 155–163. [Google Scholar]
- Chen, H.; Zhou, J.X.; Lu, Z.C.; Chen, J.R. Impact of environmental factors on runoff and sediment variations in middle reaches of the Yellow River. Geogr. Res. 2002, 3, 179–187. [Google Scholar]
- Yuan, X.M.; Tian, F.C.; Wang, X.J.; Liu, Y.; Chen, M.-T. Small-scale sediment scouring and siltation laws in the evolution trends of fluvial facies in the Ningxia Plain Reaches of the Yellow River (NPRYR). Quat. Int. 2018, 476, 14–25. [Google Scholar] [CrossRef]
- Omengo, F.O.; Geeraert, N.; Bouillon, S. Sediment deposition patterns in a tropical floodplain, Tana River, Kenya. Catena 2016, 143, 57–69. [Google Scholar] [CrossRef]
- Nitsche, F.O.; Ryan, W.B.F.; Carbotte, S.M.; Bell, R.E.; Slagle, A.; Bertinado, C.; Flood, R.; Kenna, T.; McHugh, C. Regional patterns and local variations of sediment distribution in the Hudson River Estuary. Estuar. Coast. Shelf Sci. 2007, 71, 259–277. [Google Scholar] [CrossRef]
- Ni, J.R.; Zhang, R. Methods and their relationships in studies of regime relations. Acta Geogr. Sin. 1992, 7, 368–375. [Google Scholar]
- Zhao, H.X.; Chen, J.J.; Chen, J.W.; Li, Y.B. On the water volume required for transporting sediment and the fluvial processes in the Lower Yellow River. J. Sediment. Res. 1997, 9, 57–61. [Google Scholar]
- Jiang, N.L. Analysis of riverbed evolution trend of Chengtong reach in terms of river facies relation. Port Waterw. Eng. 2013, 8, 131–138. [Google Scholar]
- Yang, Y.H.; Le, P.J.; Zhang, M.J. A prominent characteristic of hydraulic geometry relation in Yellow River and its preliminary study. J. Waterw. Harb. 2015, 4, 126–130. [Google Scholar]
- Liu, Q.; Gong, Z.; Zhou, Z.; Zhang, C. Hydro-geometric relation of tidally-influenced channels downstream of floodgates along muddy coasts. Adv. Water Sci. 2016, 27, 751–762. [Google Scholar]
- Lacey, G. Stable Channels in Alluvium. Minutes Proc. Inst. Civ. Eng. 1930, 229, 259–292. [Google Scholar]
- Yalin, M.S.; Da Silva, A.F. Fluvial Processes; Delft: Amsterdam, The Netherlands, 2001. [Google Scholar]
- Ming, Z.F. Morphology relations of fluvial rivers. J. Sediment. Res. 1983, 4, 75–84. [Google Scholar]


| Number | Reach | L (km) | s (‰) | D1 (m) | D2 (m) | Ka |
|---|---|---|---|---|---|---|
| 1 | Toudaokan–Xiaheyan | 61.5 | 0.87 | 200 | 200 | 1.8 |
| 2 | Xiaheyan–Zaoyao | 75.1 | 0.80 | 554 | 554 | 1.16 |
| 3 | Zaoyao–Qingtongxia | 45.2 | - | 400–4000 | - | 1.1 |
| 4 | Qingtongxia–Shizuishan | 196.4 | 0.32 | 1130–3294 | 597–1325 | 1.2 |
| Period | Item | AVG | MAX (Year) | MIN (Year) | k |
|---|---|---|---|---|---|
| Application Year | Water Volume (109 m3) | 296.37 | 509.13 (1967) | 188.66 (1997) | 2.70 |
| Sediment Volume (109 t) | 1.23 | 4.41 (1959) | 0.22 (2004) | 20.02 | |
| Sediment Concentration (103 mg/L) | 3.99 | 13.57 (1959) | 1.03 (2004) | 13.17 | |
| Non-flood Season | Water Volume (109 m3) | 141.06 | 198.84 (1990) | 82.73 (1957) | 2.40 |
| Sediment Volume (109 t) | 0.19 | 0.85 (1967) | 0.03 (2004) | 28.21 | |
| Sediment Concentration (103 mg/L) | 1.39 | 5.35 (1986) | 0.23 (2004) | 23.31 | |
| Flood Season | Water Volume (109 m3) | 155.31 | 326.19 (1967) | 79.65 (1997) | 4.10 |
| Sediment Volume (109 t) | 1.04 | 4.12 (1959) | 0.19 (1987) | 21.72 | |
| Sediment Concentration (103 mg/L) | 6.37 | 22.81 (1959) | 1.69 (1975) | 13.49 |
| Cross-Section | River Width per Bed-Building Discharge | River Depth per Bed-Building Discharge |
|---|---|---|
| Xiaheyan | B = 93.32Q0.11 | H = 0.07Q0.55 |
| Qingtongxia | B = 117.49Q0.12 | H = 0.14Q0.44 |
| Shizuishan | B = 288.4Q0.03 | H = 0.14Q0.42 |
| Cross-Section | River Width per Bed-Building Discharge | River Depth per Bed-Building Discharge | River Bed Slope per Bed-Building Discharge |
|---|---|---|---|
| Xiaheyan | B = 1.95Q0.55 | H = 0.58Q0.32 | s = 0.003Q−0.19 |
| Qingtongxia | B = 3.54Q0.54 | H = 0.28Q0.41 | s = 0.004Q−0.37 |
| Shizuishan | B = 6.24Q0.49 | H = 0.17Q0.50 | s = 0.004Q−0.48 |
© 2020 by the authors. Licensee MDPI, Basel, Switzerland. This article is an open access article distributed under the terms and conditions of the Creative Commons Attribution (CC BY) license (http://creativecommons.org/licenses/by/4.0/).
Share and Cite
Yuan, X.; Yue, Z.; Tian, F.; Cao, L.; Song, T. A Study of the Water and Sediment Transport Laws and Equilibrium Stability of Fluvial Facies in the Ningxia Section of the Yellow River under Variable Conditions. Sustainability 2020, 12, 1573. https://doi.org/10.3390/su12041573
Yuan X, Yue Z, Tian F, Cao L, Song T. A Study of the Water and Sediment Transport Laws and Equilibrium Stability of Fluvial Facies in the Ningxia Section of the Yellow River under Variable Conditions. Sustainability. 2020; 12(4):1573. https://doi.org/10.3390/su12041573
Chicago/Turabian StyleYuan, Ximin, Zhichun Yue, Fuchang Tian, Lugan Cao, and Tianhua Song. 2020. "A Study of the Water and Sediment Transport Laws and Equilibrium Stability of Fluvial Facies in the Ningxia Section of the Yellow River under Variable Conditions" Sustainability 12, no. 4: 1573. https://doi.org/10.3390/su12041573
APA StyleYuan, X., Yue, Z., Tian, F., Cao, L., & Song, T. (2020). A Study of the Water and Sediment Transport Laws and Equilibrium Stability of Fluvial Facies in the Ningxia Section of the Yellow River under Variable Conditions. Sustainability, 12(4), 1573. https://doi.org/10.3390/su12041573