Article

Optimization of Insulation Thickness of External Walls of Residential Buildings in Hot Summer and Cold Winter Zone of China

1
Department of Management, Xi’an University of Architecture and Technology, Xi’an 710055, China
2
School of the Built Environment, University of Reading, Reading RG6 6DF, UK
*
Author to whom correspondence should be addressed.
Sustainability 2020, 12(4), 1574; https://doi.org/10.3390/su12041574
Submission received: 17 December 2019 / Revised: 2 February 2020 / Accepted: 11 February 2020 / Published: 20 February 2020

Abstract

:
It is important to reduce primary energy consumption and greenhouse gas emissions associated with residential buildings in the hot summer and cold winter (HSCW) zone of China. Changing the insulation thickness of the external walls of residential buildings (ITEWB) is regarded as an effective way to manage such problems within a budget. This paper aims at developing an innovative way to select the optimal insulation thickness of external walls for residential buildings (OTWRB) in the HSCW zone of China, considering economic, energy and greenhouse gas emissions issues associated with the ITEWB. Four different cities and two different operation modes of the air conditioners (continuous and intermittent) are considered in this study. To explain the selection process, typical hypothetical buildings are simulated in Wuhan, Changsha, Hangzhou and Chengdu. Expanded polystyrene is chosen as the material of the insulation layer while split air conditioners are selected as the equipment for space heating and cooling. Integrated Environmental Solutions-Virtual Environment is used for the dynamic operational energy consumption of buildings. Life cycle cost method is adopted to calculate the economic impact of ITEWB on building performance. The Chinese life cycle database is used to quantize the impacts of ITEWB on building performance in the aspect of energy and greenhouse gas emissions based on the life cycle theory. The most appreciated insulation thickness is chosen from the thickness range of 30 mm to 150 mm. We find that for continuous operation mode of air conditioners in Wuhan, the optimal economic insulation thickness is 70 mm, whereas when considering only energy and environmental aspects, the OTWRB is 150 mm. These are all larger than the current insulation thickness which is 30 mm. When the weighting efficiencies of the economy, energy, and greenhouse gas emissions are different, the OTWRB varies from 70 mm to 150 mm for continuous operation mode. The different cities have little influence on the OTWRB while the different operation modes of air conditioners have some influence on the OTWRB.

1. Introduction

It is imperative to reduce primary energy consumption as well as greenhouse gas emissions related to residential buildings in China since China has made a promise to reduce greenhouse gas emissions as well as primary energy consumption at the Paris Agreement [1]. The building sector is one of the three biggest energy consumers and it is responsible for an enormous amount of greenhouse gas emissions in China [2,3]. Meanwhile, the residential building sector comprises over 40% of the energy consumption in China’s civilian construction sector [4]. Reducing primary energy consumption and limiting the associated greenhouse gas emissions related to residential buildings are the key points of such objectives.
There are five climate zones of China; cold zone, severe cold zone, hot zone, hot summer and cold winter (HSCW) zone, and hot summer and warm winter zone [5]. So far, there have been remarkable results for energy savings and reducing greenhouse gas emissions of the residential building sector in cold and severe cold zones of China. On the other hand, the energy consumption associated with the residential building sector in the HSCW zone has been continuously increasing [6]. According to China’s National Bureau of Statistics [7], there were 21% of the national urban residential population in the HSCW zone. The residential buildings in this area lack central heating systems because of historical reasons [8,9]. The residentials there heavily rely on mechanical heating and cooling systems to keep indoor thermal comfort, resulting in a lot of operational energy consumption [9,10]. The energy consumption for space heating and cooling systems contributes to 50~60% of residential annual energy consumption [11]. While the thermal efficiency of the envelope of the buildings is relatively poor, implying huge saving potentials in this area [12]. As a result, increasing building envelope efficiency is crucial to reducing primary energy consumption and minimizing greenhouse gas emissions associated with residential buildings in the HSCW zone of China.
Applying an insulation layer on the external wall of a building is a popular method for increasing building envelope efficiency. By reducing heat loss through the wall [6], energy consumption and greenhouse gas emissions associated with the buildings can significantly be reduced economically [13]. Up to this point, applying the insulation layer on the external wall of residential buildings has been promoted by the government recently in the HSCW zone of China.
Insulation thickness is an important parameter to consider when applying thermal insulation, thus, there is considerable research about the optimal insulation thickness of the external walls for residential buildings (OTWRB) [14,15,16,17,18]. Since the climate is one of the most important factors in determining the OTWRB [19,20,21], it is necessary to cut down the scope of the contest to the HSCW zone of China for the OTWRB recommended in this certain area. However, until recently, a few researchers began to pay attention to the OTWRB in this special part of China. Although these existing studies have made significant efforts for the selection of the most appreciated insulation thickness of an external wall, some shortcomings need to be improved.
One shortcoming is the neglect of the intermittent operation mode of the heating and cooling equipment in the HSCW zone of China. In most research focused on the OTWRB in the HSCW zone of China [22,23], the space heating and cooling equipment is assumed to maintain a comfortable temperature for the whole day over the heating and cooling period. However, according to the results of several investigations [8,12,24,25], there is, in fact, plenty of time when this equipment is not in operation [26]. Moreover, Fang Ruan believed that these two different operation modes of air conditioners (continuous and intermittent) resulted in obvious differences in the operational energy consumption of a building [24]. Based on the conclusion that the heating and cooling demands of buildings affect the OTWRB, it is reasonable to discuss the impact of different operation modes of air conditioners on the OTWRB [19].
Another shortcoming of the existing research is the lack of consideration of the integrated impacts associated with the ITEWB. For the existing research about the OTWRB in the HSCW zone of China, some of them only considered the energy aspect associated with ITEWB [27,28], while the others only considered the economic aspect associated with the ITEWB [29,30]. As previously mentioned, the purpose of applying the insulation layer on the external wall of a building is not only about the economic aspect, there are more considerations about the energy aspect and the environmental aspect of the ITEWB. The possibility of considering all these three objectives associated with the ITEWB is revealed by [31]. Their studies proved that greenhouse gas emissions associated with the ITEWB were reduced at the economic insulation thickness compared to that at the zero thickness. The necessity of considering the integrated impacts in the optimization criteria is proved by [14,32,33]. These findings showed the significant impact of criteria on the OTWRB. As a result, it is worth investigating all of these impacts of the ITEWB and selecting the most appreciated one for buildings located in the HSCW zone of China. To the author’s best knowledge, there is no paper considering these three factors in the determining process of the OTWRB in the HSCW zone of China.
The innovation of this paper is to develop an innovative method to select the OTWRB considering the integrated impact associated with ITEWB in terms of economic, energy and greenhouse gas emissions issues in the HSCW zone of China. Different weighting efficiencies applied to the economy, energy and greenhouse gas emissions are also considered in this paper. To provide some realistic context, the Chinese cities of Wuhan, Changsha, Hangzhou, and Chengdu are used as hypothetical scenarios where the OTWRB values would be determined. Comparative analysis of the results for these four different cities and two different modes of air conditioners (continuous and intermittent) is conducted to discuss the feasibility of the OTWRB.

2. Materials and Methods

2.1. Hypothetical Building

2.1.1. Physical Information of the Typical Building

The same hypothetical buildings are assumed to be located in Wuhan, Changsha, Hangzhou and Chengdu. As shown in Figure 1, these four cities represent the cities in the middle, western, eastern and southern parts of the HSCW zone of China.
The layout and construction information of the building prototype is similar to that of the typical building obtained from the field study carried out by Xueping Li, who surveyed above 40 residential communities built around the 2000s in the HSCW zone of China [34]. Figure 2 shows the floor plan and the elevation drawing of the case study building. The total floor area of this 12-storey hypothetical building is 2701.4 m2.
The other typological characteristics of the building prototype are in Table 1.
The construction information about the envelope of the building is presented in Table 2. The data is based on the field study carried out by Xueping Li [34].
As shown in Table 3, the structure of the external wall of the typical building is obtained from the field study carried out by Xueping Li, and it is a very common structure in the HSCW zone of China [34]. EPS (expanded polystyrene) is one of the most widely used insulation materials for external walls in this area [30,38,39]. The thermal conductivity of the EPS is 0.4 w/mk in the case study building.
The thickness of the insulation layer of the external wall of the buildings is 30 mm for EPS for the present situation [40]. In this paper, optional values of insulation thickness of the external wall are 30 mm, 50 mm, 70 mm, 90 mm, 110 mm, 130 mm, and 150 mm.
According to the field studies carried out by [34,40,41,42], split air conditioners fed by electricity are a popular choice to keep indoor comfort in such an area of China, as there is no central heating system in this area because of historical reasons. The details of the thermal system of the case study building are presented in Table 4. Two operation modes of air conditioners are presented in Table 5.

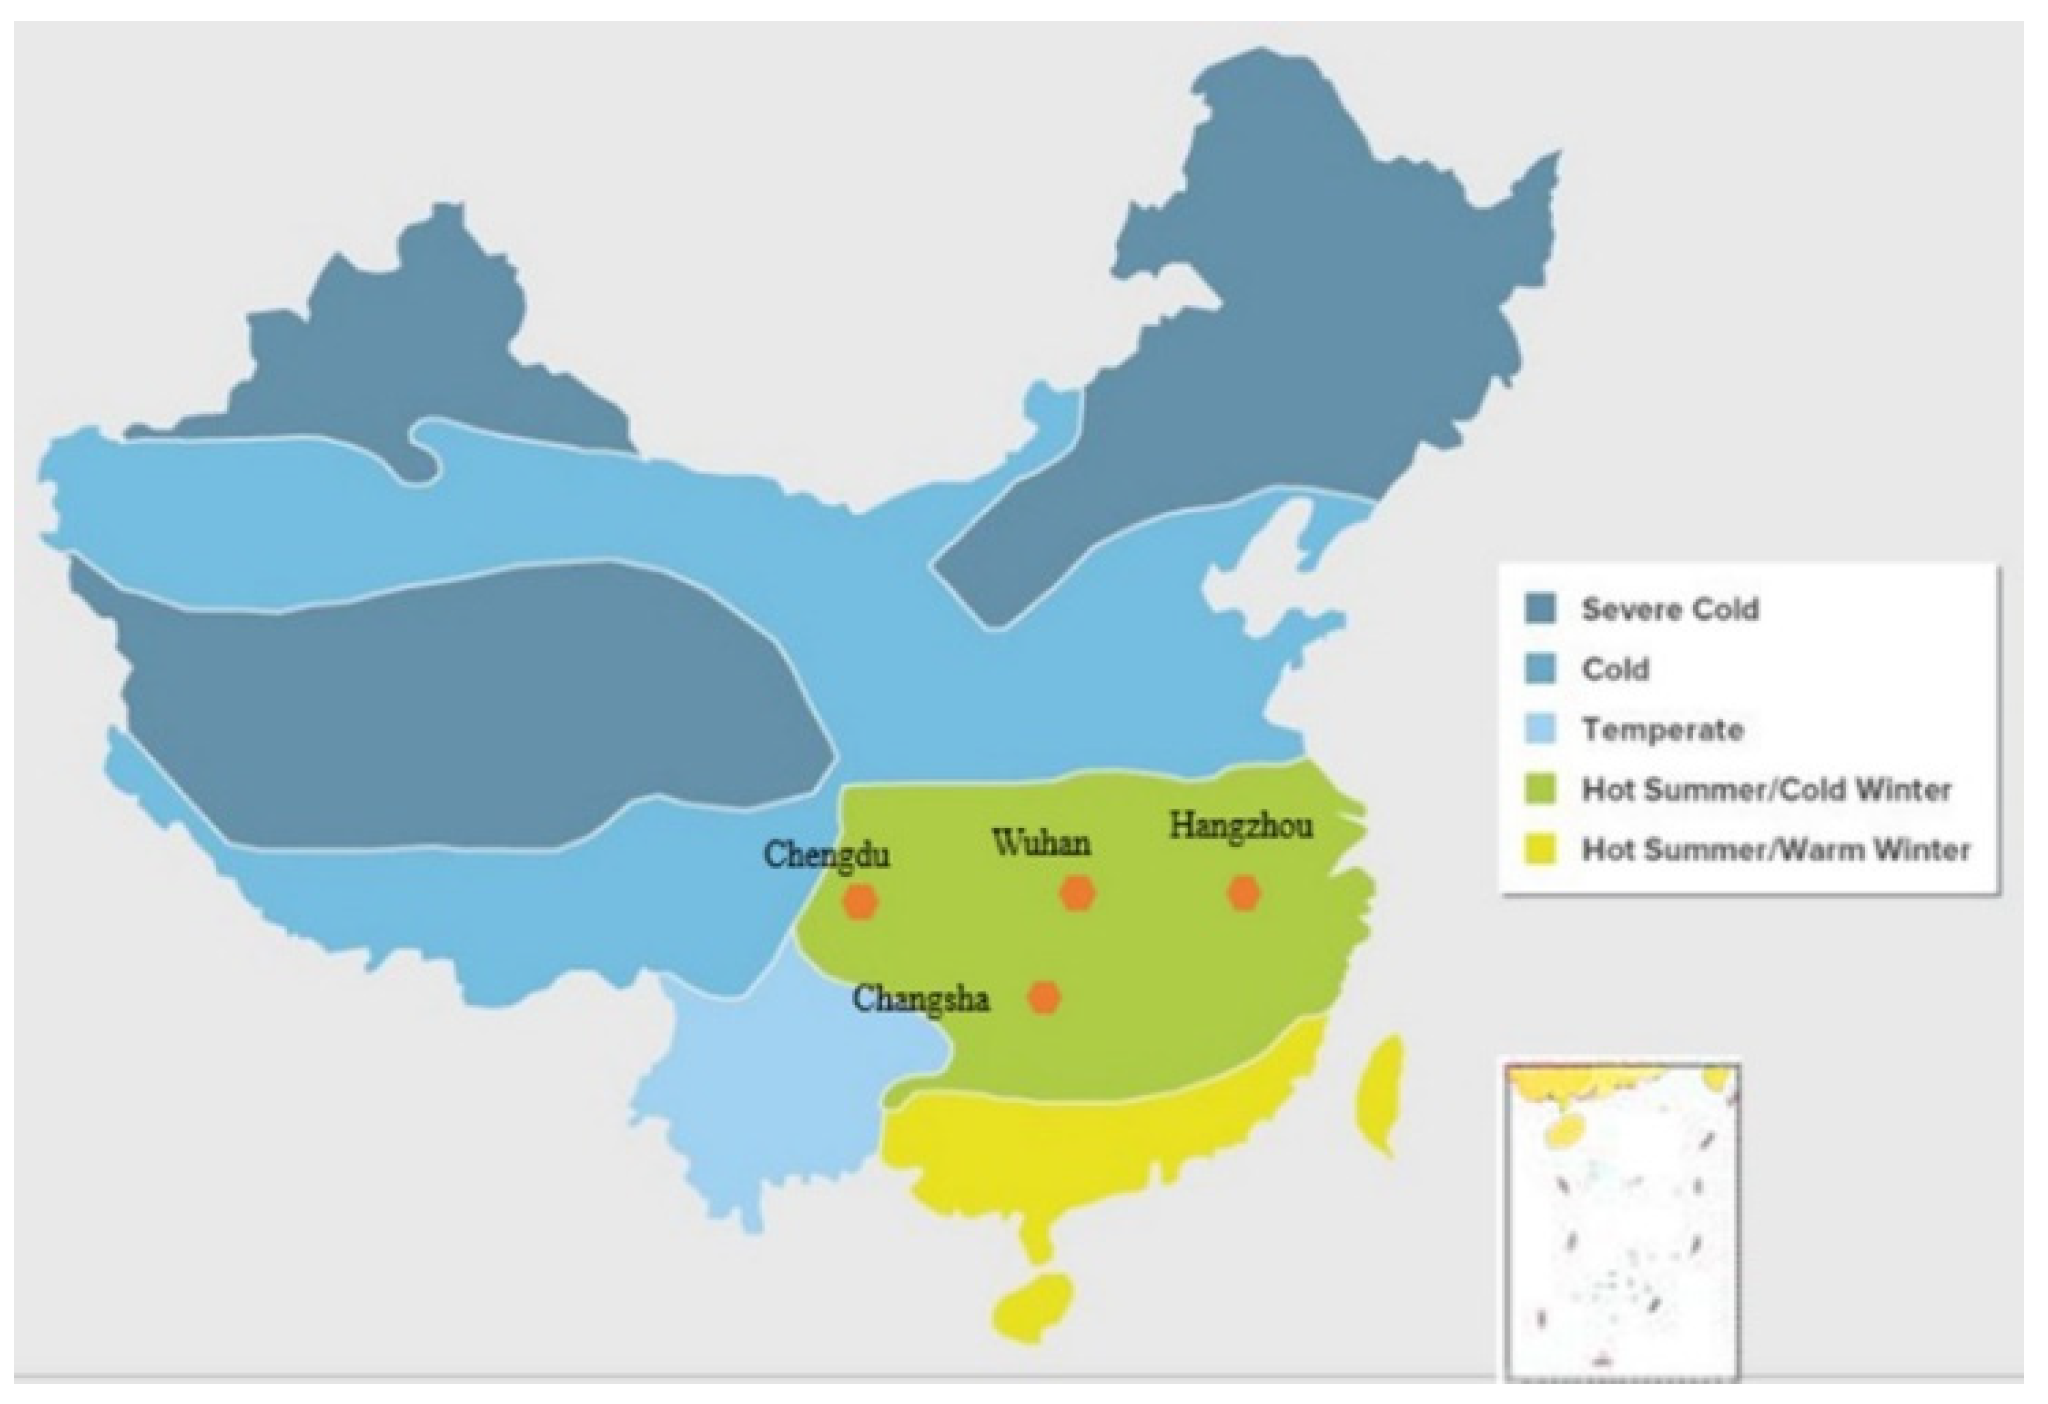
2.1.2. Meteorological Information of the Typical Building

As shown in Table 6, the meteorological data adopted in this paper is from The Solar and Wind Energy Resource Assessment (SWERA) project. This database has the typical hourly meteorological data, and it is known for accurate solar information. Since solar radiation is significant for the building’s operational energy, particularly for the cooling load, this database is adopted in this paper [51].

2.2. Calculation of Operational Energy Consumption of the Hypothetical Building

Generally, there are two different methods to compute energy consumption for space heating and cooling. One method is the equation-based method and another method is the simulation-based method. In the reference, they found out that the equation-based method might not lead to a desired accurate result of the energy demand for space heating and cooling [52,53,54]. For a more accurate heat transfer calculation, the dynamic meteorological data and the dynamic indoor temperature should be considered. However, because of the calculation constraints, this approach makes use of assumptions to simplify the equations in calculating heat transfer.
To overcome this kind of simplification of inputs in the equation-based method, some authors adopted the simulation-based method [53]. Thanks to the great computing power of computers, it can make good use of these amounts of inputs and it can automatically calculate the operational energy consumption of buildings with high accuracy.
There are a variety of building simulation tools used in the research, such as Energy Plus, Integrate Environmental Solution-Virtual Environment (IES-VE), and Designer‘s Simulation Toolkits (DeST). Among these tools, IES-VE is a popular commercial software used worldwide including China [55]. The validation and accuracy of this software have been proven by the BESTEST (Building Energy Simulation Test) standard of the International Energy Agency (IEA), green building rating schemes and amounts of existing studies [56,57,58,59]. Moreover, it has extensive capabilities for modeling customize systems and controls, which allows for the simulation of the intermittent operation mode of air conditioners in the case study.
For this study, ApacheSim module and Apache HVAC module of IES-VE are mainly used. Apache HVAC module is a supplement module for detailed settings of the HVAC system of case study building. The Apache HVAC module enables users to adjust the air conditioner settings, including the operation mode. The ApacheSim module helps users to calculate the space heating and cooling energy consumption of the building automatically. In this software, heat conduction and storage, convection heat transfer, heat transfer by air movement, long-wave radiation heat transfer, solar radiation, casual gains, and thermo-physical properties of air can be all considered in the ApacheSim calculation.
As a verification measure, the operational energy calculated for Hangzhou is compared with the results of past studies. As shown in Table 7, the computed value is comparable with the results in previous studies.

2.3. Integrated Estimation Method to Select the OTWRB

2.3.1. Evaluation of the Impacts of ITEWB on Building Performance with Regard to the Economic, Energy and Greenhouse Gas Emissions Aspects.

In this paper, the optimal insulation thickness is obtained based on the integrated impacts of the ITEWB on building performance, with regard to the economic, energy and greenhouse gas emissions aspects.
In the literature, the application of life cycle assessment to the OTWRB is becoming more and more popular [16,21,62]. Based on this theory, three indicators in the paper, which are life cycle cost (LCC), life cycle primary energy demand (LPED) and life cycle global warming potential (LGWP), are selected to present the impacts of the ITEWB on these three aspects.
Under this approach, these three indicators associated with the ITEWB are assessed from cradle to grave. In general, the life cycle stages of insulation include production, transportation, operation, maintenance, demolition and waste management. However, considering the minor effects of transportation, maintenance, demolition and waste management on these three factors in some cases and the difficulty to obtain these data [63], in this paper, only the production stage and the operational stage of the insulation layer are considered. In other words, this study is focusing on analyzing the impacts of the variation of the ITEWB on the insulation material and the operational energy consumption during the insulation material’s lifespan.
  • Life cycle cost (LCC)
Based on the existing research [18,54], the LCC associated with ITEWB is defined as:
L C C i n s = L C C o p e r a t i o n + L C C material    
L C C m a t e r i a l = 10 3 C i n s A w ξ i n s
L C C o p e r a t i o n = C o p Q o p   P 1
P 1 = PWF ( N e , i , d ) = { 1 d i [ 1 ( 1 + i 1 + d ) N e ] i d N e 1 + i i = d
The abbreviations used in these equations are shown in Table 8.
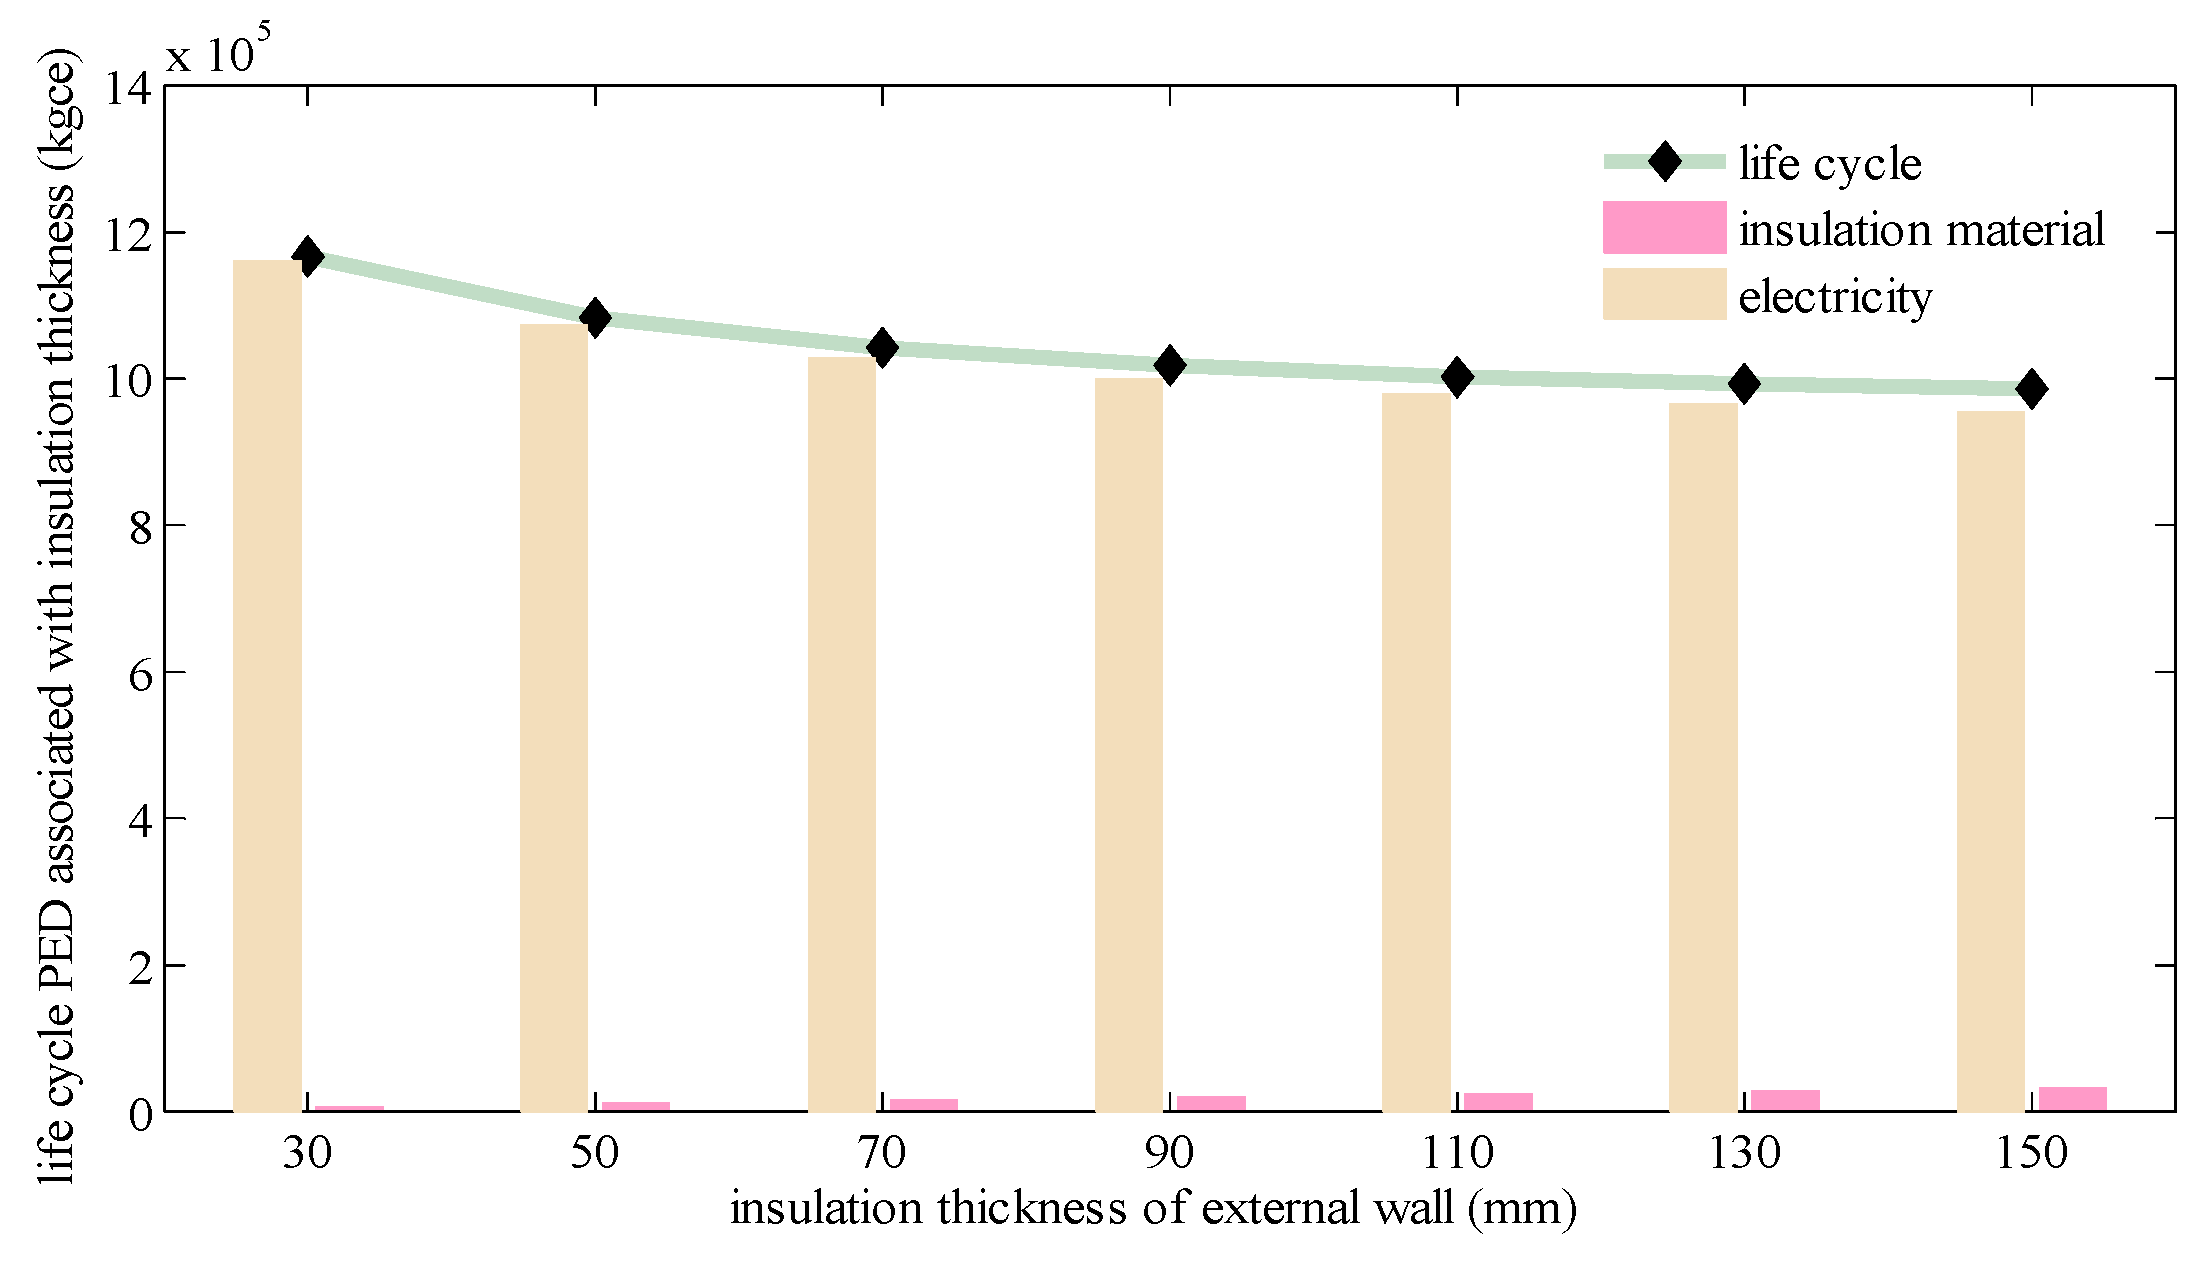
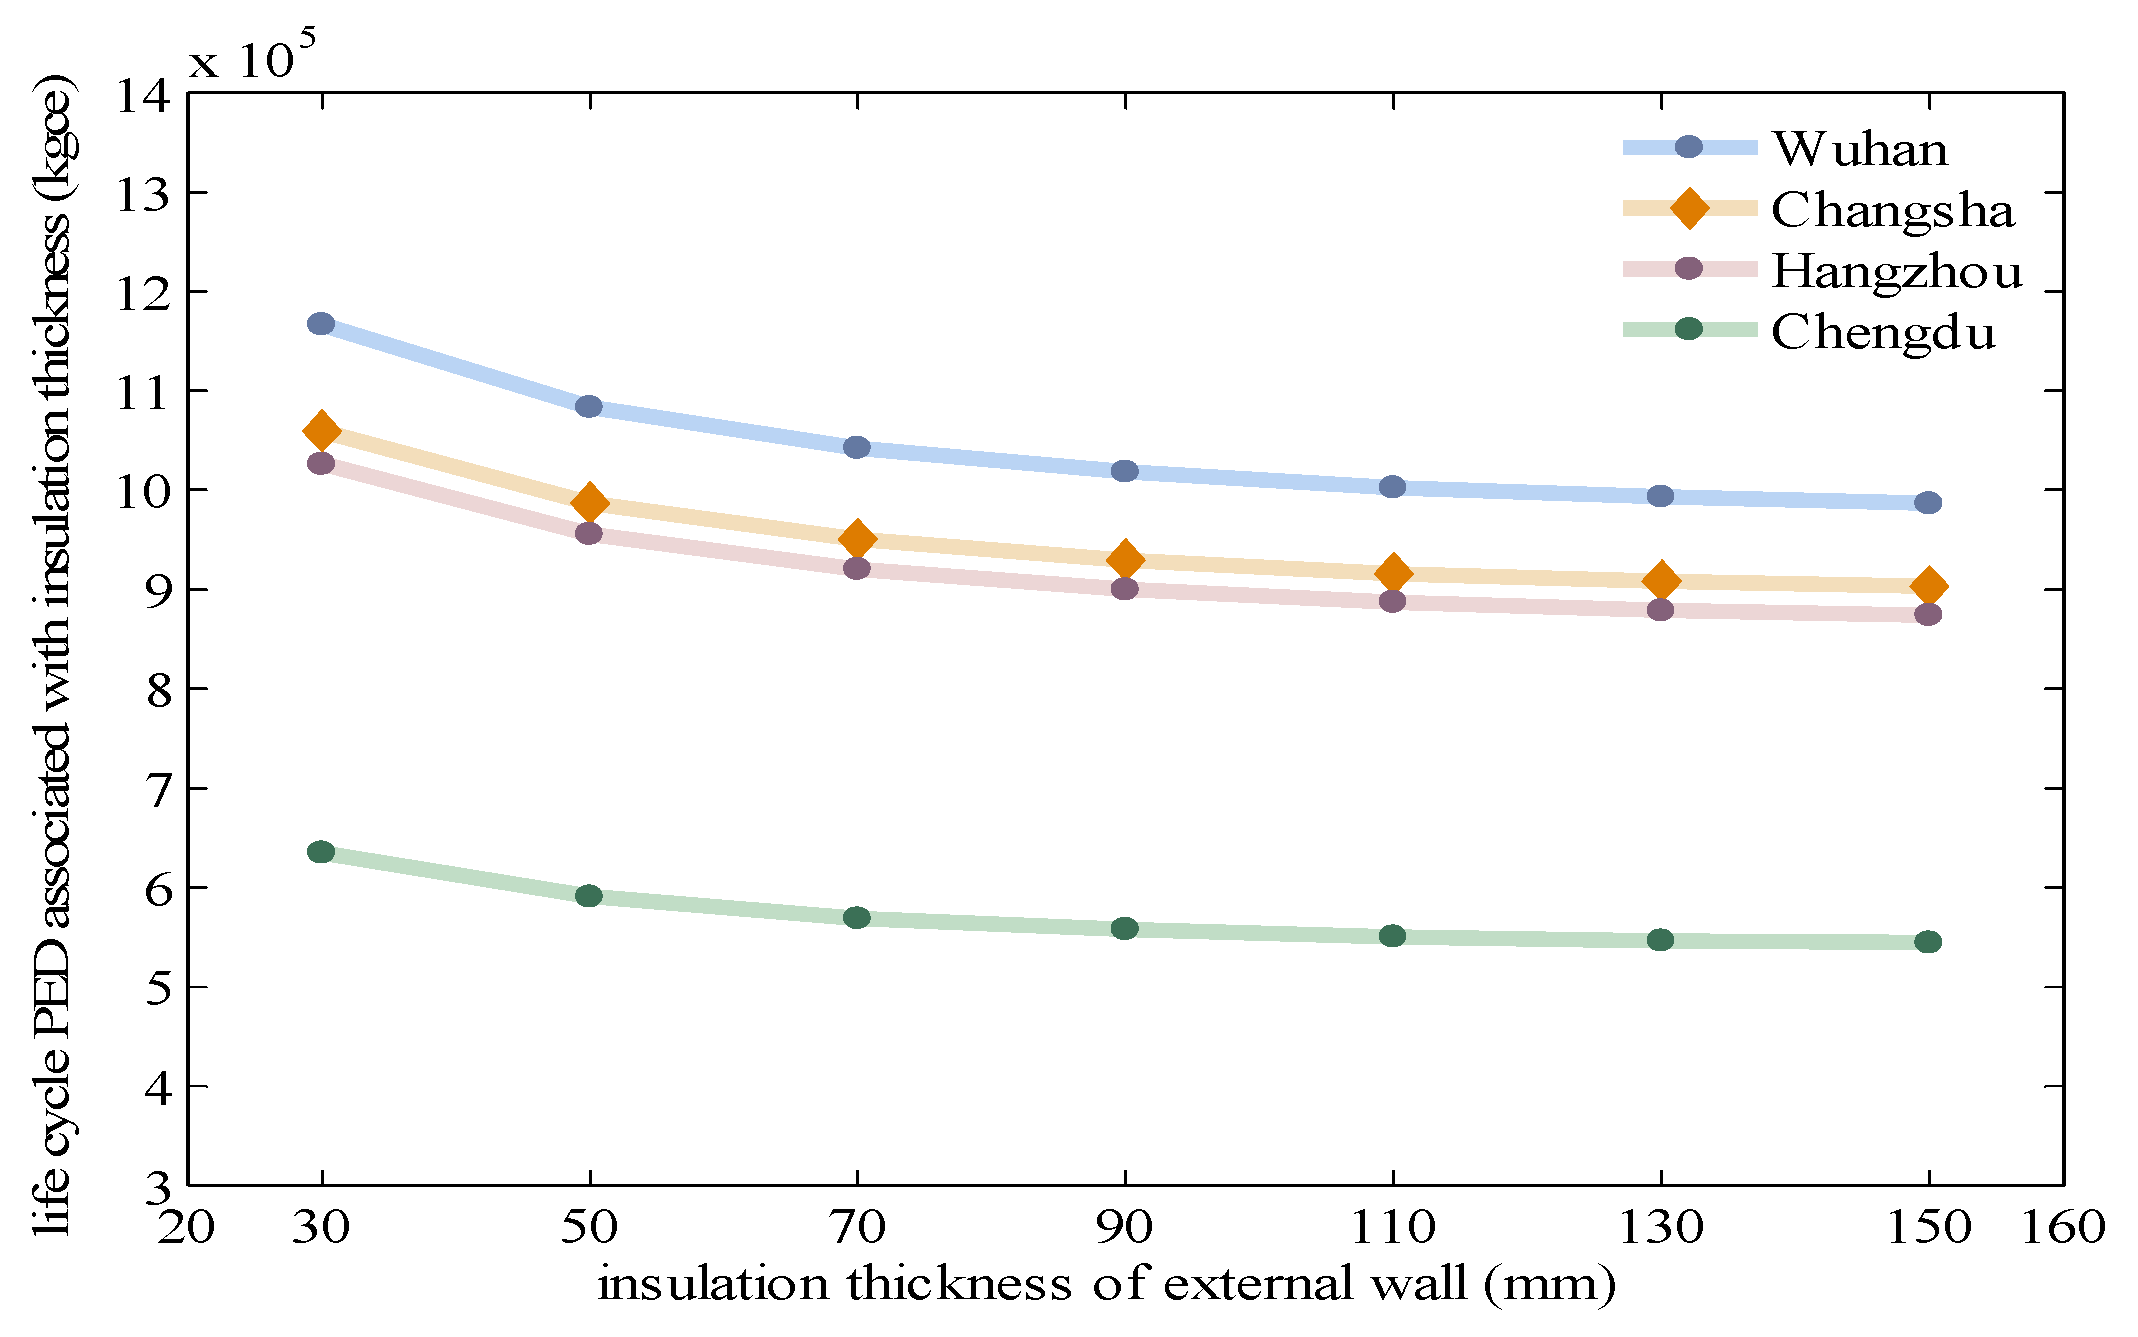
  • Life cycle primary energy demand (LPED)
A commonly used Chinese local database, CLCD (Chinese Life Cycle Database) [64], is adopted in this paper to quantify the impacts of the ITEWB on building performance with regard to energy and greenhouse gas emissions aspects.
Based on the existing research [33,53], the LPED related to the ITEWB is defined as:
L P E D i n s = L P E D m a t e r i a l + L P E D o p e r a t i o n  
L P E D m a t e r i a l = 10 3 P E D i n s A w ξ i n s ρ
L P E D o p e r a t i o n = P E D o p Q o p N e
The abbreviations used in these equations are presented in Table 9.
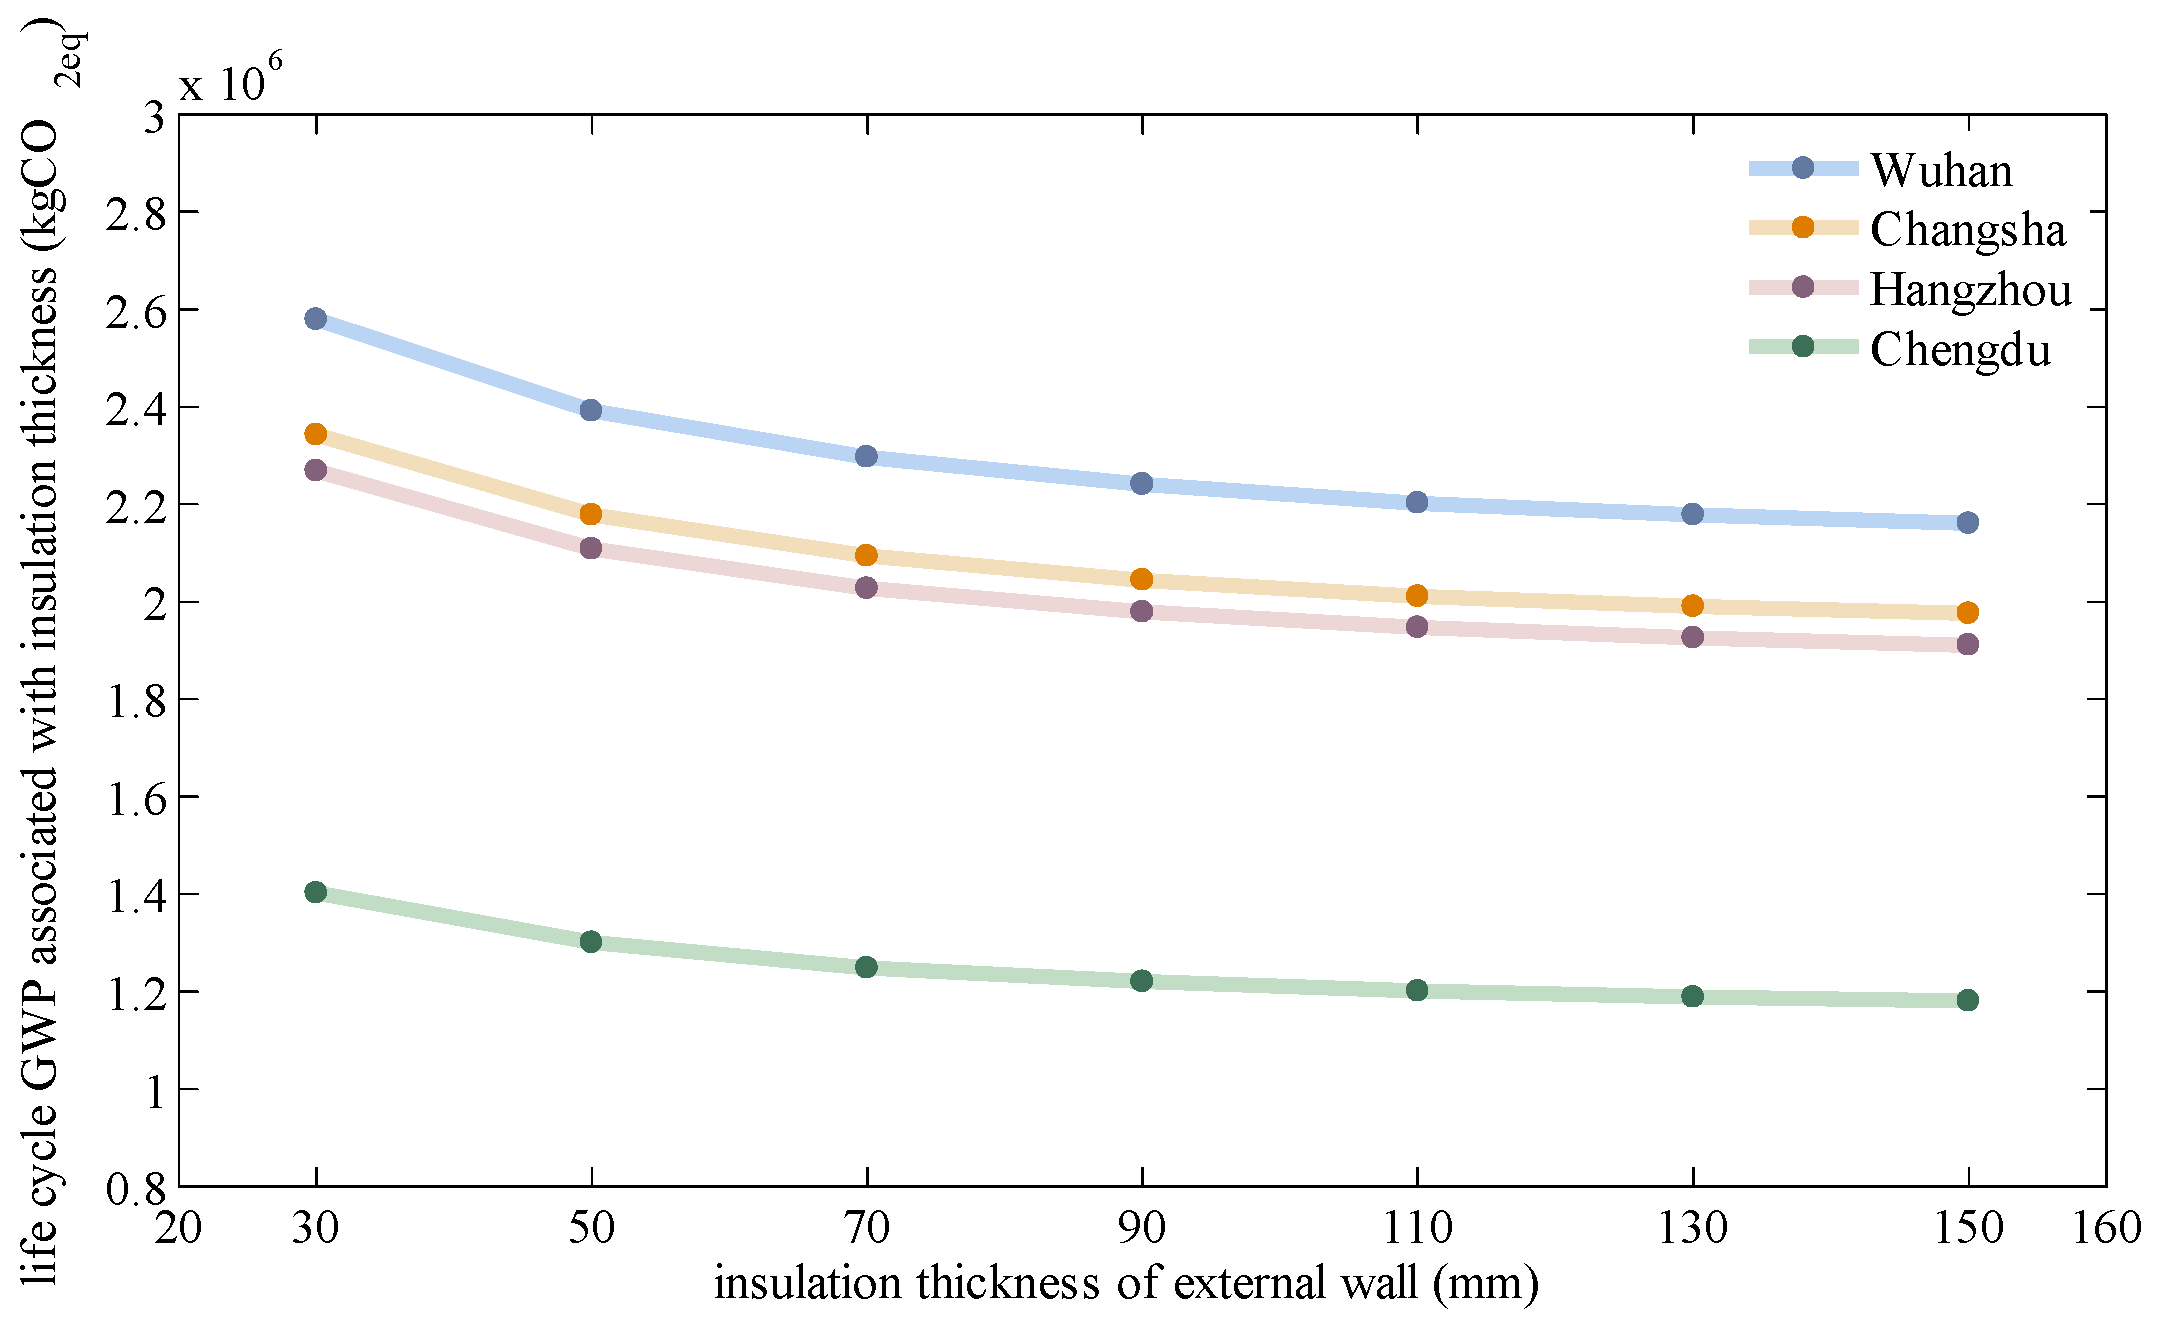
  • Life cycle global warming potential (LGWP)
Based on [53], LGWP related to the ITEWB is defined as
L G W P i n s = L G W P m a t e r i a l + L G W P o p e r a t i o n
L G W P m a t e r i a l = 10 3 G W P i n s A w ξ i n s ρ
L G W P o p e r a t i o n = G W P o p Q o p N e  
The abbreviations used in these equations are shown in Table 10.

2.3.2. Integrated Estimation Method to Select the OTWRB

To normalize these three indicators, LCC, LPED and LGWP, the min-max method is applied in this paper as shown in Equations (11)–(13). To integrate and consider all these three aspects associated with the ITEWB, a weighting sum method is adopted in Equations (14)–(16).
N L C C r = L C C r L C C r , m i n L C C r , m a x L C C r , m i n  
N L P E D r = L P E D r L P E D r , m i n L P E D r , m a x L P E D r , m i n
N L G W P r = L G W P r L G W P r , m i n L G W P r , m a x L G W P r , m i n  
Z r = w 1 N L C C r + w 2 N L P E D r + w 3 N L G W P r
w 1 + w 2   + w 3   = 1       ( 0 w 1 , w 2   , w 3   1 )
r = { 30   50   70   90   110   130   150 }
The abbreviations used in these equations are shown in Table 11.

3. Results and Discussion

3.1. Operational Energy Consumption and the ITEWB

As shown in Figure 3, for the continuous scenario, the heating energy consumption decreases with the increase of the ITEWB, while the impact of the ITEWB on the cooling load is not obvious [65]. The heating and cooling energy consumption of the building is more sensitive to ITEWB when the ITEWB is smaller. These similar trends are also revealed in [66]. Moreover, for Chengdu, with the increase of insulation thickness, the cooling energy consumption is not reduced, instead, it increases slightly [67].
With the increase of insulation thickness, the thermal transmittance of the external wall decreases, leading to more difficulties in terms of heat transfer driven by the temperature difference between indoor environment and outdoor environment [66]. This can lead to a reduction in operational energy consumption when the indoor thermal environment is more comfortable. It also can lead to an increase in operational energy consumption when the outdoor thermal environment is more comfortable.
For the HSCW zone of China, in the heating period, the indoor thermal environment is more comfortable compared to the outdoor thermal environment in most of time. In a certain range of insulation thickness, with the thicker insulation layer, the thermal transmittance of the external wall decreases, resulting in less heat loss from the indoor environment. As shown in Figure 4, within a certain range of ITEWB, the impact of the ITEWB on the thermal transmittance of the wall is reduced [68]. As a result, within a certain range of the ITEWB, with the increase of insulation thickness, the heating load of the building decreases and the reduction is smaller and smaller.
In the cooling period, compared to the heating period, there is more time when the outdoor thermal environment is more comfortable. In a certain range of the insulation thickness, with the increase of the ITEWB, for cities in the HSCW zone of China, the impact of the ITEWB on the cooling load is not obvious. Besides that, in some situations, where there is a long period that the outdoor environment is more comfortable compared to the indoor environment, the cooling load is increased with a thicker insulation layer [67].
The annual energy consumption of the building is determined by the sum of heating energy consumption and cooling energy consumption. As shown in Figure 5, for all these four cities in the HSCW, when the ITEWB increases from 30 mm to 150 mm, the annual operational energy consumption of the building decreases.

3.1.1. Impact of Different Cities on the Operational Energy Consumption

As shown in Figure 6, the different cities have different operational energy consumption and the effects of the ITEWB on these cities are different.
This is because the meteorological data of these four cities is different. As shown in Table 6, Wuhan has the largest temperature difference between the indoor environment and outdoor environment based on the HDD and CDD. The annual operational energy consumption of building for Wuhan is the largest.

3.1.2. Impact of Different Operation Modes of Air Conditioners on the Operational Energy Consumption

As shown in Figure 7, the annual energy consumption under intermittent operation mode is less than that under continuous operation mode. Additionally, the annual operational energy consumption of the building is less sensitive to the ITEWB. This is mainly because, under the intermittent operation mode of air conditioners, the operation time of air conditioners is reduced, leading to less heat transfer in the heating and cooling period.

3.2. Result of the OTWRB for Four Cities

The parameters used in the methods described in Section 2.3 are listed in Table 12. These values are obtained from [15,17,23,30,69].

3.2.1. The OTWRB When Considering Only One Criterion

As mentioned in Section 2.3.1, LCC is used to for the economic indicator associated with the ITEWB. With the increase of ITEWB, on the one hand, the economic indicator associated with the operational energy decreases as the operational energy demand decreases. On the other hand, the economic indicator associated with insulation material increases linearly with the increase in the insulation material. Figure 8 shows the insulation thickness and the LCC for Wuhan. It shows that when insulation thickness is enlarged from 50 mm to 70 mm, the reduction in the operational energy cost outweighs the increase in the insulation material. However, when the ITEWB extends from 70 mm to 90 mm, the reduction in the energy cost cannot offset the increase in the insulation material. Thus, the lowest LCC is achieved at 70 mm.
The LPED and LGWP are used for the energy and greenhouse gas emissions aspects of the ITEWB, as mentioned in Section 2.3. As shown in Figure 9, the PED of operational energy is a major part of the LPED related to the ITEWB, while the PED of insulation material is only a small part. Changes in insulation thickness determine the operational energy consumption, while the operational energy consumption determines the LPED associated with the ITEWB. The 150 mm ITEWB results in the least operational energy consumption and the least LPED.
The LGWP shows a similar trend as shown in Figure 10. The GWP of operational energy consumption comprises the overwhelming part of the LGWP related to the ITEWB. The 150 mm ITEWB results in the least operational energy and the least LGWP.
  • Impact of different cities on the OTWRB when only considering one criterion
As shown in Figure 11, the LCC trend lines for all four cities exhibit similar trends, wherein the value tends to decrease early and then eventually rises. Such relations between the ITEWB and its LCC is also revealed by [15,17,23], the optimal economic ITEWB for these four cities is 70 mm in this case.
As shown in Figure 12 and Figure 13, when the ITEWB increases from 30 mm to 150 mm, the LPED and the LGWP decreases. The OTWRB, when only considering energy or greenhouse gas emissions factor is 150 mm for all these four cities.
The impacts of insulation thickness on the LCC, LPED and LGWP are most noticeable for Wuhan, which has the largest operational energy consumption and is less obvious for Chengdu which has the least operational energy consumption. This is because the reduction of energy consumption is more obvious for larger building operational energy consumers when the insulation thickness increases from 30 mm to 150 mm.
  • Impact of different operation modes on the OTWRB when only considering one criterion
As shown in Figure 14, for both scenarios, within a certain range of the ITEWB, with the increase of the ITEWB, the life cycle cost associated with the ITEWB decreases to a certain value and then it starts to increase when the ITEWB beyond this value [18,70]. The optimal economic insulation thickness is less for intermittent operation mode than that for the continuous mode. Here are the reasons.
For the continuous operation mode, when the ITEWB increases from 50 to 70 mm, the reduction of operational energy cost result from the reduction of the operational energy consumption can make up for the 20 mm increase in insulation material investment. As a result, the total cost for 70 mm ITEWB is less than that for 50 mm ITEWB. However, for the intermittent operation mode, there is less operational energy consumption and there is less reduction in operational energy consumption. The reduction of operational cost cannot make up to the increase in insulation material investment. As a result, the total cost for 70 mm insulation thickness is more than that for 50 mm insulation.
As shown in Figure 15, for these two different operation modes of air conditioners, with the increase of the ITEWB, the LPED and LGWP associated with the ITEWB decrease. For the intermittent scenario, the impact of the ITEWB on the operational energy consumption is less obvious, leading to less obvious variations in the LPED and LGWP compared to the continuous scenario.

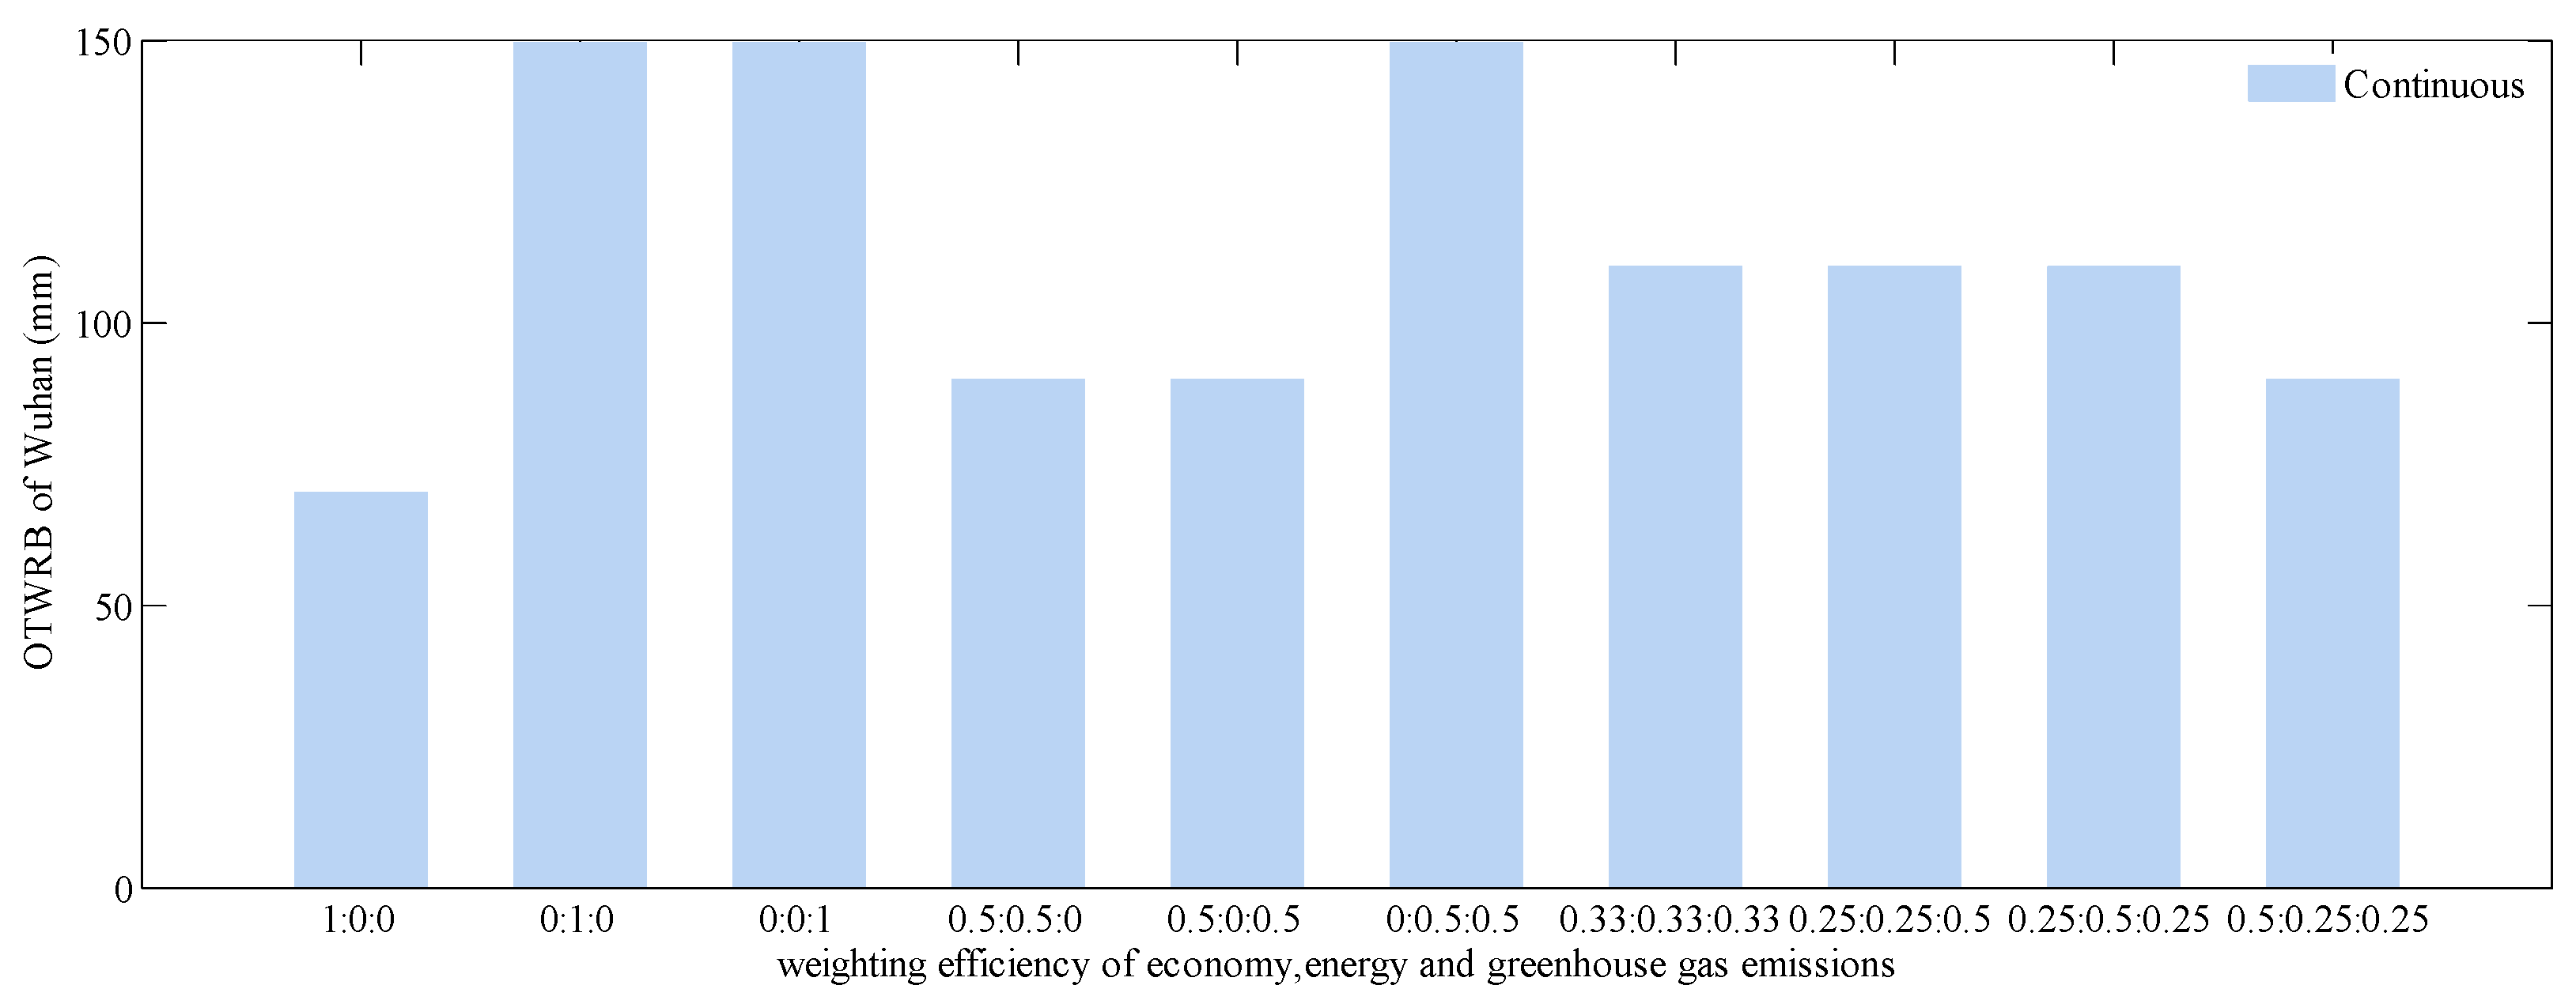
3.2.2. The OTWRB When Considering Different Weighting Efficiencies

As shown in Figure 16, the different weighting efficiencies of economy, energy and greenhouse emissions have a certain impact on the OTWRB. When there are fewer weighting efficiencies assigned to the economic criteria, the optimal insulation thickness tends to become larger.
  • Impact of different cities on the OTWRB when considering different weighting efficiencies
As shown in Figure 17 and Figure 18, the OTWRB for different cities under continuous and intermittent operation modes of air conditioners are roughly the same.
The OTWRB for Wuhan is the largest while the OTWRB for Chengdu is the smallest for the same weighting system. This is because Wuhan has the largest operational energy consumption while the operational energy consumption for Chengdu is the smallest. As the impact of the increase of ITEWB is more obvious for larger energy consumers, the reduction in operational energy consumption in Wuhan is more than that in Chengdu. As a result, within a certain range of ITEWB, the net benefit by increasing ITEWB in Wuhan is more than that in Chengdu.
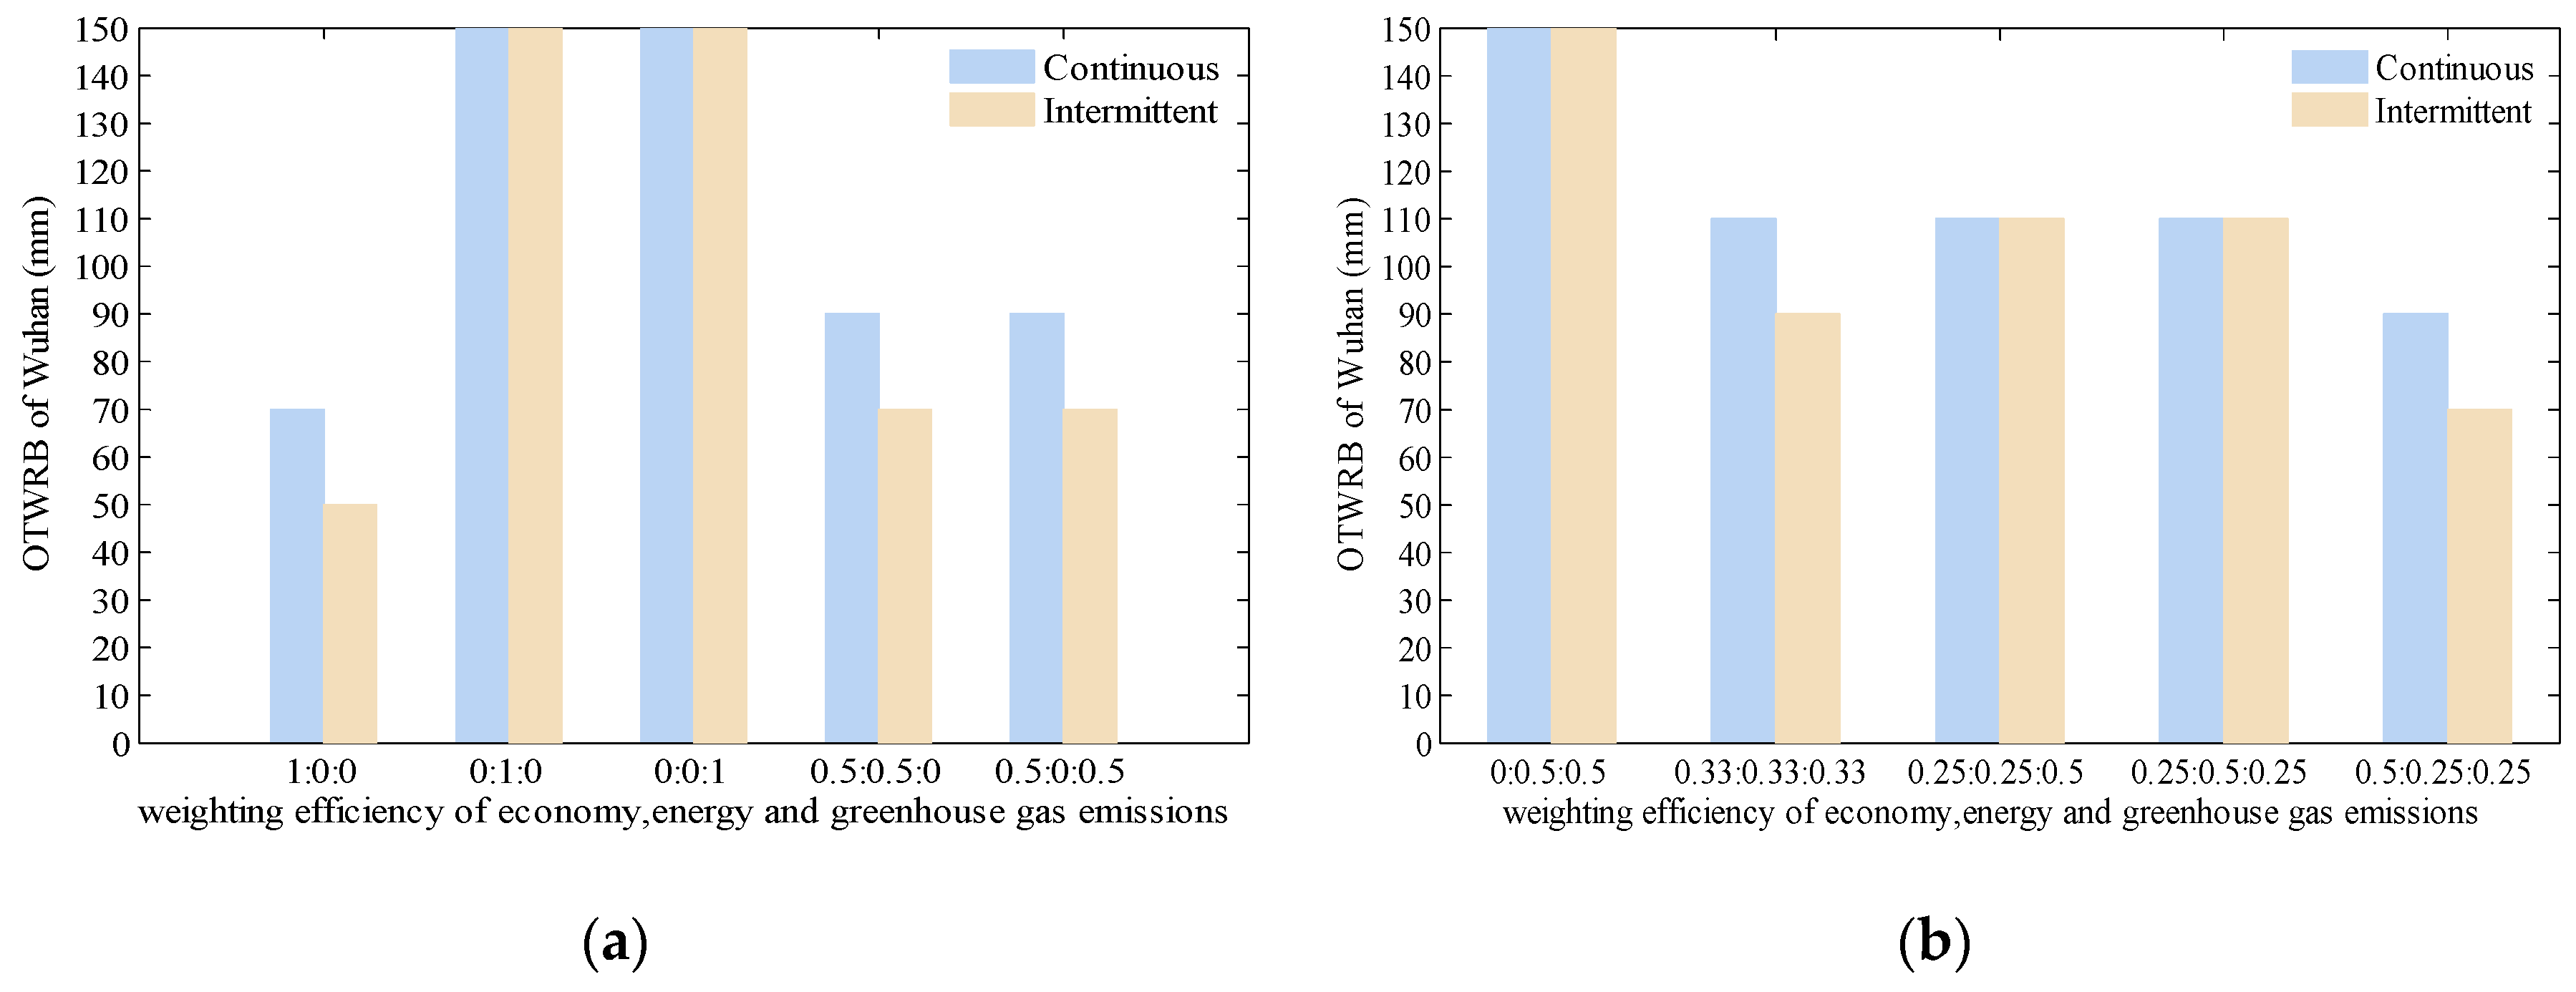
  • Impact of different operation modes on the OTWRB when considering different weighting efficiencies
In Figure 19, for half of the various weighting systems, the OTWRB for two different operational modes of air conditioners are different. This is because of the certain assumption of the intermittent operation mode in this paper, resulting in differences in operational energy consumption between the continuous operation mode and the intermittent operation mode.

4. Conclusion and Limitations

4.1. Conclusions

This study proposes a framework to analyze and select the OTWRB in the HSCW zone of China. The criteria for this selection consider the integrated impacts of the ITEWB on building performance quantified by LCC, LPED and LGWP. Hypothetical buildings are simulated with split air conditioners and using EPS as the insulation material in four typical cities of China, which are chosen as Wuhan, Changsha, Hangzhou and Chengdu. Two different operation modes of air conditioners (intermittent and continuous) are considered in this paper. The main findings of this study are as follows:
  • For the continuous operation mode of air conditioners in Wuhan, the optimal economic insulation thickness is 70 mm. When considering only the aspects of energy consumption and greenhouse gas emissions, the optimal value is 150 mm. For different weighting efficiencies assigned to the economy, energy and greenhouse gas emissions, the OTWRB is determined to be 70, 90, 110, or 150 mm. For all these weighting systems, the OTWRB is larger than the current insulation thickness, which is 30 mm.
  • When the weighting efficiencies assigned to the economy, energy and greenhouse gas emissions change, the OTWRB might also change. In this paper, when the range of insulation thickness is 30 mm to 150 mm, the minimum OTWRB is achieved when the economic factor is the only criterion. On the other hand, the maximum OTWRB is obtained when sufficient weighting efficiencies are assigned to the energy and greenhouse gas emissions factors. When larger weighting efficiencies applied to the energy and greenhouse gas emissions factors, the OTWRB did not become smaller.
  • The different operation modes of air conditioners have a certain impact on the OTWRB based on the results of this study.
  • The OTWRB is almost the same for these four cities based on the results of this study. The OTWRB is found to be the largest for Wuhan, which consumes the most operational energy, and smallest for Chengdu, which consumes the least operational energy for the same weighting system.

4.2. Limitations

There are still some areas in need of improvement for future research:
  • The impact of different kinds of intermittent operation modes of space heating and cooling systems on the OTWRB is not considered in this paper.
  • A general formula to optimize ITEWB related to meteorological data is not provided in this paper.

Author Contributions

Conceptualization, methodology, software, validation, formal analysis, investigation, resources, data curation, writing—original draft preparation, X.C.; supervision, X.L. and M.S. For research articles with three authors, all authors have read and agreed to the published version of the manuscript.

Funding

This research was funded by the Key Research and Development Plan of Shaanxi Province (China, No: 2018ZDCXL-SF-03-04).

Acknowledgments

The authors are sincerely grateful to Runming Yao, University of Reading, who kindly gave suggestions during the research.

Conflicts of Interest

The authors declare no conflict of interest.

References

  1. Liu, X.; Hu, W. Attention and sentiment of Chinese public toward green buildings based on Sina Weibo. Sustain. Cities Soc. 2019, 44, 550–558. [Google Scholar] [CrossRef]
  2. Liang, D.; Hanwei, L.; Liguo, Z.; Zhaowen, L.; Zhiqiu, G.; Mingming, H. Highlighting regional eco-industrial development: Life cycle benefits of an urban industrial symbiosis and implications in China. Ecol. Modell. 2017, 164–176. [Google Scholar] [CrossRef]
  3. Mi, Z.; Wei, Y.M.; Wang, B.; Meng, J.; Liu, Z.; Shan, Y.; Liu, J.; Guan, D. Socioeconomic impact assessment of China’s CO2 emissions peak prior to 2030. J. Clean. Prod. 2017, 142, 2227–2236. [Google Scholar] [CrossRef] [Green Version]
  4. Huo, T.; Ren, H.; Cai, W. Estimating urban residential building-related energy consumption and energy intensity in China based on improved building stock turnover model. Sci. Total Environ. 2019, 650, 427–437. [Google Scholar] [CrossRef] [PubMed]
  5. MOHURD. Code of Thermal Design of Civil Building GB 50176-93; Ministry of Housing and Urban-Rural Development, People’s Republic of China: Beijing, China, 1995.
  6. Cui, Y.; Yan, D.; Chen, C. Exploring the factors and motivations influencing heating behavioral patterns and future energy use intentions in the hot summer and cold winter climate zone of China. Energy Build. 2017, 153, 99–110. [Google Scholar] [CrossRef]
  7. China National Bureau of Statistics. China Statistical Yearbook 2013; China National Bureau of Statistics: Beijing, China, 2013.
  8. Gao, Y.; Wu, J.; Cheng, Y. Study on the heating modes in the hot summer and cold winter region in China. Procedia Eng. 2015, 121, 262–267. [Google Scholar] [CrossRef]
  9. Du, C.; Li, B.; Yu, W.; Liu, H.; Yao, R. Energy flexibility for heating and cooling based on seasonal occupant thermal adaptation in mixed-mode residential buildings. Energy 2019, 189, 116339. [Google Scholar] [CrossRef]
  10. BERC. China Building Energy Use 2018; BERC: Beijing, China, 2018.
  11. Ichinose, T.; Lei, L.; Lin, Y. Impacts of shading effect from nearby buildings on heating and cooling energy consumption in hot summer and cold winter zone of China. Energy Build. 2017, 136, 199–210. [Google Scholar] [CrossRef]
  12. Guo, S.; Yan, D.; Peng, C.; Cui, Y.; Zhou, X.; Hu, S. Investigation and analyses of residential heating in the HSCW climate zone of China: Status quo and key features. Build. Environ. 2015, 94, 532–542. [Google Scholar] [CrossRef]
  13. Lang, S. Progress in energy-efficiency standards for residential buildings in China. Energy Build. 2004, 36, 1191–1196. [Google Scholar] [CrossRef]
  14. Barrau, J.; Ibañez, M.; Badia, F. Impact of the optimization criteria on the determination of the insulation thickness. Energy Build. 2014, 76, 459–469. [Google Scholar] [CrossRef]
  15. Saafi, K.; Daouas, N. A life-cycle cost analysis for an optimum combination of cool coating and thermal insulation of residential building roofs in Tunisia. Energy 2018, 152, 925–938. [Google Scholar] [CrossRef]
  16. Densley Tingley, D.; Hathway, A.; Davison, B. An environmental impact comparison of external wall insulation types. Build. Environ. 2015, 85, 182–189. [Google Scholar] [CrossRef]
  17. Nematchoua, M.K.; Raminosoa, C.R.R.; Mamiharijaona, R.; René, T.; Orosa, J.A.; Elvis, W.; Meukam, P. Study of the economical and optimum thermal insulation thickness for buildings in a wet and hot tropical climate: Case of Cameroon. Renew. Sustain. Energy Rev. 2015, 50, 1192–1202. [Google Scholar] [CrossRef] [Green Version]
  18. Kayfeci, M.; Keçebaş, A.; Gedik, E. Determination of optimum insulation thickness of external walls with two different methods in cooling applications. Appl. Therm. Eng. 2013, 50, 217–224. [Google Scholar] [CrossRef]
  19. Çomakli, K.; Yüksel, B. Optimum insulation thickness of external walls for energy saving. Appl. Therm. Eng. 2003, 23, 473–479. [Google Scholar] [CrossRef]
  20. Yu, J.-H.; Yang, C.-Z.; Tian, L.-W.; Liao, D. Research on the optimum insulation thickness of the external wall for residential buildings in Changsha region. Hunan Daxue Xuebao/J. Hunan Univ. Nat. Sci. 2009, 36, 16–21. [Google Scholar]
  21. Carreras, J.; Boer, D.; Cabeza, L.F.; Jiménez, L.; Guillén-Gosálbez, G. Eco-costs evaluation for the optimal design of buildings with lower environmental impact. Energy Build. 2016, 119, 189–199. [Google Scholar] [CrossRef] [Green Version]
  22. Lin, F.; Delin, D.; Fuzhen, L. Calculation of economic thermal insulation thicknesses on roof and walls of air-conditionerd buildings. Acta Energiae Solaris Sin. 2002, 23, 711–716. [Google Scholar]
  23. Huang, R.; Li, L.; Wu, H.L.Z. The economic analysis of building exterior wall thermal insulation material thickness in hot summer and cold winter zone. New Build. Mater. 2017, 9, 105–110. [Google Scholar]
  24. Fang, R. Theoretical research on envelope insulation effect for residential building with compartmental and intermittent energy consuming method. Ph.D. Thesis, Zhejiang University, Hangzhou, China, 2017. [Google Scholar]
  25. Li, N.; Chen, Q. Experimental study on heat transfer characteristics of interior walls under partial-space heating mode in hot summer and cold winter zone in China. Appl. Therm. Eng. 2019, 162, 114264. [Google Scholar] [CrossRef]
  26. Cheng, F.; Zhang, X.X.S. Thermal performance analysis of internal and external insulation for exterior wall of residential building in hot summer and cold winter zone. J. Tongji Univ. Nat. Sci. 2017, 45, 827–832. [Google Scholar]
  27. Yao, R.; Costanzo, V.; Li, X.; Zhang, Q.; Li, B. The effect of passive measures on thermal comfort and energy conservation. A case study of the hot summer and cold winter climate in the Yangtze River region. J. Build. Eng. 2018, 15, 298–310. [Google Scholar] [CrossRef] [Green Version]
  28. Fu, X.; Qian, X.; Wang, L. Energy efficiency for airtightness and exterior wall insulation of passive houses in hot summer and cold winter zone of China. Sustainability 2017, 9, 1097. [Google Scholar] [CrossRef] [Green Version]
  29. Yu, J.; Tian, L.; Yang, C.; Xu, X.; Wang, J. Optimum insulation thickness of residential roof with respect to solar-air degree-hours in hot summer and cold winter zone of china. Energy Build. 2011, 43, 2304–2313. [Google Scholar] [CrossRef]
  30. Liu, X.; Chen, Y.; Ge, H.; Fazio, P.; Chen, G.; Guo, X. Determination of optimum insulation thickness for building walls with moisture transfer in hot summer and cold winter zone of China. Energy Build. 2015, 109, 361–368. [Google Scholar] [CrossRef]
  31. Çomaklı, K.; Yüksel, B.; Çomakli, K. Environmental impact of thermal insulation thickness in buildings. Appl. Therm. Eng. 2004, 24, 933–940. [Google Scholar] [CrossRef]
  32. Ashouri, M.; Astaraei, F.R.; Ghasempour, R.; Ahmadi, M.H.; Feidt, M. Optimum insulation thickness determination of a building wall using exergetic life cycle assessment. Appl. Therm. Eng. 2016, 106, 307–315. [Google Scholar] [CrossRef]
  33. Jie, P.; Zhang, F.; Fang, Z.; Wang, H.; Zhao, Y. Optimizing the insulation thickness of walls and roofs of existing buildings based on primary energy consumption, global cost and pollutant emissions. Energy 2018, 159, 1132–1147. [Google Scholar] [CrossRef]
  34. Li, X. Study on the energy saving design of urban heating residential building in southern area of Shaanxi province. Ph.D. Thesis, Xi’an University of Architecture and Technology, Xi’an, China.
  35. Xiong, Y.; Liu, J.; Kim, J. Understanding differences in thermal comfort between urban and rural residents in hot summer and cold winter climate. Build. Environ. 2019, 165, 106393. [Google Scholar] [CrossRef]
  36. Liu, H.; Wu, Y.; Li, B.; Cheng, Y.; Yao, R. Seasonal variation of thermal sensations in residential buildings in the Hot Summer and Cold Winter zone of China. Energy Build. 2017, 140, 9–18. [Google Scholar] [CrossRef]
  37. Li, B.; Du, C.; Yao, R.; Yu, W.; Costanzo, V. Indoor thermal environments in Chinese residential buildings responding to the diversity of climates. Appl. Therm. Eng. 2018, 129, 693–708. [Google Scholar] [CrossRef]
  38. Ren-da, H.; Li, L.; Huijun, W.; Hui, Z. Analysis on thermal insulation thickness of different wall structures in hot summer and cold winter zone. Bull. Chin. Creamic Soc. 2018, 37, 1829–1835. [Google Scholar]
  39. Ge, J.; Wu, J.; Chen, S.; Wu, J. Energy efficiency optimization strategies for university research buildings with hot summer and cold winter climate of China based on the adaptive thermal comfort. J. Build. Eng. 2018, 18, 321–330. [Google Scholar] [CrossRef]
  40. Wang, Y.; Iskandar Jobli, M.; Zheng, C.; Yang, X.; Li, K. Thickness of building external insulation in Chongqing based on intermittent heating supply. Procedia Eng. 2017, 205, 2755–2761. [Google Scholar] [CrossRef]
  41. Hu, S.; Yan, D.; Cui, Y.; Guo, S. Urban residential heating in hot summer and cold winter zones of China-Status, modeling, and scenarios to 2030. Energy Policy 2016, 92, 158–170. [Google Scholar] [CrossRef]
  42. Yu, J.; Yang, C.; Tian, L.; Liao, D. Evaluation on energy and thermal performance for residential envelopes in hot summer and cold winter zone of China. Appl. Energy 2009, 86, 1970–1985. [Google Scholar] [CrossRef]
  43. Jinghua, Y.; Liwei, T.; Changzhi, Y.; Xinhua, X.; Jinbo, W. Sensitivity analysis of energy performance for high-rise residential envelope in hot summer and cold winter zone of China. Energy Build. 2013, 64, 264–274. [Google Scholar] [CrossRef]
  44. MOHURD. Code of Thermal Design of Civil Buidling GB50176-2016; Ministry of Housing and Urban-Rural Development, People’s Republic of China: Beijing, China, 2016.
  45. Li, X.; Yao, R.; Yu, W.; Meng, X.; Liu, M.; Short, A.; Li, B. Low carbon heating and cooling of residential buildings in cities in the hot summer and cold winter zone - A bottom-up engineering stock modeling approach. J. Clean. Prod. 2019, 220, 271–288. [Google Scholar] [CrossRef]
  46. Lihang, Y. The influence of occupant behavior on building energy consumption of residential buildings in hot summer and cold winter zone. Master’s Thesis, Zhejiang University, Hangzhou, China, 2016. [Google Scholar]
  47. Chen, S.; Wang, X.; Lun, I.; Chen, Y.; Wu, J.; Ge, J. Effect of inhabitant behavioral responses on adaptive thermal comfort under hot summer and cold winter climate in China. Build. Environ. 2020, 168, 106492. [Google Scholar] [CrossRef]
  48. Zhang, G.; Li, X.; Shi, W.; Wang, B.; Li, Z.; Cao, Y. Simulations of the energy performance of variable refrigerant flow system in representative operation modes for residential buildings in the hot summer and cold winter region in China. Energy Build. 2018, 174, 414–427. [Google Scholar] [CrossRef]
  49. Yu, J.; Yang, C.; Tian, L.; Liao, D. A study on optimum insulation thicknesses of external walls in hot summer and cold winter zone of China. Appl. Energy 2009, 86, 2520–2529. [Google Scholar] [CrossRef]
  50. Wang, Z.; Zhao, Z.; Lin, B.; Zhu, Y.; Ouyang, Q. Residential heating energy consumption modeling through a bottom-up approach for China’s Hot Summer-Cold Winter climatic region. Energy Build. 2015, 109, 65–74. [Google Scholar] [CrossRef]
  51. Songqin, L.; Changzhi, Y.; Hongqiang, L.; Yingjie, M. Analysis on influence of solar radiation on building envelope energy consumption in hot summer and cold winter zone. J. Hunan Univ. 2018, 45, 149–156. [Google Scholar]
  52. Kheiri, F. A review on optimization methods applied in energy-efficient building geometry and envelope design. Renew. Sustain. Energy Rev. 2018, 92, 897–920. [Google Scholar] [CrossRef]
  53. Amiri Rad, E.; Fallahi, E. Optimizing the insulation thickness of external wall by a novel 3E (energy, environmental, economic) method. Constr. Build. Mater. 2019, 205, 196–212. [Google Scholar] [CrossRef]
  54. Ozel, M. Effect of insulation location on dynamic heat-transfer characteristics of building external walls and optimization of insulation thickness. Energy Build. 2014, 72, 288–295. [Google Scholar] [CrossRef]
  55. He, L.-s.; Jian, G.; Hua-cun, L.; Chuan-hong, J. Optimization of insulation layer thickness of inward-outward combined insulation enclosure system in hot summer and cold winter zone. Archit. Technol. 2016, 47, 75–76. [Google Scholar]
  56. Blight, T.S.; Coley, D.A. Sensitivity analysis of the effect of occupant behaviour on the energy consumption of passive house dwellings. Energy Build. 2013, 66, 183–192. [Google Scholar] [CrossRef]
  57. Kandar, M.Z.; Nimlyat, P.S.; Abdullahi, M.G.; Dodo, Y.A. Influence of inclined wall self-shading strategy on office building heat gain and energy performance in hot humid climate of Malaysia. Heliyon 2019, 5. [Google Scholar] [CrossRef]
  58. Xi, C.; Hongxing, Y. Combined thermal and daylight analysis of a typical public rental housing development to fulfil green building guidance in Hong Kong. Energy Build. 2015, 108, 420–432. [Google Scholar] [CrossRef]
  59. Zune, M.; Rodrigues, L.; Gillott, M. Vernacular passive design in Myanmar housing for thermal comfort. Sustain. Cities Soc. 2020, 54, 101992. [Google Scholar] [CrossRef]
  60. Lu, S.; Tang, X.; Ji, L.; Tu, D. Research on energy-saving optimization for the performance parameters of rural-building shape and envelope by trnsys-genopt in hot summer and cold winter zone of China. Sustainability 2017, 9, 294. [Google Scholar] [CrossRef] [Green Version]
  61. Linsen, M. Energy saving effect of internal and external themal insulation in hot summer and cold winter area. Archit. Cult. 2016, 4, 158–159. [Google Scholar]
  62. Çetintaş, K.F.; Yılmaz, Z. A new approach to determine insulation material and thickness from a life-cycle perspective. Proc. Inst. Civ. Eng. - Energy 2017, 171, 171–181. [Google Scholar] [CrossRef]
  63. Sartori, I.; Hestnes, A.G. Energy use in the life cycle of conventional and low-energy buildings: A review article. Energy Build. 2007, 39, 249–257. [Google Scholar] [CrossRef]
  64. Tian, X.; Wu, Y.; Hou, P.; Liang, S.; Qu, S.; Xu, M.; Zuo, T. Environmental impact and economic assessment of secondary lead production: Comparison of main spent lead-acid battery recycling processes in China. J. Clean. Prod. 2017, 144, 142–148. [Google Scholar] [CrossRef]
  65. Shariah, A.; Tashtoush, B.; Rousan, A. Cooling and heating loads in residential buildings in Jordan. Energy Build. 1997, 26, 137–143. [Google Scholar] [CrossRef]
  66. Lianying, Z.; Yuan, W.; Jiyuan, Z.; Xing, L.; Linhua, Z. Numerical study of effects of wall’s insulation thickness on energy performance for different climatic regions of China. Energy Procedia 2015, 75, 1290–1298. [Google Scholar] [CrossRef] [Green Version]
  67. Masoso, O.T.; Grobler, L.J. A new and innovative look at anti-insulation behaviour in building energy consumption. Energy Build. 2008, 40, 1889–1894. [Google Scholar] [CrossRef]
  68. Yuan, J. Impact of insulation type and thickness on the dynamic thermal characteristics of an external wall structure. Sustainability 2018, 10, 2835. [Google Scholar] [CrossRef] [Green Version]
  69. Miaomiao, X.; Zhou, J. Life cycle assessment on insulation board of expanded polystyrene. New Build. Mater. 2015, 42, 74–77. [Google Scholar]
  70. Dombayci, Ö.A.; Gölcü, M.; Pancar, Y. Optimization of insulation thickness for external walls using different energy-sources. Appl. Energy 2006, 83, 921–928. [Google Scholar] [CrossRef]
Figure 1. Four typical cities in the hot summer and cold winter (HSCW) zone of China.
Sustainability 12 01574 g001
Figure 2. Geometry information of the case study building: (a) The floor plan of the case study building; (b) The elevation drawing of the case study building.
Sustainability 12 01574 g002
Figure 3. Heating and cooling energy consumption for scenario continuous for: (a) Wuhan; (b) Changsha; (c) Hangzhou; (d) Chengdu.
Sustainability 12 01574 g003aSustainability 12 01574 g003b
Figure 4. Insulation thickness and thermal transmittance of the external wall of the case study building.
Sustainability 12 01574 g004
Figure 5. Annual operational energy consumption for scenario continuous.
Sustainability 12 01574 g005
Figure 6. Energy consumption of four cities for scenario continuous for: (a) Heating; (b) Cooling.
Sustainability 12 01574 g006
Figure 7. Annual energy consumption for the continuous and intermittent scenarios for Wuhan.
Sustainability 12 01574 g007
Figure 8. The ITEWB and the life cycle cost (LCC) for Wuhan under a continuous scenario.
Sustainability 12 01574 g008
Figure 9. The ITEWB and the life cycle primary energy demand (LPED) for Wuhan under continuous scenario.
Sustainability 12 01574 g009
Figure 10. The ITEWB and the life cycle global warming potential (LGWP) for Wuhan under continuous scenario.
Sustainability 12 01574 g010
Figure 11. The ITEWB and the LCC for four cities under the continuous scenario.
Sustainability 12 01574 g011
Figure 12. The ITEWB and LPED for four cities under the continuous scenario.
Sustainability 12 01574 g012
Figure 13. The ITEWB and LGWP for four cities under the continuous scenario.
Sustainability 12 01574 g013
Figure 14. Comparison of LCC of the ITEWB under two scenarios of Wuhan.
Sustainability 12 01574 g014
Figure 15. Comparison of indicators associated with the ITEWB for two different operational modes of air conditioners of Wuhan: (a) Comparison of LPED; (b) Comparison of LGWP.
Sustainability 12 01574 g015
Figure 16. OTWRB considering different weighting efficiencies of economy, energy and greenhouse emissions for Wuhan under the continuous scenario.
Sustainability 12 01574 g016
Figure 17. Impact of different cities on the optimal insulation thickness of external walls for residential buildings (OTWRB) when considering different weighting efficiencies of economy, energy, and greenhouse gas emissions under the continuous scenario.
Sustainability 12 01574 g017
Figure 18. Impact of different cities on the OTWRB when considering different weighting efficiencies of economy, energy, and greenhouse gas emissions under the intermittent scenario.
Sustainability 12 01574 g018
Figure 19. Impact of different operation modes of air conditioners on the OTWRB for Wuhan when considering different weighting efficiency: (a) Weighting 1; (b) Weighting 2.
Sustainability 12 01574 g019
Table 1. Typological characteristics of the building.
ResourceStoreyConstruction Plane FormFloor Area per Household
This paper12 (multi-story)reinforced concretethree bedrooms, one living room and one dining roomaround 112 m2 (about 100 m2)
Reference [35][9,36,37] [9] [12]
Table 2. U value of the envelope of the typical building.
ResourceU Value of the Building Component (w/m2k)
Ground/Exposed FloorRoofWindow
this paper1.790.772.67
[34] ------0.7852.8
Table 3. Structure of the external wall of the typical building.
Layer (Outside to Inside)Thickness (mm)
Cement mortar20
Expanded polystyrene30
Reinforced concrete200
Cement mortar20
Table 4. Thermal system setting of the hypothetical building.
FactorAssumptionReference
Equipment heat gain4.3 W/m2[43]
Heating spaceLiving room and bedroom[44]
Cooling spaceLiving room and bedroom[44]
Heating periodFrom 1st December to 28th February of the following year[45]
Cooling periodFrom 15th June to 15th September[34]
Heating setpoint temperature18 °C[43,45]
Heating trigger temperature16 °C[46]
Cooling setpoint temperature26 °C[43,45]
Cooling trigger temperature29 °C[47]
Infiltration rate (ach)1.0/h[43,48]
Coefficient of performance (COP) of Heating system1.9[30,43,49]
Coefficient of performance (COP) of Cooling system2.3[30,43,49]
Table 5. Two operation modes of air conditioners of the hypothetical building.
ScenarioSpaceDaily Operation TimeReference
ContinuousBedroom0:00–24:00[44]
Living room0:00–24:00
IntermittentBedroom0:00–8:00[50]
22:00–24:00
Living room17:00–22:00
Table 6. Meteorological information of the hypothetical building.
LocationAnnual AverageHDDCDD
Dry-Bulb Temperature (°C)Wind Speed (m/s)Global Radiation (W/m2)External RH (%)
Wuhan15.892.32163.1476.551122.62224.12
Changsha16.312.36151.2880.911020.10220.78
Hangzhou15.512.50152.9777.721094.81169.78
Chengdu15.761.08146.0381.04949.5014.40
HDD: heating degree days for the base temperature of 18 °C during the heating period. CDD: cooling degree days for the base temperature of 26 °C during the cooling period.
Table 7. Comparison of energy consumption as calculated by IES-VE (Integrate Environmental Solution-Virtual Environment) in this paper for Hangzhou with existing research.
Paper ResourceU Value of the External Wall (w/m2k)Heating Energy Consumption (kwh/m2)Cooling Energy Consumption (kwh/m2)Annual Energy Consumption (kwh/m2)
This paper 0.75 25.11 12.06 39.40
[46] 0.722612.538.5
[60] 0.87---- ---- 18–38
[61] 0.84-------43.42
Table 8. Abbreviations used in the life cycle cost of the insulation thickness of the external wall of residential buildings (ITEWB).
AbbreviationExplainUnits
L C C i n s Life cycle cost of the ITEWB yuan
L C C m a t e r i a l Life cycle cost of insulation material associated with the ITEWByuan
L C C o p e r a t i o n Life cycle cost of operational energy associated with the ITEWByuan
C i n s Cost of insulation material per unityuan/m3
A w Area of external wallm2
ξ i n s The thickness of the insulation layermm
C o p Cost of operational energy per unityuan/kwh
Q o p Annual operational energy consumptionkwh/year
N e Insulation layer lifetimeyear
P 1 Present worth factor (PWF)--
i Interest rate--
d Inflation rate--
Table 9. Abbreviations used in the life cycle primary energy demand of the ITEWB.
AbbreviationDefinitionUnits
ρ The density of the insulation materialkg/m3
L P E D i n s Life cycle primary energy demand of the ITEWB kgce
L P E D m a t e r i a l Life cycle primary energy demand of insulation material associated with the ITEWBkgce
L P E D o p e r a t i o n Life cycle primary energy demand of operational energy associated with the ITEWBkgce
P E D i n s Primary energy demand of
insulation material per unit
kgce/kg
P E D o p Primary energy demand of
operational energy per unit
kgce/kwh
Table 10. Abbreviations used in the life cycle global warming potential of the ITEWB.
AbbreviationDefinitionUnits
L G W P i n s Life cycle global warming potential of the ITEWB kgCO2eq
L G W P m a t e r i a l Life cycle global warming potential of insulation material associated with the ITEWBkgCO2eq
L G W P o p e r a t i o n       Life cycle global warming potential of operational energy associated with the ITEWBkgCO2eq
G W P i n s Global warming potential of
insulation material per unit
kgCO2eq/kg
G W P o p Global warming potential of
operational energy per unit
kgCO2eq/kwh
Table 11. Abbreviations used in the min-max method.
AbbreviationDefinition
N L C C r Normalized life cycle cost of the ITEWB
N L P E D r Normalized life cycle primary energy demand of ITEWB
N L G W P r Normalized life cycle global warming potential of ITEWB
L C C r , m i n The minimum life cycle cost of ITEWB
L C C r , m a x The maximum life cycle cost of ITEWB
L P E D r , m i n The minimum life cycle primary energy demand of ITEWB
L P E D r , m a x The maximum life cycle primary energy demand of ITEWB
L G W P r , m i n The minimum life cycle global warming potential of ITEWB
L G W P r , m a x The maximum life cycle global warming potential of ITEWB
w 1 , w 2   , w 3   Weighting efficiency assigned to economy, energy and greenhouse gas emissions
rInsulation thickness, which is 30, 50, 70, 90, 110, 130, 150 mm in this paper
Table 12. Parameters used in the evaluation of the impacts of the ITEWB on building performance.
ParameterValueUnit
i1%---
d5%---
N e 20year
P 1 13.50 ---
ρ 30kg/m3
C i n s 600yuan/m3
C o p 0.52 yuan/kwh
P E D ins 3.95 kgce/kg
P E D O P 0.46 kgce/kwh
G W P i n s 5.64 kgCO2eq/kg
G W P O P 1.01 kgCO2eq/kwh

