Article

Influence of Agricultural Irrigation Activity on the Potential Risk of Groundwater Pollution: A Study with Drastic Method in a Semi-Arid Agricultural Region of China

1
College of Water Conservancy, Shenyang Agricultural University, Shenyang 110866, China
2
Survey of Hydrogeology, Engineering & Environmental Geology in Qinghai, Xining 810008, China
3
Shenyang Institute of Technology, Fushun 113122, China
4
Shenyang Center China Geological Survey Bureau, Shenyang 110034, China
*
Author to whom correspondence should be addressed.
L.M. and Q.Z. contributed to this work equally.
Sustainability 2020, 12(5), 1954; https://doi.org/10.3390/su12051954
Submission received: 27 January 2020 / Revised: 27 February 2020 / Accepted: 2 March 2020 / Published: 4 March 2020
(This article belongs to the Section Environmental Sustainability and Applications)

Abstract

:
Agricultural irrigation strongly affects groundwater pollution in cultivated areas. Groundwater vulnerability was evaluated using the DRASTIC method by considering agricultural activities that affect water infiltration and pollutant transport to the groundwater. Three scenarios, using different water recharge sources and calculation methods, were considered for the Tongliao area of northern China. For Scenario 1, only precipitation contributed to the net recharge estimation and ~33.77% of the area was under high pollution risk. For Scenarios 2 and 3, both precipitation and irrigation return water were considered for net recharge estimations. The fractional areas of high pollution risk regions were 40.60% and 19.22% for Scenarios 2 and 3, respectively. The modified infiltration coefficients for this study area were used in Scenario 3, and the fractional area of the high-risk region was 21.38% lower than for Scenario 2. The use of empirical infiltration coefficients in Scenario 2 overestimated the water infiltration ability in the cultivated areas, which also overestimated the fractional area of high-risk regions in this study. Accurate assessment of the impact of agricultural activities on the groundwater pollution risk is essential for cultivated areas. Emphasis should be placed on the calculation method of proper parameters for DRASTIC model construction.

1. Introduction

In the arid and semi-arid regions of the world, surface water is often insufficient for meeting the production and domestic water demands of residents; thus, groundwater has gradually become an important source of water supply for regional development [1,2,3,4,5]. However, the lack of necessary protection measures for the development and utilization of groundwater, as well as human activity, often result in groundwater pollution, posing serious threats to the drinking water safety and sustainable socio-economic development [6,7]. Owing to the inaccessibility, complexity, and the poor self-purification capacity of groundwater systems, groundwater pollution control is often difficult and expensive. Therefore, effective pollution risk assessment is important for protecting groundwater resources.
Groundwater vulnerability assessment is fundamental for protecting groundwater resources, and it is necessary to evaluate regional groundwater vulnerability early in the risk assessment process [8]. The concept of groundwater vulnerability was first proposed by Matgat in 1968 [9]. Since then, many studies have addressed this issue. Especially after 1980, groundwater vulnerability studies have focused on two topics: 1) specific vulnerability and 2) intrinsic vulnerability [10]. Specific vulnerability refers to the sensitivity of groundwater vulnerability to the pollutants’ properties, human activities, and physical parameters. On the other hand, intrinsic vulnerability refers to the degree to which pollutants diffuse through the soil surface and reach groundwater [11].
Common methods for assessing groundwater vulnerability include the groundwater occurrence, the overlying layers, depth to groundwater rating system (GOD), the aquifer vulnerability index (AVI) rating system, the DRASTIC method and the SINTACS method [12,13,14,15,16]. As one of the methods for groundwater vulnerability assessment, the DRASTIC method has been widely used, owing to its easily obtainable parameters, simplicity, and wide range of applicability. With the rapid development of the geographic information systems (GIS), it is now possible to adjust hydrogeological parameters, further promoting the use of the DRASTIC method [17,18,19,20]. However, there are some disadvantages, such as the need to use empirical parameters, which introduce discrepancies between the evaluation results and actual data [21]. For some sites, the actual occurrence of groundwater pollution did not match the groundwater vulnerability estimated using the DRASTIC method, owing to the unreasonable recognition of pollution sources and water sources [22,23,24]. This suggests that better understanding of the assumptions made using DRASTIC method is important for efficient application.
In the classical DRASTIC approach, net recharge is considered as a result of precipitation infiltration, and the empirical value of the precipitation infiltration coefficient is often used in calculations [25,26,27], even though the net recharge has been noted as the main parameter affecting groundwater vulnerability assessment [28,29].
For areas with multiple recharge sources, such as agricultural irrigation areas, the net recharge is mainly controlled by both the precipitation infiltration and the irrigation return water. The use of chemical fertilizers has increased significantly during the recent years, but the absorption rate of crops has been relatively low [30,31]. Consequently, fertilizers, pesticides, membrane pollutants, livestock, and poultry excrements are potential groundwater pollutants in agricultural areas. During the hydrological cycle, some of these pollutants may enter the groundwater aquifer along with the infiltration water, strongly increasing the groundwater pollution risk [32,33]. Accurate evaluation of the net recharge from the vertical water infiltration in agricultural areas is essential for assessing groundwater vulnerability.
Tongliao area is one of the more important agricultural and pastoral bases in northern China with high demand of irrigation water, owing to the arid climate. The non-point source pollution problem in agricultural areas has aggravated here with time [34]. With the development of water-saving irrigation technology, irrigation methods are constantly evolving; for example, sprinkling irrigation and drip irrigation under films have been promoted and used in the study area. The adjustment of irrigation methods may result in change of water infiltration, which could affect the groundwater pollution risk. Therefore, it is important to evaluate the impact of agricultural irrigation activities on the groundwater pollution risk, which can help governmental agencies to develop better groundwater protection and sustained utilization approaches. To this end, we calculated groundwater vulnerability in this study using DRASTIC method by considering activities that affect water infiltration and pollutant transportation to groundwater in agricultural areas.

2. Materials and Methods

2.1. Study Area

Tongliao city is located in the eastern part of the Inner Mongolia autonomous region; most of the area is located in the vast West Liaohe plain, which is one of the more important farming and pastoral areas in northern China. The bounding longitudes are 119° 14′ and 123° 43′E, while the bounding latitudes are 42° 15′ and 45° 59′N (Figure 1). The climate is a semi-arid continental monsoon, in the temperate zone. The annual average temperature ranges from 0 ℃ to 6 ℃, and the annual rainfall has been ~350 mm during the past 60 years.
The total area of Tongliao city is 59,535 km2 and the cultivated area is ~27,029 km2, accounting for 45.4% of the total area. Agricultural irrigation activities are extensive, and water demand is very high, owing to the arid environment [35]. With the adjustment of agricultural planting structures, changes in the irrigation methods, and increasing demand on the agricultural irrigation water, the ground infiltration conditions in the agricultural irrigation area have changed significantly, significantly increasing the groundwater pollution risk.

2.2. The DRASTIC Method

The DRASTIC method is a parameter-weighted scoring method. The corresponding evaluation indexes are seven weighted hydrogeological parameters: 1) the depth to water table (D), 2) the net recharge (R), 3) the aquifer medium (A), 4) the soil medium (S), 5) the topography (T), 6) the vadose zone medium impact (I), and 7) the hydraulic conductivity (C) [11,13,22]. The vulnerability index of the groundwater environment in the DRASTIC approach is determined by the following equation:
D I = D r D w + R r R w + A r A w + S r S w + T r T w + I r I w + C r C w
where D, R, A, S, T, I, and C are the parameters of the DRASTIC method, and r and w are the rating and the weight assigned to each parameter, respectively. The ratings and the weights of all the parameters are listed in Table 1. The weights of the parameters were normalized based on the original weights proposed by Aller [13].
Depth to water table (D): The depth to water plays an important role in determining groundwater vulnerability; it increases the time of contact between pollutants and the surrounding medium in unsaturated zones [36], and it reduces the groundwater pollution risk by sorption, biodegradation, dispersion, and volatilization during the migration of pollutants. The depth to water data were collected for the period from 2015 to 2017, and the mean value over that period was calculated. Based on the distribution of groundwater and surface elevation, the rating map of D is shown in Table 1 and Figure 2.
Net recharge (R): The net recharge R is not an independent parameter; it is influenced by hydrometeorological and geological parameters, such as atmospheric precipitation, topographic slope, and soil permeability [37]. In agricultural areas, land surface conditions (such as crops and mulch) also affect the amount of net recharge. Water carries surface pollutants into underground aquifers in the infiltration process, which induces groundwater contamination. The net recharge R is positively correlated with the groundwater vulnerability and pollution risk [38]. Therefore, it is important to accurately calculate the value of R, especially when there are multiple supply sources. This issue was thoroughly addressed in the present study.
Aquifer medium (A): The aquifer controls the lateral migration path of contaminants. The migration of contaminants is strongly controlled by the primary and secondary porosities of the aquifer medium, which also determine the attenuation time. The larger the size of the loose rock mass particles, the more cracks and karst pipelines, which increase the aquifer permeability and decrease the attenuation rate. The characteristics of the aquifer medium were taken from the results of a previous hydrogeological survey by the China Geological Survey [39], and the ratings of A are shown in Table 1 and Figure 2.
Soil medium (S): The soil is above the unsaturated area, and its characteristics control the rainfall recharge infiltration, potential dispersion, and pollutant purification process, to name a few. It is also one of the most important factors determining the groundwater pollution area and the pollutant migration rate. For example, the presence of fine particles and organic microorganisms in the soil layer can reduce its intrinsic permeability, increase the soil catabolic activity, and delay or prevent the migration of pollutants via physicochemical processes [40,41,42]. The data for S were for 2017, and the corresponding ratings are shown in Table 1 and Figure 2.
Topography (T): The area topography directly affects the precipitation distribution and runoff infiltration in the study area, and indirectly affects the retention time of pollutants on the soil surface [43]. For large slopes, precipitation quickly carries pollutants away, in the form of surface runoffs; thus, pollutants are retained only for a short time. In this case, the amount of pollutants seeping into the groundwater is small, and groundwater vulnerability is relatively low [22]; otherwise, the groundwater vulnerability is relatively high. The slope characteristic of the study area (Figure 2) was obtained from the 30-m-elevation digital elevation model (DEM), and the corresponding rating is shown in Table 1.
Vadose zone medium impact (I): The vadose zone can regulate the vertical migration of pollutants. If the medium particles in the unsaturated zone are finer or the cracks are less developed, the slower the flow carries the pollutants, the higher the adsorption capacity of the vadose zone. Then, the pollutants are more likely to be involved in various reactions, such as physical adsorption, chemical reaction, and biodegradation. With all of the above, the pollutants take longer to reach the aquifer, improving the antifouling performance of groundwater [44]. The characteristics of the vadose zone medium were taken from the results of a previous hydrogeological survey study (China Geological Survey [39]), and the ratings of I are shown in Table 1 and Figure 2.
Hydraulic conductivity (C): The hydraulic conductivity is a very important aquifer parameter, which controls not only the hydraulic transport capacity of the aquifer, but also the flow path of pollutants [38]. It also controls the rate of infiltration, as well as the movement of groundwater. There is a positive feedback relationship between the hydraulic conductivity and the intensity of the groundwater pollution, with the conductivity being positively correlated to the susceptibility to pollution [45,46]. The hydraulic conductivity data (C) for the aquifer in the study area were taken from the pumping test results of a previous hydrogeological survey (China Geological Survey [39]), and the ratings are shown in Table 1 and Figure 2.

3. Results

In agricultural irrigated areas, the net recharge R, which is a major parameter determining the groundwater vulnerability, is controlled by the infiltration of precipitation and irrigation water. Two main agricultural irrigation models (flood irrigation and mulched drip irrigation) are employed in the Tongliao area.
To discuss the effect of the agricultural irrigation activity on the groundwater vulnerability in the study area, three scenarios with different water recharge sources and irrigation methods were considered. Two main agricultural irrigation models are proposed according to the field survey, in which sandy and silty soils are under flood irrigation, while clay and sandy loam soils are under film drip irrigation.
Scenario 1: The net recharge R in the study area is only associated with precipitation infiltration according to the classical DRASTIC method, and the empirical coefficient is used for computing the extent of water infiltration.
Scenario 2: The net recharge R in the irrigated regions is associated with precipitation and irrigation water, and the empirical coefficients of rainfall infiltration and irrigation infiltration in this study area are used for computing the extent of water infiltration.
Scenario 3: The net recharge R in the irrigated regions is associated with precipitation and irrigation water, and the comprehensive corrected coefficient of rainfall infiltration and irrigation water infiltration, presented by Xu (2019), is used for computing the extent of water infiltration [47].
The vulnerability classification maps of the study area, for each Scenario, were produced using the ArcGIS process, by the weighted calculation of the rate and weight of each parameter in Equation (1). As shown in the classification maps, the higher the DRASTIC index (DI) value, the higher the groundwater pollution risk [48,49].
According to the DI, the study area was divided into two pollution risk regions, with four risk levels. Among them, regions with relatively low risk were defined as level Ⅰ for DI less than 5, and as level Ⅱ for DI between 5 and 6. Regions with relatively high risk were defined as level Ⅲ for DI between 6 and 7, and as level Ⅳ for DI greater than 7.

3.1. Groundwater Vulnerability in Scenario 1

In Scenario 1, the net recharge R owing to the precipitation infiltration was estimated using the following equation:
R = P × γ
where R is the net recharge (mm/a), P is the average precipitation of the study area (mm/a), and γ is the empirical rainfall infiltration coefficient (values listed in Table 2). The rate of the net recharge R is shown in Figure 3a, and the vulnerability classification map was generated by the overlay analysis of the seven parametric layers with the ArcGIS process (Figure 3b).
As shown in Figure 3, the area of risk level Ⅰ, which accounts for 15.51% of the total area, is mainly in the northern part of the study area, with a small net recharge. Moreover, the soil medium is mainly clay, with small particles in the unsaturated zone and poor permeability of the aquifer.
The area of risk level Ⅱ accounts for 50.72% of the total area and has a wide distribution range. Most of the area for risk level Ⅱ is basically the same as the area for R with rating 4. It can be seen that risk level Ⅱ is strongly affected by the net recharge R.
The area of risk level Ⅲ accounts for 28.94% of the total area, and mostly covers the northwestern and central parts of the study area. In this area, the aquifer, the unsaturated zone, and the soil have better infiltration conditions. Thus, the rainfall infiltration extent is high, resulting in a relatively high groundwater vulnerability. The area of risk level Ⅳ only accounts for 4.83% of the total area, and mostly covers the northwestern part of the study area.

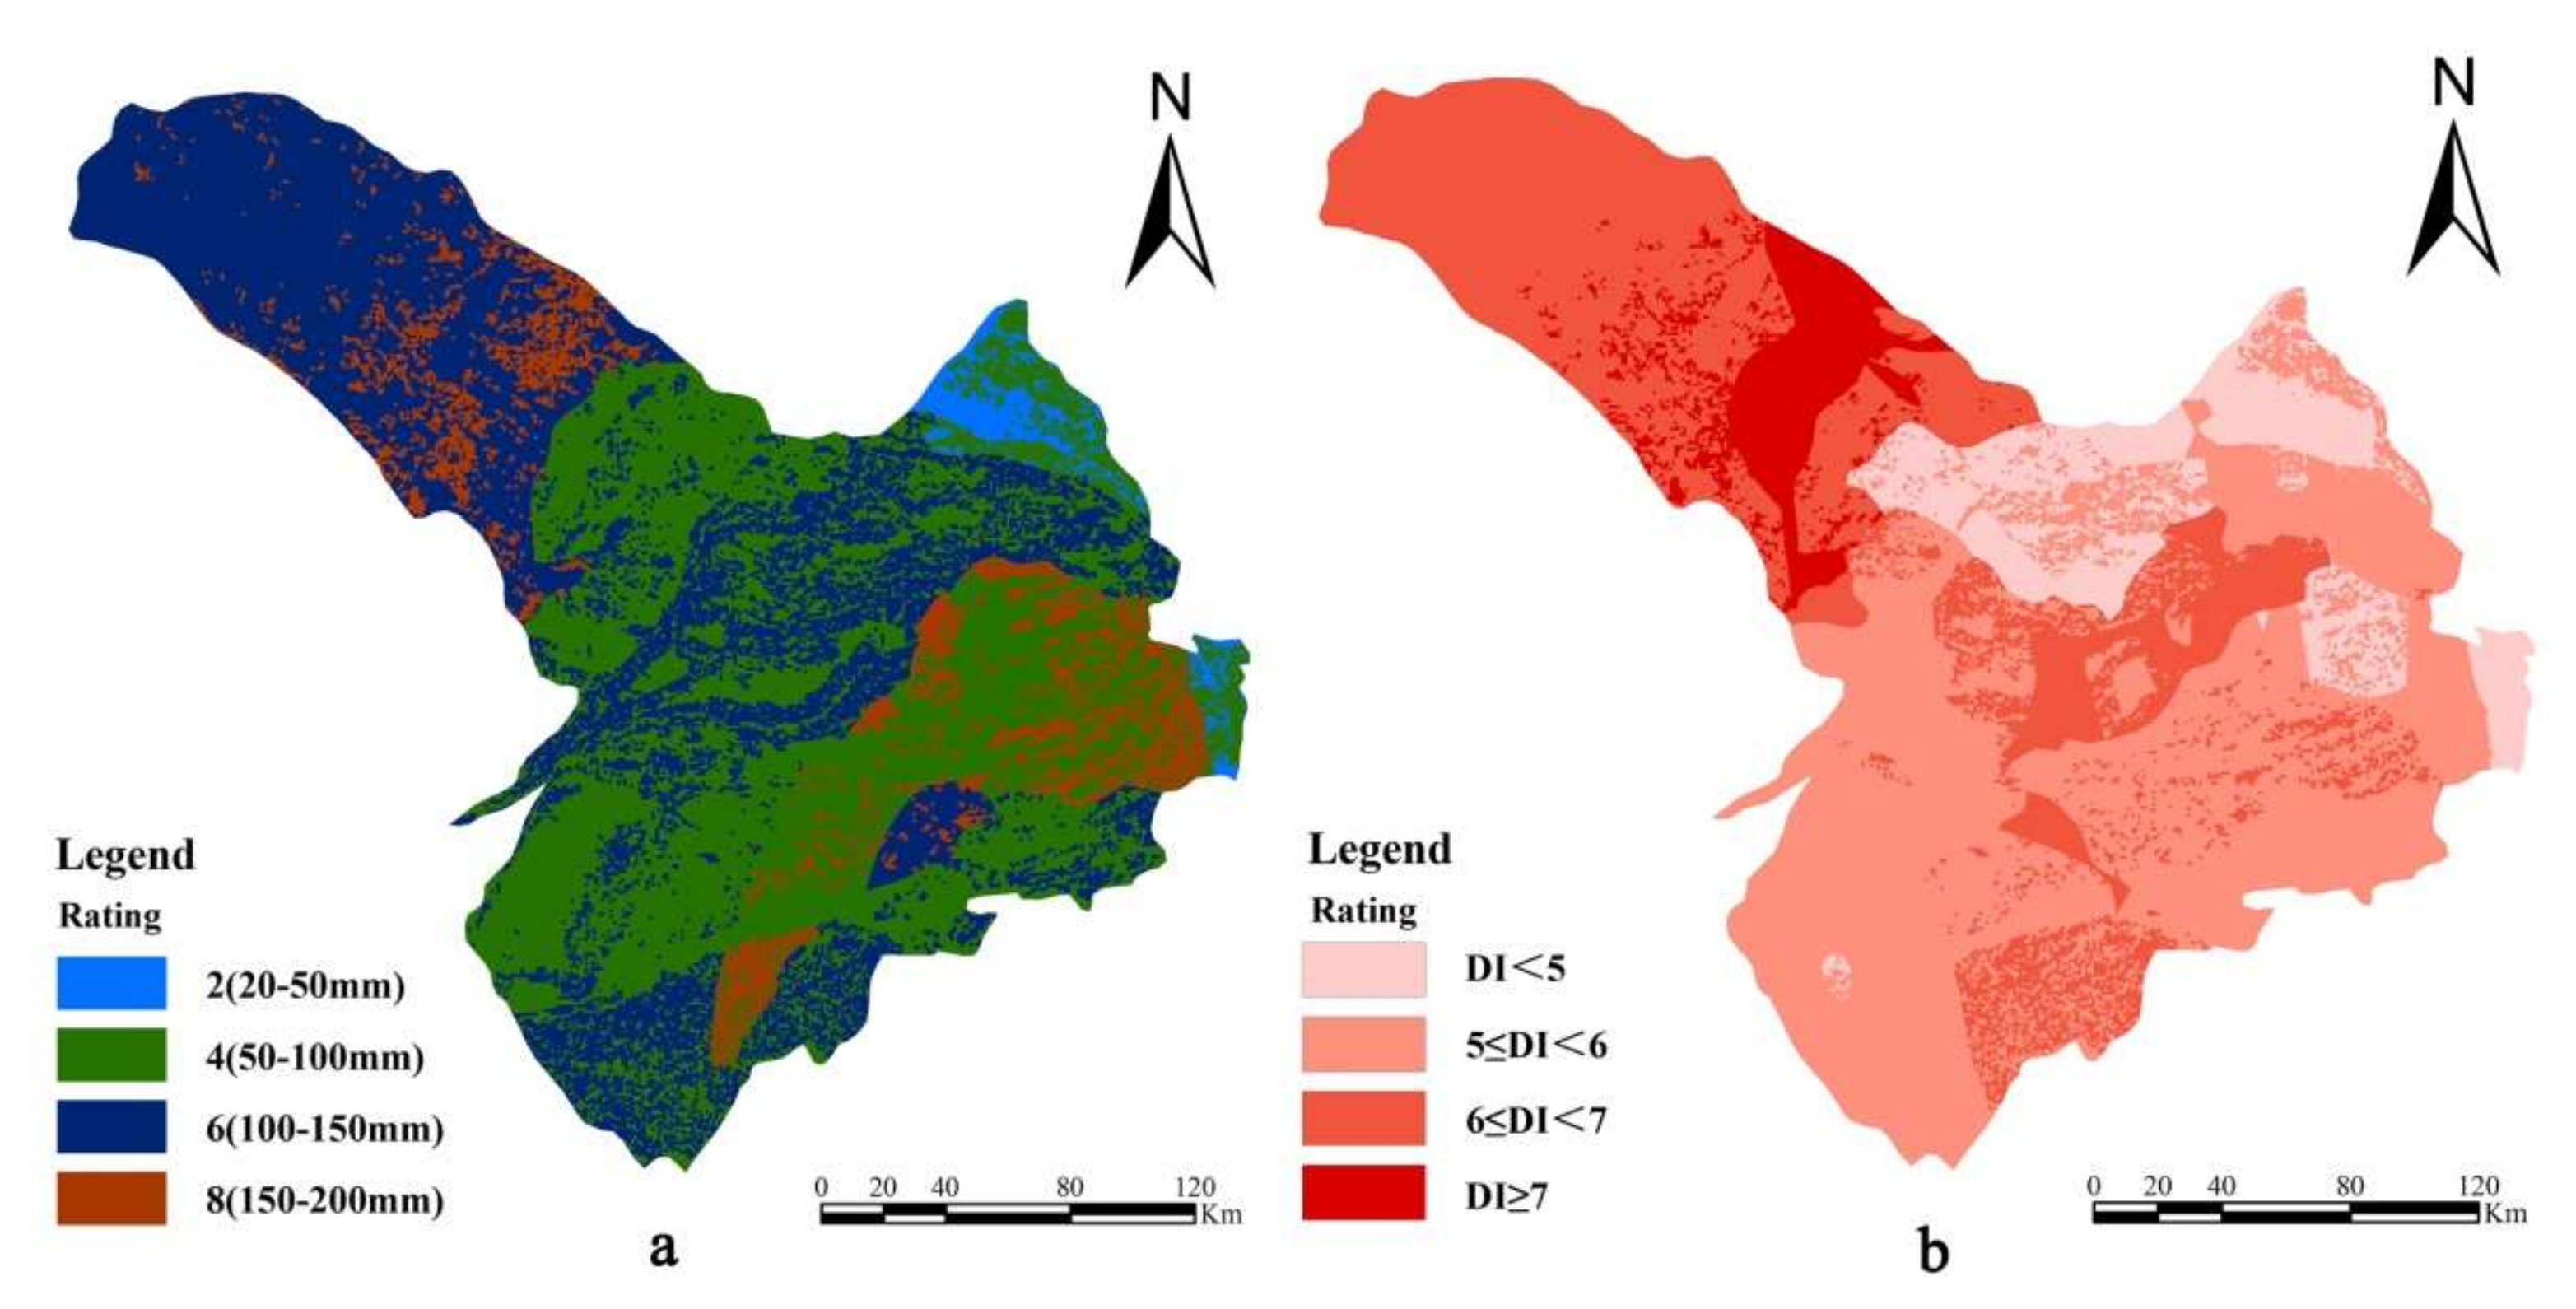
3.2. Groundwater Vulnerability in Scenario 2

Under the influence of the return water of the agricultural irrigation, the net recharge R was calculated using the following equation:
R = P × γ + I × β
where R is the net recharge (mm/a), P is the average precipitation (mm/a), and I is the irrigation water amount (mm/a). According to the Industries Water Requirement Quota and Standards of Inner Mongolia, the irrigation water amount under flood irrigation is 320 mm/a, and the irrigation water amount under film drip irrigation is 232 mm/a. The parameter γ is the empirical rainfall infiltration coefficient, while β is the empirical irrigation infiltration coefficient; the values of these parameters are listed in Table 2.
As shown in Figure 4a, considering the agricultural irrigation, the net recharge R clearly increases, with some areas receiving above 150 mm.
As a result, the breakdown of risk levels in the vulnerability classification map varies to some extent. Overall, the proportion of the relatively low-risk areas (levels I and II) decreases, while that of the relatively high-risk areas (levels III and IV) increases significantly. Among these, the areas associated with risk levels I and II account for 11.54% and 47.86% of the total area, respectively. The areas associated with risk levels III and IV account for 33.51% and 7.09% of the total area, respectively. Compared with Figure 3b, the breakdown of the risk levels mainly changes because the DI values increase or decrease in the irrigated areas of the different regions. For the irrigated areas, the return flow of the water increases the risk of regional groundwater pollution.

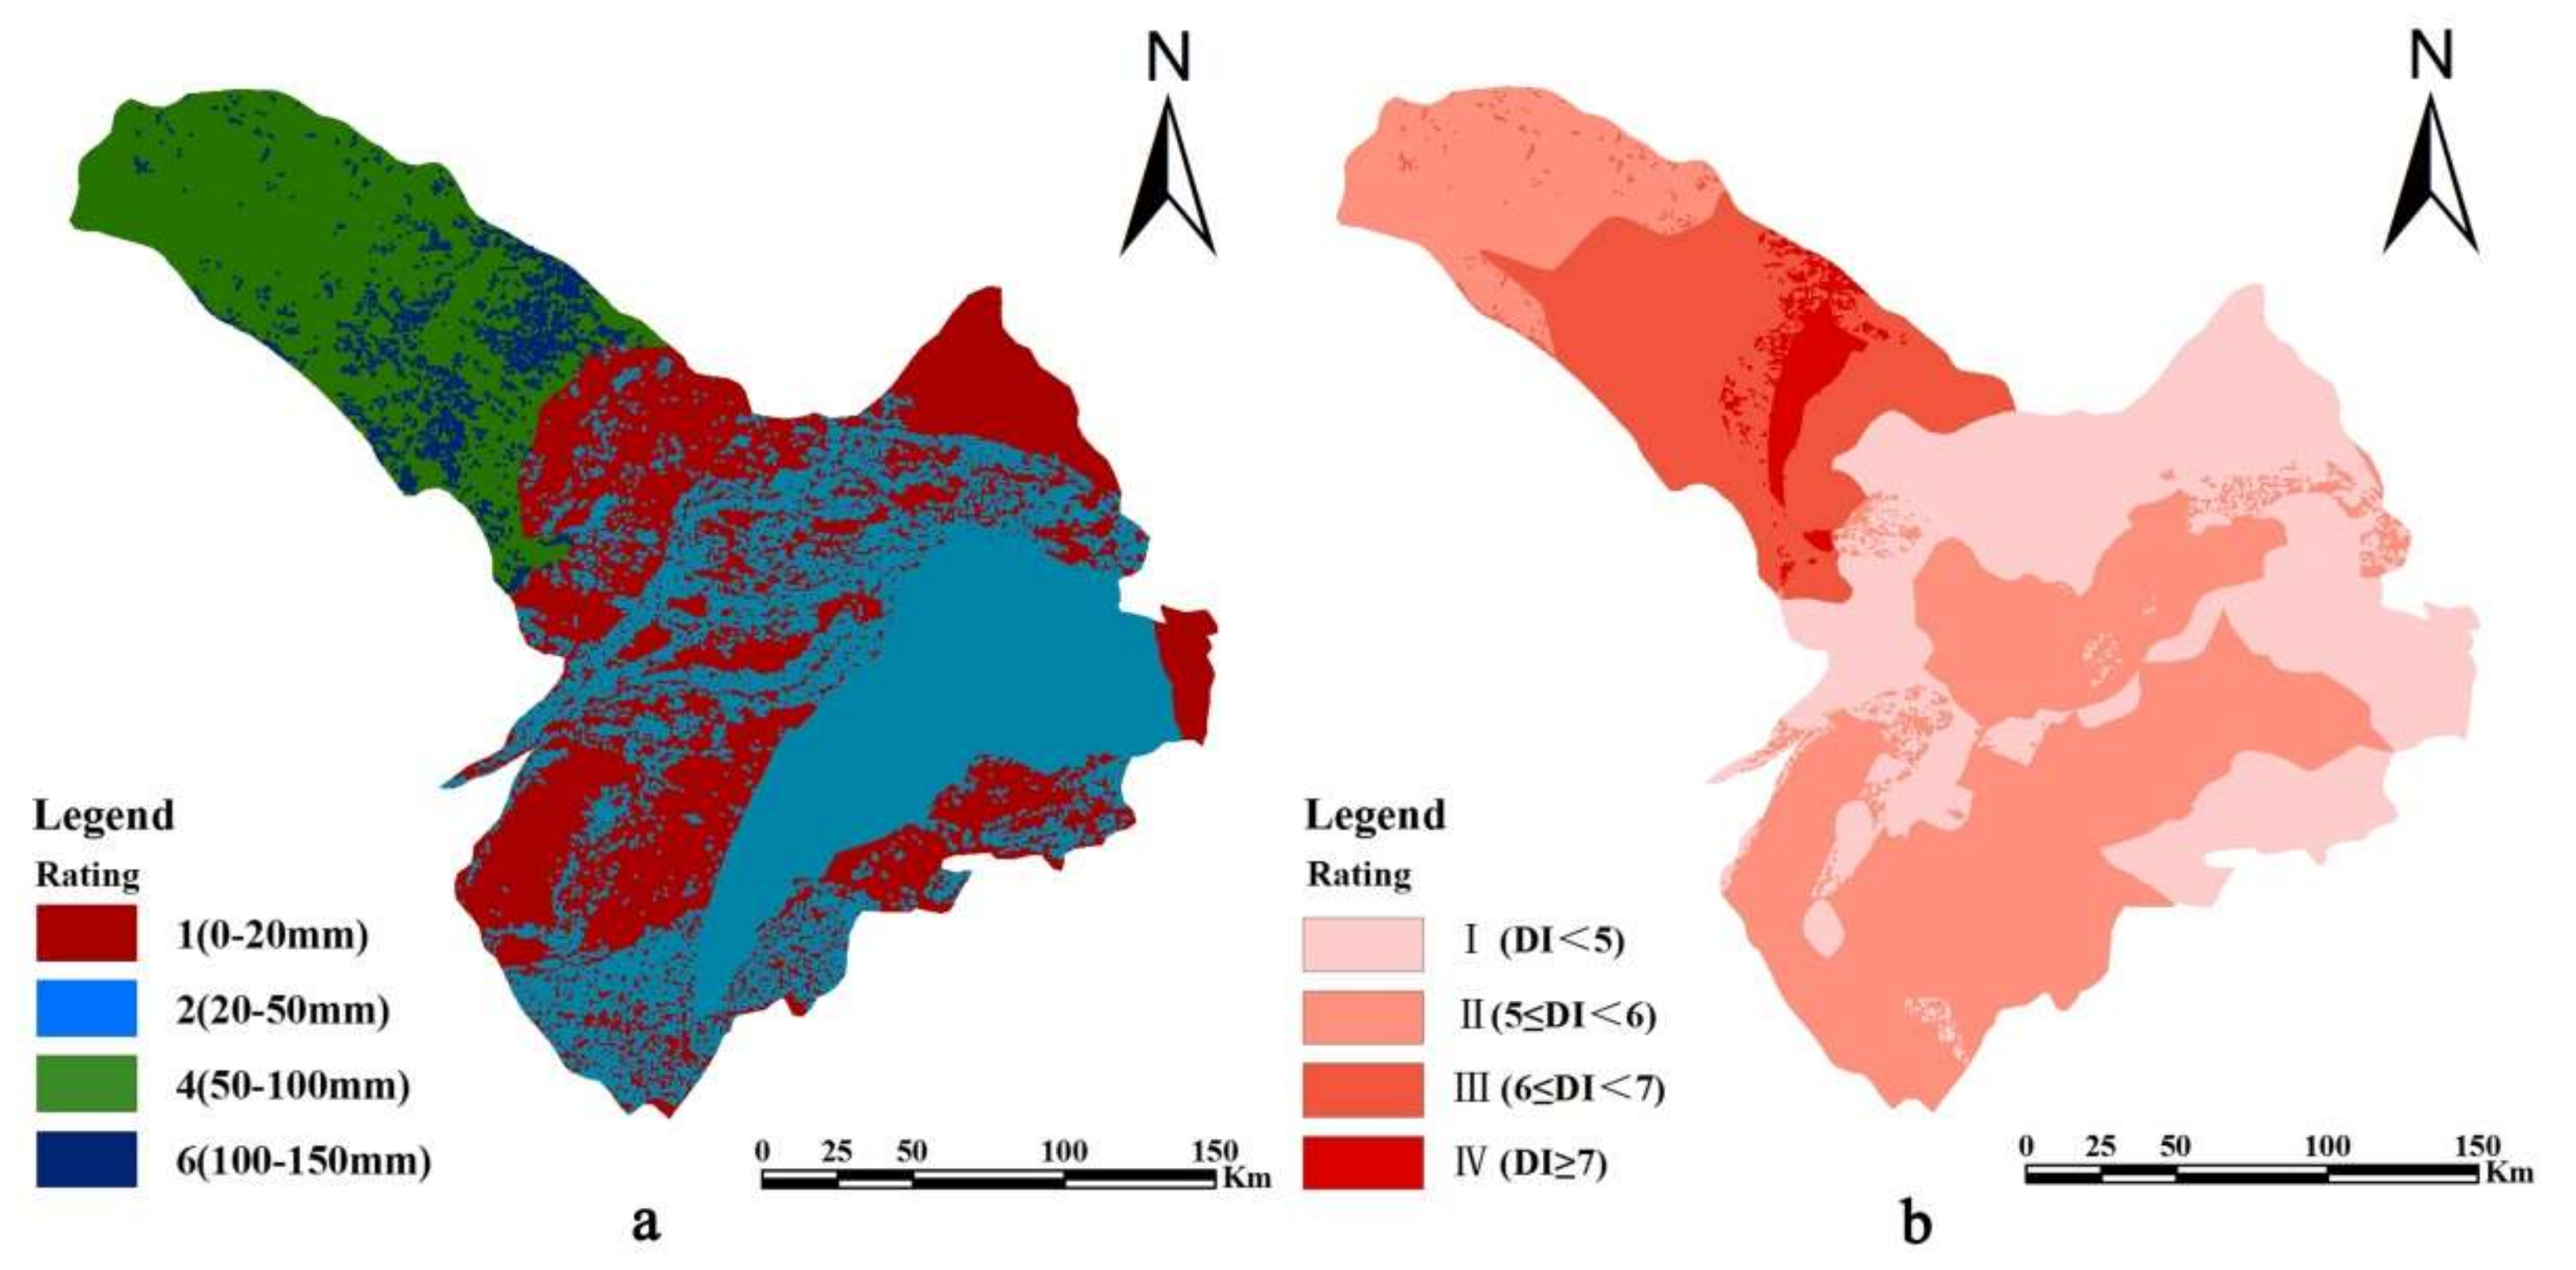
3.3. Groundwater Vulnerability in Scenario 3

The groundwater recharge rates for the different irrigation methods in the study area were discussed using a modified chloride mass balance method, and comprehensive corrected coefficients of rainfall infiltration and irrigation water infiltration were proposed previously [47]. These coefficients are listed in Table 2. The net recharge R was calculated using the following equation:
R = P + I × α
where α is the comprehensive corrected coefficient of rainfall infiltration and irrigation water infiltration.
As shown in Figure 5, the relatively low-risk region is relatively large, accounting for ~80% of the total area. The areas associated with risk levels I and II account for 34.59% and 46.19% of the total area, respectively. The areas associated with risk levels III and IV account for 16.70% and 2.52% of the total area, respectively.

4. Discussion

4.1. Influence of the Agricultural Irrigation Activity on the Groundwater Pollution Risk

It is clear that the extent of subsurface water infiltration is a major factor affecting the groundwater pollution risk, as shown in this study. From the analysis of the fractional areas of the different pollution risk regions (listed in Table 3), it follows that the area of the relatively high-risk region increases in Scenario 2, compared with Scenario 1, just by accounting for the irrigation water, which dramatically increased the extent of water infiltration.
In fact, the net recharge for Scenario 1 was calculated assuming the natural state of the underlying surface, without anthropogenic contributions such as the ones from agricultural activity, grazing, and urbanization. This is a commonly used method for estimating the net recharge, which has been used in the classical DRASTIC approach in many studies [11,27,50,51]. For Scenario 2, the irrigation return water was simply added, and the computation was performed using empirical infiltration coefficients based on the soil medium, which also has been commonly used for groundwater recharge calculations in most of the existing studies and practical applications in China. The fractional areas of relatively high pollution risk regions will inevitably increase; in this study, the fractional areas for level Ⅲ and level Ⅳ increased by 4.57% and 2.26%, respectively. This can lead to imply that agricultural irrigation activities increase the groundwater pollution risk, owing to the increased water infiltration amount in the cultivated areas. However, the actual net recharge owing to the infiltrated precipitation and irrigation water is affected by the underlying surface condition of the cultivated area in question; the amount of the infiltrated water is usually affected by the soil medium, crop type, mulch covering, and other factors. In this study, the water interception and absorption of crop was almost the same for the different cultivated areas, owing to the wide planting of maize in the study area. The net recharge in this cultivated area was discussed in light of the different soil media and irrigation methods [52], and the proposed comprehensive corrected coefficients were used for estimating the groundwater vulnerability in Scenario 3. The fractional area associated with relatively high-risk regions in Scenario 3 decreased by 14.55% and 21.38%, compared with Scenario 1 and Scenario 2, respectively. From the perspective of groundwater intrinsic vulnerability, the risk of groundwater pollution had decreased, owing to the agricultural activity, which reduced the amount of water infiltrating from the land surface.
The assessment results of the groundwater intrinsic vulnerability in terms of the amount of the infiltration water in the cultivated area reflect the influence of the different methods and parameters used in this study. While agricultural activities may reduce the amount of vertical water infiltration relative to the natural state, the use of pesticides and fertilizers increases the chance of groundwater contamination. During the infiltration process, precipitation and irrigation waters carry pollutants, which accumulate in the aquifer with time [53,54]; thus, the transmissibility and enrichment of pollutants increase the actual pollution risk. Agricultural activities inevitably increase the risk of groundwater contamination. Accurate assessment of the groundwater pollution risk is an effective prerequisite for the sustainable protection and utilization of groundwater.

4.2. Uncertainty Analysis

Above, the assessment of groundwater intrinsic vulnerability was conducted assuming constant parameters; yet, in reality the values of the parameters might fluctuate and vary with test points. Sensitivity analysis that focuses on large-effect-size parameters can yield better understanding of the underlying system and thus can help to reduce uncertainty [55,56]. In the field of hydrology, many hydrologic phenomena are stochastic (e.g., those that are associated with spatial variability and uncertainty of hydrogeological parameters), and thus suffer from subjective and objective uncertainties [57,58]. In this study, the selection of borehole sampling points and test points, as well as the averaging and interpolation approximation during data analysis, cause parameter uncertainty, which manifests as “noisy” and uncertain results. This uncertainty should be considered in practical applications. The following equation captures the relative error in the calculation results caused by the study parameters’ uncertainty
δ = y ( x 0 + Δ x ) y ( x 0 ) y ( x 0 ) × 100 %
where δ is the relative error of y caused by the uncertainty of x, y is the dependent variable (here, the fractional areas associated with different pollution risk levels), and x is the independent variable (here, the ratings of the different parameters).
The area ratio of the highest pollution risk level region in Scenario 3 was taken as an example for the uncertainty analysis in the study. To discuss parameter uncertainty, the measuring errors (Δx) were artificially assumed as 5%, 10%, 20%, 30%, 40%, and 50% and the relative errors are shown in Table 4.
For the measuring error of 5%, the relative errors caused by parameters A and I exceed 40%, whereas the other parameters had no impact. For the measuring error of 10%, the relative errors caused by parameters R, S, and I increased sharply, and the relative error caused by parameter I reached 128.97%. The relative errors in general increased sharply when the measurement error reached 20%, except the relative errors caused by T and C. It is obvious that the relative errors increased sharply because, for each parameter, the rating was based on the actual range of the parameter, which means the relative error changed only when the actual value of the parameter reached its partition threshold. The relative parameter errors for the calculated results were parameter-dependent; this suggests that more attention should be paid to the accurate determination of the values of fast-response parameters.

5. Conclusions

In the present study, the groundwater pollution risk in the Tongliao area in northern China was evaluated in terms of the groundwater vulnerability based on the DRASTIC method. It was found that between ~19.22% and ~40.60% of the total area is subject to a relatively high risk of pollution. The impact of the agricultural irrigation activity was considered when assessing the groundwater pollution risk. It was noted that an accurate calculation of the water infiltration amount in the cultivated areas is essential for an accurate groundwater pollution risk assessment. The use of empirical infiltration coefficients resulted in the overestimation of the water infiltration ability in the cultivated areas, which also overestimated the fractional area associated with high-risk level regions in this study, relative to the natural state of the underlying surface. Agricultural activities may reduce the intrinsic groundwater vulnerability by decreasing the water infiltration amount in the cultivated areas versus the regions in the natural state, while the groundwater pollution risk may increase owing to the use of pesticides and fertilizers. The use of pesticides and fertilizers is difficult to avoid in large-scale agricultural production. Accurate assessment of the groundwater pollution risk and of the impact of agricultural activities could assist governmental policy-makers in planning water-protection projects or establishing management programs for water resources.

Author Contributions

Conceptualization, W.X., L.M. and Q.Z.; methodology, W.X. and P.L.; formal analysis, L.M. and H.H.; investigation, W.X and L.M.; writing—original draft preparation, L.M.; writing—review and editing, W.X.; L.M. and Q.Z. contribute to this work equally. All authors have read and agreed to the published version of the manuscript.

Funding

This research was funded by National Natural Science Foundation of China, grant number 41602247; National Key Research and Development Plan of China, grant number 2018YFC0406604.

Conflicts of Interest

The authors declare no conflict of interest.

References

  1. Siebert, S.; Burke, J.; Faures, J.; Frenken, K.; Hoogeveen, J.; Döll, P.; Portmann, F. Groundwater use for irrigation-A global inventory. Hydrol. Earth Syst. Sci. 2010, 14, 1863–1880. [Google Scholar] [CrossRef] [Green Version]
  2. Mongat, A.S.; Arshad, M.; Bakhsh, A.; Shakoor, A.; Anjum, L.; Hameed, A.; Umm-e-Kalsoom Shamim, F. Design, installation and evaluation of solar drip irrigation system at mini dam command area. Pak. J. Agric. Sci. 2015, 52, 483–490. [Google Scholar]
  3. Wada, Y.; van Beek, L.P.H.; van Kempen, C.M.; Reckman, J.W.T.M.; Vasak, S.; Bierkens, M.F.P. Global depletion of groundwater resources. Geophys. Res. Lett. 2010, 37, L20402. [Google Scholar] [CrossRef] [Green Version]
  4. Nelson, R.L. Assessing local planning to control groundwater depletion: California as a microcosm of global issues. Water Resour. Res. 2012, 48, 1502. [Google Scholar] [CrossRef] [Green Version]
  5. Gardner, K.K.; Vogel, R.M. Predicting ground water nitrate concentration from land use. Groundwater 2005, 43, 343–352. [Google Scholar] [CrossRef] [Green Version]
  6. Kundzewicz, Z.W.; Mata, L.J.; Arnell, N.W.; Döll, P.; Kabat, P.; Jiménez, B.; Miller, K.A.; Oki, T.; Sen, Z.; Shiklomanov, I.A. Freshwater resources and their management. In Climate Change 2007: Impacts, Adaptation and Vulnerability; Contribution of Working Group II to the Fourth Assessment Report of the Intergovernmental Panel on Climate Change; Cambridge University Press: Cambridge, UK, 2007. [Google Scholar]
  7. Wandl, A.; Magoni, M. Sustainable planning of peri-urban areas: Introduction to the special issue planning. Pract. Res. 2017, 32, 1–3. [Google Scholar] [CrossRef] [Green Version]
  8. Uricchio, V.F.; Giordano, R.; Lopez, N. A fuzzy knowledge-based decision support system for groundwater pollution risk evaluation. J. Environ. Manag. 2004, 73, 189–197. [Google Scholar] [CrossRef]
  9. Margat, T.J. Vulnérabilité des Nappes D’eau Souterraines à la Pollution: Bases de la Cartographie [Vulnerability of Groundwater to Pollution: The Basics of Cartography]; Document 68 SGL 198 HYD; Bureau de Recherches Geologiques et Minieres: Orleans, France, 1968.
  10. Vrba, J.; Zaporozec, A. Guidebook on Mapping Groundwater Vulnerability; International Contributions to Hydrogeology 16; Heise: Hannover, Germany, 1994. [Google Scholar]
  11. Babiker, I.S.; Mohamed, M.A.A.; Hiyama, T.; Kato, K. A GIS-based DRASTIC modell for assessing aquifer vulnerability in Kakamigahara Heights, Gifu prefecture, central Japan. Sci. Total Environ. 2005, 345, 127–140. [Google Scholar] [CrossRef]
  12. Foster, S.S.D. Fundamental concepts in aquifer vulnerability, pollution risk and protection strategy. In Proceedings of the Vulnerability of soil and groundwater to pollutants, Noordwijk, The Netherlands, 30 March–3 April 1987; Van Duijvenbooden, W., van Waegeningh, H.G., Eds.; Netherlands Organization for Applied Scientific Research: The Hauge, The Netherlands, 1987; pp. 69–86. [Google Scholar]
  13. Aller, L.; Bennet, T.; Lehr, J.H.; Petty, R.J. DRASTIC: A Standardized System for Evaluating Groundwater Pollution Potential Using Hydro Geologic Settings; Technical Report No. EPA/600/2-85-018; U.S.EPA: Washington, DC, USA, 1987.
  14. Stempvoort, D.V.; Evert, L.; Wassenaar, L. Aquifer vulnerability index: A GIS compatible method for groundwater vulnerability mapping. Can. Wat. Res. J. 1993, 18, 25–37. [Google Scholar] [CrossRef] [Green Version]
  15. Civita, M. Le Carte della Vulnerabilità degli Acquiferi All’inquinamento: Teoria & Practica (Aquifer Vulnerability Maps to Pollution); Pitagora: Bologna, Italy, 1994; p. 325. (In Italian) [Google Scholar]
  16. Gogu, R.; Dassargues, A. Current trends and future challenges in groundwater vulnerability assessment using overlay and index methods. Environ. Geol. 2000, 39, 549–555. [Google Scholar] [CrossRef]
  17. Bai, L.P.; Wang, Y.Y.; Meng, F.S. Application of DRASTIC and extension theory in the groundwater vulnerability evaluation. Water Environ. J. 2012, 26, 381–391. [Google Scholar] [CrossRef]
  18. Su, X.; Xu, W.; Du, S.H. Responses of groundwater vulnerability to artificial recharge under extreme weather conditions in Shijiazhuang City, China. J. Water Supply Res. Technol. Aqua 2014, 63, 224–238. [Google Scholar] [CrossRef]
  19. Zghibi, A.; Merzougui, A.; Chenini, I.; Ergaieg, K.; Zouhri, L.; Tarhouni, J. Groundwater Vulnerability Analysis of Tunisian coastal aquifer: An application of DRASTIC Index Method in GIS environment. Groundw. Sustain. Dev. 2016, 2, 169–181. [Google Scholar] [CrossRef]
  20. Krogulec, E.; Trzeciak, T. DRASTIC assessment of groundwater vulnerability to pollution in the Vistula floodplain in central Poland. Hydrol. Res. 2017, 48, 1088–1099. [Google Scholar] [CrossRef]
  21. Akenji, V.N.; Ako, A.A.; Ayuk, A.R.; Hosono, T. DRASTIC-GIS modell for assessing vulnerability to pollution of the phreatic aquiferous formations in Douala-Cameroon. J. Afr. Earth Sci. 2015, 102, 180–190. [Google Scholar]
  22. Moustafa, M. Assessing perched aquifer vulnerability using modified DRASTIC: A case study of colliery waste in north-east England (UK). Hydrogeol. J. 2019, 27, 1837–1850. [Google Scholar] [CrossRef]
  23. Jhariya, D.C. Assessment of Groundwater Pollution Vulnerability Using GIS-Based DRASTIC Model and its Validation Using Nitrate Concentration in Tandula Watershed, Chhattisgarh. J. Geol. Soc. India 2019, 93, 567–573. [Google Scholar] [CrossRef]
  24. Khosravi, K.; Sartaj, M.; Tsai, F.T.C.; Singh, V.P.; Kazakis, N.; Melesse, A.M.; Prakash, I.; Bui, D.T.; Pham, B.T. A comparison study of DRASTIC methods with various objective methods for groundwater vulnerability assessment. Sci. Total Environ. 2018, 642, 1032–1049. [Google Scholar] [CrossRef]
  25. Shrestha, S.; Semkuyu, D.J.; Pandey, V.P. Assessment of groundwater vulnerability and risk to pollution in Kathmandu Valley, Nepal. Sci. Total Environ. 2016, 15, 23–35. [Google Scholar] [CrossRef]
  26. Ahirwar, S.; Shukla, J.P. Assessment of Groundwater Vulnerability in Upper Betwa River Watershed using GIS based DRASTIC Model. J. Geol. Soc. India 2018, 91, 334–340. [Google Scholar] [CrossRef]
  27. Jhariya, D.C.; Kumar, T.; Pandey, H.K.; Kumar, S.; Kumar, D.; Gautam, A.K.; Baghel, V.S.; Kishore, N. Assessment of groundwater vulnerability to pollution by modified DRASTIC model and analytic hierarchy process. Environ. Earth Sci. 2019, 78, 610. [Google Scholar] [CrossRef]
  28. Singha, S.S.; Pasupuleti, S.; Singha, S.; Singh, R.; Venkatesh, A.S. A GIS-based modified DRASTIC approach for geospatial modeling of groundwater vulnerability and pollution risk mapping in Korba district, Central India. Environ. Earth Sci. 2019, 78, 628. [Google Scholar] [CrossRef]
  29. Zhao, Y.; Zhang, J.; Chen, Z.; Zhang, W. Groundwater contamination risk assessment based on intrinsic vulnerability, pollution source assessment, and groundwater function zoning. Hum. Ecol. Risk Assess. Int. J. 2019, 25, 1907–1923. [Google Scholar] [CrossRef]
  30. Chen, R.H.; Teng, Y.G.; Chen, H.Y.; Hu, B.; Yue, W.F. Groundwater pollution and risk assessment based on source apportionment in a typical cold agricultural region in Northeastern China. Sci. Total Environ. 2019, 696. [Google Scholar] [CrossRef] [PubMed]
  31. Aldaya, M.M.; Rodriguez, C.I.; Fernandez-Poulussen, A.; Merchan, D.; Beriain, M.J.; Llamas, R. Grey water footprint as an indicator for diffuse nitrogen pollution: The case of Navarra, Spain. Sci. Total Environ. 2020, 698. [Google Scholar] [CrossRef]
  32. Bouraoui, F.; Grizzetti, B. An integrated modellling framework to estimate the fate of nutrients: Application to the Loire (France). Ecol. Modell. 2007, 212, 450–459. [Google Scholar] [CrossRef]
  33. Hao, S.N.; Li, X.Y.; Du, X.Z.; Zhang, W.S. A review on non-point source nutrient pollution of irrigation plain areas. Ecol. Environ. Sci. 2015, 24, 1235–1244. [Google Scholar]
  34. Wu, Y.; Liu, J.; Shen, R.; Fu, B. Mitigation of nonpoint source pollution in rural areas: From control to synergies of multi ecosystem services. Sci. Total Environ. 2017, 607, 1376–1380. [Google Scholar] [CrossRef]
  35. Xu, D.P.; Xue, X.J.; Zhu, J.W. Optimization of the development pattern of agriculture and animal husbandry in Tongliao based on the idea of sustainable development. J. Xi’an Univ. Technol. 2017, 33, 276–281. [Google Scholar]
  36. Iqbal, J.; Gorai, A.K.; Katpatal, Y.B.; Pathak, G. Development of GIS-based fuzzy pattern recognition modell modified DRASTIC modell for groundwater vulnerability to pollution assessment. Int. J. Environ. Sci. Technol. 2015, 12, 3161–3174. [Google Scholar] [CrossRef]
  37. Ouedraogo, I.; Defourny, P.; Vanclooster, M. Mapping the groundwater vulnerability for pollution at the pan African scale. Sci. Total Environ. 2016, 544, 939–953. [Google Scholar] [CrossRef] [PubMed]
  38. Shahab, A.; Shihua, Q.; Rad, S.; Keita, S.; Khan, M.; Adnan, S. Groundwater vulnerability assessment using GIS-based DRASTIC method in the irrigated and coastal region of Sindh province, Pakistan. Hydrol. Res. 2019, 50, 319–338. [Google Scholar] [CrossRef] [Green Version]
  39. China Geological Survey. Results Report of China Geological Survey: Investigation and Evaluation of Groundwater Resources and Environmental Problems in West Liaohe Plain; Geological Publishing House: Beijing, China, 2009. [Google Scholar]
  40. Posen, P.; Lovett, A.; Hiscock, K.; Evers, S.; Ward, R.; Reid, B. Incorporating variations in pesticide catabolic activity into a GIS-based groundwater risk assessment. Sci. Total Environ. 2006, 367, 641–652. [Google Scholar] [CrossRef] [PubMed]
  41. Rahman, A. A GIS-based DRASTIC modell for assessing groundwater vulnerability in the shallow aquifer in Aligarh, India. Appl. Geogr. 2008, 28, 32–53. [Google Scholar] [CrossRef]
  42. Kowalska, J.B.; Mazurek, R.; Gasiorek, M.; Zaleski, T. Pollution indices as useful tools for the comprehensive evaluation of the degree of soil contamination-A review. Environ. Geochem. Health 2018, 40, 2395–2420. [Google Scholar] [CrossRef] [PubMed] [Green Version]
  43. Shekhar, S.; Pandey, A.C. A GIS-based DRASTIC modell for assessing groundwater vulnerability in hard rock granitic aquifer. Arab. J. Geosci. 2015, 8, 1385–1401. [Google Scholar] [CrossRef]
  44. Min, L.L.; Qi, Y.Q.; Shen, Y.J.; Wang, P.; Wang, S.Q.; Liu, M.Y. Groundwater recharge under irrigated agro-ecosystems in the North China Plain: From a critical zone perspective. J. Geogr. Sci. 2019, 29, 877–890. [Google Scholar] [CrossRef] [Green Version]
  45. Chen, X.H. Streambed hydraulic conductivity for rivers in south-central Nebfaska. J. Am. Water Resour. Assoc. 2004, 40, 561–573. [Google Scholar] [CrossRef]
  46. Li, R.; Merchant, J.W. Modelling vulnerability of groundwater to pollution under future scenarios of climate change and biofuels-related land use change: A case study in North Dakota, USA. Sci. Total Environ. 2013, 447, 32–45. [Google Scholar] [CrossRef] [Green Version]
  47. Xu, W.; Meng, L.J.; Liu, P.; Dong, K.B. Use of a modified chloride mass balance technique to assess the factors that influence groundwater recharge rates in a semi-arid agricultural region in China. Environ. Earth Sci. 2019, 78, 241. [Google Scholar] [CrossRef]
  48. Ckakraborty, S.; Paul, P.K.; Sikdar, P.K. Assessing aquifer vulnerability to arsenic pollution using DRASTIC and GIS of North Bengal Plain: A case study of English Bazar Block, Malda District, West Bengal, India. J. Spat. Hydrol. 2007, 7, 101–121. [Google Scholar]
  49. Jang, W.; Engel, B.; Harbor, J.; Theller, L. Aquifer vulnerability assessment for sustainable groundwater management using DRASTIC. Water 2017, 9, 792. [Google Scholar] [CrossRef] [Green Version]
  50. Ersoy, A.F.; Gültekin, F. DRASTIC-based methodology for assessing groundwater vulnerability in the Gümüşhacıköy and Merzifon basin (Amasya, Turkey). Earth Sci. Res. J. 2013, 17, 33–40. [Google Scholar]
  51. Chenini, S.; Zghibi, A.; Kouzana, L. Hydrogeological investigations and groundwater vulnerability assessment and mapping for groundwater resource protection and management: State of the art and a case study. J. Afr. Earth Sci. 2015, 109, 11–26. [Google Scholar] [CrossRef]
  52. He, H.; Li, X.G.; Li, X.; Cui, J.; Zhang, W.J.; Xu, W. Optimizing the DRASTIC Method for Nitrate Pollution in Groundwater Vulnerability Assessments: A Case Study in China. Pol. J. Environ. Stud. 2018, 27, 95–107. [Google Scholar] [CrossRef]
  53. Kumar, A.; Singh, C.K. Characterization of hydrogeochemical processes and fluoride enrichment in groundwater of South-Western Punjab. Water Qual. Expo. Health 2015, 7, 373. [Google Scholar] [CrossRef]
  54. Li, C.C.; Gao, X.B.; Liu, Y.S.; Wang, Y.X. Impact of anthropogenic activities on the enrichment of fluoride and salinity in groundwater in the Yuncheng Basin constrained by Cl/Br ratio, delta O-18, delta H-2, delta C-13 and delta Li-7 isotopes. J. Hydrol. 2019, 579. [Google Scholar] [CrossRef]
  55. Lenhart, T.; Eckhardt, K.; Fohrer, N.; Frede, H.G. Comparison of two different approaches of sensitivity analysis. Phys. Chem. Earth 2002, 27, 645–654. [Google Scholar] [CrossRef]
  56. Su, X.; Xu, W.; Yang, F.; Zhu, P. Using new mass balance methods to estimate gross surface water and groundwater exchange with naturally occurring tracer 222Rn in data poor regions: A case study in northwest China. Hydrol. Process. 2015, 29, 979–990. [Google Scholar] [CrossRef]
  57. Delhomme, J.P. Spatial variability and uncertainty in groundwater flow parameters: A geostatistical approach. Water Resour. Res. 1979, 15, 269–280. [Google Scholar] [CrossRef]
  58. Bhatt, K. Uncertainty in wellhead protection area delineation due to uncertainty in aquifer parameter values. J. Hydrol. 1993, 149, 1–8. [Google Scholar] [CrossRef]
Figure 1. Sketch map of the study area; (A)—Location of the Inner Mongolia autonomous region in northern China; (B)—Location of the study area in the eastern part of the Inner Mongolia autonomous region; (C)—The main cities and land use status in the study area.
Sustainability 12 01954 g001
Figure 2. Rating maps for parameters D, A, S, T, I, C.
Sustainability 12 01954 g002
Figure 3. Rate of the net recharge R (a) and the vulnerability classification map (b) for Scenario 1.
Sustainability 12 01954 g003
Figure 4. Rate of the net recharge R (a) and the vulnerability classification map (b) for Scenario 2.
Sustainability 12 01954 g004
Figure 5. Rate of the net recharge R (a) and the vulnerability classification map (b) in Scenario 3.
Sustainability 12 01954 g005
Table 1. Ratings, weights, and ranges or classes, for the DRASTIC method parameters [13].
ParameterRatingWeightRange/Class
Depth to water table (D)100.220–2 m
82–5 m
75–10 m
510–15 m
315 m +
Net recharge (R)10.170–20 mm/a
220–50 mm/a
450–100 mm/a
6100–150 mm/a
8150–200 mm/a
Aquifer medium (A)90.13Tuff sandstone
7Medium sandstone
5Massive shale
3Quaternary loessial sandy loam
2Tertiary mudstone
Soil medium (S)70.09Sandy soil
5Silty soil
4Sandy loam
2Clay
Topography (T)80.040–1 %
51–6%
2≥6%
Vadose zone medium impact (I)90.22Sand gravel
7Medium-coarse sand
6Medium-fine sand
5Fine sand
4Silt
3Sandy loam
2Mild clay
Hydraulic conductivity (C)100.1350.12 m/d +
837.58–50.12 m/d
625.06–37.58 m/d
418.80–25.06 m/d
312.52–18.80 m/d
25.01–12.52 m/d
Table 2. Infiltration coefficients for different soil media.
Soil MediumRainfall Infiltration Coefficient γIrrigation Infiltration Coefficient βTotal Infiltration Coefficient α (%)
Clay0.110.202.50
Sandy loam0.180.287.80
Silty soil0.250.305.30
Sandy soil0.300.3220.30
Table 3. Breakdown of pollution risk by regions, for different scenarios.
Pollution Risk RegionRisk LevelScenario 1Scenario 2Scenario 3
Relatively low-risk regionLevel Ⅰ (DI < 5)15.51%11.54%34.59%
Level Ⅱ (5 ≤ DI < 6)50.72%47.86%46.19%
Relatively high-risk regionLevel Ⅲ (6 ≤ DI < 7)28.94%33.51%16.70%
Level Ⅳ (DI ≥ 7)4.83%7.09%2.52%
Table 4. Relative errors associated with the parameters of the DRASTIC method.
Measuring ErrorDRASTIC
5%0%0%42.06%0%0%43.65%0%
10%0%42.06%43.65%42.06%0%128.97%0%
20%43.65%42.46%43.65%42.46%0%128.97%0%
30%43.65%68.25%43.65%127.78%0%128.97%42.46%
40%51.19%129.76%43.65%128.97%3.17%128.97%42.46%
50%81.75%163.10%43.65%129.76%5.16%128.97%77.38%

