Effects of Climate and Land Use changes on Vegetation Dynamics in the Yangtze River Delta, China Based on Abrupt Change Analysis
Abstract
1. Introduction
2. Materials and Methods
2.1. Research Area
2.2. Data Processing
2.3. Mann-Kendall Trend Test
2.4. Mann-Kendall Abrupt Change Test
2.5. Pearson Correlation Analysis
3. Results
3.1. Effects of Land Use changes on Vegetation Dynamics After Vegetation Abrupt Cchange
3.1.1. Vegetation Dynamics after Abrupt Changes
3.1.2. Vegetation Trends under Different Land Use Changes
3.2. Effects of land use changes on Relationship between Annual Mean GSN and Climate Change
4. Discussion
4.1. Effects of Land Use Changes on Vegetation Dynamicsin the Yangtze River Deltabased on Abrupt Change Analysis
4.2. Effects of Climate Changes on Vegetation Dynamics after Abrupt Change
4.3. Impacts of Land use Changes on the Relationship between Climate Changes and GSN Based on Abrupt Change Analysis
5. Conclusion
Author Contributions
Funding
Conflicts of Interest
References
- Peng, J.; Li, Y.; Tian, L.; Liu, Y.; Wang, Y. Vegetation Dynamics and Associated Driving Forces in Eastern China during 1999–2008. Remote Sens. 2015, 7, 13641–13663. [Google Scholar] [CrossRef]
- Wang, Z.; Zhang, Y.; Yang, Y.; Zhou, W.; Gang, C.; Zhang, Y.; Li, J.; An, R.; Wang, K.; Odeh, I.; et al. Quantitative assess the driving forces on the grassland degradation in the Qinghai–Tibet Plateau, in China. Ecol. Inform. 2016, 33, 32–44. [Google Scholar] [CrossRef]
- Pan, N.; Feng, X.; Fu, B.; Wang, S.; Ji, F.; Pan, S. Increasing global vegetation browning hidden in overall vegetation greening: Insights from time-varying trends. Remote Sens. Environ. 2018, 214, 59–72. [Google Scholar] [CrossRef]
- Tucker, C.J. Red and photographic infrared linear combinations for monitoring vegetation. Remote Sens. Environ. 1979, 8, 127–150. [Google Scholar] [CrossRef]
- Helldén, U.; Tottrup, C. Regional desertification: A global synthesis. Global. Planet. Chang. 2008, 64, 169–176. [Google Scholar] [CrossRef]
- Hill, J.; Stellmes, M.; Udelhoven, T.; Roder, A. Mediterranean desertification and land degradation. Glob. Planet. Chang. 2008, 64, 146–157. [Google Scholar] [CrossRef]
- Ivits, E.; Cherlet, M.; Horion, S.; Fensholt, R. Global Biogeographical Pattern of Ecosystem Functional Types Derived from Earth Observation Data. Remote Sens. 2013, 5, 3305–3330. [Google Scholar] [CrossRef]
- Wang, J.; Wang, K.; Zhang, M.; Zhang, C. Impacts of climate change and human activities on vegetation cover in hilly southern China. Ecol. Eng. 2015, 81, 451–461. [Google Scholar] [CrossRef]
- Forkel, M.; Carvalhais, N.; Verbesselt, J.; Mahecha, M.D.; Neigh, C.S.; Reichstein, M. Trend Change Detection in NDVI Time Series: Effects of Inter-Annual Variability and Methodology. Remote Sens. 2013, 5, 2113–2144. [Google Scholar] [CrossRef]
- Lu, Y.; Zhang, L.; Feng, X.; Zeng, Y.; Fu, B.; Yao, X.; Li, J.; Wu, B. Recent ecological transitions in China: Greening, browning and influential factors. Sci. Rep. 2015, 5, 8732. [Google Scholar] [CrossRef]
- Piao, S.; Wang, X.; Ciais, P.; Zhu, B.; Wang, T.; Liu, J. Changes in satellite-derived vegetation growth trend in temperate and boreal Eurasia from 1982 to 2006. Glob. Chang. Biol. 2011, 17, 3228–3239. [Google Scholar] [CrossRef]
- Lucht, W.; Prentice, I.C.; Myneni, R.B.; Sitch, S.; Friedlingstein, P.; Cramer, W.; Bousquet, P.; Buermann, W.; Smith, B. Climatic control of the high-latitude vegetation greening trend and Pinatubo effect. Science 2002, 296, 1687–1689. [Google Scholar] [CrossRef]
- Jong, R.D.; Verbesselt, J.; Schaepman, M.E.; Bruin, S.D. Trend changes in global greening and browning: Contribution of short-term trends to longer-term change. Glob. Chang. Biol. 2012, 18, 642–655. [Google Scholar] [CrossRef]
- Chen, B.; Xu, G.; Coops, N.C.; Ciais, P.; Innes, J.L.; Wang, G.; Myneni, R.B.; Wang, T.; Krzyzanowski, J.; Li, Q.; et al. Changes in vegetation photosynthetic activity trends across the Asia-Pacific region over the last three decades. Remote Sens. Environ. 2014, 144, 28–41. [Google Scholar] [CrossRef]
- Phillips, P.C.B.; Moon, H.R. Linear Regression Limit Theory for Nonstationary Panel Data. Econometrica 1999, 67, 1057–1111. [Google Scholar] [CrossRef]
- Abera, T.A.; Heiskanen, J.; Pellikka, P.; Maeda, E.E. Rainfall–vegetation interaction regulates temperature anomalies during extreme dry events in the Horn of Africa. Glob. Planet. Chang. 2018, 167, 35–45. [Google Scholar] [CrossRef]
- Song, Y.; Jin, L.; Wang, H. Vegetation Changes along the Qinghai-Tibet Plateau Engineering Corridor Since 2000 Induced by Climate Change and Human Activities. Remote Sens. 2018, 10, 95. [Google Scholar] [CrossRef]
- Liu, Y.; Li, Y.; Li, S.; Motesharrei, S. Spatial and Temporal Patterns of Global NDVI Trends: Correlations with Climate and Human Factors. Remote Sens. 2015, 7, 13233–13250. [Google Scholar] [CrossRef]
- Li, S.; Sun, Z.; Tan, M.; Li, X. Effects of rural–urban migration on vegetation greenness in fragile areas: A case study of Inner Mongolia in China. J. Geogr. Sci. 2016, 26, 313–324. [Google Scholar] [CrossRef]
- Piao, S.; Fang, J. Seasonal Changes in Vegetation Activity in Response to Climate Changes in China between 1982 and 1999. Acta Geogr. Sin. 2003, 58, 119–125. [Google Scholar]
- Huber, S.; Fensholt, R.; Rasmussen, K. Water availability as the driver of vegetation dynamics in the African Sahel from 1982 to 2007. Glob. Chang. Biol. 2011, 76, 186–195. [Google Scholar] [CrossRef]
- Di, L.; Rundquist, D.C.; Han, L. Modelling relationships between NDVI and precipitation during vegetative growth cycles. Int. J. Remote Sens. 1994, 15, 2121–2136. [Google Scholar] [CrossRef]
- Bao, G.; Bao, Y.; Qin, Z.; Zhou, Y.; Shiirev, A. Vegetation Cover Changes in Mongolian Plateau and Its Response to Seasonal Climate Changes in Recent 10 Years. Sci. Geogr. Sin. 2013, 33, 613–621. [Google Scholar]
- Feng, X.; Fu, B.; Piao, S.; Wang, S.; Ciais, P.; Zeng, Z.; Lü, Y.; Zeng, Y.; Li, Y.; Jiang, X.; et al. Revegetation in China’s Loess Plateau is approaching sustainable water resource limits. Nat. Clim. Chang. 2016, 6, 1019–1022. [Google Scholar] [CrossRef]
- Fang, J.; Piao, S.; He, J.; Ma, W. Increasing terrestrial vegetation activity in China, 1982–1999. Sci. China Ser. C 2004, 47, 229–240. [Google Scholar]
- Wang, J.; Wang, P.; Qin, Q.; Wang, H. The effects of land subsidence and rehabilitation on soil hydraulic properties in a mining area in the Loess Plateau of China. Catena 2017, 159, 51–59. [Google Scholar] [CrossRef]
- Zipper, C.E.; Burger, J.A.; Skousen, J.G.; Angel, P.N.; Barton, C.D.; Davis, V.; Franklin, J.A. Restoring Forests and Associated Ecosystem Services on Appalachian Coal Surface Mines. Environ. Manag. 2011, 47, 751–765. [Google Scholar] [CrossRef]
- Zhou, H.; Van Rompaey, A.; Wang, J. Detecting the Impact of the Grain for Green Program on the Mean Annual Vegetation Cover in the Shaanxi Province, China Using SPOT-VGT NDVI Data. Land Use Policy 2009, 26, 954–960. [Google Scholar] [CrossRef]
- Liu, S.; Deng, L.; Zhao, Q.; DeGloria, S.D.; Dong, S. Effects of Road Network on Vegetation Pattern in Xishuangbanna, Yunnan Province, Southwest China. Transport Res. D-Trans. Environ. 2011, 16, 591–594. [Google Scholar] [CrossRef]
- Xin, Z.; Xu, J.; Zheng, W. Spatiotemporal variations of vegetation cover on the Chinese Loess Plateau (1981–2006): Impacts of climate changes and human activities. Sci. China Ser. D. 2008, 51, 67–78. [Google Scholar] [CrossRef]
- Balzarolo, M.; Peñuelas, J.; Veroustraete, F. Influence of Landscape Heterogeneity and Spatial Resolution in Multi-Temporal In Situ and MODIS NDVI Data Proxies for Seasonal GPP Dynamics. Remote Sens. 2019, 11, 1656. [Google Scholar] [CrossRef]
- Li, X.; Shi, P. Sensitivity analysis of variation in NDVI, temperature and precipitation in typical vegetation types across China. J. Plant Ecol. 2000, 24, 379–382. [Google Scholar]
- Li, J.; Lewis, J.; Rowland, J.; Tappan, G.; Tieszen, L.L. Evaluation of land performance in Senegal using multi - temporal NDVI and rainfall series. J. Arid Environ. 2004, 59, 463–480. [Google Scholar] [CrossRef]
- Deng, Z.; Guo, N.; Wang, J.; Ma, J. Vegetation cover variation in northwest China during the past 22 years. J. Glac Geocry 2006, 28, 686–693. [Google Scholar]
- Zeng, B.; Yang, T. Natural vegetation responses to warming climates in Qaidam Basin 1982–2003. Remote Sens. 2009, 30, 5685–5701. [Google Scholar] [CrossRef]
- Shen, B.; Fang, S.; Li, G. Vegetation Coverage Changes and Their Response to Meteorological Variables from 2000 to 2009 in Naqu, Tibet, China. Can. J. Remote Sens. 2014, 40, 67–74. [Google Scholar] [CrossRef]
- Hua, W.; Chen, H.; Zhou, L.; Xie, Z.; Qin, M.; Li, X.; Ma, H.; Huang, Q.; Sun, S. Observational Quantification of Climatic and Human Influences on Vegetation Greening in China. Remote Sens. 2017, 9, 425. [Google Scholar] [CrossRef]
- Xue, Y.; Ren, J.; Bi, X. Impact of Influencing Factors on CO2 Emissions in the Yangtze River Delta during Urbanization. Sustainability 2019, 11, 4183. [Google Scholar] [CrossRef]
- Zhang, N.; Gao, Z.; Wang, X.; Chen, Y. Modeling the impact of urbanization on the local and regional climate in Yangtze River Delta, China. Theor. Appl Climatol. 2010, 102, 331–342. [Google Scholar] [CrossRef]
- Cui, L.; Shi, J.; Yang, Y.; Li, G.; Fan, W. Temperature change characteristics and its influence by urbanization in the Yangtze River Delta. Geogr. Res. 2008, 27, 775–786. [Google Scholar]
- Wang, Z.; Fang, C.; Cheng, S.; Wang, J. Evolution of coordination degree of eco-economic system and early-warning in the Yangtze River Delta. J. Geogr. Sci. 2013, 23, 147–162. [Google Scholar] [CrossRef]
- Zhang, M.; Xiao, H.; Sun, D.; Li, Y. Spatial Differences in and Influences upon the Sustainable Development Level of the Yangtze River Delta Urban Agglomeration in China. Sustainability 2018, 10, 411. [Google Scholar] [CrossRef]
- Kendall, M.G. Rank correlation methods. Griffin Lond. 1975. [Google Scholar] [CrossRef]
- Mann, H.B. Nonparametric tests against trend. Econometrica 1945, 13, 245–259. [Google Scholar] [CrossRef]
- Qu, S.; Wang, L.; Lin, A.; Zhu, H.; Yuan, M. What drives the vegetation restoration in Yangtze River basin, China: Climate change or anthropogenic factors? Ecol. Indic. 2018, 90, 438–450. [Google Scholar] [CrossRef]
- Hijmans, R.J.; Cameron, S.E.; Parra, J.L.; Jones, P.G.; Jarvis, A.J. Very high resolution interpolated climate surfaces for global land areas. Int. J. Climatol. 2010, 25, 1965–1978. [Google Scholar] [CrossRef]
- Xu, X.; Liu, H.; Lin, Z.; Jiao, F.; Gong, H. Relationship of Abrupt Vegetation Change to Climate Change and Ecological Engineering with Multi-Timescale Analysis in the Karst Region, Southwest China. Remote Sens. 2019, 11, 1564. [Google Scholar] [CrossRef]
- Liu, J.; Liu, M.; Deng, X.; Zhuang, D.; Zhang, Z.; Luo, D. The land use and land cover change database and its relative studies in China. J. Geogr. Sci. 2002, 12, 275–282. [Google Scholar]
- Liu, J.; Liu, M.; Tian, H.; Zhuang, D.; Zhang, Z.; Zhang, W.; Tang, X.; Deng, X. Spatial and temporal patterns of China’s cropland during 1990-2000: An analysis based on Landsat TM data. Remote Sens. Environ. 2005, 98, 442–456. [Google Scholar] [CrossRef]
- Khaled, H.H. Trend detection in hydrologic data: The Mann–Kendall trend test under the scaling hypothesis. J. Hydrol. 2008, 349, 350–363. [Google Scholar]
- Meng, M.; Zong, M. Study on the Influence of Abrupt Climate Variation on the Vegetation Based on NDVI. Meteorol. Environ. Res. 2011, 2, 68–71. [Google Scholar]
- Yue, S.; Pilon, P.; Cavadias, G. Power of the Mann–Kendall and Spearman’s rho tests for detecting monotonic trends in hydrological series. J. Hydrol. 2002, 259, 254–271. [Google Scholar] [CrossRef]
- Liu, H.; Xu, X.; Lin, Z.; Zhang, M.; Ying, M.; Huang, C.; Hao, Y. Climatic and human impacts on quasi-periodic and abrupt changes of sedimentation rate at multiple time scales in Lake Taihu, China. J. Hydrol. 2016, 543, 739–748. [Google Scholar] [CrossRef]
- Chen, Z.; Chen, Y.; Li, W. Response of runoff to change of atmospheric 0 °C level height in summer in arid region of Northwest China. Sci. China Earth Sci. 2012, 55, 1533–1544. [Google Scholar] [CrossRef]
- Tong, X.; Wang, K.; Yue, Y.; Brandt, M.; Liu, B.; Zhang, C.; Liao, C.; Fensholt, R. Quantifying the effectiveness of ecological restoration projects on long-term vegetation dynamics in the karst regions of Southwest China. Int. J. Appl. Earth Obs. Geoinf. 2017, 54, 105–113. [Google Scholar] [CrossRef]
- Zhang, J.; Feng, Z.; Jiang, L.; Yang, Y. Analysis of the Correlation between NDVI and Climate Factors in the Lancang River Basin. J. Nat. Res. 2015, 30, 1425–1435. [Google Scholar]
- Pei, Z.; Fang, S.; Yang, W.; Wang, L.; Wu, M.; Zhang, Q.; Han, W.; Khoi, D.N. The Relationship between NDVI and Climate Factors at Different Monthly Time Scales: A Case Study of Grasslands in Inner Mongolia, China (1982–2015). Sustainability 2019, 11, 7243. [Google Scholar] [CrossRef]
- Zhu, Z.; Piao, S.; Myneni, R.B.; Huang, M.; Zeng, Z.; Canadell, J.G.; Ciais, P.; Sitch, S.; Friedlingstein, P.; Arneth, A.; et al. Greening of the Earth and its drivers. Nat. Clim. Chang. 2016, 6, 791–795. [Google Scholar] [CrossRef]
- Miao, Q.; Huang, M.; Li, R. The impacts of climate change on vegetation net primary productivity of the Yangtze River Basin. J. Nat. Resour. 2010, 25, 1296–1305. [Google Scholar]
- Piao, S.; Yin, G.; Tan, J.; Cheng, L.; Huang, M.; Li, Y.; Liu, R.; Mao, J.; Myneni, R.B.; Peng, S.; et al. Detection and attribution of vegetation greening trend in China over the last 30 years. Glob. Chang. Biol. 2015, 21, 1601–1609. [Google Scholar] [CrossRef]
- Jiang, Q.; Cheng, Y.; Jin, Q.; Deng, X.; Qi, Y. Simulation of Forestland Dynamics in a Typical Deforestation and Afforestation Area under Climate Scenarios. Energies 2015, 8, 10558–10583. [Google Scholar] [CrossRef]
- Wang, J.; Fang, C.; Wang, Z. Advantages and dynamics of urban agglomeration development on Yangtze River Delta. J. Geogr. Sci. 2012, 22, 521–534. [Google Scholar] [CrossRef]
- Gao, J.; Wei, Y.; Chen, W.; Yenneti, K. Urban Land Expansion and Structural Change in the Yangtze River Delta, China. Sustainability 2015, 7, 10281–10307. [Google Scholar] [CrossRef]
- Zhou, F.; Xu, Y.; Lv, H. Analysis of the vegetation change in the Yangtze River Delta based on MODIS-EVI time series data. Res. Environ. Yangtze Basin 2012, 21, 1363–1369. [Google Scholar]
- Chen, C.; He, B.; Guo, L.; Zhang, Y.; Xie, X.; Chen, Z. Identifying Critical Climate Periods for Vegetation Growth in the Northern Hemisphere. JGR Biogeosci. 2018, 123, 2541–2552. [Google Scholar] [CrossRef]
- Schwartz, M.D.; Ahas, R.; Aasa, A. Onset of spring starting earlier across the Northern Hemisphere. Glob. Chang. Biol. 2006, 12, 343–351. [Google Scholar] [CrossRef]
- Xie, Z.; Du, Y.; Zeng, Y.; Yan, M.; Zhu, C. Accelerated human activities affecting the spatial pattern of temperature in the yangtze river delta. Quatern. Int. 2010, 226, 112–121. [Google Scholar] [CrossRef]
- Sang, Y. Spatial and temporal variability of daily temperature in the Yangtze River Delta, China. Atmos. Res. 2012, 112, 12–24. [Google Scholar] [CrossRef]
- Ge, Q.; Dai, J.; Cui, H.; Wang, H. Spatiotemporal Variability in Start and End of Growing Season in China Related to Climate Variability. Remote Sens. 2016, 8, 433. [Google Scholar] [CrossRef]
- Li, J.; Cui, Y.; Liu, J.; Shi, W.; Qin, Y. Estimation and analysis of net primary productivity by integrating MODIS remote sensing data with a light use efficiency model. Ecol. Model. 2013, 252, 3–10. [Google Scholar] [CrossRef]
- Allen, C.D.; Macalady, A.K.; Chenchouni, H.; Bachelet, D.; McDowell, N.; Vennetier, M.; Kitzberger, T.; Rigling, A.; Breshears, D.D.; Hogg, E.H.; et al. A global overview of drought and heat-induced tree mortality reveals emerging climate change risks for forests. Ecol. Manag. 2010, 259, 660–684. [Google Scholar] [CrossRef]
- Boisvenue, C.; Running, S.W. Impacts of climate change on natural forest productivity—Evidence since the middle of the 20th century. Glob. Chang. Boil. 2006, 12, 862–882. [Google Scholar] [CrossRef]
- Ding, M.; Zhang, Y.; Liu, L.; Zhang, W.; Wang, Z.; Bai, W. The relationship between NDVI and precipitation on the Tibetan Plateau. J. Geogr. Sci. 2007, 17, 259–268. [Google Scholar] [CrossRef]
- Hunt, L.A.; Kuchar, L.; Swanton, C.J. Estimation of solar radiation for use in crop modeling. Agric. For. Meteorol. 1998, 91, 293–300. [Google Scholar] [CrossRef]
- Qian, W.; Zhu, Y. Climate Change in China from 1880 to 1998 and its Impact on the Environmental Condition. Clim. Chang. 2001, 50, 419–444. [Google Scholar] [CrossRef]
- Abraha, M.G.; Savage, M.J. Comparison of estimates of daily solar radiation from air temperature range for application in crop simulations. Agric. For. Meteorol. 2008, 148, 401–416. [Google Scholar] [CrossRef]
- Gourdji, S.M.; Sibley, A.M.; Lobell, D.B. Global crop exposure to critical high temperatures in the reproductive period: Historical trends and future projections. Environ. Res. Lett. 2013, 8, 024041. [Google Scholar] [CrossRef]
- Butler, E.E.; Huybers, P. Variations in the sensitivity of US maize yield to extreme temperatures by region and growth phase. Environ. Res. Lett. 2015, 10, 034009. [Google Scholar] [CrossRef]
- Li, L.; Zha, Y. Satellite-Based Spatiotemporal Trends of Canopy Urban Heat Islands and Associated Drivers in China’s 32 Major Cities. Remote Sens. 2019, 11, 102. [Google Scholar] [CrossRef]
- Zhang, G.; Zhang, Y.; Dong, J.; Xiao, X. Green-up dates in the Tibetan Plateau have continuously advanced from 1982 to 2011. Proc. Natl. Acad. Sci. USA 2013, 110, 4309–4314. [Google Scholar] [CrossRef]


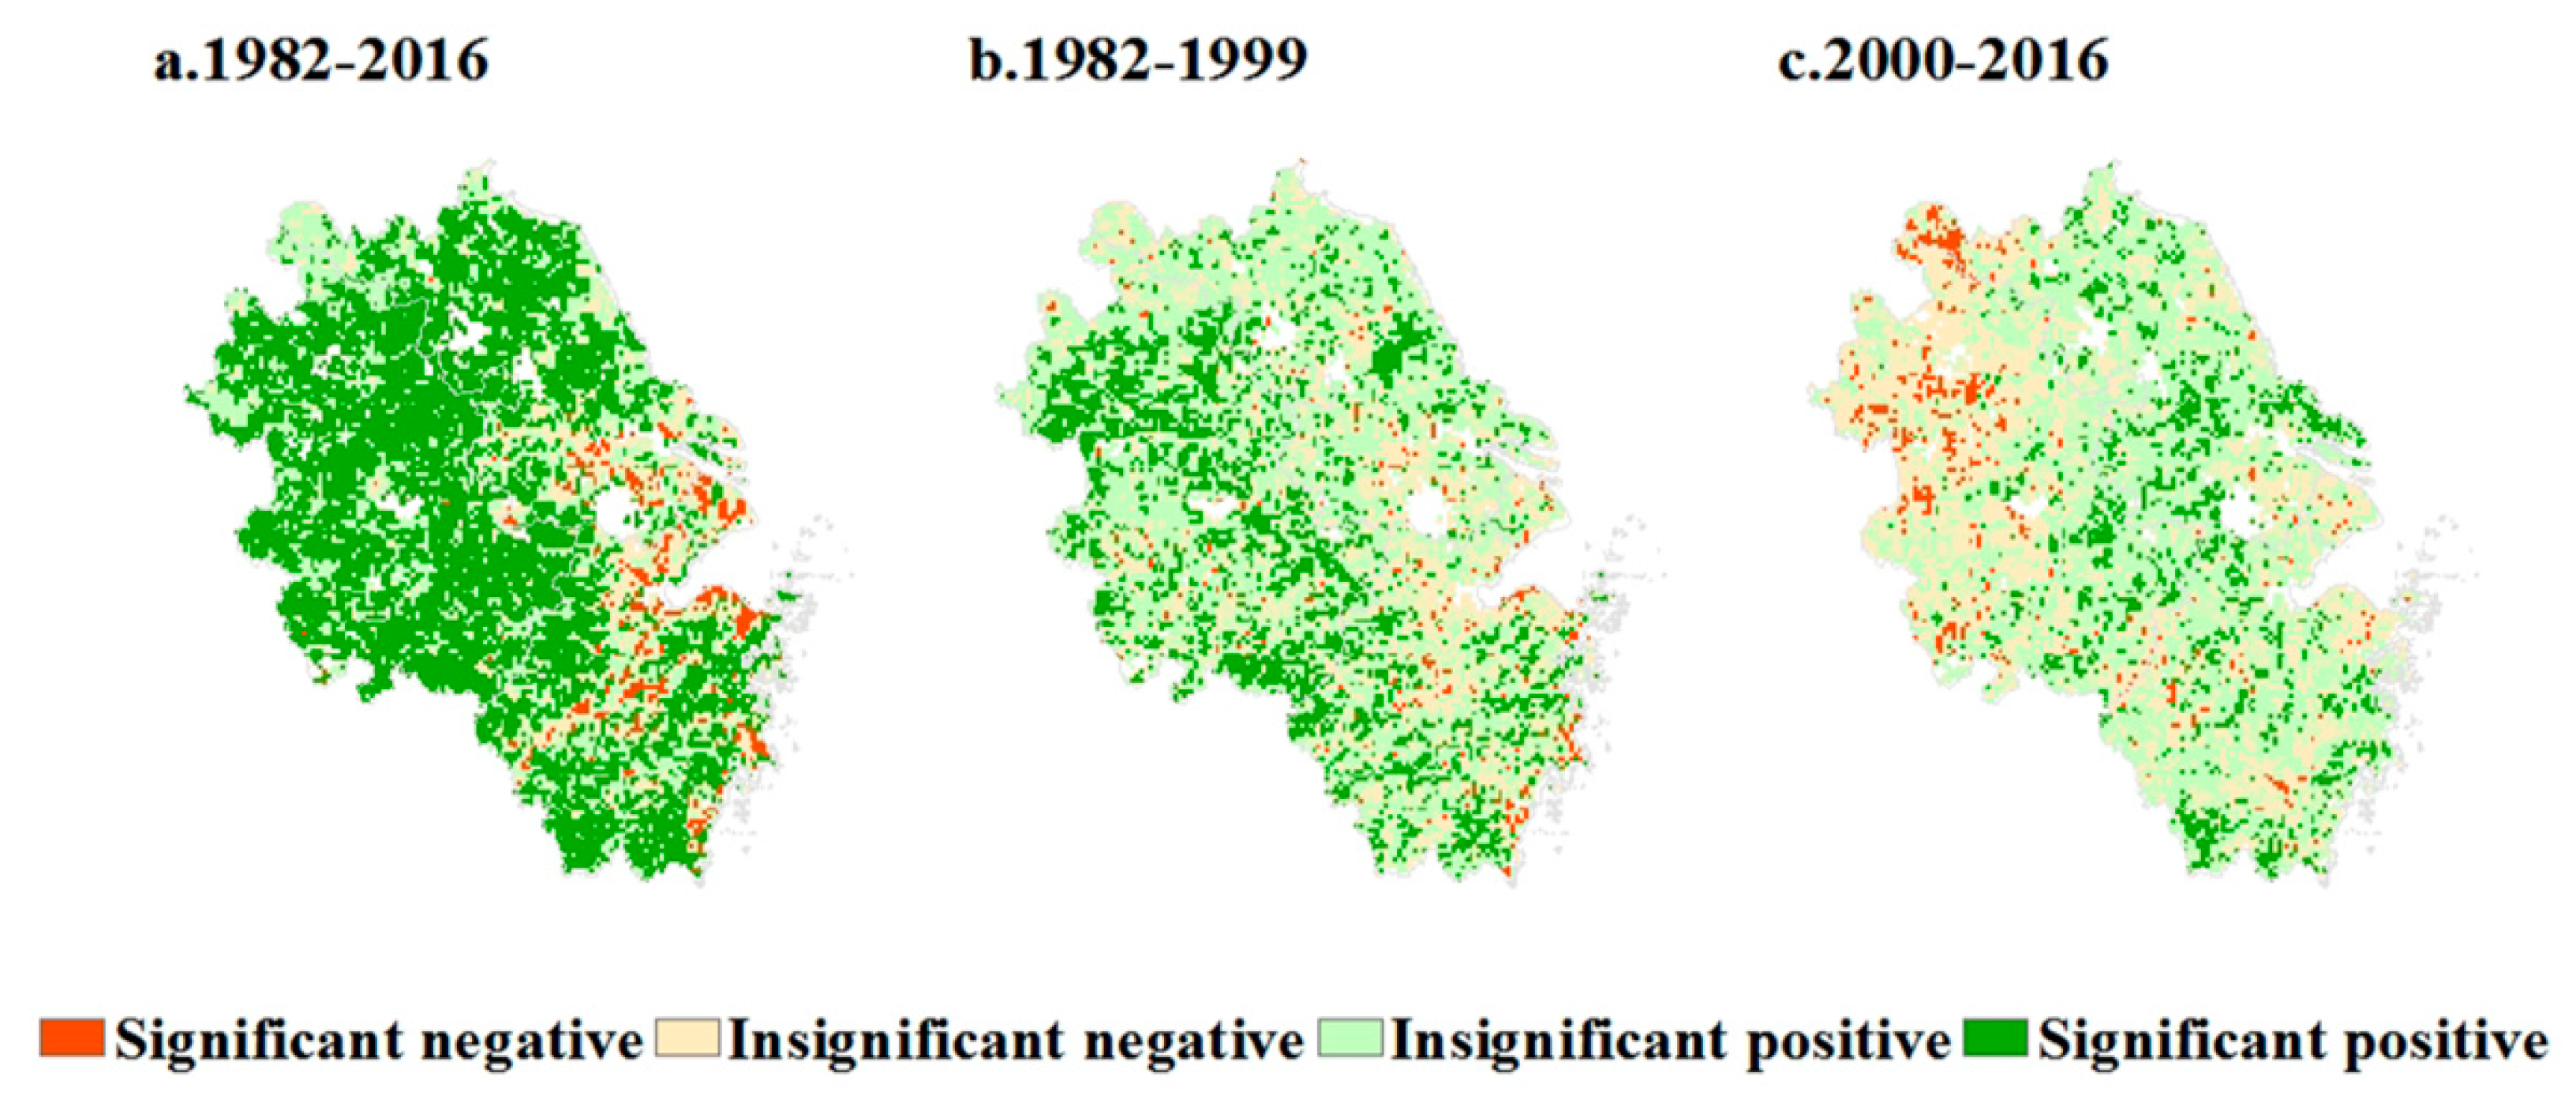
| Vegetation Trend | 1982–2016 | 1982–1999 (Before Abrupt Change) | 2000–2016 (After Abrupt Change) | |||
|---|---|---|---|---|---|---|
| Area/km2 | Percentage/% | Area/km2 | Percentage/% | Area/km2 | Percentage/% | |
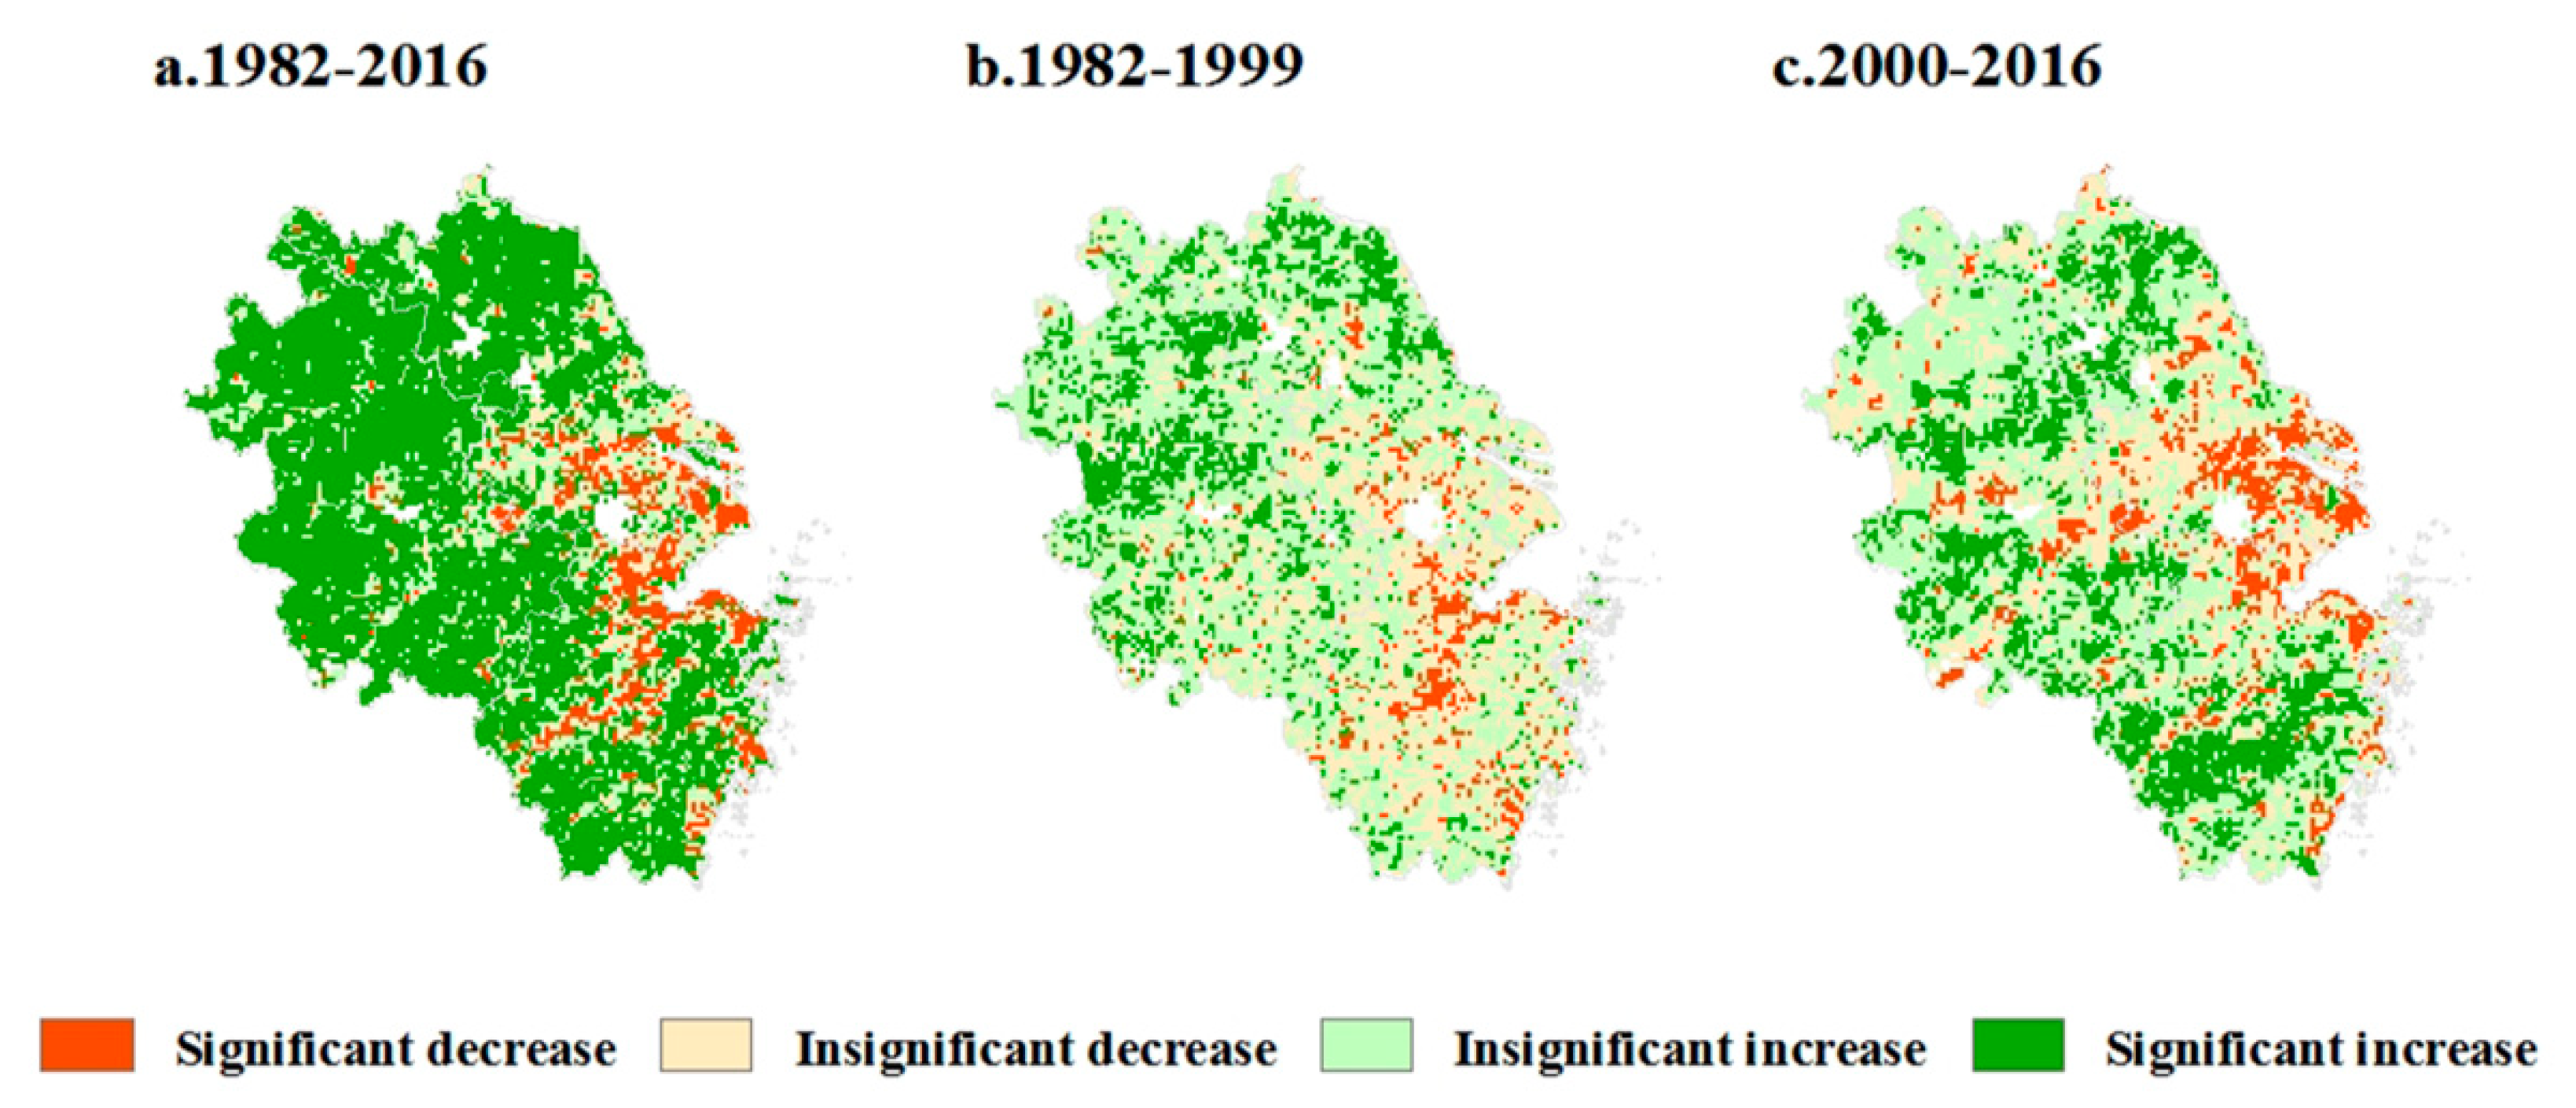
| Significant decrease | 27,050 | 7.97 | 17,025 | 5.02 | 32,725 | 9.64 |
| Insignificant decrease | 31,625 | 9.32 | 94,225 | 27.78 | 76,300 | 22.48 |
| Insignificant increase | 54,725 | 16.12 | 164,275 | 48.42 | 148,800 | 43.85 |
| Significant increase | 226,000 | 66.59 | 63,700 | 18.78 | 81,550 | 24.03 |
| 2015 | Cropland | Woodland | Grassland | Build-up Land | Sum | |
|---|---|---|---|---|---|---|
| 1990 | ||||||
| Area/km2 | Area/km2 | Area/km2 | Area/km2 | Area/km2 | ||
| Cropland | 134,925 | 15,150 | 1750 | 28,150 | 179,975 | |
| Woodland | 14,800 | 79,725 | 4475 | 1975 | 100,975 | |
| Grassland | 2475 | 3725 | 4225 | 200 | 10,625 | |
| Built-up land | 17,600 | 700 | 175 | 7500 | 25,975 | |
| Sum Area/km2 | 169,800 | 99,300 | 10,625 | 37,825 | - | |
| Vegetation Trend | Cropland | Woodland | Grassland | Built-up Land | ||||||||
|---|---|---|---|---|---|---|---|---|---|---|---|---|
| TW | BA | AA | TW | BA | AA | TW | BA | AA | TW | BA | AA | |
| Significant decrease | 8.80 | 3.63 | 12.14 | 2.76 | 5.26 | 1.68 | 0.63 | 2.53 | - | 14.23 | 6.05 | 17.08 |
| Insignificant decrease | 10.38 | 21.89 | 27.98 | 5.26 | 35.32 | 11.16 | - | 18.99 | 5.70 | 14.23 | 29.89 | 27.05 |
| Insignificant increase | 16.77 | 49.48 | 44.20 | 15.28 | 48.64 | 48.14 | 6.33 | 60.13 | 55.70 | 14.95 | 42.71 | 36.65 |
| Significant increase | 64.05 | 25.00 | 15.68 | 76.70 | 10.78 | 39.02 | 93.04 | 18.35 | 38.60 | 56.59 | 21.35 | 19.22 |
| Type of Land Use Change | Decrease | Increase | ||||||||||
|---|---|---|---|---|---|---|---|---|---|---|---|---|
| Significant | Insignificant | Insignificant | Significant | |||||||||
| TW | BA | AA | TW | BA | AA | TW | BA | AA | TW | BA | AA | |
| Cropland–Woodland | 7.20 | 5.03 | 4.86 | 10.55 | 39.43 | 19.26 | 15.41 | 44.97 | 43.89 | 66.84 | 10.57 | 31.99 |
| Cropland–Grassland | 5.88 | - | 5.88 | 4.41 | 26.47 | 16.18 | 13.24 | 50.00 | 50.00 | 76.47 | 23.53 | 27.94 |
| Cropland–Built-up land | 18.47 | 7.39 | 21.62 | 13.96 | 24.32 | 29.91 | 16.49 | 49.37 | 35.86 | 51.08 | 18.92 | 12.61 |
| Woodland–Cropland | 6.73 | 6.39 | 4.49 | 9.50 | 34.03 | 17.27 | 16.41 | 47.32 | 45.25 | 67.36 | 12.26 | 32.99 |
| Woodland–Grassland | 3.41 | 3.98 | 3.41 | 1.70 | 25.57 | 7.95 | 12.50 | 52.84 | 43.75 | 82.39 | 17.61 | 44.89 |
| Woodland–Built-up land | 28.21 | 11.54 | 24.36 | 15.38 | 50.00 | 32.05 | 15.38 | 26.92 | 24.36 | 41.03 | 11.54 | 19.23 |
| Grassland–Cropland | 2.08 | 2.08 | 2.08 | 5.21 | 29.17 | 9.37 | 6.25 | 50.00 | 47.92 | 86.46 | 18.75 | 40.63 |
| Grassland–Woodland | 1.36 | 4.08 | 1.36 | 2.72 | 30.61 | 7.48 | 10.20 | 50.34 | 57.14 | 85.72 | 14.97 | 34.02 |
| Grassland–Built-up land | - | 14.29 | - | - | 14.29 | 71.43 | 57.14 | 28.57 | - | 42.86 | 42.85 | 28.57 |
| Built-up land–Cropland | 7.06 | 3.74 | 9.22 | 7.20 | 18.88 | 25.22 | 14.55 | 50.29 | 45.68 | 71.19 | 27.09 | 19.88 |
| Built-up land–Woodland | 15.38 | 11.54 | 3.85 | 23.08 | 50.00 | 34.62 | 19.23 | 34.62 | 46.15 | 42.31 | 3.84 | 15.38 |
| Built-up land–Grassland | 16.67 | 16.67 | 16.67 | 16.67 | 33.33 | 33.33 | 16.67 | 33.33 | 33.33 | 49.99 | 16.67 | 16.67 |
| Correlation | 1982–2016 | 1982–1999(Before Abrupt Change) | 2000–2016(After Abrupt Change) | |||
|---|---|---|---|---|---|---|
| Area/km2 | Percentage/% | Area/km2 | Percentage/% | Area/km2 | Percentage/% | |
| Significant negative | 9975 | 2.99 | 41,650 | 12.45 | 27,150 | 8.12 |
| Insignificant negative | 169,625 | 51.11 | 178,275 | 53.29 | 90,625 | 27.10 |
| Insignificant positive | 150,250 | 45.27 | 108,400 | 32.40 | 139,225 | 41.63 |
| Significant positive | 2075 | 0.63 | 6200 | 1.86 | 77,400 | 23.15 |
| Correlation | Cropland | Woodland | Grassland | Built-Up Land | ||||||||
|---|---|---|---|---|---|---|---|---|---|---|---|---|
| TW | BA | AA | TW | BA | AA | TW | BA | AA | TW | BA | AA | |
| Significant negative | 3.48 | 14.10 | 9.47 | 1.69 | 10.15 | 4.22 | 0.65 | 9.80 | 1.95 | 2.56 | 12.73 | 7.61 |
| Insignificant negative | 45.70 | 53.91 | 29.89 | 61.40 | 52.35 | 21.37 | 46.41 | 46.41 | 14.28 | 41.03 | 56.00 | 31.88 |
| Insignificant positive | 50.09 | 30.43 | 42.58 | 36.44 | 35.40 | 42.57 | 51.63 | 37.91 | 38.96 | 55.68 | 29.82 | 39.13 |
| Significant positive | 0.73 | 1.56 | 18.06 | 0.47 | 2.10 | 31.84 | 1.31 | 5.88 | 44.81 | 0.73 | 1.45 | 21.38 |
| Type of Land Use Change | Negative | Positive | ||||||||||
|---|---|---|---|---|---|---|---|---|---|---|---|---|
| Significant | Insignificant | Insignificant | Significant | |||||||||
| TW | BA | AA | TW | BA | AA | TW | BA | AA | TW | BA | AA | |
| Cropland–Woodland | 7.20 | 9.43 | 5.37 | 10.55 | 52.52 | 26.17 | 15.41 | 35.69 | 32.72 | 66.84 | 2.36 | 35.74 |
| Cropland–Grassland | 5.88 | 19.41 | 4.48 | 4.41 | 49.25 | 19.40 | 13.24 | 31.34 | 52.24 | 76.47 | - | 23.88 |
| Cropland–Built-up land | 18.47 | 13.81 | 11.49 | 13.96 | 55.25 | 31.25 | 16.49 | 30.02 | 42.65 | 51.08 | 0.92 | 14.61 |
| Woodland–Cropland | 6.73 | 10.97 | 5.55 | 9.50 | 52.44 | 21.49 | 16.41 | 33.97 | 44.19 | 67.36 | 2.62 | 28.77 |
| Woodland–Grassland | 3.41 | 8.52 | 2.84 | 1.70 | 52.84 | 20.46 | 12.50 | 35.23 | 36.36 | 82.39 | 3.41 | 40.34 |
| Woodland–Built-up land | 28.21 | 3.95 | 11.69 | 15.38 | 55.26 | 41.56 | 15.38 | 39.47 | 20.78 | 41.03 | 1.32 | 25.97 |
| Grassland–Cropland | 2.08 | 14.58 | 2.08 | 5.21 | 50.00 | 16.67 | 6.25 | 32.29 | 37.50 | 86.46 | 3.13 | 43.75 |
| Grassland–Woodland | 1.36 | 9.52 | 2.04 | 2.72 | 55.11 | 14.96 | 10.20 | 34.69 | 42.18 | 85.72 | 0.68 | 40.82 |
| Grassland–Built-up land | - | - | 16.67 | - | 85.71 | 33.33 | 57.14 | 14.29 | 33.33 | 42.86 | - | 16.67 |
| Built-up land–Cropland | 7.06 | 13.31 | 6.13 | 7.20 | 52.97 | 27.30 | 14.55 | 31.40 | 50.51 | 71.19 | 2.32 | 16.06 |
| Built-up land–Woodland | 15.38 | 3.85 | 7.69 | 23.08 | 69.23 | 30.77 | 19.23 | 23.07 | 46.15 | 42.31 | 3.85 | 15.39 |
| Built-up land–Grassland | 16.67 | - | - | 16.67 | 50.00 | 50.00 | 16.67 | 50.00 | 33.33 | 49.99 | - | 16.67 |
| Correlation | 1982–2016 | 1982–1999 (Before Abrupt Change) | 2000–2016 (After Abrupt Change) | |||
|---|---|---|---|---|---|---|
| Area/km2 | Percentage/% | Area/km2 | Percentage/% | Area/km2 | Percentage/% | |
| Significant negative | 11,725 | 3.53 | 7100 | 2.12 | 12,700 | 3.80 |
| Insignificant negative | 31,950 | 9.63 | 67,850 | 20.28 | 108,225 | 32.36 |
| Insignificant positive | 91,600 | 27.60 | 178,275 | 53.29 | 175,100 | 52.36 |
| Significant positive | 196,600 | 59.24 | 81,300 | 24.31 | 38,375 | 11.48 |
| Correlation | Cropland | Woodland | Grassland | Built-Up Land | ||||||||
|---|---|---|---|---|---|---|---|---|---|---|---|---|
| TW | BA | AA | TW | BA | AA | TW | BA | AA | TW | BA | AA | |
| Significant negative | 3.63 | 1.62 | 4.46 | 1.24 | 2.16 | 2.25 | - | 1.31 | 3.25 | 6.23 | 1.82 | 2.90 |
| Insignificant negative | 10.05 | 17.48 | 34.15 | 6.20 | 21.09 | 28.96 | 0.65 | 27.45 | 45.45 | 16.12 | 26.18 | 38.41 |
| Insignificant positive | 28.75 | 56.62 | 50.29 | 25.21 | 48.70 | 56.31 | 27.45 | 47.71 | 46.75 | 31.50 | 56.36 | 45.65 |
| Significant positive | 57.57 | 24.28 | 11.10 | 67.35 | 28.05 | 12.48 | 71.90 | 23.53 | 4.55 | 46.15 | 15.64 | 13.04 |
| Type of Land Use Change | Negative | Positive | ||||||||||
|---|---|---|---|---|---|---|---|---|---|---|---|---|
| Significant | Insignificant | Insignificant | Significant | |||||||||
| TW | BA | AA | TW | BA | AA | TW | BA | AA | TW | BA | AA | |
| Cropland–Woodland | 3.36 | 3.03 | 3.02 | 10.25 | 19.70 | 29.86 | 26.39 | 51.18 | 54.03 | 60.00 | 26.09 | 13.09 |
| Cropland–Grassland | 1.49 | - | 2.99 | 5.97 | 17.91 | 31.34 | 29.85 | 55.22 | 53.73 | 62.69 | 26.87 | 11.94 |
| Cropland–Built-up land | 9.50 | 3.41 | 5.60 | 17.80 | 22.10 | 36.40 | 26.10 | 53.31 | 49.36 | 46.60 | 21.18 | 8.64 |
| Woodland–Cropland | 3.66 | 2.61 | 3.99 | 8.73 | 24.39 | 27.21 | 28.62 | 48.78 | 55.28 | 58.99 | 24.22 | 13.52 |
| Woodland–Grassland | 3.41 | 2.27 | 1.71 | 1.14 | 17.61 | 28.41 | 21.02 | 52.84 | 59.09 | 74.43 | 27.28 | 10.79 |
| Woodland–Built-up land | 11.84 | 3.95 | - | 22.37 | 19.74 | 32.47 | 27.63 | 57.89 | 57.14 | 38.16 | 18.42 | 10.39 |
| Grassland–Cropland | 1.04 | - | 2.08 | 3.13 | 21.87 | 43.75 | 19.79 | 53.13 | 47.92 | 76.04 | 25.00 | 6.25 |
| Grassland–Woodland | 0.68 | 3.40 | 4.76 | 4.08 | 21.09 | 34.70 | 26.53 | 51.02 | 54.42 | 68.71 | 24.49 | 6.12 |
| Grassland–Built-up land | - | - | - | - | 14.29 | 28.57 | 28.57 | 57.14 | 42.86 | 71.43 | 28.57 | 28.57 |
| Built-up land–Cropland | 3.66 | 1.88 | 5.69 | 7.76 | 17.95 | 37.37 | 29.14 | 57.16 | 48.32 | 59.44 | 23.01 | 8.62 |
| Built-up land–Woodland | 11.53 | 7.69 | 11.54 | 23.08 | 34.62 | 30.77 | 23.08 | 50.00 | 38.46 | 42.31 | 7.69 | 19.23 |
| Built-up land–Grassland | 16.66 | - | - | - | 16.67 | 50.00 | 16.66 | 50.00 | 50.00 | 66.68 | 33.33 | - |
© 2020 by the authors. Licensee MDPI, Basel, Switzerland. This article is an open access article distributed under the terms and conditions of the Creative Commons Attribution (CC BY) license (http://creativecommons.org/licenses/by/4.0/).
Share and Cite
Wan, L.; Liu, H.; Gong, H.; Ren, Y. Effects of Climate and Land Use changes on Vegetation Dynamics in the Yangtze River Delta, China Based on Abrupt Change Analysis. Sustainability 2020, 12, 1955. https://doi.org/10.3390/su12051955
Wan L, Liu H, Gong H, Ren Y. Effects of Climate and Land Use changes on Vegetation Dynamics in the Yangtze River Delta, China Based on Abrupt Change Analysis. Sustainability. 2020; 12(5):1955. https://doi.org/10.3390/su12051955
Chicago/Turabian StyleWan, Lei, Huiyu Liu, Haibo Gong, and Yujia Ren. 2020. "Effects of Climate and Land Use changes on Vegetation Dynamics in the Yangtze River Delta, China Based on Abrupt Change Analysis" Sustainability 12, no. 5: 1955. https://doi.org/10.3390/su12051955
APA StyleWan, L., Liu, H., Gong, H., & Ren, Y. (2020). Effects of Climate and Land Use changes on Vegetation Dynamics in the Yangtze River Delta, China Based on Abrupt Change Analysis. Sustainability, 12(5), 1955. https://doi.org/10.3390/su12051955


