Abstract
Since power line communication (PLC) technology has been considered a platform technology for smart metering, this study introduces an analogous system technology for the PLC-based monitoring systems in zero energy building management. This technology allows a system operator or an operation center to monitor, calculate, or manage power use remotely through the existing power line so that individual suppliers will be able to grasp the present condition of power use and respond to any unexpected incidents. As in any country, many old buildings in Korea are repaired to be used for 40–50 years or even longer since constructing new ones is expensive. Because remodeling old buildings is not only expensive but also generates construction waste, repairing is the preferred alternative in many cases. With the expectation that the proposed platform technology will be one of the promising technologies for sustainable building, its uninterrupted power usage monitoring and remote power control/management functions will be quite useful for economizing power with convenience. A system with such a PLC-based design and algorithm can be quite scalable as well. As the major contribution of this study, a solution suitable for decrepit buildings or apartments has been developed by using the PLC technology, and the test bed experiment was conducted for it. The result showed that the solution worked flexibly and efficiently. Since it is impossible to install a new network especially in the case of decrepit buildings, PLC must be used through the existing power line. Thus, a decrepit building monitoring system has been proposed in this study for a sustainable building. The proposed solution was simulated with OPNET simulation first. Following the mounting of the actual PLC product and development of a monitoring application to complete the platform/solution, it is being tested at the test bed in a decrepit building.
1. Introduction
Smart grids not only require advanced technologies but also contribute to their development, in addition to technical and social innovations. Furthermore, their roles in a transition from the existing energies to sustainable energies require more detailed research on both current and future energy markets and policies, focusing on the analysis of public support for the revised electricity policies involving new pricing models in addition to the application methods of the data obtained from public consumption patterns. Such a transition entails significant changes in the roles played by energy producers and consumers. Consumers are expected to play a more active role in response to future fluid power markets and complex supply/demand networks by claiming more rights and managing their own demands through their superior status in the market, where more local energy companies or some sectors are allowed to participate by opening the systems to the local energy companies or third parties. Ultimately, smart grids are an inevitable consequence in the transitional process during which buildings, transportation, fuels, and other social elements are being integrated consistently. Smart grids do not simply contribute to better sustainability, but also wield an influence on technological innovations, technology-oriented society, energy policies, communication network structures, household energy usage patterns and practices, and indeed, on the research works to be performed. Again, the development of smart grid technology requires comprehensive research on every relevant technology and element to explore the feasibility of a sustainable society supported by smart energy systems [1].
Power Line Communication (PLC) is a technology that communicates voice and data on a frequency signal through a power line. As one of the viable information delivery systems, the PLC technology allows data such as voice or image data to be transmitted over the existing electric power line as high-frequency signals that are then delivered to the terminal devices via a PLC modem [1,2]. However, most of the mediums used in a power grid are not suitable for such communication technology as they have been developed primarily for power distribution rather than communications, so there may be some problems when transmitting data over the power line. The signal attenuation caused by line noise or other factors is the major disadvantage of PLC technology [1,2]. PLC refers to a communication mode using power lines. PLC technology uses high-frequency signals to send information through power lines. These signals are separated from the power line with the PLC modem and subsequently delivered to terminal devices. PLC technology is based on two modes: high-speed PLC and low-speed PLC. The former adopts the frequency bands between 0.5 MHz and 30 MHz to achieve speed ranging from 14 Mbps to 1 Gbps, whereas the latter utilizes the frequency bands between 10 KHz and 450 KHz, offering lower than 9.6 Kbps as the speed that is usually used to control electronic devices [1].
The PLC described in this paper is to achieve communications by loading a frequency signal much higher than AC frequency (50/60Hz) onto the power line supplying AC current. The low-speed PLC carrying a frequency signal from 10 to 450 Hz is being used for the communications between old ships or railroad cars, or for automatic power meter reading. We’ve validated the use of this technology and the contribution of this research work can be found in the automated meter reading utilizing the PLC system.
Sustainability has become an important concept when constructing a nearly or completely net-zero energy building and is being incorporated into its design process as well as construction and operation processes. Currently, a series of advanced sustainable technological solutions are being introduced to enhance the level of thermal performance of building envelopes or promote the utilization of renewable energies. The sustainable buildings designed in a way to adapt to surrounding environmental factors such as weather conditions or the artificial changes controlled within the building itself to provide and maintain better human comfort. Thus, planning the use of appropriate building materials or technologies is an essential part of the design process in which durability, energy efficiency, maintainability of the building should be considered first followed by recyclability and cost-effectiveness of the materials to be used for the purpose of reducing the negative impact on the environment [3]. Taking these into account, this paper focused on the recyclability and maintainability of decrepit/old buildings.
This paper describes the details of our PLC mechanism, with related protocols implemented with both C and C++ languages. A PLC communication-based solution for decrepit buildings or apartments has been developed along with its test bed experiment. The results from the experiment confirmed that the solution was flexible and suitable for use. The contribution of this study lies in these tasks.
The description of the proposed PLC system and its mechanism is presented in this study along with its protocols developed with either C or C++ language. Developed especially for decrepit buildings or apartments, this PLC-based solution worked flexibly and efficiently during the test bed experiment; such results obtained through a series of analyses and simulations can be considered to be the major contribution of this study.
In modern society, it has become quite clear that constructing a new building is not economic so most of the old buildings in the Republic of Korea often undergo full renovation or a partial remodeling process to sustain or extend their lifespans. Besides the expense, another major reason for recycling these buildings is to avoid a negative impact on the environment commonly due to various types of wastes generated by construction work. An old steel-reinforced building built in Janurary 1980 and located in the vicinity of a local government office (Geumjeong-gu Office, Busan, Republic of Korea) was selected for this research work. As the building was subjected to reconstruction, it was quite suitable for a testbed experiment to validate the feasibility and stability of the proposed power line communication. The experiment was conducted over a period of two years at an office room where an automatic sprinkler and electric heating system were available. The electricity was shared with another office on a separate floor and the bill was paid equally. The major feature, which can be considered as the contribution of the implemented PLC system is that the power usages are measured individually with the PLC-based power meter which allowed each room’s electricity charge to be checked and billed separately on an Android app.
The rest of this paper is organized as follows. Section 2 describes the PLC, Narrowband PLC, G3-PLC modes, and related work. Section 3 presents a PLC-based monitoring system for sustainable building and discussion. Section 4 deals with the simulation of the power system control programs using PLC and RS-232 and discussion. Section 5 presents the implementation method for the Android application of the PLC-based monitoring system for sustainable building and related discussions. Section 6 discusses the analysis result based on the performance evaluation. Finally, Section 7 presents our conclusion.
2. Related Research
PLC can be influenced by future advanced power transmission or distribution systems when achieving end-to-end communications, and is regarded as an innovative, evolutional model compared to conventional power grids. Furthermore, the revised technical/technological regulations in relation to PLC systems have presented some positive and interesting issues in the areas of advanced communication and control technologies. Compared to the existing regulations, these new regulations tend to deal mainly with technical standardization or certification of heterogeneous networks, and such change is expected to contribute to developing a future power system that utilizes renewable or clean energies, creating a more suitable research environment for the development of distributed intelligence systems or demand-response (DR) programs.
A PLC signal of approximately 500Hz was adopted by New York City for the first time [2]; following this technological development, such technology has been used for data transmission applications in the fields of communications, energy, and power system security, conveniently using the existing wired power lines. The effectiveness of the PLC technology has been most evident in the smart metering system [4], which has led to the global utilization of smart metering infrastructure (SMI) for smart grids [5].
The PLC-based telemetry application over High-Voltage (HV) lines (power distribution lines) with frequency ranging from 15 to 500 kHz was first implemented in 1922 [6], followed by the ultra-narrowband power line communication (UNB-PLC) as a bilateral automatic communication system (TWACS) developed by Aclara and Sumitomo in 1930 [7]. The TWACS was developed based on the concept that the power grids have been optimally designed for the 60 Hz power transmission/distribution systems.
The X-10 PLC protocol [8,9] was originally developed by Pico Electronics (Glenrothes, Scotland) in 1975 [8]. This protocol enabled the transmission of binary data by adopting Amplitude Modulation (AM) for light, small-sized appliances. Considered a basic but major technology of modem-based smart home applications, this protocol was highly regarded, securing an advantageous position globally at the time. Nonetheless, the protocol could not overcome problems involving limitations in distance and power phases and unreliable performance. Currently, narrowband power line communication (NB-PLC) systems have been adopted in Japan, North America, and China using a frequency range of up to 500 kHz, offering a wide-range communication bandwidth for PLC-based applications.
NB-PLC systems are usable for a wide variety of applications by supporting low to high voltage systems [10], especially for power utility systems dealing with power and data transmission or detection and control applications (Figure 1). The NB-PLC-based energy management system includes some of the PLC-based (or Internet-based) remote energy management systems [11] that achieve maximum data transmission of 500 Kbps while offering increased reliability.
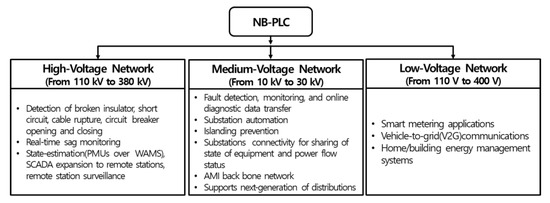
Figure 1.
Narrowband Power Line Communication (NB-PLC) for smart power grid applications.
Moreover, NB-PLC is an advanced concept of the existing PLC technology and Internet protocol (IP) backbone for providing an appropriate energy-saving solution in an extensive power/energy distribution network, supporting the network’s primary functions such as metering and remote control. Following the modern sophistication of power grids, various types of add-on services or functions such as ground protection, automatic transformer control, load balancing, automatic billing and payment, and fraud detection are being offered through decentralized intelligence (REMPLI system components) [12]. Meanwhile, the DLCþVITP4IP project [13] has facilitated advanced network monitoring/control, intelligent metering, and other innovative services for both power producers and users in a local power distribution network through an IP communication protocol that has been considered quite convenient and adequate for the NB-PLC networks (150–500 kHz).
Although high-impedance faults (HIFs) and their precise localization can be difficult, such is instrumental for SG applications. While an NB-PLC device using a frequency range of 3–95 kHz can track HIFs quite accurately [14], the PLC-access network (PLC-AN) has been proven to be effective for the medium to low-voltage distribution systems used for the SGs [15]. PLC-opportunistic routing (PLC-OR) was introduced as a novel but reliable technology that is able to reduce the packet transmission time significantly, offering much faster performance than conventional sequential routing with an equivalent level of reliability during communications between the substation and users. Depending on the latest revised regulations, standardizations, and technological advances, the NB-PLC protocols achieving higher data transmission rates can be classified into the four categories below.
The PRIME Standard introduced in 2007 performs multi-carrier modulation for a low-voltage network, and it is widely accepted for the development of Smart Grid (SG). It is being supported by the PRIME Alliance consisting of over 50 members and is chaired by Iberdrola, a Spanish multinational power company. From various types of NB-PLC PRIME standards, one with a frequency band between 3 and 95 kHz and a maximum data transfer rate of 130 Kbps has proven to be quite effective and efficient for a large PRIME-based SMI [4]. Australian power company Energex [16] has been evaluating a PRIME-based PLC infrastructure to assess its adequacy for their power network environment. This is to provide flawless services while preparing a next-generation remote metering platform.
Figure 2 shows the SG-oriented communication protocol developed by the G3-PLC Alliance, describing the PHY, MAC, and 6LoWPAN network layers. The G3-PLC operated on five nodes, and the test results were reported at Metering Barcelona (2009). Even at a maximum transformer resonant frequency of 490kHz, the protocol is suitable for transferring PLC signals [17].
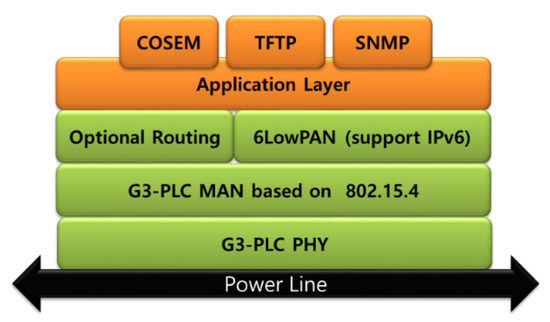
Figure 2.
G3-PLC standard communication terminal protocols stack.
In the PLC signal range of 9–500 kHz, however, the noise level will increase as the signals have to go through the distribution transformer and capacitor banks. The G3-PLC standard system [18], which exhibits a higher data transfer rate and high-speed, long-range communication capability on a power line, also undergoes the same process.
In 2009, the IEEE 1901.2–2013 working group began discussion of subjects concerning PLC technology with the companies involved in the automotive standard meetings [18]. Since then, they have developed a low-frequency (max. 500 kHz)-based NB-PLC standard for the global NB-PLC-based systems and applications. The systems and solutions based on the IEEE 1901.2–2013 standard are quite effective for home-networking applications, electric vehicles and their charging stations, and power grids and their meters. They also provide effective performance for communications through medium- to low-voltage transformers. Meanwhile, the ITU-T G.hnem standard [19] provides the definition for the unified NB-PLC OFDM-based technology, targeting several SG applications including smart metering, distributed automation, residential energy management, generic home automation, vehicle recharging, etc., adopting Ipv6 as its primary networking protocol.
Both ITU-T recommendations, G.9955 (G.hnem PHY layer) and G.9956 (G.hnem data link layer), were certified in February 2011. Both G3-PLC and PRIME technologies allow the penetration of electrical devices such as distribution transformers and capacitor banks, and they are found to be effective and applicable to the advanced distribution automation (ADA) systems after being considered to be two major applications for SG infrastructures [20]. These technologies are currently open to the public and industry, so they have been the primary basic technologies for the globally recognized ITU standard called G 9955 narrowband OFDM-based PLC transceivers, a physical (PHY) layer specification [1]. The flexibility requirements for multi-standard systems have been dealt with via the multi-protocol PLC analyzer (MP-PLCA) [21], which has been successful in analyzing industrial power distribution networks, covering a frequency band of up to 400 kHz. The results from several experiments have shown that the PLC signals can cross distances of over 100 m, specifically for industrial use.
Raffaele Carli and Mariagrazia Dotoli published [22] “A decentralized resource allocation approach for sharing renewable energy among interconnected smart homes.” Niels Blaauwbroek, et al. [23] published “Decentralized Resource Allocation and Load Scheduling for Multi-commodity Smart Energy Systems,” whereas Giovanni Brusco, et al. [24] presented an “Energy Management System for an Energy District with Demand Response Availability” after their respective research activities.
Meanwhile, Raffaele Carli and Mariagrazia Dotoli and João Figueiredo and José Sá da Costa also presented some interesting research results in “Cooperative Distributed Control for the Energy Scheduling of Smart Homes with Shared Energy Storage and Renewable Energy Source [25]” and “A SCADA system for energy management in intelligent buildings [26],” respectively.
Oslo City’s successful sustainable energy transition based on some innovative ideas and technological developments is well-described by Lind and Espegren [27], who studied all sorts of previous and present plans or measures taken for energy and climate-related issues and effectively used the results for transforming the city into one of the world’s leading low-carbon cities.
Meanwhile, Sun et al. [28,29] collectively studied the RES’s role in China’s sustainable energy transition policy and concluded that it is essential to develop renewable energies to achieve the “Intended Nationally Determined Contribution (INDC)” in the post-2020 era after examining China’s renewable energy status and potential in achieving the goal set by INDC. The eight different scenarios assuming 40% of total electric power output to be generated with renewable energies were established under the “Energy Plan,” and the simulation results revealed that renewable energy sources were able to replace up to 20% of fossil energy sources such as oil or natural gases and could be used for electric power production for 40–50% of the current fossil energy-based generation systems.
A number of countries such as India [30,31], Thailand [32], Japan, and the Republic of Korea are also seeking the most efficient ways to achieve successful sustainable energy transition [33] in their respective territories. Under these conditions, Steg et al. [34] studied the human factor that could be involved in such process, proposing a general framework that can recognize and understand human behaviors that encourage/promote/advocate sustainable energies [35,36].
Most of the studies on PLC technology reveal that this technology can be an efficient platform technology for a smart metering network. Borrowing such idea, this study attempts to construct a PLC-based monitoring system that allows the central control facility or system operator to monitor, estimate, and manage all power usages remotely and provide subscribers with some important information that could help them understand or control their usages or use patterns, including helping them prepare for future incidents that may occur due to system failures. C or C++ programming language was used to create the protocols for the system operation algorithm. The completed platform can be quite useful for the sustainable building process, and all of its efficient functions will enable the user or the power system itself to conserve power systematically. The system is also scalable, and its design and algorithm are applicable to other network systems including Zero Energy Building Management, for example. One of the significant contributions of this study is that, unlike before when new buildings were usually considered for the application of new technologies, the proposed system targeted decrepit buildings or apartments. Prior to the actual application, a Test Bed experiment was conducted, from which the flexibility and efficiency of the system have been confirmed.
Jae-Shik Yoon, et al. [37] devised a power monitoring system by developing a low-power PLC modem with power monitoring and abnormal power-blocking function (Figure 3) to detect power consumption and block unusual power activities with their test program (Figure 4).
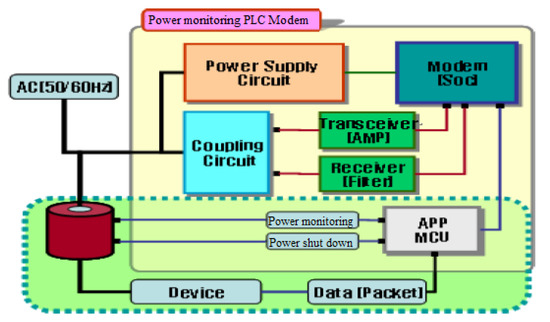
Figure 3.
Power Line Communication (PLC) power consumption monitoring system.
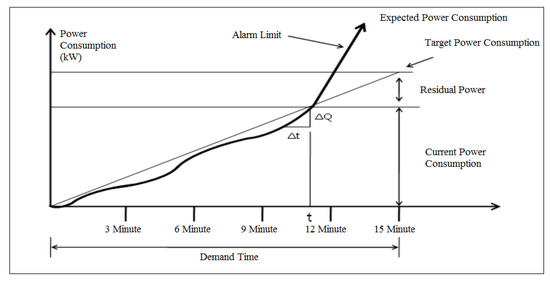
Figure 4.
Power consumption measurement by the Power Consumption Monitoring System.
Seon-Tae Yoon et al. [38] implemented a PLC-based human disaster prevention and location information monitoring system by using PLC communication and Zigbee. The system consists of a fixed-node system using a PLC + Zigbee board, a mobile-node system using a Zigbee sensor board, and a monitoring system that allows real-time monitoring of the data received from each node (Figure 5). The fixed nodes are installed on the power lines laid out in each work zone, whereas the mobile nodes are carried by the workers or attached to their work hats. The range of these nodes is set at tens of meters.
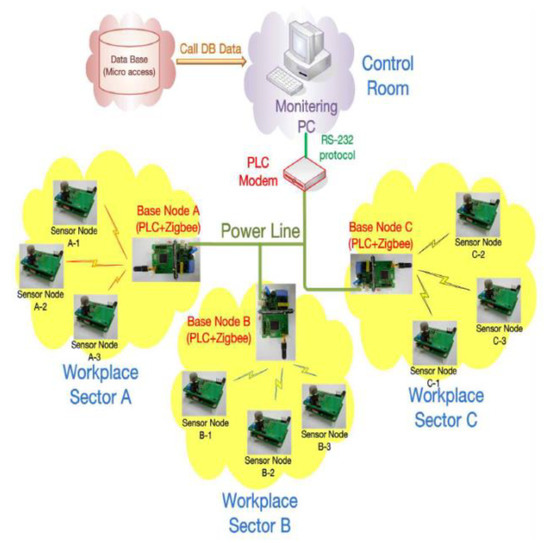
Figure 5.
Configuration of the proposed System.
Keun-Soo Park [39] implemented a system equipped with a PLC modem and a DCU to monitor the data from the household meter via PC. The collected data includes each household’s previous and current months’ power usage so that the user can conveniently manage his/her electricity rate or meter troubles by checking them on the server PC.
It shows the required values on the PC after simultaneously storing seven different pieces of information through the DCU. Although the IC used in this experiment guarantees a maximum of 1024 nodes allocated to a single DCU, it is commonly specified at the actual sites that up to 20 units should be linked to establish reliability. Still, such a requirement can vary depending on the company utilizing the system.
A private line had to be laid for the existing meters to send data to a PC or a mobile device, but the system implemented in this study allows the serial data to be checked through a direct connection to the power line. Moreover, this system can be modified to convert the power usage into the power rate based on the calculation method set by Korea Electric Power Corp. (KEPCO) or visualize the power consumption level by indicating the hourly power usage with a graph. Such effort can be helpful to consumers in using electricity sensibly. The additional modification can include adding a remote-control system through a mobile device or the Internet.
Keun-Ho Park and Young-Ho Lee [40] implemented a PLC modem and an Internet map-based data collection device with a Graphical User Interface (GUI) monitoring system to monitor household meter data on a PC. The device can conveniently monitor the previous and current months’ power usage from the household electricity meters through visualization by utilizing the Internet map information. This has made it easier for the public (non-experts) to manage power usage and meter troubles by checking their power use information on the PC.
Figure 6 shows the experiment conducted for the system configured in Figure 7. The load used for each meter is the two metal halide lamps connected serially (220 V, 70 W per lamp). The light and thermal energies consumed by the lamps are converted into data values by the meter, and then the changed values are finally checked by the GUI tool. The information of all the meters is stored in the DCU and subsequently shown on a display when the relevant position is clicked.
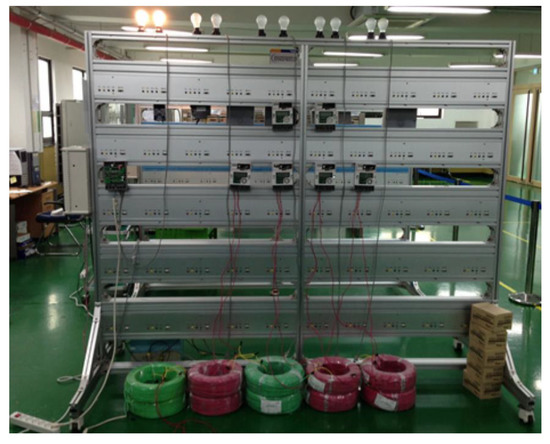
Figure 6.
View of the experimental set.
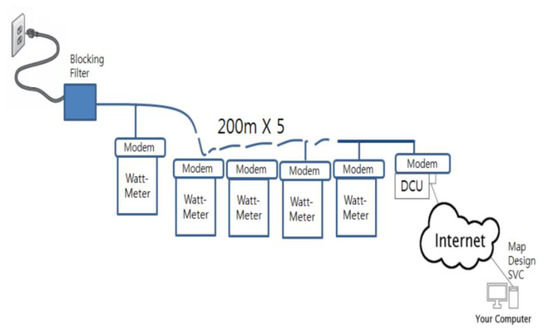
Figure 7.
Block diagram for experimental setting.
The infrastructure introduced by Paulo Régis C. De Araújo et al. [41]. in their work ‘Infrastructure for Integration of Legacy Electrical Equipment into Smart-Grid Using Wireless Sensor Networks’ proposes a system where individual legacy electrical devices are integrated to be connected to a sensor node and the sink node links it with a Smart Grid using an appropriate communication protocol. Also, the research work ‘OpenZmeter: An Efficient Low-Cost Energy Smart Meter and Power Quality Analyzer’ by Eduardo Viciana et al. [42]. specifically points out that consumers usually are not provided with the information about their energy consumption status on a real-time basis as well as the quality of power they are using due to the cost of available electric energy meters that are often so complex for them to understand or operate. The authors proposed an alternative affordable but innovative home-use electric energy meter that was supposed to be more precise, manageable, and reliable while offering better convenience. The system performance was quite satisfactory when it was tested in a household for a period of two weeks and the performance data also supported the system proposed in this paper.
Additionally, González et al. [43] introduced a systemical approach that allows PLCs and Arduino platforms to be integrated into a SCADA system with the connectivity offered by Open Platform Communications (OPC). In this system, the open-source device focuses on sensing tasks exclusively. The validity of this approach was proven by applying its concept to an experimental automated SMG which was intended to monitor the temperature level of a specific PV panel, presenting satisfactory results [44].
Meanwhile, Maria-Angeles, Sanchez-Hidalgo, and Maria-Dolores Cano [45] pointed out in their work ‘A survey on visual data representation for Smart Grids control and monitoring’ that all the collected/processed data in a smart grid are inherently heterogeneous because of the intrinsic nature of smart grids, and it is essential to devise effective ICT tools or platforms that can provide a broader spectrum of multi-dimensional control perspective that could effectively support modern energy industry. They emphasized that data visualization could be an effective solution when monitoring/analyzing/responding to the events efficiently within a Smart Grid. For this study, a wide range of relevant research works was studied to investigate previously available visualization methods and propose an optimal one for the control and monitoring tasks in a Smart Grid.
Today, people and things are being connected by IoT systems regardless of time or space owing to the number of networks and services getting larger and larger every day. In this context, IoT can be regarded as a dynamic network infrastructure connecting worldwide internet users with online services. IoT technology/system has become an essential part of a Smart Grid where data is exchanged through a communication network connected to a power grid to autonomously collect and analyze the data obtained by monitoring transmission lines, substations distributing power, or household/business users.
3. Design of Monitoring System for Target Building
As in any country, many old buildings in Korea are repaired to be used for 40–50 years or even longer since constructing new ones is expensive. Because remodeling old buildings is not only expensive but also generates construction waste, repairing is the preferred alternative in many cases.
The structure cited for the testing of this paper was a steel-concrete building constructed in January 1980. The building located in front of Geumjeong-gu Office in Busan was facing reconstruction in the near future, and we used it as a testbed for two years and verified the safety of power line communication.
The office room we selected for the test had no city gas service, only the electrical heating system. As such, it had the spring cooler that is activated automatically in case of fire caused by an electrical short circuit. It shared the electricity with an accountant’s office on the third floor and paid half of the total electricity bill. The contribution of this paper would be the implementation of a system (power metering) that metered the power line communication and automatically divided the electricity bill for payment with an Android app.
3.1. Design of PLC between Electronic Ammeter and Main Server
An example of PLC implemented between an electronic ammeter and the main server is presented in Figure 8, where the MCU (Micro Controller Unit) controls the PLC module along with the DCU (Data Concentration Unit) that collects the meter age and sends its value to the main server regularly. The values delivered to the main server are then transmitted to the user’s portable device or other display devices by the PLC communication module. At this time, RS-232 communications are performed between the PLC module, the MCU, and the main server with a serial interface connecting the communication modem and serial port. Such a communication type requires an adequate communication protocol.
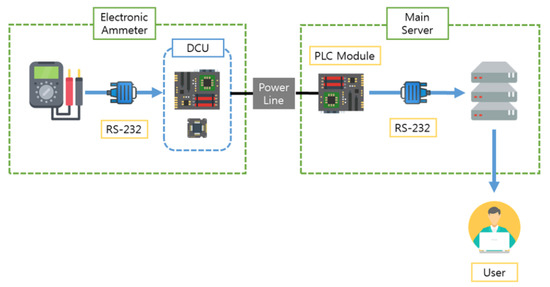
Figure 8.
Power Line Communication (PLC) between an electronic ammeter and the main server.
3.2. Target Building’s System Connections
The connections between the digital watt-hour meter, field terminal, and DCU are shown in Figure 9, where the modem communication line extended from the watt-hour meter connects the meter with the field unit. The PLC communication module is connected to the RS-232 communication unit, and then to the field connection unit, to perform communications with the main server over the power line. In this structure, optical communication components are used to establish the connections. They should be supplied or designated by the supplier/manufacturer of the digital meters to avoid any communication errors due to “out-of-spec” components. Figure 9 shows the connections between the watt-hour meter, field terminal, and DCU.
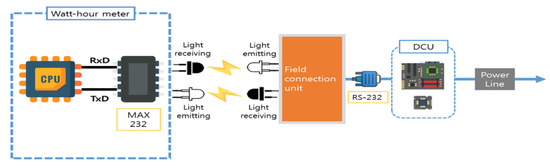
Figure 9.
Connections between the watt-hour meter, field terminal, and DCU.
3.3. Design of Mail Box and Port
A queue that could be designated by one or more senders or receivers is called a “mail box.” Figure 10 shows the related technique. Since anyone among the senders(n) can generate a message that can be taken away by anyone among the receivers(m), mail boxes offer more common communication equipment. Unfortunately, in distributed environments, receivers who see the same Mail box could be located at different computer sets, so the implementation of the “receive” computing operation is costly. As such, it is implemented with a limited mail box form mainly described as a “port.” The port involves only one receiver. The messages coming in from other processes and the designated port are sent to a location associated with the receiver, as shown in Figure 11.
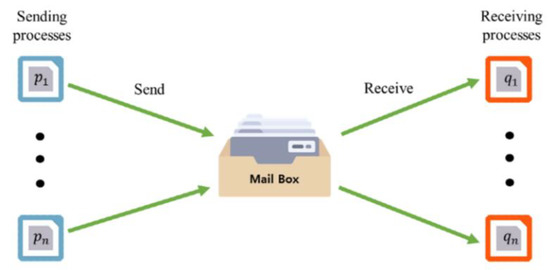
Figure 10.
Mechanism of the Mail Box.
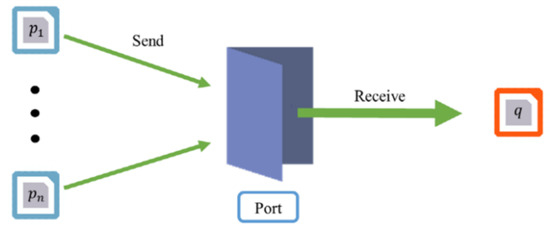
Figure 11.
Communication mechanism via a port.
3.4. Design of RS-232-based Protocol
PLC requires a suitable protocol when establishing connections between the main server and other individual devices. Since the PLC module executes a broadcasting function, individual devices require their own unique numbers, and the sign “Unused” has to be included as well. The protocol usually follows the TCP/IP model where the plus (+) sign should be attached at the end, meaning the communication has ended. Another requirement is that the minus (–) sign should be inserted between words. The commands used among the devices and their execution flow are presented in Figure 12.
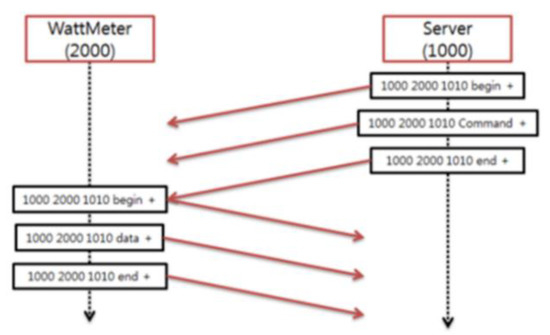
Figure 12.
RS-232-based protocol design.
As the server plays the main role, synchronization is not required; the connected devices or equipment will be in idle state until they are to start communicating. Likewise, for the purpose of controlling the individual device group, a broadcasting number will be given to each group to control/manage all the power sockets installed at home simultaneously. At the very first device group number is the broadcasting number, which is 3000 for the general device group, for example.
Meanwhile, communication using PLC technology usually causes the occurrence of noise, so we have tried to reduce them by developing technology such as intelligent agent [1,6]. When it comes to reducing noise, however, RUDP showed better results than this agent.
For the research, OPNET-based simulations have been performed first, and then some actual PLC products were mounted to the system, followed by the development of a monitoring application to complete an appropriate platform/solution that is undergoing the testbed experiment at a decrepit building.
4. OPNET Simulation of the Power System Control Programs Using PLC and RS-232
Considerable installation cost was needed for the smart grid-based monitoring at a decrepit building, so an OPNET simulation was performed first in this research, after which a number of PLC products were mounted together with the monitoring application to complete the appropriate platform and solution for testing.
In this section, the contents to be implemented in the next section are simulated using OPNET 14.5 PL8. When the results are examined as shown in Figure 13, the transmission data and the received data can be confirmed to be identical in both communications. Likewise, Figure 14 shows PLC and RS-232 implementation using OPNET.
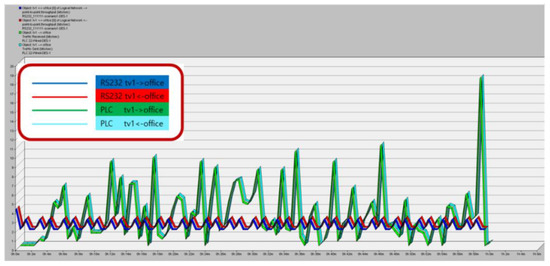
Figure 13.
Traffic Send/Receive comparative simulation results for PLC and RS-232 using OPNET Simulation.
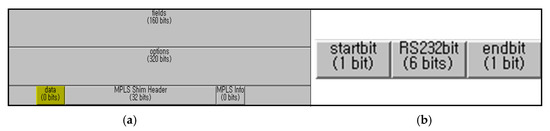
Figure 14.
PLC and RS-232 implementation using OPNET Simulation: (a) Packet Format of ip_dgram_v4 used in PLC; (b) RS-232 Packet Format used in RS-232.
As one of the serial interfaces, RS-232 is generally called a serial port. It uses a small number of line cables, and it is cost-effective. It is an asynchronous serial communication method wherein the meaning of serial is to send only one bit at a time for the information to transmit. RS-232 has this feature and allows regular data transmission and reception. In the case of parallel communications, multiple bits can be sent simultaneously. This means that one line is required for each bit, which is cost-inefficient compared to serial communication. In the case of PLC, which is parallel communication using a power line, irregular data transmission/reception occurs compared with RS-232. This is due to the inherent limitation of PLC, i.e., it is not designed for communication purposes, compared to RS-232, which transmits 1 bit at every moment over a short distance due to the difference in transmission environment. By transmitting power and data simultaneously, it has high load interference and noise due to the fact that AC signals are a worse transmission environment than RS-232, a serial communication. In addition, due to the characteristics of AC power, it is difficult to control the signal attenuation, which constantly changes according to the geometry or load of the transmission line. In contrast, RS-232 PLC does not require difficult construction.
In RS-232, it is necessary to transmit in the form of bit units through a physical channel. For this purpose, information must be broken up into units of data words of various lengths. In the PC, a length between 5-bit and 8-bit is basically selected, and this length is quantitative. Additional bits have sync or error-check purposes, and they are added to the data bits. The important point here is that the number of bits in the sender and receiver must be coordinated in advance and must be the same. Otherwise, the data may be misinterpreted, or the information broken up by data words may not be fully recognized.
The disadvantage of RS-232 lies in the selection of the receiving time of the receiver. If the receiver incorrectly chooses the moment of information reception, resynchronization is required to recover it, and all data sent prior to resynchronization is lost, resulting in inefficiency.
Start bit and End bit can be used to avoid this disadvantage. When the start bit is received, the receiver recognizes the start of the transmission of information from that point and recognizes the end of the information by receiving the End bit. In the case of a Packet format of RS-232 configured by OPNET, an asynchronous characteristic is implemented by allocating 1 bit each of the start bit and end bit. No separate parity bit is allocated for communication efficiency. For RS-232, which is not in transit, the TD line is set to 1. When initiating data transmission, the sender sends a start bit that lasts for the time frame of the baud rate with a logical 0. By sending the start bit, the data communication device (DCE) simply waits for the TD line of the data terminal device (DTE) to change from the logical 1 state to the logical 0 state, enabling the synchronization implementation of the transmission. Just as the start bit specifies the start of a character, the stop bit specifies the end of a character. The stop bit transmitted by the serial transmitting device is always a logical 1, and it also sets the TD line. When the stop bit is received, it remains idle. Table 1 shows the 9-pin RS-232 connector configuration.

Table 1.
9-pin RS-232 Connector Configuration.
This is the same as the data format used in IPv4. It consists of hiding the information in the upper layer and adding header information to the encapsulated data. The header information includes all information required to transmit a packet to the other party as well as information such as the version of the Internet protocol, length of the header, DSCP, ECN, length of the entire IP packet, and identification number for fragmentation.
In the simulation result of Figure 15, when the packet format is considered, the ip_dgram_v4 used in the PLC is big, and RS-232 is small. Intuitively, the PLC queuing delay is long, and RS-232 queuing delay is short. In the case of PLC, however, it is possible to transmit a plurality of bits by using parallel communication. In the case of RS-232, by using serial communication, only one bit is transmitted at a time. It can be seen that the queuing delay is longer, which indicates the difference until the transmission from the entry to the transmit channel queue.
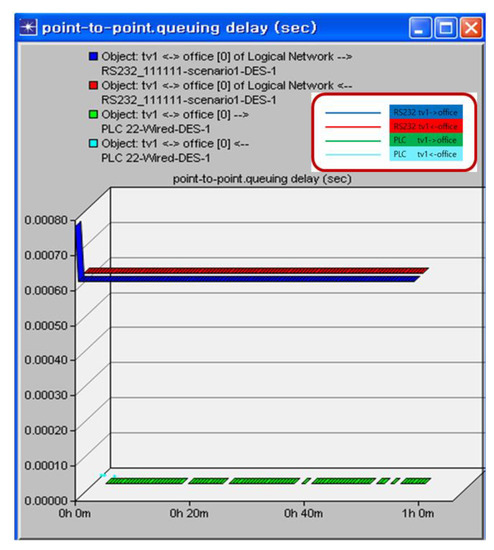
Figure 15.
Comparison of results for PLC and RS-232 communications using OPNET simulation.
5. Implementation of Android Application for Monitoring System for Sustainable Building Management
5.1. Implementation of Power System Control Programs Using PLC
The implemented system can be largely divided into the power usage reception part and device control part. In the power usage reception part, the power consumption data from a wattmeter is received and processed by the MCU, and the server can receive the data via communications between PLC modules. In the device control part, the server that has received a command from a client delivers a command (i.e., device control, etc.) to the MCU via the PLC module connected with a power line, and then the MCU controls the power supply of a light bulb. A light bulb was used for the experiment in this study to enable use for other devices.
C and C++ languages were used for the implementation, with the implementation flow described with Lines 1 to 23 in Table 2. The indicators are represented as (total number of previous access addresses) and (total number of present access addresses).
Table 2.
Implementation algorithm.
The description of each formula is as follows: Line 1: A comparison between previous and current access addresses is made; Line 2: When the current and previous access addresses are the same; Line 3: When the access time of the current address remains the same over a week; Line 4: A warning is sent to the user’s family; Line 5: Return to the comparison stage f(x); Line 6: When the current and previous access addresses are not the same; Line 7: When it has been calculated that the number of current access addresses exceeds 2(g(x)); Line 8: Return to g(x) comparison; Line 10: When the access time of the current access address remains the same for over 3 days; Line 11: A “visit request” is transmitted to the volunteer center; Line 12: Return to comparison f(x); Line 13: The number of users being connected to Wi-Fi is estimated; Line 14: Home IP addresses are allocated; Line 15: Wi-Fi connections are checked along with the SSIDs, and then the current addresses are allocated; Line 16: Determine whether the home address is the same as the current access address or not; Line 17: Determine if the number of users being connected has increased; Line 18: Wi-Fi connection is disconnected; Line 19: Determine whether the home address is the same as the current access address or not; Line 20: The number of users being connected is reduced; Line 22: The function stops; Line 23: Return to P(x).
5.2. Estimation of Power Use Status: Graphical User Interface Using Java
The key element in the proposed system is that an actual PLC product has been installed in a decrepit building along with an efficient platform/solution complete with a monitoring application with which customers will be able to interact intelligently concerning their power usages.
The power consumed for a three-minute period is estimated, and the corresponding strings have been processed by splitting them into Carriage Return (\n) units. The aggregated power use amounts entered from the Arduino circuit are shown in Figure 16. A desk lamp was used for simplicity, and its power consumption amount was measured every five seconds.
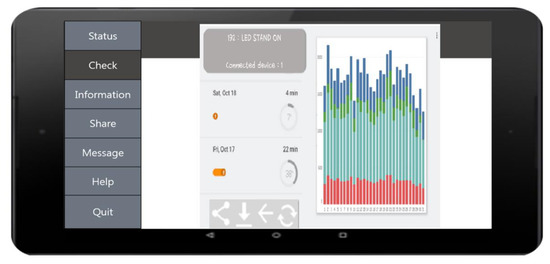
Figure 16.
Application for PLC-based monitoring.
As shown in Figure 17, the proposed application is for the monitoring system to harvest energy. “Connected Device” refers to the current number of connected devices, with the left part of the picture indicating the date, hours spent to collect electricity, and its volume (%). Likewise, with the menu bar at the bottom left, Sharing, Download, Back, and Device Change can be performed. This is a system that intelligently reports the electricity usage to the user by monitoring it based on PLC communication and compiling the statistics to allow the manager to save electricity.
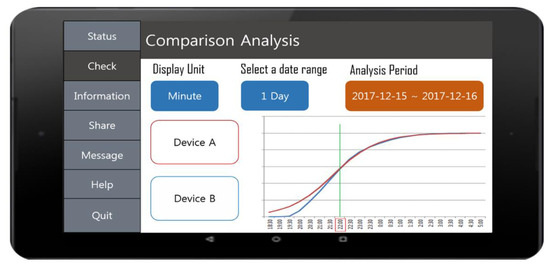
Figure 17.
Java Android-based user interface comparing power usage.
Figure 17 shows the Java-Android-based user interface that compares the power usages. The menu consists of Status, Check, Information, Share, Message, and End from the top. The screen in the picture demonstrates the result when the Check function has been selected to perform a comparative analysis. The expression unit, period setting, and date setting are shown in the first line.
The screen unit was set as a per-minute rate, whereas the period was a single day from 15/12/2017 to 16/12/2017. The period can be adjusted by the user. Nevertheless, to minimize energy consumption, the data is transmitted once every minute. Household appliances such as refrigerators have to be connected to a power source for continuous use. This way, any Big Events (uses) can be monitored when detected. As shown in the picture, the minimum unit was set as a per-minute rate, and the period, as a day, for the graph so that the user can check the usage for one day.
The interface below is for comparative analysis. Equipment A and B have been selected, with the result of the analysis shown with the adjoining graph. The accumulated energy of equipment A is shown with a red graph line, and that of equipment B is drawn in blue.
Figure 18 shows the time graph user interface implemented with Java Android, which can represent the energy by comparing it with the time graph. In the picture, the top screen indicates how energy has been collected over time. The red line represents the total amount, and the yellow line indicates the energy harvested. The blue line represents the lost energy. By subtracting the amount represented by the blue line from the amount represented by the yellow line, the total amount represented by the red line can be obtained. The graph shows the progress depending on the time graph directly below. There is a typical user interface at the bottom left where the Menu, Message, Share, and Help functions are located. At the bottom right is an indication of the harvested amount of energy. On the left, the aggregated energy level in the ESS is visually indicated, and the pie chart on the right shows the energy capacity in percentage with various colors.
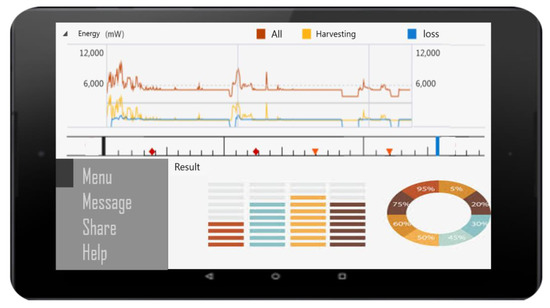
Figure 18.
Time graph user interface implemented with Java Android.
The system where the data of a digital watt-hour meter can be checked with a smartphone in the UI through the PLC system installed in a decrepit smart home environment has been developed (Figure 19 and Figure 20). As shown in the picture of the test bed, the user can check that the measurement of the digital watt-hour meter is 22.4 kW.
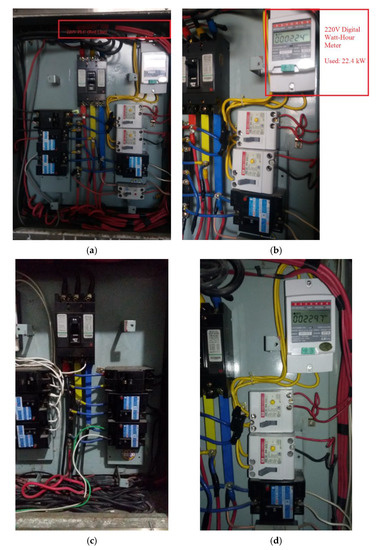
Figure 19.
PLC System and Digital Watt-Hour Meter installed in an old home environment. (a) PLC Centric Monitoring System (Main part); (b) Digital Watt-Hour Meter; (c) Before Installation (PLC and Digital Watt-Hour Meter); (d) Digital Watt-Hour Meter (1 July 2018–30 June 2019).
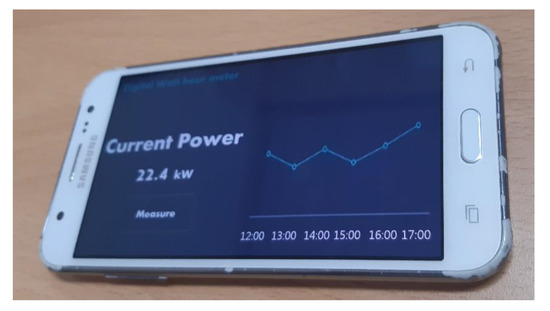
Figure 20.
User Interface for power usage monitoring.
6. Analysis of Performance Evaluation
6.1. Comparison with Other Systems
PLC communication is mainly used in infrastructures where the power line network is systemized [46]. The PLC communication system allows the remote control of electronic equipment and household appliances through mobile devices or Internet as well as security measures like intrusion detection or safety measures including remotely shutting off gas valves. Such a system is also used for the control of air-conditioning units, home network systems, streetlights, airport runway guide lights, golf course sprinklers, train lights, and product management systems that use a small-scale wireless communication system such as Zigbee. Table 3 shows a comparison of the results with other systems.
Table 3.
Comparison with other Systems.
One of the success cases of using PLC technology for old buildings can be first found in the PLC testbed service carried out by SK Broadband (Republic of Korea) for 100 households in 2017. Their service allowed the users to enjoy an average speed of 100 Mbps just by plugging the PLC equipment into a power outlet and it was validated that the speed up to 800 Mbps can be achieved with this technology, which is not much different from the 100 Mbps high-speed or Max. 1 Gbps Giga-internet service currently available. Although the PLC system seemed to be promising after the ROK’s Ministry of Commerce, Industry and Energy and Ministry of Information and Communication revised the Radio Waves Act and prepared the PLC National Standard in 2007 to promote and spread power line-based home networks, it was not actually adopted for the domestic high-speed internet services due to the dispute over its stability and oppositions by most of the communication service providers; only a few companies including Samsung and LG Electronics provided the PLC-based home network services. At the same time, Korea Electric Power Corp. (KEPCOM) also attempted to enter the local home network service business with their own PLC system but failed to achieve its commercialization. SK Broadband explained at that time that they were able to provide their testbed service after securing enough speed and stability close to a gigabyte-based service, which was not possible earlier.
Most of the buildings constructed before 2000 had some limitations when trying to use high-speed internet, internet TV/telephone or Wi-Fi so that local area network (LAN) cables had to be installed additionally. Also, the demand for LAN cables is increasing recently as the number of households using a multiple number of these devices/equipment is growing rapidly, supporting the economic feasibility of PLC-based systems. SK Broadband is expecting that these systems will play a big role when they attempt to penetrate the niche market targeting old areas/buildings where installation of LAN cables can be costly or difficult [47].
Meanwhile, the ROK’s Geumcheon-gu Office conducted a testbed service for an apartment complex in 2019 to replace its old mechanical power meters with smart meters using PLC equipment. The main point of this project was to allow the residents of Doksan Newtown Branew Apartment Complex to check their own power usages on a real-time basis on an app anytime anywhere through newly installed smart meters. The task of replacing old meters was carried out by an energy company Energynet specializing in the PLC business that focuses on voice-call and data communication systems through existing power lines as a medium. Geumcheon-gu Office expected that the accuracy and efficiency would increase much through remote meter reading without requiring a lot of manpower once the testbed service was implemented. They are also expecting that the data collected from the real-time transformer and power use monitoring systems will be used as big data in the future through an integrated management system. All of these systems will be helpful for the residents to save their power usages which in turn will be returned to them in a form of Ecomileage [48].
6.2. Performance Evaluation
For the performance evaluation of mail box, its functional diagram has been analyzed and examined. First, the User creates Mail on the server when a request is made and puts Mail in the Inbox of the Device Manager (1st process). The Device Manager then checks the Inbox and, if there is any Mail, sends out the command to the relevant device and gets the response from the device (2nd and 3rd processes). Finally, the Device Manager puts the response content in the Outbox, and the User checks it to get his mail if there is any. Here, as a performance evaluation, a load test that checks how fast the Device Manager would process simultaneous mail-requests from multiple users, including a robustness test to determine whether the normal operations are being performed by discarding wrongfully sent mail from the multiple users properly, was conducted. Figure 21 shows a functional diagram of the mail box.
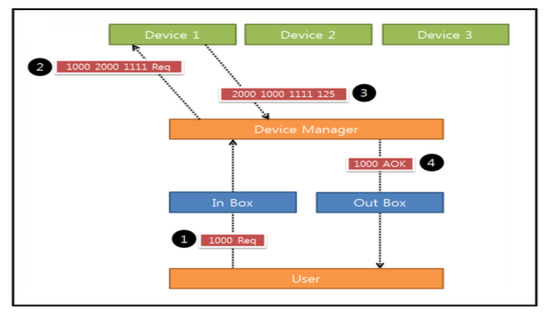
Figure 21.
Functional diagram of Mail Box.
A “User” has been created with the program, and he sends out 50 requests to the server continuously. After transmitting the messages, the user terminates its action immediately without waiting for the response. The transmission failures were analyzed through the recorded “Logs” on the server, and the direct device-to-device link method was adopted to reduce failures caused by PLC interference. Figure 22 presents the results obtained from the load test and the robustness test.
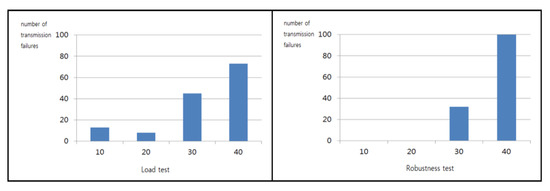
Figure 22.
Load test and Robustness test.
First, the load tests were conducted by adjusting the number of users from 10 to 40 people. Transmission failure rapidly increased when the number of users exceeded 29 people, and all of the times taken to complete the response showed the same increase. Second, similar to the load test, robustness tests were conducted by adjusting the numbers of users within the range of 10–40 people. Likewise, the number of wrong replies also increased rapidly when the number of users exceeded 29 people. It was possible to determine both the robustness and the load resistance level of the mail box through these two tests and of the entire program itself. If the mail box works properly, and the failures do not originate from PLCs, we can assume that all functions are in good order. Thus, even though the performance of the program declined rapidly with over 29+ users, and considering the fact that the program is intended for ordinary families in our country (i.e., families of fewer than 10 people), we do not anticipate much of a problem.
The analysis result above revealed that the PLC-based method did not show an adequate level of reliability, and it could be seen that the failure rate increased with greater interference. If the reliability is low, more retransmission requests would be transmitted, so the efficiency of the entire system could decline. Due to the nature of PLC technology and the fact that it would be difficult to increase the reception success rate without replacing the module, the simplest form of communications is preferable. Moreover, a mechanism that deals with re-requests and re-responds when the original messages have not been processed should be designed and added to the system. As the key element in the proposed system, an actual PLC product has been installed in a decrepit building along with an efficient platform/solution complete with a monitoring application with which customers will be able to interact intelligently concerning their power usage.
7. Conclusions
The issues discussed in this study in relation to the proposed system can be classified as follows. First is the time element, specifically the time required for the network connection. A delay of a few seconds occurs when the proposed system is used to connect with Wi-Fi, determine the present number of residents, and then initiate control of the devices installed at home via PLC. Although this type of delay may not be much of a problem, it could actually cause some inconvenience for the system users or operators. Second, due to the nature of PLCs, the vulnerability to noise is inevitable, and the instability caused by such vulnerability limits the expected capacity of the system. These issues can be viewed as the problems originating from the limitations of the present PLC and network technologies, not from the system design and implementation method presented in this study. Nevertheless, such time and noise-related issues are expected to be solved in the near future following the development in research works on advanced PLC technologies. Additionally, the proposed system has been designed for use in an environment where the users are actively utilizing smart devices, which gives rise to the issue of generality. Considering the rapid distribution and use of smart devices including smartphones/tablets or wearables, however, it is safe to say that the problem of generality is almost ignorable at this stage. It is also possible to develop a simpler form of such devices for senior citizens or handicapped persons who are not familiar or who are having some difficulties with smart devices.
A PLC-based solution for decrepit buildings or apartments has been developed along with its testbed. The results from the experiment confirmed that the solution is flexible and suitable for use. As the main contribution of the study, the research has shown that there are great potentials for the PLC technology when it is converged with some of the advanced communication technologies.
The content presented by the first author Jun-Ho Huh when he was a senior research engineer at SUNCOM Company was about the three-phase three-line power line communication system [49] which was installed at a shadow area when building a ship and successfully resolved the communication problem.
Another reason for the transmission rate to drop during actual navigation is due to the noise occurring while conducting power line communications [49]. When the transmission rates were compared between office, land-based testbed, and actual ship [49,50], the rate measured in the office was a little lower than that of the testbed but higher or almost similar to the rate measured aboard. Different from the actual ship the walls of the office were made of cement. This shows that the fading effect can occur in the office as well and the attenuation of electromagnetic waves can be higher when compared with testbed surrounded by steel walls.
This study had continued to develop a monitoring solution for the old homes and completed the testbed experiment, securing the system stability.
Thus, this paper introduced ship PLC-based legacy-line communication (LLC) system construction technology and tested its performance level by conducting a data transmission experiment.
LLC system is a technology to secure a communication line without damaging the exterior of the facility by utilizing the conductive media already being installed in a ship [49], railroad [6] or a building [51,52,53]. Thus, this technology has the merit of largely reducing the structural changes as well as the time and expense required to design and construct additional lines. One of the typical examples of LLC systems is the power line (PL)-based system proposed in this study, but the existing telephone lines or copper cables that have been used as a communication line can be used as well [54,55,56]. Also, the technology utilizing air-conditioning pipes installed all cross the building can be a good candidate even though they are not used as a typical transmission media [52,57]. Therefore, we expect that the solution proposed in this study would lay a foundation for sustainability research.
Meanwhile, the PLC system requires at least two communication equipment per line to set the master-slave and from the second line, slaves can be added as many as necessary lines so that it is quite economic. In some of the foreign nations where it is difficult to install LAN systems for their houses, many leading network equipment companies manufacture PLC modems and sell the products using Wi-Fi. The PLC systems are useful in the areas where wireless systems are not suitable or installing Ethernet cables is difficult and can be considered as the easiest way of constructing a wired communication network in the decrepit building.
This study is also expected to contribute to improving the working environment at construction sites, especially in shadow areas. The platform technology designed here could be foundational for the future sustainable energy strategy, and functions such as uninterrupted power usage monitoring and remote power control/management will be quite useful for saving energy in both present and future worlds. The secondary technologies that should be studied in detail are not described here, but they will be introduced in future extended research work after completing patent registration.
Our future research plan is to develop a monitoring system for the smart grid equipment in Southeastern countries and it will be essential to develop a faster PLC-based communication solution at the same time.
Author Contributions
Conceptualization, J.-H.H.; Data curation, J.-H.H.; Formal analysis, J.-H.H.; Funding acquisition, J.-H.H.; Methodology, J.-H.H.; Project administration, J.-H.H. and J.H.P.; Resources J.-H.H. and J.H.P.; Software, J.H.P.; Supervision, J.H.P.; Validation, J.H.P.; Visualization, J.H.P.; Writing—original draft, J.-H.H. and J.H.P.; Writing—review & editing, J.H.P. All authors have read and agreed to the published version of the manuscript.
Funding
This research was supported by Energy Cloud R&D Program through the National Research Foundation of Korea (NRF) funded by the Ministry of Science, ICT (NRF-2019M3F2A1073385). Also, this work was supported by the National Research Foundation of Korea (NRF) grant funded by the Korea government (MSIT) (No.2017R1C1B5077157).
Acknowledgments
The part of first draft of this Congress Proceeding [46] was presented in at The 2015 World Congress on Information Technology Applications and Services Proceedings of the “Advanced Mobile, Communications, Security, Multimedia, Vehicular, Cloud, IoT, and Computing” (World-IT 2015), February 24-26, 2015, Jeju, Republic of Korea. We are grateful to Tae-Woo Park, president of Samsung Renault, for allowing us to use the building as a test bed.
Conflicts of Interest
The authors declare no conflict of interest.
Abbreviations
| PLC: | Power Line Communication |
| SMI: | Smart Metering Infrastructure |
| DR: | Demand-Response |
| HV: | High-Voltage |
| UNB-PLC: | Ultra-narrowband Power Line Communication |
| NB-PLC: | NarrowBand Power Line Communication |
| SG: | Smart Grid |
| DCD: | Data Carrier Detect |
| RD: | Received Data |
| TD: | Transmit Data |
| DTR: | Data Terminal Ready |
| DSR: | Data Set Ready |
| RTS: | Request to Send |
| CTS: | Clear to Send |
| RI: | Ring Indicator |
| HIFs: | High-Impedance Faults |
| PLC-AN: | PLC-Access Network |
| PLC-OR: | PLC-Opportunistic Routing |
| MP-PLCA: | Multi-Protocol PLC Analyzer |
| GUI: | Graphical User Interface |
| MCU: | Micro Controller Unit |
| DCU: | Data Concentration Unit |
| LLC: | Legacy-Line Communication |
| PL: | Power Line |
| LAN: | Local Area Network |
References
- Jun-Ho, H.; Otgonchimeg, S.; Seo, K. Advanced Metering Infrastructure Design and Test Bed Experiment Using Intelligent Agents: Focusing on the PLC Network Base Technology for Smart Grid System. J. Supercomput. 2016, 72, 1862–1877. [Google Scholar]
- Konark, S.; Saini, L.M. Power-line communications for smart grid: Progress, challenges, opportunities and status. Renew. Sustain. Energy Rev. 2017, 67, 704–751. [Google Scholar]
- Mazzeo, D.; Oliveti, G. Advanced Innovative Solutions for Final Design in Terms of Energy Sustainability of Nearly/Net Zero Energy Buildings (nZEB). Available online: https://www.mdpi.com/journal/sustainability/special_issues/Advanced_Innovative_Solutions (accessed on 14 January 2020).
- Lopez, G.; Moreno, J.I.; Amaris, H.; Salazar, F. Paving the road toward Smart Grids through large-scale advanced metering infrastructures. Electr. Power Syst. Res. 2015, 120, 194–205. [Google Scholar] [CrossRef]
- Konark, S.; Mohan, S.L. Performance analysis of smart metering for smart grid: An overview. Renew. Sustain. Energy Rev. 2015, 49, 720–735. [Google Scholar]
- Jun-Ho, H. Smart Grid Test Bed Using OPNET and Power Line Communication. In Advances in Computer and Electrical Engineering; IGI Global: Hershey, PA, USA, 2017; pp. 1–425. [Google Scholar]
- Mak, S.T.; Moore Thomas, G. TWACSTM, A New Viable Two-Way Automatic Communication System for Distribution Networks. Part II: Inbound Communication. IEEE Trans. Power Appar. Syst. 1984, 103, 2141–2147. [Google Scholar] [CrossRef]
- Build Your Smart Home. Available online: http://buildyoursmarthome.co/home-automation/protocols/x10/ (accessed on 14 January 2020).
- Power Line Technologies in Home Networking. Available online: http://www.xilinx.com/esp/consumer/home_networking/pdf_files/ch_7_plc/complete.pdf (accessed on 14 January 2020).
- Galli, S.; Lys, T. Next generation Narrowband (under 500 kHz) Power Line Communications (PLC) standards. Commun. China 2015, 12, 1–8. [Google Scholar] [CrossRef]
- Bumiller, G.; Sauter, T.; Pratl, G.; Treytl, A. Secure and reliable wide-area power line communication for soft-real-time applications within REMPLI. In Proceedings of the International Symposium on 2015 Power Line Communications and Its Applications, Vancouver, BC, Canada, 6–8 April 2005; pp. 57–60. [Google Scholar]
- Real-Time Energy Management via Power-Lines and Internet. Available online: http://www.iad-de.com/Rempli_Flyer.pdf (accessed on 14 January 2020).
- Haidine, A.; Portnoy, A.; Mudriievskyi, S.; Lehnert, R. DLC VIT4IP project high-speed NB-PLC for smart grid communication design of field trial. In Proceedings of the IEEE Power Line Communications and Its Applications (ISPLC), Beijing, China, 27–30 March 2012; pp. 88–93. [Google Scholar]
- Milioudis, A.N.; Andreou, G.T.; Labridis, D.P. Enhanced protection scheme for smart grids using power line communications techniques -part II: Location of high impedance fault position. IEEE Trans. Smart Grid 2012, 3, 1631–1640. [Google Scholar] [CrossRef]
- Sung-Guk, Y.; Jang, S.; Yong-Hwa, K.; Bahk, S. Opportunistic Routing for Smart Grid With Power Line Communication Access Networks. IEEE Trans. Smart Grid 2014, 5, 303–311. [Google Scholar]
- PRIME Alliance. Available online: http://www.prime-alliance.org/?page_id492 (accessed on 14 January 2020).
- DLMS/COSEM Solution for Power-Line Communication. Available online: http://www.st.com/web/en/resource/sales_and_marketing/presentation/product_presentation/dlmscosem_marketing_pres.pdf (accessed on 14 January 2020).
- G3-PLC Overview. Available online: http://www.g3-plc.com/content/g3-plc-overview (accessed on 14 January 2020).
- Oksman, V.; Zhang, J.G. HNEM: The new ITU-T standard on narrowband PLC technology. IEEE Commun. Mag. 2011, 49, 36–44. [Google Scholar] [CrossRef]
- Quang-Dung, H.; Chon-Wang, C.; Derakhshani, M.; Le-Ngoc, T. An analysis on throughput and feasibility of Narrow-band Power Line Communications in Advanced Distribution Automation scenarios. In Proceedings of the IEEE International Conference on Communications (ICC), Sydney, NSW, Australia, 10–14 June 2014; pp. 4233–4238. [Google Scholar]
- Stefano, R.; Paolo, F.; Alessandra, F.; Mattia, R.; Emiliano, S.; Angelo, V. Performance analysis of power line communication in industrial power distribution network. Comput. Stand. Interfaces 2015, 42, 9–16. [Google Scholar]
- Carli, R.; Dotoli, M. A decentralized resource allocation approach for sharing renewable energy among interconnected smart homes. In Proceedings of the 2015 54th IEEE Conference on Decision and Control (CDC), Osaka, Japan, 15–18 December 2015; pp. 5903–5908. [Google Scholar]
- Blaauwbroek, N.; Nguyen, P.H.; Konsman, M.J.; Shi, H.; Kamphuis, R.I.; Kling, W.L. Decentralized resource allocation and load scheduling for multicommodity smart energy systems. IEEE Trans. Sustain. Energy 2015, 6, 1506–1514. [Google Scholar] [CrossRef]
- Brusco, G.; Burgio, A.; Menniti, D.; Pinnarelli, A.; Sorrentino, N. Energy management system for an energy district with demand response availability. IEEE Trans. Smart Grid 2014, 5, 2385–2393. [Google Scholar] [CrossRef]
- Carli, R.; Dotoli, M. Cooperative distributed control for the energy scheduling of smart homes with shared energy storage and renewable energy source. IFAC Pap. Line 2017, 50, 8867–8872. [Google Scholar] [CrossRef]
- Figueiredo, J.; da Costa, J.S. A SCADA system for energy management in intelligent buildings. Energy Build. 2002, 49, 85–98. [Google Scholar] [CrossRef]
- Lind, A.; Espegren, K. The use of energy system models for analyzing the transition to low-carbon cities—The case of Oslo. Energy Strat. Rev. 2017, 15, 44–56. [Google Scholar] [CrossRef]
- Sun, X.Y.; Zhang, B.A.; Tang, X.; Benjamin, C.M.; Mikael, H. Sustainable Energy Transitions in China: Renewable Options and Impacts on the Electricity System. Energies 2016, 9, 980. [Google Scholar] [CrossRef]
- Sun, X.Y.; Zhang, B.A.; Zou, L.P.; Wang, R.Z. The Role of Renewable Energy in China’s Sustainable Energy Transition. In Proceedings of the 2nd International Conference on Sustainable Development (ICSD 2016), Xi’an, China, 2–4 December 2016; pp. 327–332. [Google Scholar]
- Amrutha, A.A.; Balachandra, P.; Mathirajan, M. Model-based approach for planning renewable energy transition in a resource-constrained electricity system—A case study from India. Int. J. Energy Res. 2018, 42, 1023–1039. [Google Scholar] [CrossRef]
- Thapar, S.; Sharma, S.; Verma, A. Local community as shareholders in clean energy projects: Innovative strategy for accelerating renewable energy deployment in India. Renew. Energy 2017, 101, 873–885. [Google Scholar] [CrossRef]
- Mah, N.Y.; Wu, Y.Y.; Ip, C.M.; Hills, P.R. The role of the state in sustainable energy transitions: A case study of large smart grid demonstration projects in Japan. Energy Policy 2013, 63, 726–737. [Google Scholar] [CrossRef]
- Steg, L.; Perlaviciute, G.; van derWerff, E. Understanding the human dimensions of a sustainable energy Transition. Front. Psychol. 2015, 6, 805. [Google Scholar] [CrossRef]
- Becchio, C.; Corgnati, S.P.; Delmastro, C.; Fabi, V.; Lombardi, P. The role of nearly-zero energy buildings in the transition towards Post-Carbon Cities. Sustain. Cities Soc. 2016, 27, 324–337. [Google Scholar] [CrossRef]
- Wang, H.; Di Pietro, G.; Wu, X.; Lahdelma, R.; Verda, V.; Haavisto, I. Renewable and sustainable energy transitions for countries with different climates and renewable energy sources potentials. Energies 2018, 11, 3523. [Google Scholar] [CrossRef]
- Liu, J.; Zhao, L.; Geng, Z. Current situations and future developments of PLC technology in China. In Proceedings of the IEEE Power Line Communications and Its Applications (ISPLC), Beijing, China, 27–30 March 2012; pp. 60–65. [Google Scholar]
- Jae-Shik, Y.; Jung-Chu, W.; Chung-Ha, P.; Yong-Jae, S.; Jae-Heon, J. Development of Low Power PLC Modem for Monitoring of Power Consumption and Breaking of Abnormal Power. Trans. Korean Inst. Electr. Eng. 2009, 58, 2281–2285. (In Korean) [Google Scholar]
- Seon-Tae, Y.; Ki-Won, P.; Bong-Jin, K. Implementation of the Man-made Disaster Prevention and Localization Information Monitoring System based on PLC. J. Adv. Navig. Technol. 2010, 14, 384–390. (In Korean) [Google Scholar]
- Keun-Soo, P. Implement of a Watt-Hour Meter Monitoring System using Power Line Communication. J. Korea Inst. Electron. Commun. Sci. 2013, 8, 1143–1148. (In Korean) [Google Scholar]
- Keun-Soo, P.; Young-Ho, L. Implement of watt-hour meter monitoring system by internet map based GUI using power line communication. J. Korea Inst. Electron. Commun. Sci. 2013, 8, 1435–1441. (In Korean) [Google Scholar]
- de Araújo, P.R.C.; Filho, R.H.; Rodrigues, J.J.P.C.; Oliveira, J.P.C.M.; Braga, S.A. Infrastructure for integration of legacy electrical equipment into a smart-grid using wireless sensor networks. Sensors 2018, 18, 1312. [Google Scholar] [CrossRef]
- Viciana, E.; Alcayde, A.; Montoya, F.G.; Baños, R.; Arrabal-Campos, F.M.; Zapata-Sierra, A.; Manzano-Agugliaro, F. Openzmeter: An efficient low-cost energy smart meter and power quality analyzer. Sustainability 2018, 10, 4038. [Google Scholar] [CrossRef]
- González, I.; Calderón, A.J. Integration of open source hardware Arduino platform in automation systems applied to Smart Grids/Micro-Grids. Sustain. Energy Technol. Assess. 2019, 36, 100557. [Google Scholar] [CrossRef]
- Ghasempour, A. Internet of Things in Smart Grid: Architecture, Applications, Services, Key Technologies, and Challenges. Inventions 2019, 4, 22. [Google Scholar] [CrossRef]
- Hidalgo, S.; Angeles, M.; Ma, C. A survey on visual data representation for smart grids control and monitoring. Sustain. Energy Grids Netw. 2018, 16, 351–369. [Google Scholar] [CrossRef]
- Jun-Ho, H.; Dong-Geun, L.; Kyungryong, S. Design and implementation of the basic technology for realtime smart metering system using power line communication for Smart Grid. Adv. Comput. Sci. Ubiquitous Comput. 2015, 373, 663–669. [Google Scholar]
- SK Broadband. Available online: https://www.mk.co.kr/news/business/view/2017/03/151149/ (accessed on 14 January 2020). (In Korean).
- Available online: http://m.electimes.com/article.php?aid=1566520662184954010 (accessed on 14 January 2020). (In Korean).
- Jun-Ho, H.; Taehoon, K.; Kyungryong, S. Design of a Shipboard Outside Communication Network and Its Testbed Using PLC: For Safety Management during the Ship Building Process. Processes 2018, 6, 67. [Google Scholar]
- Huh, J.-H.; Seo, Y.-S. Understanding Edge Computing: Engineering Evolution with Artificial Intelligence. IEEE Access 2019, 7, 164229–164245. [Google Scholar] [CrossRef]
- Kim, H.-S.; Kim, J.R.; Lee, H.Y.; Kim, K.U.; Huh, J.S.; Lee, J.H.; Oh, Y.W.; Byun, W.B.; Gwak, K.Y.; Ju, S.H. Signal transmission properties of the inductive coupler using the high permeability magnetic materials. J. Korean Inst. Electr. Electron. Mater. Eng. 2006, 19, 339–343. [Google Scholar] [CrossRef][Green Version]
- Kim, H.S.; Byun, C.H. Development of IBS Network System Using Copper Line of Air Conditioner. Mattron Corp, Gyeongnam at Republic of Korea. Available online: http://may.ulsan.ac.kr/muju2015/sogae_files/%E1%84%8E%E1%85%A9%E1%84%85%E1%85%A9%E1%86%A8%E1%84%8C%E1%85%B5%E1%86%B8%20V5.pdf (accessed on 15 February 2020).
- Kim, H.-S.; Park, S.H.; Kang, S.G. Development of communication joint tools for implementing a legacy-line communication system in a train. J. Korean Inst. Inf. Commun. Eng. 2015, 19, 877–887. [Google Scholar] [CrossRef][Green Version]
- Dostert, K. Powerline Communications; Prentice Hall: Upper Saddle River, NJ, USA, 2001. [Google Scholar]
- IEEE Std. IEEE Standard for Broadband over Power Line Networks: Medium Access Control and Physical Layer Specifications; IEEE: Piscataway, NJ, USA, 2010. [Google Scholar]
- Duche, D.; Gogate, V. Signal attenuation in power-line communication channel. Int. J. Emerg. Trends Technol. Comput. Sci. 2014, 3, 123–130. [Google Scholar]
- Hyun-Sik, K.; Kang, S.G. A powerline-based legacy-line communication system for implementation of a communication network in ship. J. Korea Inst. Inf. Commun. Eng. 2015, 19, 1831–1838. [Google Scholar]


© 2020 by the authors. Licensee MDPI, Basel, Switzerland. This article is an open access article distributed under the terms and conditions of the Creative Commons Attribution (CC BY) license (http://creativecommons.org/licenses/by/4.0/).