Article

Exploring the Effects of the Built Environment on Two Transfer Modes for Metros: Dockless Bike Sharing and Taxis

The Key Laboratory of Road and Traffic Engineering, Ministry of Education, Tongji University, Shanghai 201804, China
*
Author to whom correspondence should be addressed.
Sustainability 2020, 12(5), 2034; https://doi.org/10.3390/su12052034
Submission received: 7 February 2020 / Revised: 29 February 2020 / Accepted: 4 March 2020 / Published: 6 March 2020
(This article belongs to the Section Sustainable Transportation)

Abstract

:
The success of metro systems depends on effective multimodal solutions that bridge the first-and-last-mile gaps. Both dockless bike sharing (DBS) and taxis are important feeder modes for metros, which provide on-demand travel options with high flexibility and accessibility. Based on one-week trip data of DBS and taxis during a concurrent period in Beijing, China, the paper aims to compare the temporal-spatial distribution of two modes as first-and-last-mile connectors and find out the socio-demographic and built-environment factors that impact their usage. K-means clustering is implemented to visualize the spatial distribution of DBS and taxis around metro stations, and the spatial lag model incorporating spatial autocorrelations of variables is developed. The results show that people prefer to use DBS as a substitutable mode for bus services to serve first-mile interchange in the morning. Also, less economically developed areas with a high density of branches and fewer signalized intersections are more favored by DBS users, whereas people in the central areas with high housing price and developed arterial road network tend to take a taxi, especially during evening peak period. The study can offer the policy guidance to improve DBS services, and several recommendations are suggested to ensure the sustainable development of DBS.

1. Introduction

The metro transit system is fast, comfortable, reliable, and has good prospects for the development in many cities by providing a high-capacity, medium-to-long distance travel service [1], and the success of urban metro transit depends on effective multimodal solutions that bridge first-and-last-mile gaps in the transportation network [2]. Walking and riding a bus are the most common modes for metro transfer [3,4,5]. However, in the peripheral areas of a city where bus service is less robust and the walking distance to the metro station is too long, bicycles and taxis account for higher proportions as the transfer modes [6]. It is also reported that residents who live in suburban areas generate a large number of trips and take taxis to the nearest metro station for maximizing travel efficiency and cost effectiveness [7].
Many cities have developed a station-based bike sharing system (SBBS), which provides people with a cheap, healthy, convenient, and sustainable transportation mode. SBBS promotes bicycle usage and decreases the ridership of the personal automobile in the form of driving and taxis [8]. However, the SBBS implementation is relatively unsatisfactory in some cities, and the main barriers are poor accessibility to docking stations and lengthy registration process [9,10,11,12].
A new type of bike sharing called dockless bike sharing (DBS) developed in China in 2016, and there were over 1600 information technology–based bike sharing systems worldwide with over 18.17 million bicycles as of 2018 [13]. Compared with conventional SBBS and private bicycles, DBS users can flexibly pick-up and drop-off the bicycle anywhere without worrying about pick it back. Then the nearest bicycle can be found on demand with an application on mobile phones since all sharing bicycles are installed microchips comprising GPS and sensors that can simplify locating and recording routes. Moreover, people using DBS don’t need to take responsibility for maintenance and repair compared with private bicycle. Also, people riding DBS do not worry about the theft of the bicycle which used to be the serious concern of private bikes [14,15,16]. Consequently, DBS becomes prevalent among people as a new type of bike sharing, providing fast and flexible mobility for commuting trips during peak periods [17]. Furthermore, DBS is also found to be a widely accepted feeder mode for metros and improve transit usage. DBS annual reports from two biggest bike sharing companies indicated that nearly half of the shared bicycles are active around the metro stations in China and a total of 51% of these bikes are parked within 500 m of metro station areas [18,19].
However, DBS operators deployed large amounts of equipment in cities in a short period of time, which resulted in an increasing number of complaints about DBS fleets that were parked incorrectly and destroyed the public rights-of-way [20]. Most of the local government policies thus changed from the initially “neutral-positive” to “neutral-negative” and even “negative” toward DBS since the second half of the year 2017 in China [21]. Simply and directly restricting the development of DBS may lead to worse conditions in areas where metro transfer problems have been relieved by DBS.
Despite the differences between device type and using price, the modes of DBS and taxis share some similar features. First of all, they are both significant feeder modes for metros in areas with poor bus services. Second, finding an available device (bicycle or taxi) is required before a trip starts (but without responsibility of ownership). Third, they are both very flexible and provide convenient door-to-door service [22,23]. The major difference is that DBS is a sustainable mode, while the taxis are not, so it will have important policy implications to help the urban transportation system become more sustainable, as well as improve urban mobility and lower dependency on automobile travel. Therefore, it will be very interesting to visualize the spatial distribution of people who use DBS and taxis for metro transfer during peak periods, and further explore how socio-demographic and built-environment variables impact the use of two modes. Drawing from the experience of Beijing, hopefully, this paper can propose targeted policies accordingly to enhancing sustainable services of DBS, as well as recommendations on transportation infrastructure planning, not only for China but also for many other countries facing similar problems.
The remainder of this paper is organized as follows. Section 2 provides a brief overview of relevant studies. Section 3 describes the case-study context, presents the data compilation and sample information, and analyzes the spatial distribution of DBS and taxi usage. In Section 4, spatial lag models showing the effects of the built environment on two transfer modes are developed, and the results are presented. Section 5 presents a discussion of the findings. Section 6 presents the conclusions and provides recommendations for policy implications and transportation planning, as well as some limitations of the study.

2. Literature Review

2.1. Metro Access with Cycling and Taxis

Existing studies on bicycle-metro intermodal transportation are extensive. Some scholars have studied travel characteristics of bicycle–metro trips [21,24,25], bicycle parking problems at metro stations [26,27], and bicycle–metro integration demand forecast [28,29]. The existing literature mainly focused on the integration of SBBS with the metro. It showed that metro stations were critical origin–destination (O–D) of SBBS trips [30]. Ji et al. [31] indicated that riding distance was negatively associated with metro-bikeshare transfer demand of SBBS, especially in the suburbs. The density of bus, bikeshare stations, and nearby metro stations showed different degrees of correlation with ridership in different urban areas. Zhao and Li [32] found that the mixed land use and green parks around metro stations were related to high rates of bicycle transfer. However, a few existing studies on DBS focus on metro transfer, Du and Cheng [17] established that 51.13% of users used DBS in accessing metro stations. Zhou and Ni [3] found that good riding skill, non-motorized vehicle ownership, and metro stations located in the urban fringe would promote transfer mode shift. Questionnaire survey is the most widely used method for behavioral data collection. The advantage is that individual attributes are available, but its greatest disadvantage is inadequate sample size and limited study generalizability. In addition, Li et al. [33] collected DBS data in Nanjing City, China and applied K-means cluster to analyze the temporal and spatial distribution features and the range of influence of DBS systems near local metro stations. Nevertheless, the article lacks a deeper analysis of effects of the built environment on DBS usage.
As a matter of fact, the big data by employing GPS tracking data of taxi has drawn more researchers to examine the pattern and influencing factors of taxi ridership [34,35,36,37,38]. But only a few studies have paid attention to the effects of taxi as feeder model for metros. Li, Dong, Shen, Lang and Ye [7] analyzed the effect of the metro on the pick-up and drop-off locations of taxis. They found that the number of taxi trips between other areas and metro stations in suburb areas has generally increased after opening a new metro line. Kim [39] used cluster and classification methods to detect different ridership characteristics. Metro and taxi data were analyzed simultaneously to indicate that taxi ridership gathered in specific residential and business regions, which showed the hierarchical structure in Seoul.

2.2. Effects of the Built Environment on Bike Sharing and Taxis

The U.S. Department of Transportation has developed a framework that looks at Mobility on Demand in five built environments, including spatial, temporal, economic, physiological, and social [40]. However, many previous studies pay special attention to the spatial built environment. Table 1 summarizes the related studies in the field of analyzing the effect of the built environment on usage of bike sharing and taxis in terms of independent and dependent variables, data source, as well as model selection. Note that all of the following research on bike sharing are all SBBS.
As shown in Table 1, the sociodemographic variables, metro station characteristics, public transit, land use, and roadway infrastructure are the most frequently used types of independent variables. For the dependent variables, the majority of studies use ridership or usage rate as the target variable, assuming the wide applicability of these variables in studying SBBS and taxi issues.
In terms of the methodology, some studies have employed ordinary least square model (OLS), linear mixed model (LMM) and negative binomial (NB) regressions to examine the relationship between the built environment and ridership of bikes or taxis [30,34,41,42,43,44]. However, variables are usually analyzed on basis of a community or a traffic analysis zone (TAZ). There may be a spatial relationship between the observations, which means that variables in the neighborhood would affect each other. This spatial relationship violates the basic assumption of OLS regression model [45]. Therefore, some research has employed the spatial regression model that considered the spatial relationship, i.e. spatial heterogeneity or spatial autocorrelation. Geographically weighted regression (GWR) approach is advanced in capturing spatial heterogeneity of ridership and used in many studies [23,31,35,46]. But only a few studies considered the impacts of spatial autocorrelation on the relationship of the built environment and SBBS ridership, for example, the generalized additive mixed model (GAMM) proposed by Sun et al. [47] and the spatial lag model (SLM) used by Zhang et al. [48].
In summary, some knowledge gaps in the field are worthy of attention. Firstly, the existing studies only focus on the behaviors of bike sharing and taxis for metro transfer separately. To the best of our knowledge, previous study has not made comparison of the two modes for metro transfer, and most of the existing studies concentrated on SBBS, which has different features with the recently developed DBS. Secondly, most existing studies have relied on questionnaire survey data to analyze transfer behaviors, which is inefficient and includes an inadequate sample of participants and larger areas. However, DBS with the GPS chip gives researchers a chance to measure and compare both cycling and taxi behaviors on a large geographic scale. Third, considering spatial autocorrelation is necessary for DBS or taxi ridership, which can surely bring a more comprehensive understanding of trans-shipment characteristics from a spatial perspective. Only a few study have investigated spatial autocorrelation factors of this issue.

3. Materials and Methods

3.1. Case-Study Context

The case-study context of this study is Beijing, China, which contains 16 urban districts and 152 Jiedaos [49]. Jiedao is an administrative unit in China that covers an area about 10 km2. The city features a total area of 16,410 km2 and 21.70 million citizens. Beijing has six ring roads, the area within the Fourth Ring Road is generally defined as the urban area, and the area outside the Fourth Ring Road is the suburban area [32]. By the end of 2016, 15 metro lines were running in Beijing, covering 275 metro stations (recording the transfer stations of different metro lines as one, Figure 1). Meanwhile, All DBS companies continually launched 2.10 million bicycles in Beijing, and Mobike occupied half of the bike share market [50]. Meanwhile, Beijing has nearly 67,000 taxis.

3.2. Data Collection

3.2.1. DBS and Taxi Raw Data

Data used in the analysis comprises DBS trip dataset compiled from Mobike trip data and GPS trajectory data of taxis during one workweek of May 2017 (May 10–16, 2017) in Beijing. During the study period, the temperature in Beijing did not change much, the weather was sunny or cloudy, and there was no rain.
The Mobike dataset contains the order ID, bike ID, user ID, the start time of the trip, as well as pairs of start/end locations with the geohashed code, which are required to translate into latitude and longitude coordinates. There are a total of 1,830,100 O-D pairs in a week.
The taxi GPS data was collected with the interval of 1s, including the travel date, taxi ID, longitude, latitude, travel speed, travel direction, and information on whether carrying other passengers. A complete trip can be then recognized by connecting all points between the original and destination points. A total of 283,631 O-D pairs of the taxi trips are collected in a week.

3.2.2. Built Environment Factors

This study mainly focuses on the effects of the socio-demographic and built-environment factors around the metro stations, so we collect the 275 metro stations in Beijing. Socioeconomic values, metro station characteristics, the bus transit accessibility, the motorization service, land use, and the roadway infrastructure are also included.
The socioeconomic information is obtained from local authorities, including population density and gender ratio, which are collected at the Jiedao level from the Beijing Statistical Yearbook of 2016. The housing price is collected from the website of a housing agency (http://www.yunfangdata.com) to reflect the economic level of a region [51]. Housing price is also considered in analyzing bicycle ridership [31,52].
The metro station characteristics, including the location, the number of entrances, and so on, are collected from the website of Beijing Subway (https://www.bjsubway.com). Note that at almost all stations, passengers can be dropped off at the roadside nearby the entrances, and they can be picked up either at roadside, or at a designated taxi waiting area nearby; while for the DBS users, they can easily pick up or drop off bicycles at the sidewalks or bicycle parking areas nearby the entrances. Despite of various public space design at different metro stations, examples are shown in Figure 2a–d, the convenience of using taxis or DBS seems not be significantly affected by the public space design, so the characteristics of public space design is not collected in the study.
The data for the bus transit accessibility, the motorization service and land use data are generated using Baidu Map’s Application Programming Interface® combined with Beijing’s traffic police data, as well as the Beijing geographic information map of 2017. Moreover, the roadway infrastructure data, including the length of arterial and branches, as well as the number of signal intersections, is collected from the Beijing traffic police, the Beijing geographic information map and OSM map.

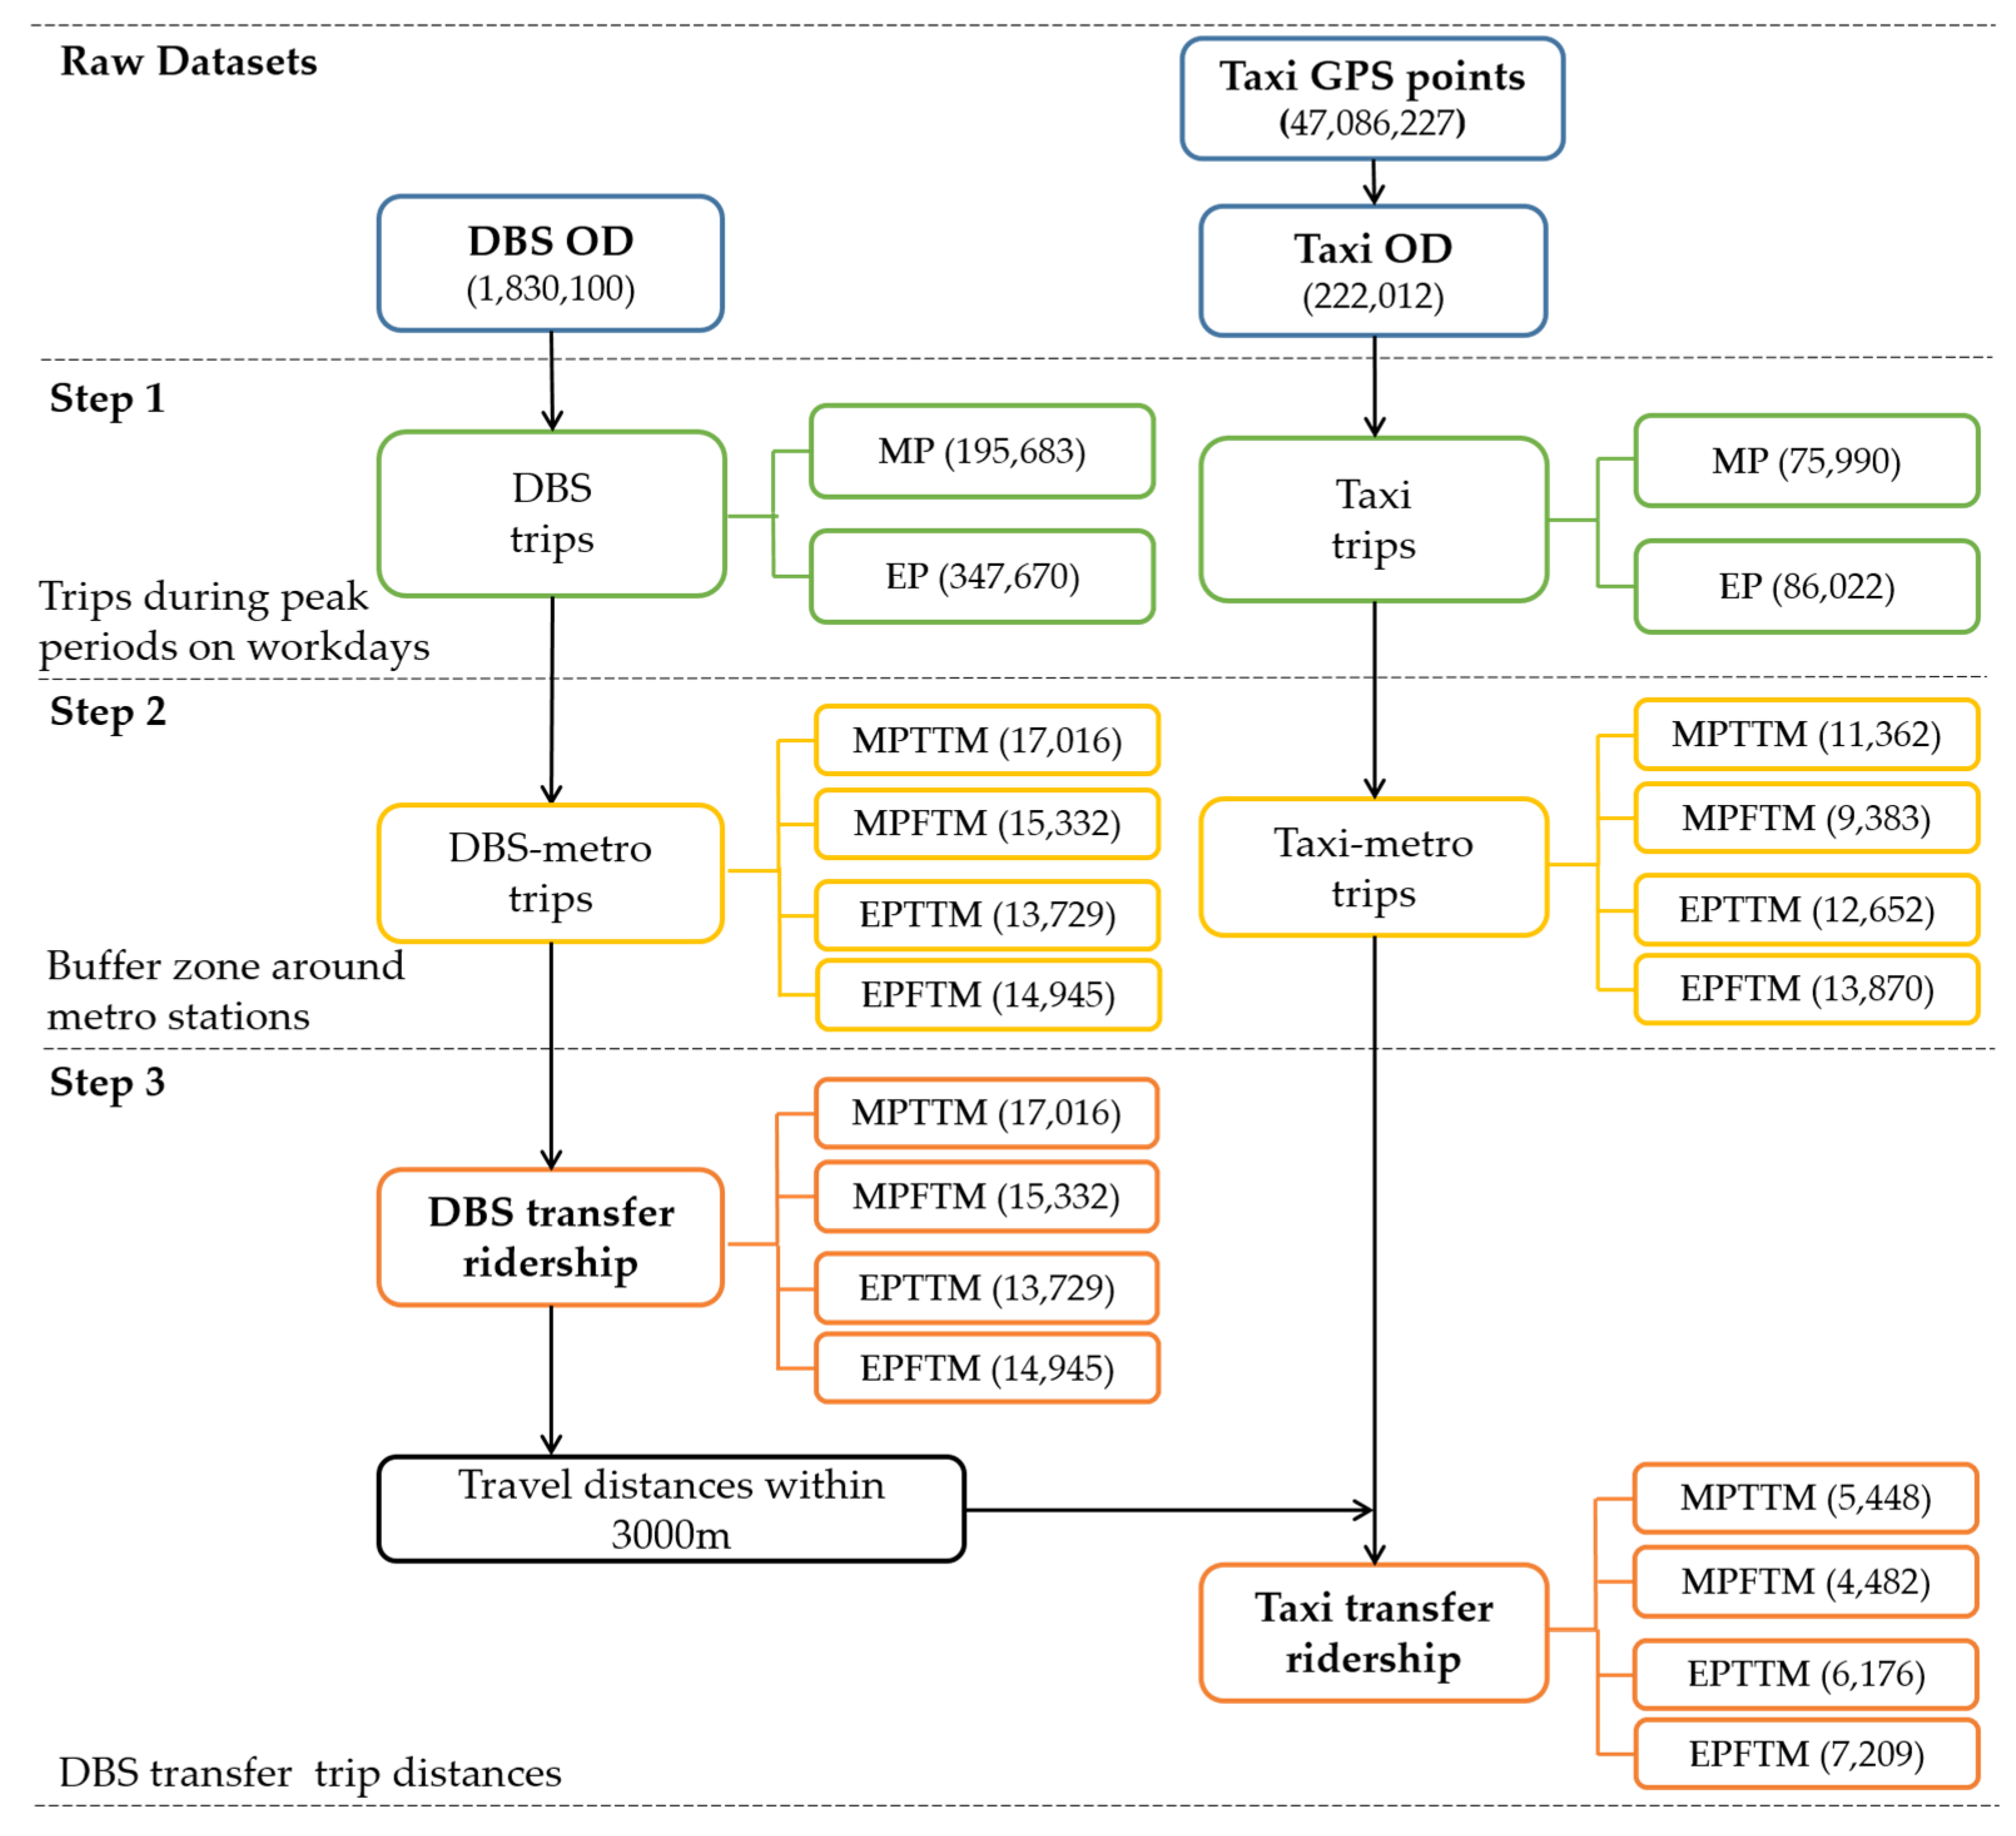
3.3. Data Processing

Because metro transfer behaviors usually occur to commute during peak periods, we select DBS and taxi transfer trips during peak periods from the dataset. There are some errors and redundant information exist in the raw data, so we ran a series of processing steps described below, and the final sample size of the dataset after filtering by each step is shown in Figure 3.
Step 1: Select trips during peak periods on workdays.
Incomplete and abnormal trip trajectories in the DBS and taxi dataset are first cleaned up. Then, peak periods in Beijing is defined that morning peak (MP) is from 7:00 to 9:00 and evening peak (EP) is from 17:00 to 19:00 based on the Beijing Traffic Operation Report [53].
Step 2: Select trips with metro stations as origins or destinations from the results of Step 1.
According to some recent studies, for example, Li, Zhu and Guo [33] set a threshold of 100m around the metro station to recognize DBS transfer trips, and Wu et al. [54] considered that DBS pick-up or drop-off within 100 m of metro stations’ entrances were DBS-metro integration. What’s more, DBS users are more likely to park and fetch bicycles as near as possible to the station entrance, while taxis cannot always make a stop very close to the entrance due to some road parking restrictions. Therefore, different thresholds were set in the study for recognizing transfer trips for the two modes. That is, origin/destination within 50 m and 100 m of the station entrance are used as transfer trips for DBS and taxi, respectively. The study uses the toolbox ‘Dissolve’ in ArcGIS 10.2 ® to merge the all 50 m or 100 m buffers around entrances of a metro station into one buffer zone. Trips, which origins or destinations are within the buffer zones around metro stations from the results of Step 1 are selected. The trips are divided into two types, namely, to the metro (TTM) and from the metro (FTM).
Step 3: Select the metro transfer ridership from the results of Step 2.
We recognize all trips of DBS selected in Step 2 as the DBS transfer ridership. Step 3 aims to select the metro transfer trips of taxis based on a transfer distance deduced from the DBS trips.
The study uses the toolbox “Network Analyst” in ArcGIS 10.2 ® based on actual road network shapefiles to deduce shortest distances of DBS for metro access, because the DBS dataset does not contain a sequence of intermediate GPS points between start and end locations, it cannot measure the actual trip distances of bicycles.
Figure 4 shows the trip distances of DBS for metro access during peak periods. Trip distances of TTM and FTM do not show significant differences. The median trip distances of all are about 1,200 m, which are consistent with the previous study. Reportedly, people travel 1,200 m or more when using bicycles to access transit [55]. Additionally, All higher boundaries of trip distances are approximately 3,000 m, which mostly concurs with the prior study that the majority of bicycle trips connecting metro stations and homes or workplaces are between 1,000 m and 4,000 m [32]. Therefore, the transfer distance is set as 3,000 m. Also, we will take 3,000 m as the radius of the buffer zones each metro station to measure the built environment variables. Then, we calculate the trip distances of taxi by the GPS trajectories and screen out the trips with travel distance within 3,000 m as metro-taxi transfer ridership. Because we want to analyze those metro-taxi connections that compete with DBS.
Transfer proportion and trip direction during MP and EP for two modes, respectively, as listed in Table 2. There is a distinction in the characteristics of DBS-metro integration between MP and EP. The proportion of DBS transfer ridership in DBS during MP is significantly higher than that during EP, while taxis have no obvious difference. Additionally, the proportion of TTM and FTM in transfer ridership during MP or EP is similar with DBS and taxis, indicating the consistency of the metro transfer behaviors of two modes.

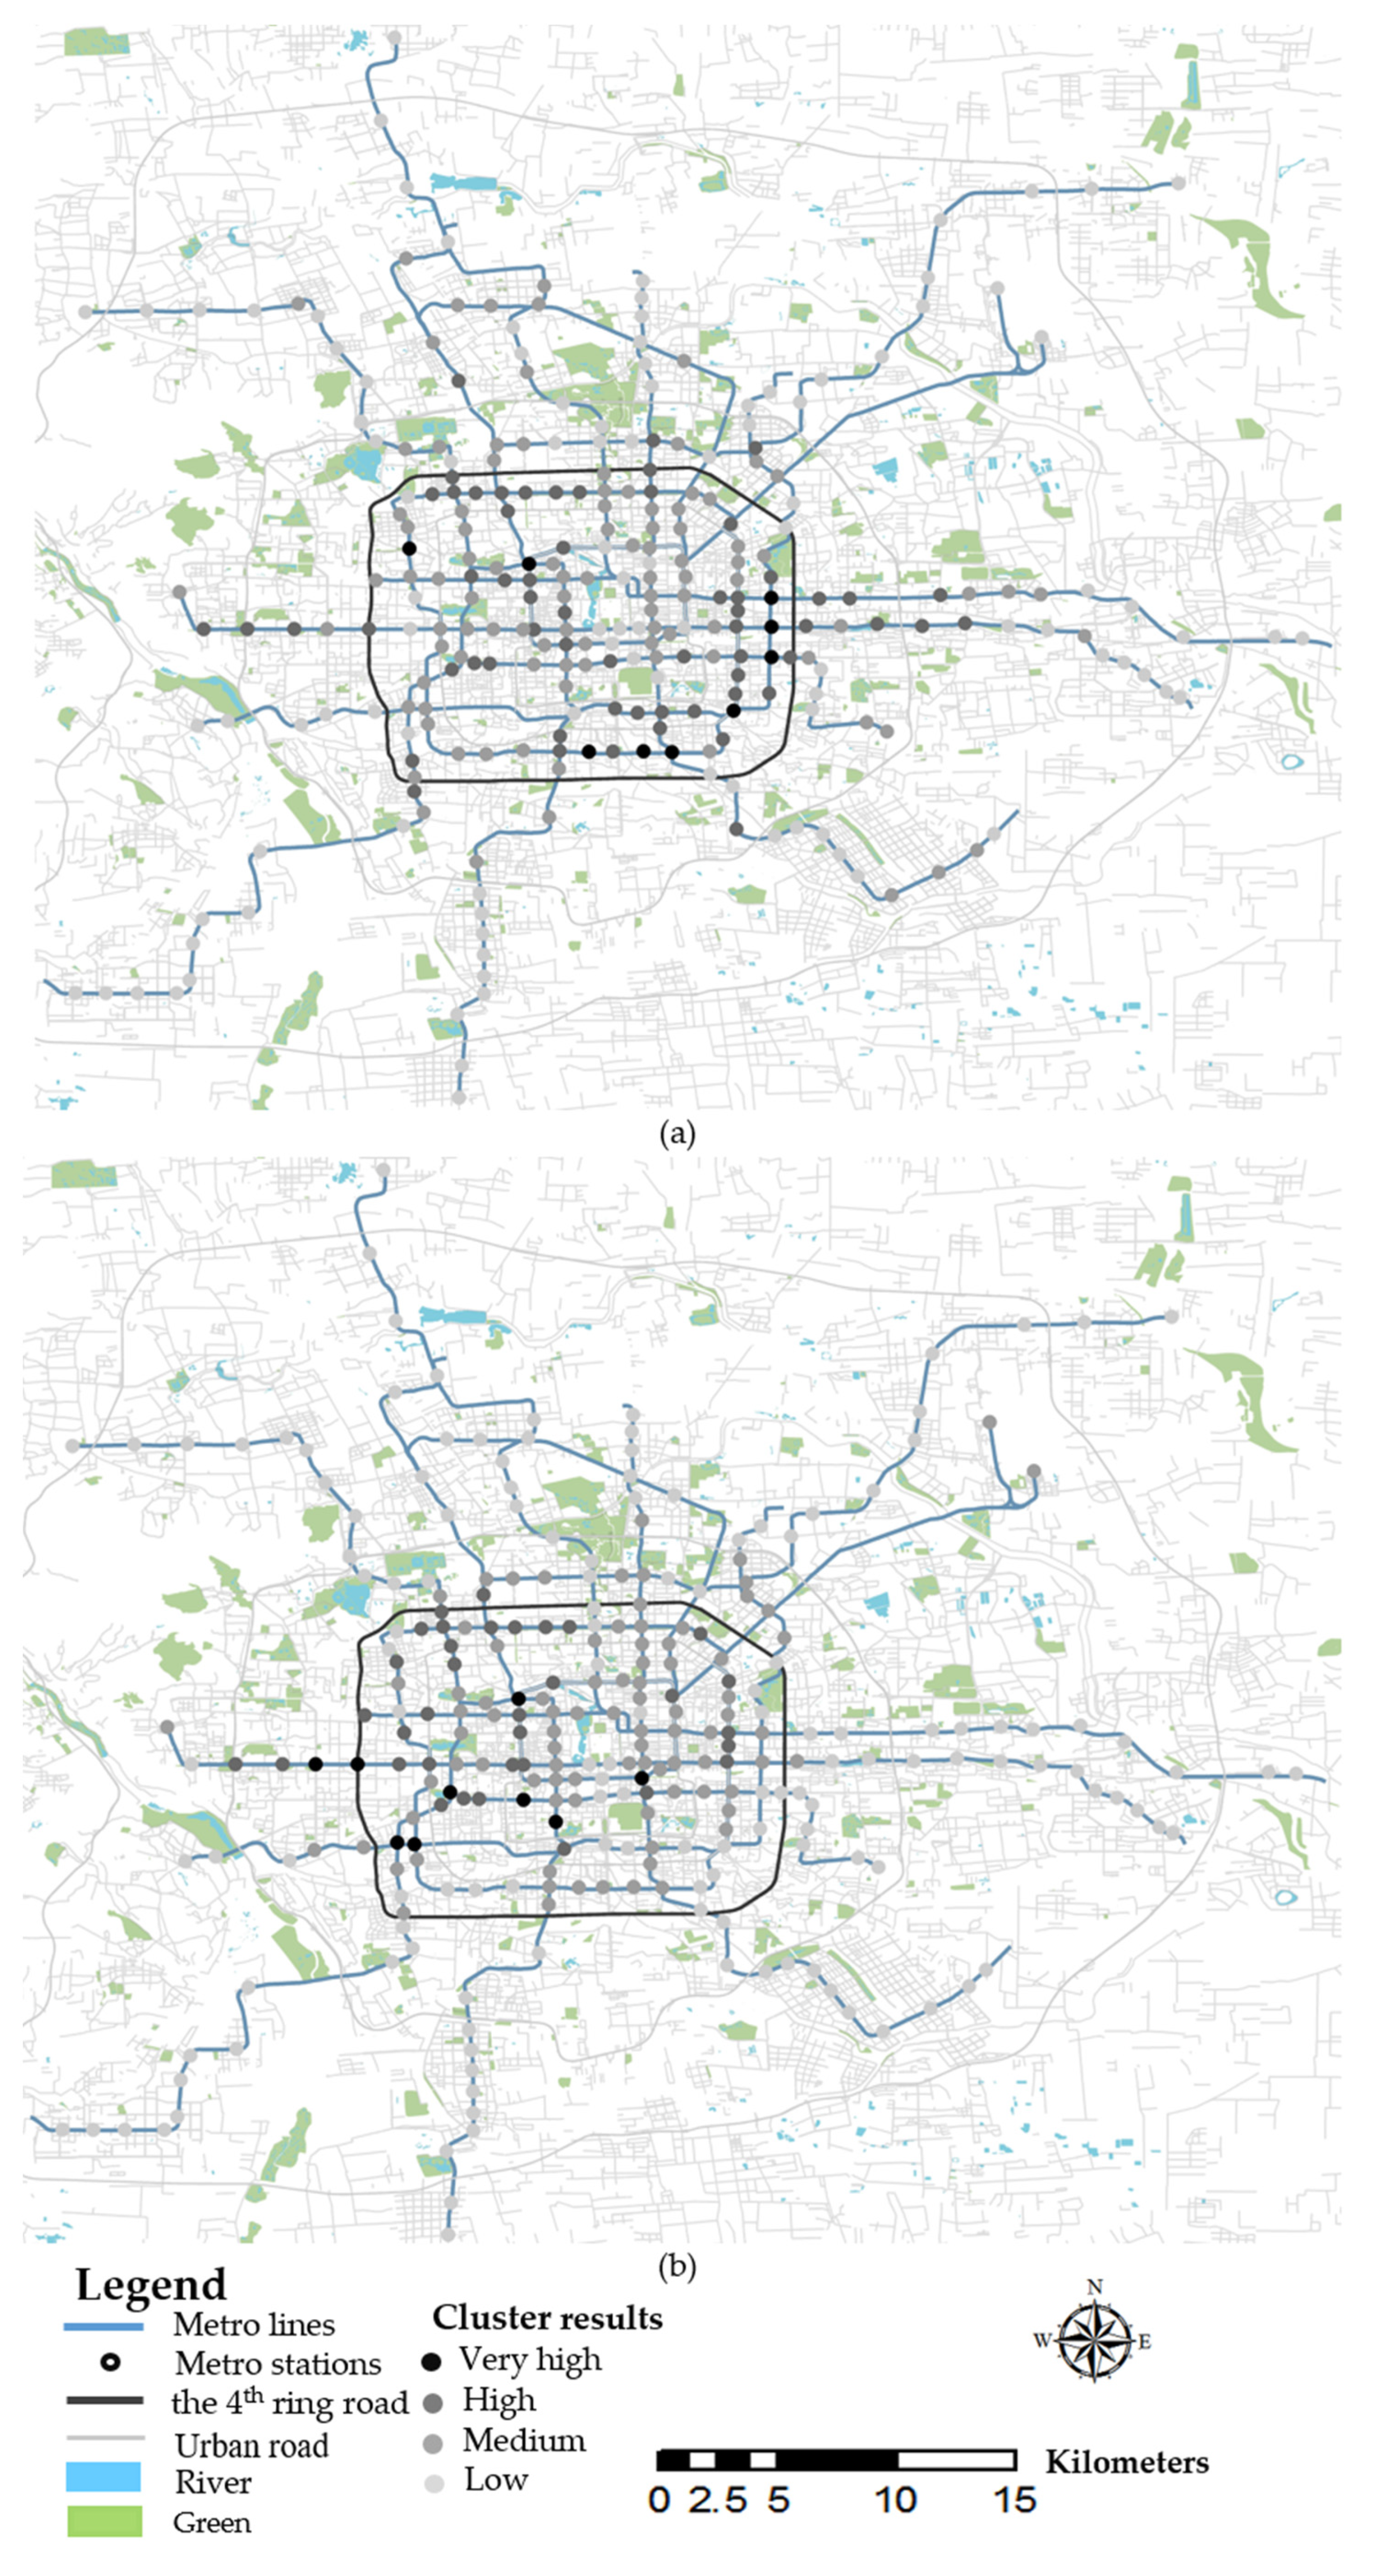
3.4. Spatial Distribution of Two Modes

To summarize the DBS and taxi transfer ridership around the metro station and obtain a clear view of the demand level of two modes during peak periods, four indicators, namely, TTM/FTM ridership of DBS and taxis at MP/EP are used to cluster. K-means method is a cluster algorithm by iterative solution, which can be useful for analyzing not only the big data of bicycle sharing but also other types of research objects [56,57,58]. Table 3 shows the cluster results with cluster groups, proportions, and the values of the cluster center of each group, and Figure 5a,b visualize the results.
Overall, spatial distributions of DBS and taxi transfer ridership around metro stations are similar. The majority of metro stations with very high and high ridership of the two modes are in typical residential areas, working areas, and central business districts. Moreover, metro stations with high usage of DBS can be divided into two types. One type has higher MPFTM and EPTTM (C3), which is generally concentrated in working areas. The other type has higher MPTTM and EPFTM (C4), which is grouped in the urban community with high-density residential housing. This is also consistent with DBS-metro integration characteristics. However, metro stations with high taxi usage have no evident distinction. On the contrary, Metro stations with low transfer ridership generally distribute in the major area of outer suburbs.
However, there are two big differences in some areas. Notably, DBS transfer ridership is evidently higher than the taxi transfer ridership in the southern and eastern Beijing, as shown in Figure 5. Spatial distribution of DBS and taxi transfer ridership at metro station level: (a) DBS transfer ridership; (b) Taxi transfer ridership. A possible reason for higher usage of DBS in the southern area is less economically developed than the northern. In fact, there are large amounts of universities in northern Beijing, and many companies are also established in the vicinity of educational resource-rich areas and gradually form a large number of high-tech parks. Consequently, the economic development and the income of residents in the north are higher than that in the south, and the economic activities are stronger.
The results also show that the DBS usage is higher than that of taxis in the suburbs, especially in the east. From the perspective of urban planning in Beijing, the sub-center of Beijing is near the Sixth Ring Road in the east, where many government departments and agencies are located. Moreover, central business district (CBD) of Beijing is near the East Fourth Ring Road. So residents in the east have a large travel demand to CBD or the sub-center. However, the range of taxis is generally concentrated within the Fourth Ring Road, so the DBS transfer ridership is relatively high in these areas.

3.5. Models

From spatial distributions of DBS and taxi transfer ridership, it is likely that the usage of DBS and taxis are clustered over adjacent areas, indicating that the ridership between neighboring metro station areas will interact with each other. It is defined as spatial autocorrelation. Moran’s I test is a common spatial variability test, which measures the spatial autocorrelation of each variable and can be expressed as follows [59]:
I   =   n i = 1 n j = 1 n w i j i = 1 n j = 1 n w i j ( y i y _ ) ( y j y _ ) i = 1 n ( y i y _ ) 2
where n is the number of spatial units; wij is the weight between location i and j; yi, yj represent the selected attribute value at units i and j, respectively; and y _ is the average of all observations.
The univariate Moran’s I is a coefficient between -1 and 1. If Moran’s I >0, it represents positive spatial autocorrelation, and the larger the value is, the more obvious the spatial difference is. If Moran’s I <0, it represents negative spatial autocorrelation. The smaller the value is, the larger the spatial variation is. Otherwise, if Moran’s I = 0, it means the value is a spatially random distribution [60].
The strength of the spatial relationship between the spatial unit and its neighbor(s) can be determined by the weighting matrix [61]. In this study, the weighting matrix is an 1100*1100 matrix. The results of univariate Moran’s I of the DBS and taxi ridership are 0.586 and 0.641, indicating that the dependent variables have positive spatial autocorrelation, which means the values of the ridership for analysis are positively proportional to the spatial aggregation of metro stations.
Therefore, a spatial regression model is required to account for the spatial effects and analyze the relationship between socio-demographic as well as built-environment factors and the metro transfer ridership. To consider the spatial autocorrelation, a spatial lag model (SLM) is used in this study other than the spatial error model, because the result of Lagrange Multiplier (lag) and Robust LM (lag) is significant. Besides, SLM explains spatial autocorrelation in the dependent variable, which means that the spatial lag term of the dependent variable is considered, and the model analyzes the neighborhood effects or spatial externalities across the boundaries of spatial units [62].
The detailed model specifications are as follows:
y = ρ W y + β X + ε ε ~   N ( 0 , σ 2 I )
where y is the vector of transfer ridership of DBS or taxis around metro stations, X is the matrix of explanatory variables; Wy is the weighting matrix; β is the vector of regression coefficients; ρ is the spatial autocorrelation coefficient; and ε is the error term.

4. Results

Spatial regression analysis is performed to further investigate the effects of built environment factors on both DBS and taxi transfer ridership.

4.1. Variables

All potential explanatory variables are considered to eliminate the double-counting and correlation between dependent variables and calculate the variance inflation factor (VIF). Commonly, variables with VIF values greater than 10 are assumed to be multi-collinear variables [63]. So before establishing the model, VIF values lower than 10 are shown in Table 4. Descriptive statistics for dependent and independent variables.

4.2. Model Results

The variables, except for the ridership characteristics and metro station characteristics that contain dummy variables, are log-transformed in SLM. Their distributions are positively skewed and only contain positive values, thereby eliminating the unit limit of variables and converting them to dimensionless and pure value. GeoDa® is used to estimate spatial lag models. Table 5 presents the estimation results of SLM.
The result shows that SLM models can explain the data, as indicated by statistically significant predictors, relatively high R2 values (0.725 and 0.758). Thereby it suggests that the models have high goodness of fit and good explanatory power, considering the small number of samples. In addition, the ρ of Wy is statistically significant, which indicates that the dependent variables have an obviously high degree of spatial autocorrelation.
For the characteristics of DBS and taxi transfer ridership, the result shows that people prefer to use DBS at MP, whereas the probability of selecting taxis to metro transfer increases during EP. Moreover, it indicates that people prefer to take DBS to the metro station rather than from the station. However, taxi passengers are more inclined to use taxis during EP, and the direction of the trip (TTM or FTM) has no effects on the taxi transfer ridership.
Socioeconomic values are related to different DBS and taxi transfer ridership. Evidently, population density is positively correlated with taxi transfer ridership. Females are also found to be more willing to ride a taxi, whereas the effect on DBS is insignificant. In addition, a 10% increase in housing price results in a 3.96% decrease in DBS usage and a 1.96% increase in taxi transfer ridership.
As for the characteristics of the metro stations, the stations located in the urban area have a statistically significant effect on the use of taxis. A station with more metro lines or hot commuting lines attracts more passengers to metro stations using transfer modes. What’s more, the number of nearby metro stations negatively affects the DBS and taxi transfer ridership. One interesting result is that the number of entrances show positive effects on taxi usage, while its impacts on DBS is insignificant.
The development of bus transit and motorization services is also an important factor that influences the selection between the two modes. Obviously, people are more likely to use DBS as the transfer mode in areas with a low density of bus lines. Additionally, when the access of bus stops at 500 m around the metro station has different influences on the two modes. When the number of bus stop is lower, people are less likely to use DBS, indicating that DBS and bus are substituted modes for each other as the feeder mode for metros. However, taxis and bus are not seem to have this relationship. Also, a higher parking lot access level, representing higher motorization service level, is more likely to be connected with higher taxi transfer ridership.
In terms of land use, the results show that more residences and offices within the 3,000 m buffer zone of the metro station generally have higher DBS and taxi transfer ridership. The number of residences has more influence on the DBS than on taxi transfer ridership. A 10% increase in residences results in a 3.12% increase in the DBS usage but only a 2.06% increase in taxi transfer ridership. Moreover, a 10% increase in offices leads to a 2.24% increase in DBS transfer ridership and 1.31% increase in taxi transfer ridership. The number of public and green parks negatively affects the DBS usage.
Roadway infrastructure has significantly different impacts on taxis and DBS. The density of arterial road has a positive influence on the passengers’ preference to use taxis as a transfer mode. However, the density of branches plays a negative role in taxi usage but encourages more DBS usage. The number of signalized intersections negatively affects cycling but increases taxi usage.

5. Discussion

The study explores the effects of the socio-demographic and built-environment factors on using DBS or taxis as a transfer mode to/from the metro station. With the combination of the spatial distribution results of transfer ridership and the model results, some key points are discussed as follows.
Firstly, trip time and direction have different effects on the metro transfer of DBS and taxi. More specifically, DBS mainly serves TTM during morning peak period. A similar result has been confirmed in another recent research that SBBS system mainly serves as first-mile connector in the morning [21]. However, taxis serve more at evening peak in both directions. One reason for this finding might is that people mainly focus on time reliability of transfer mode during morning peak period because they are not willing to be late for work. In addition, more people cycle to metro stations from home rather than the other direction in the morning. It may attribute to the density of metro stations being relatively high in working areas, and the distance between the metro station and workplaces is walkable.
Secondly, the land use of metro station areas affects the integration between metro and DBS/taxis. The taxi transfer ridership near large residential areas and typical workplace in the suburbs is low due to the following two reasons. One is that the taxi service area is generally concentrated in the city center; another reason is that the economic level of the suburbs is lower. The taxi fare is 13 yuan within 3 km, and 2.3 yuan per kilometer for the excess, while DBS is only 1 yuan per hour. Obviously, DBS has the advantage of low price. Moreover, the higher house price usually indicates higher income and better life quality of local residents living around the metro station [31]. Therefore, DBS serves more around large residential areas and typical workplace in both center areas and suburban areas. The result is supported by the studies, which means that rail stations in suburban areas will attract more bicycle trips than those in urban areas [8,64]. Thus, migrants in suburbs may be more likely to take DBS as an economic transfer mode.
Thirdly, the transport infrastructure and service plays a critical role in transit passengers to select DBS or taxis as a transfer mode. It is commonly observed in SBBS trip data that the transfer ridership of the metro station is negatively related to bus and other metro stations nearby [31]. In the area with poor bus accessibility, DBS can play a complementary role in the bus service due to its low-cost and reliable service, as mentioned in the previous report [13]. The previous study of several North American cities also indicated that bike sharing may serve prominently as first-and-last-mile connectors in areas with less intensive transit networks [8].
Fourthly, the roadway infrastructure seems to be significantly important for DBS and taxi usage. A dense network with a high proportion of branches and less signalized intersections is more favored by DBS, contrary to that by the taxi users. This finding is partially consistent with Lin et al. [65]’s study of SBBS conducted in Tokyo. Bicyclists may feel safer and more convenient with less vehicular traffic and less waiting time at intersections, thereby promoting DBS as a transfer mode. Moreover, many community entrances and exits are on branches, and people may prefer to branches due to shorter trip distance with less traffic pressure during peak hours.
In summary, the features of metro transfer serviced by DBS during peak periods can be classified into three categories in accordance with the above analysis, as follows:
(1) People tend to use DBS to metro stations in the morning.
(2) People living in less economically developed suburban areas use DBS as transfer mode to and from metro stations.
(3) The high density of branches with a smaller amount of signalized intersections is favored by DBS users.
However, the usage of taxis as the metro transfer mode during peak periods has the following features:
(1) People prefer to use taxis in the evening.
(2) People working in economically developed areas in the central city are willing to take taxis as the metro transfer mode.
(3) The high density of arterial roads and low density of branches with more signalized intersections promotes taxi users.

6. Conclusions and Recommendations

Based on one-week trip data of DBS and taxis during a concurrent period in Beijing, the paper aims to compare the temporal-spatial distribution of DBS and taxis around metro stations and find out socio-demographic and built-environment factors impacting their ridership. To the best of our knowledge, it is the first time that the study compares the usage of DBS and taxis as transfer modes for metros, and implements SLM to find out the similarities and differences of effects of built environment factors on their selection.
It has been found that both DBS and taxis are more likely to serve as the transfer mode in the areas with a higher number of residences and offices, fewer metro stations nearby. However, DBS is more preferred to serve TTM at morning peak in residential neighborhoods with lower housing prices, fewer bus lines, less signalized intersections and more branches. On the contrary, metro stations with taxis-metro integration are more concentrated in the city center with high housing prices, the high density of arterial roads and signalized intersections, especially at evening peak.
DBS has the potential to achieve critical public policy objectives. For instance, relieving traffic congestion, decreasing vehicle usage, reducing single-occupant vehicles, providing flexible access to public transit underserved people, and so on. Several findings of this study are worthy of attention in ensuring sustainable development of DBS programs. Although the results are drawn from Beijing’s case, they provide general implications for other cities facing with DBS programs.
First of all, with the increase of DBS worldwide, different types of impacts may occur as DBS extends into different types of cities. Based on our findings, policy toward DBS should be cautiously made by the policymakers to leverage positive impacts and tame negative impacts in cities that have intensive metro networks and systems. The differentiated policy can be considered for areas with the different built environment. For example, DBS can be encouraged in large residential areas, especially those in the suburbs without high-quality, fixed-route public transportation service. This conclusion is also confirmed by American cities [66]. Since DBS benefits residents as a complementary mode of bus services and provides affordable and reliable connections between metros and home/workplace. Meanwhile, the city center with higher accessibility of transit and less parking space for bicycles is better to limit the over-spreading of DBS.
Secondly, a better cycling environment is essential in achieving DBS-metro integration. A bike-friendly environment within metro station areas can play a positive role in promoting cycling as a metro transfer mode [67]. As being pointed by Vandenbulcke et al. [68], the comfortable bicycle infrastructure can possibly provide cyclists with a sense of personal safety, which offsets the pressure of traffic volume. Since length of arterial roads with bicycle lanes may not promote the DBS-metro integration. Protecting road rights and reserving road space for cyclists should be taken into significant consideration. Moreover, the number of parks has negative impact on DBS ridership in model results. The reason is that most greens and parks in urban areas in China prohibit DBS from going through, which leads to the detour, potential injuries, and waiting for traffic lights on roads with mixed traffic. Accordingly, opening greens and parks for DBS is recommended, and special bicycle lanes inside that are required to ensure the leisure and recreation of city residents without hindering the travel of DBS.
Thirdly, DBS operators need to dispatch devices and rebalance fleets in time to ensure proper device densities and service equity during peak periods, especially for residential areas at morning peak. Because people prefer to use DBS to metro stations in the morning. Moreover, City curbs have become increasingly crowded due to the chaos of DBS fleets during peak hours, so curb space management that allocates curb space and rights-of-way for parking and cycling needs to be addressed in transport planning and management.
Though the results are of significance, several limitations of this study must be noted. On the one hand, the typical measurement of land use, which usually measures the square of each land-use type, is not used in this research due to the lack of land use data. However, the study comprehensively considers population density and POI data as a substitution. On the other hand, the study only uses the data of Mobike, not including data from other DBS companies. In fact, Mobike accounts for more than half of DBS usage in 2017 [18], so our results are convincing. Besides, the study provides the directions for further investigation. Ride hailing service (e.g. Didi Chuxing, etc.) is preferred to be incorporated into comparison if relevant data is available. Also, the big data combined with corresponding questionnaire survey data can be analyzed subsequently to understand the attributes and requirements of individuals. Besides, the impact of local cycling cultures on DBS-metro integration can be analyzed in the future.

Author Contributions

Study conception and design, Y.N. and J.C.; data collection, J.C.; analysis and interpretation of results, Y.N. and J.C.; writing—original draft preparation, J.C.; writing—review and editing, Y.N.; All authors have read and agreed to the published version of the manuscript.

Acknowledgments

This research was sponsored by the National Key Research and Development Plan (2019YFB1600200), Shanghai Pujiang Program (17PJC103).

Conflicts of Interest

The authors declare no conflict of interest.

References

  1. Cheng, Y.H.; Tseng, W.C. Exploring the effects of perceived values, free bus transfer, and penalties on intermodal metro–bus transfer users’ intention. Transport Policy 2016, 47, 127–138. [Google Scholar] [CrossRef]
  2. Ji, Y.; Fan, Y.; Ermagun, A.; Cao, X.; Wang, W.; Das, K. Public bicycle as a feeder mode to rail transit in China: The role of gender, age, income, trip purpose, and bicycle theft experience. Int. J. Sustain. Transp. 2017, 11, 308–317. [Google Scholar] [CrossRef]
  3. Zhou, S.; Ni, Y. Effects of Dockless Bike on Modal Shift in Metro Commuting: A Pilot Study in Shanghai. In Proceedings of the Transportation Research Board 97th Annual Meeting, Washington, DC, USA, 7–11 January 2018. [Google Scholar]
  4. Wu, S.-S.; Zhuang, Y.; Chen, J.; Wang, W.; Bai, Y.; Lo, S.-M. Rethinking bus-to-metro accessibility in new town development: Case studies in Shanghai. Cities 2019, 94, 211–224. [Google Scholar] [CrossRef]
  5. Yang, M.; Zhao, J.; Wang, W.; Liu, Z.; Li, Z. Metro commuters’ satisfaction in multi-type access and egress transferring groups. Transp. Res. Part D Transp. Environ. 2015, 34, 179–194. [Google Scholar] [CrossRef]
  6. Wang, J.; Liu, J.; Ma, Y.; Sun, F.; Chen, F. Temporal and Spatial Passenger Flow Distribution Characteristics at Rail Transit Stations in Beijing. Urban Transp. China 2013, 11, 24–33. [Google Scholar]
  7. Li, M.; Dong, L.; Shen, Z.; Lang, W.; Ye, X. Examining the Interaction of Taxi and Subway Ridership for Sustainable Urbanization. Sustainability 2017, 9, 242. [Google Scholar] [CrossRef] [Green Version]
  8. Martin, E.W.; Shaheen, S.A. Evaluating public transit modal shift dynamics in response to bikesharing: A tale of two U.S. cities. J. Transp. Geogr. 2014, 41, 315–324. [Google Scholar] [CrossRef] [Green Version]
  9. Feng, X. The current situation and countermeasures of the use of public bicycle in Xi’an. China Mark. 2016, 32, 180–181. [Google Scholar]
  10. Liu, Q. Study on the influencing of public bicycle user’s choice behavior in Jinhua city. Business 2016, 16, 62–63. [Google Scholar]
  11. Campbell, A.A.; Cherry, C.R.; Ryerson, M.S.; Yang, X. Factors influencing the choice of shared bicycles and shared electric bikes in Beijing. Transp. Res. Part C 2016, 67, 399–414. [Google Scholar] [CrossRef] [Green Version]
  12. Yu, S.; Zhang, X.; Zhao, J. Understanding the usage of dockless bike sharing in Singapore. Int. J. Sustain. Transp. 2018, 12, 1–15. [Google Scholar]
  13. Shaheen, S.; Nelson, C.; Apaar, B.; Adam, C. Chapter 13: Sharing Strategies: Carsharing, Shared Micromobility (Bikesharing and Scooter Sharing), and Innovative Mobility Modes. 2019. Available online: https://escholarship.org/uc/item/0z9711dw (accessed on 26 July 2018).
  14. Chen, P.; Liu, Q.; Sun, F. Bicycle parking security and built environments. Transp. Res. Part D Transp. Environ. 2018, 62, 169–178. [Google Scholar] [CrossRef]
  15. Lierop, D.; Grimsrud, M.; El-Geneidy, A. Breaking into Bicycle Theft: Insights From Montreal, Canada. Int. J. Sustain. Transp. 2014, 9, 12. [Google Scholar] [CrossRef]
  16. Mburu, L.; Helbich, M. Environmental Risk Factors influencing Bicycle Theft: A Spatial Analysis in London, UK. PLoS ONE 2016, 11, e0163354. [Google Scholar] [CrossRef] [Green Version]
  17. Du, M.; Cheng, L. Better Understanding the Characteristics and Influential Factors of Different Travel Patterns in Free-Floating Bike Sharing: Evidence from Nanjing, China. Sustainability 2018, 10, 1244. [Google Scholar] [CrossRef] [Green Version]
  18. Company, M. The research report on dockless bike sharing. Available online: https://mp.weixin.qq.com/s/4cDM6_5qFvqaIxafCXxaeg (accessed on 26 July 2018).
  19. Company, O. The research report on China’s dockless bike industry in 2017. Available online: https://wenku.baidu.com/view/c5c1fd0376232f60ddccda38376baf1ffc4fe3aa.html?rec_flag=default&sxts=1531712325722 (accessed on 12 February 2017).
  20. Shaheen, S.; Cohen, A. Shared Micromoblity Policy Toolkit: Docked and Dockless Bike and Scooter Sharing; 2019. Available online: https://escholarship.org/uc/item/00k897b5 (accessed on 26 July 2018).
  21. Gu, T.; Kim, I.; Currie, G. Measuring immediate impacts of a new mass transit system on an existing bike-share system in China. Transp. Res. Part A Policy Pract. 2019, 124, 20–39. [Google Scholar] [CrossRef]
  22. Gu, T.; Kim, I.; Currie, G. To be or not to be dockless: Empirical analysis of dockless bikeshare development in China. Transp. Res. Part A Policy Pract. 2019, 119, 122–147. [Google Scholar] [CrossRef]
  23. Qian, X.; Ukkusuri, S.V. Spatial variation of the urban taxi ridership using GPS data. Appl. Geogr. 2015, 59, 31–42. [Google Scholar] [CrossRef]
  24. Cheng, Y.H.; Liu, K.C. Evaluating bicycle-transit users’ perceptions of intermodal inconvenience. Transp. Res. Part A Policy Pract. 2012, 46, 1690–1706. [Google Scholar] [CrossRef]
  25. Ma, X.; Yang, M.; Ji, Y.; Jin, Y.; Tan, X. Understanding Bikeshare Mode as a Feeder to Metro by Isolating Metro–Bicycle Transfers from Smart Card Data. Transp. Policy 2018, 71, 57–69. [Google Scholar] [CrossRef]
  26. Arbis, D.; Hossein Rashidi, T.; Dixit, V.; Vandebona, U. Analysis and Planning of Bicycle Parking for Public Transport Stations. Int. J. Sustain. Transp. 2015, 10, 150817125034000. [Google Scholar] [CrossRef]
  27. Molin, E.; Maat, K. Bicycle parking demand at railway stations: Capturing price-walking trade offs. Res. Transp. Econ. 2015, 53, 3–12. [Google Scholar] [CrossRef]
  28. Caulfield, B.; Brick, E.; McCarthy, O.T. Determining bicycle infrastructure preferences—A case study of Dublin. Transp. Res. Part D Transp. Environ. 2012, 17, 413–417. [Google Scholar] [CrossRef] [Green Version]
  29. Jingxu, C.; Xuewu, C.; Wei, W.; Baol, F. The Demand Analysis of Bike-and-ride in Rail Transit Stations based on Revealed and Stated Preference Survey. Procedia-Soc. Behav. Sci. 2013, 96, 1260–1268. [Google Scholar] [CrossRef] [Green Version]
  30. Erdoğan, S.; Liu, C.; Ma, T. Bicycle Sharing and Transit: Does Capital Bikeshare Affect Metrorail Ridership in Washington, D.C. Transp. Res. Rec. J Transp. Res. Board 2015, 2534. [Google Scholar] [CrossRef]
  31. Ji, Y.; Ma, X.; Yang, M.; Jin, Y.; Gao, L. Exploring Spatially Varying Influences on Metro-Bikeshare Transfer: A Geographically Weighted Poisson Regression Approach. Sustainability 2018, 10, 1526. [Google Scholar] [CrossRef] [Green Version]
  32. Zhao, P.; Li, S. Bicycle-metro integration in a growing city: The determinants of cycling as a transfer mode in metro station areas in Beijing. Transp. Res. Part A Policy Pract. 2017, 99, 46–60. [Google Scholar] [CrossRef]
  33. Li, Y.; Zhu, Z.; Guo, X. Operating Characteristics of Dockless Bike-Sharing Systems near Metro Stations: Case Study in Nanjing City, China. Sustainability 2019, 11, 2256. [Google Scholar] [CrossRef] [Green Version]
  34. Yang, Z.; Franz, M.L.; Zhu, S.; Mahmoudi, J.; Nasri, A.; Zhang, L. Analysis of Washington, DC taxi demand using GPS and land-use data. J. Transp. Geogr. 2018, 66, 35–44. [Google Scholar] [CrossRef]
  35. Li, B.; Cai, Z.; Jiang, L.; Su, S.; Huang, X. Exploring urban taxi ridership and local associated factors using GPS data and geographically weighted regression. Cities 2019, 87, 68–86. [Google Scholar] [CrossRef]
  36. Wang, C.-H.; Chen, N. A geographically weighted regression approach to investigating the spatially varied built-environment effects on community opportunity. J. Transp. Geogr. 2017, 62, 136–147. [Google Scholar] [CrossRef]
  37. Cai, H.; Jia, X.; Chiu, A.S.F.; Hu, X.; Xu, M. Siting public electric vehicle charging stations in Beijing using big-data informed travel patterns of the taxi fleet. Transp. Res. Part D Transp. Environ. 2014, 33, 39–46. [Google Scholar] [CrossRef] [Green Version]
  38. Cardozo, O.D.; García-Palomares, J.C.; Gutiérrez, J. Application of geographically weighted regression to the direct forecasting of transit ridership at station-level. Appl. Geogr. 2012, 34, 548–558. [Google Scholar] [CrossRef]
  39. Kim, K. Exploring the difference between ridership patterns of subway and taxi: Case study in Seoul. J. Transp. Geogr. 2018, 66, 213–223. [Google Scholar] [CrossRef]
  40. Susan, S.; Adam, C.; Balaji, Y.; Sara, S. Mobility on Demand Operational Concept Report. 2017. Available online: http://innovativemobility.org/?project=mobility-demand-operational-concept-report (accessed on 26 July 2018).
  41. El-Assi, W.; Mahmoud, M.S.; Habib, K.N. Effects of built environment and weather on bike sharing demand: A station level analysis of commercial bike sharing in Toronto. Transportation 2017, 44, 589–613. [Google Scholar] [CrossRef]
  42. Faghihimani, A.; Eluru, N.; Elgeneidy, A.M.; Rabbat, M.; Haq, U. How land-use and urban form impact bicycle flows: Evidence from the bicycle-sharing system (BIXI) in Montreal. J. Transp. Geogr. 2014, 41, 306–314. [Google Scholar] [CrossRef]
  43. Zhao, J.; Wei, D.; Yan, S.; Zhu, Y. What influences Metro station ridership in China? Insights from Nanjing. Cities 2013, 35, 114–124. [Google Scholar] [CrossRef]
  44. Wang, X.; Lindsey, G.; Schoner, J.E.; Harrison, A. Modeling Bike Share Station Activity: Effects of Nearby Businesses and Jobs on Trips to and from Stations. J. Urban Plan. Dev. 2016, 142, 04015001. [Google Scholar] [CrossRef] [Green Version]
  45. Yang, W.; Chen, B.Y.; Cao, X.; Li, T.; Li, P. The spatial characteristics and influencing factors of modal accessibility gaps: A case study for Guangzhou, China. J. Transp. Geogr. 2017, 60, 21–32. [Google Scholar] [CrossRef]
  46. Wei, T.; Rui, C.; Yang, Y.; Zhou, B.; Li, Q.; Li, Q. Spatial variations in urban public ridership derived from GPS trajectories and smart card data. J. Transp. Geogr. 2018, 69, 45–57. [Google Scholar]
  47. Sun, F.; Chen, P.; Jiao, J. Promoting public bike-sharing: A lesson from the unsuccessful Pronto system. Transp. Res. Part D Transp. Environ. 2018, 63, 533–547. [Google Scholar] [CrossRef]
  48. Zhang, Y.; Thomas, T.; Brussel, M.; Maarseveen, M.V. Exploring the impact of built environment factors on the use of public bikes at bike stations: Case study in Zhongshan, China. J. Transp. Geogr. 2017, 58, 59–70. [Google Scholar] [CrossRef]
  49. Hu, L.; Sun, T.; Wang, L. Evolving urban spatial structure and commuting patterns: A case study of Beijing, China. Transp. Res. Part D Transp. Environ. 2018, 59, 11–22. [Google Scholar] [CrossRef]
  50. Company, M.; Institute, B.T.T.U.P.D. Sharing bicycles and urban development in 2017. Available online: http://www.199it.com/archives/581592.html (accessed on 20 April 2017).
  51. Mirkatouli, J.; Samadi, R.; Hosseini, A. Evaluating and analysis of socio-economic variables on land and housing prices in Mashhad, Iran. Sustain. Cities Soc. 2018, 41, 695–705. [Google Scholar] [CrossRef]
  52. Brons, M.; Givoni, M.; Rietveld, P. Access to railway stations and its potential in increasing rail use. Transp. Res. Part A 2009, 43, 136–149. [Google Scholar] [CrossRef]
  53. Institute, B.T. Beijing transport annual report 2017. Available online: http://www.bjtrc.org.cn/List/index/cid/7.html (accessed on 21 August 2018).
  54. Wu, X.; Lu, Y.; Lin, Y.; Yang, Y. Measuring the Destination Accessibility of Cycling Transfer Trips in Metro Station Areas: A Big Data Approach. Int. J. Environ. Res. Public Health 2019, 16, 2641. [Google Scholar] [CrossRef] [Green Version]
  55. Rastogi, R.; Rao, K.V.K. Travel Characteristics of Commuters Accessing Transit: Case Study. J. Transp. Eng. 2003, 129, 684–694. [Google Scholar] [CrossRef]
  56. Tran, T.D.; Ovtracht, N.; d’Arcier, B.F. Modeling Bike Sharing System using Built Environment Factors. Procedia CIRP 2015, 30, 293–298. [Google Scholar] [CrossRef]
  57. Xu, H.T.; Wu, H.; Fang, X.J.; Zhang, W.J. Finding Key Stations of Hangzhou Public Bicycle System by a Improved K-Means Algorithm. Appl. Mech. Mater. 2012, 209–211, 925–929. [Google Scholar] [CrossRef]
  58. He, T.; Wei, G.; Bo, Z.; Ke, L. A GPS Data Based Distributed K-Means for Cabstand Location Selection. In Proceedings of the 2017 International Smart Cities Conference (ISC2), Wuxi, China, 14–17 September 2017. [Google Scholar]
  59. Alexander, N. Bayesian Disease Mapping: Hierarchical Modeling in Spatial Epidemiology. J. Royal Stat. Soc. 2011, 174, 512–513. [Google Scholar] [CrossRef]
  60. Getis, A. Spatial Autocorrelation. In Handbook of Applied Spatial Analysis: Software Tools, Methods and Applications; Fischer, M.M., Getis, A., Eds.; Springer Berlin Heidelberg: Berlin/Heidelberg, Germany, 2010; pp. 255–278. [Google Scholar]
  61. Fan, Y.; Khattak, A.J. Urban Form, Individual Spatial Footprints, and Travel: Examination of Space-Use Behavior. Transp. Res. Rec. J. Transp. Res. Board 2008, 2082, 98–106. [Google Scholar] [CrossRef]
  62. Sun, Y.; Chao, G.; Li, J.; Li, W.; Ma, R. Examining urban thermal environment dynamics and relations to biophysical composition and configuration and socio-economic factors: A case study of the Shanghai metropolitan region. Sustain. Cities Soc. 2017, 40, 284–295. [Google Scholar] [CrossRef]
  63. Kutner, M.H.; Nachtsheim, C.J.; Neter, J. Applied Linear Regression Model. Technometrics 2004, 26, 415–416. [Google Scholar]
  64. Martens, K. The bicycle as a feedering mode: Experiences from three European countries. Transp. Res. Part D Transp. Environ. 2004, 9, 281–294. [Google Scholar] [CrossRef]
  65. Lin, J.J.; Zhao, P.; Takada, K.; Li, S.; Yai, T.; Chen, C.H. Built environment and public bike usage for metro access: A comparison of neighborhoods in Beijing, Taipei, and Tokyo. Transp. Res. Part D Transp. Environ. 2018, 63, 209–221. [Google Scholar] [CrossRef]
  66. Shaheen, S.; Cohen, A.; Farrar, E. Mobility on Demand: Evolving and Growing Shared Mobility in the Suburbs of Northern Virginia. In Implications of Mobility as a Service (MaaS) in Urban and Rural Environments; IGI Global: Hershey, PA, USA, 2020; pp. 125–155. [Google Scholar]
  67. de Souza, F.; La Paix Puello, L.; Brussel, M.; Orrico, R.; van Maarseveen, M. Modelling the potential for cycling in access trips to bus, train and metro in Rio de Janeiro. Transp. Res. Part D Transp. Environ. 2017, 56, 55–67. [Google Scholar] [CrossRef]
  68. Vandenbulcke, G.; Dujardin, C.; Thomas, I.; Geus, B.D.; Degraeuwe, B.; Meeusen, R.; Panis, L.I. Cycle commuting in Belgium: Spatial determinants and ‘re-cycling’ strategies. Transp. Res. Part A 2011, 45, 118–137. [Google Scholar] [CrossRef] [Green Version]
Figure 1. Beijing metro lines and stations.
Sustainability 12 02034 g001
Figure 2. Examples of public space design at metro stations.
Sustainability 12 02034 g002
Figure 3. Flowsheet of data process of DBS and taxi transfer ridership. Note: MPTTM: TTM during MP; MPFTM: FTM during MP; EPTTM: TTM during EP; EPFTM: FTM during EP.
Sustainability 12 02034 g003
Figure 4. Trip distance distribution of DBS.
Sustainability 12 02034 g004
Figure 5. Spatial distribution of DBS and taxi transfer ridership at metro station level: (a) DBS transfer ridership; (b) Taxi transfer ridership.
Sustainability 12 02034 g005
Table 1. Summary of the built environment used in selected studies.
Bike SharingTaxi
Sun et al. [47]Faghihimai et al. [42] Zhao et al. [43]Ji et al. [31]Wang et al. [44]El-Assi et al. [41]Zhang et al. [48]Zhao and Li [32]Erdoğan et al. [30]Yang et al. [34]Qian and Ukkusuri [23]Li et al. [35]Wei et al. [46]
Independent variables
Sociodemographic variables Population
Age
Income
Household density
Metro station characteristicsDistance to CBD
Elevated station
Transfer station
Terminal station
Ridership of metro
Public transitBus lines
Bus stops
Bike stations
Metro stations
Bus accessibility
Metro accessibility
Land use (POIs)Job-housing balance index
Land use mix types
Restaurants
Commercial Enterprises
Parks and greens
Residential
Office
Shopping malls/Retails
Schools
Airports
Hospitals
Tourists attractions
Roadway infrastructureStreet intersections
Arterial road length
Branch road length
Road networks density
Street light/trees
Bicycle facility
othersParking availability
Data and methodology
Dependent variablesRidershipUsage ratesRidershipRidershipRidershipRidership & ODRidershipMode selectionRidershipPickup & Drop-off RidershipRidershipRidership
Data sourceGPS dataGPS dataGPS dataSmart-card dataGPS dataGPS dataSmart-card dataSurvey dataGPS dataGPS dataGPS dataGPS dataGPS data
ModelGAMMLMMOLSGWROLS & NBOLSSLMMNLOLSOLSGWRGWRGWR
Table 2. Temporal distribution of DBS and taxi transfer ridership during the study period.
DBSTaxi
Trip TimeTransfer RatioTrip Direction RatioTransfer RatioTrip Direction Ratio
Morning Peak (MP)17%TTM53%13%TTM55%
FTM47%FTM45%
Evening Peak (EP)8%TTM48%16%TTM46%
FTM52%FTM54%
Note: Transfer ratio refers to transfer ridership divided by trips during peak periods; Trip direction ratio refers to transfer ridership in each direction (TTM/FTM) divided by transfer ridership.
Table 3. Cluster result of DBS and taxi transfer ridership at metro stations (N=275).
DBSTaxi
LowMediumHighVery HighLowMediumHighVery High
C1C2C3C4C5C1C2C3C4
MPTTM 23689514326272354105
MPFTM 1964142822435215195
EPTTM15591387322683473101
EPFTM 1763841282187316694
Number1171022526514399276
Percent42.5%38.9%7.3%9.5%1.8%52.0%36.0%9.8%2.2%
Table 4. Descriptive statistics for dependent and independent variables.
ItemsVariableDescription and NotesVIFMinMaxMeanS.D.
Dependent variableDBS transfer ridershipNumber of bicycles at the buffer zone of the metro station (numbers) 2.00304.0055.47106.45
Taxi transfer ridershipNumber of taxis at the buffer zone of metro station (numbers) 1.00169.0021.2061.19
Ridership CharacteristicsTrip time: EP/MP=1 if the transfer ridership is during EP, =0 if the transfer ridership is during MP1.0001.000.500.50
Trip direction: FTM/TTM=1 if the transfer ridership is from the metro (FTM), =0 if the transfer ridership is to the metro (TTM)1.0001.000.500.50
Socioeconomic valuesPopulation densityDensity of jiedao population at 3000 m buffer zone (numbers/km2)3.93209.2275025.4711813.8611406.55
Gender ratio: maleProportion of male population in jiedao at 3000 m buffer zone (percent)1.930.480.620.530.03
Housing priceAverage housing price at 3000 m buffer zone (yuan/m2)3.9027406.00135258.0076023.4624805.06
Metro station characteristicsLocated in urban area=1 if the metro station is in urban area, other =03.8101.000.520.50
Contain hot commuting lines=1 if the metro station contains the hot commuting line (the average daily passengers of the metro line is more than 323,100), other =01.4501.000.450.49
No. of metro linesNumber of metro lines in the station (numbers)1.311.003.001.210.43
No. of entrancesNumber of entrances in the station (numbers)1.251.0012.004.121.79
No. of nearby metro stationsNumber of other metro stations at 3000 m buffer zone (numbers)6.971.0021.009.085.07
Bus transit accessibilityNo. of bus stopsNumber of bus stops at 500 m buffer zone (numbers)1.341.0014.008.512.35
Length of bus linesLength of bus lines at 3000 m buffer zone (km)3.0541.25501.3922.17103.69
Motorization serviceNo. of parking lotsNumber of vehicle parking lots at 3000 m buffer zone(numbers)6.4723.00680.00250.38180.30
Land useNo. of residencesNumber of residence communities at 3000 m buffer zone (numbers)5.5415.00438.00231.17119.56
No. of officesNumber of offices at 3000 m buffer zone (numbers)7.4036.004673.001192.001062.93
No. of commerceNumber of commerce at 3000 m buffer zone (numbers)8.6529.008585.003003.602096.64
No. of schoolsNumber of schools at 3000 m buffer zone (numbers)6,678.00245.00144.8270.84
No. of parksNumber of parks at 3000 m buffer zone (numbers)3.850.0061.0020.3713.03
Roadway infrastructureLength of arterial roadsLength of arterial roads at 3000 m buffer zone (km)4.4724.95403.83146.3176.92
Length of branchesLength of branches at 3000 m buffer zone (km)8.1635.69249.04138.9638.49
No. of signalized intersectionsNumber of signalized intersections at 3000 m buffer zone (numbers)1.594.0039.008.2118.57
Table 5. Results of SLM.
DBSTaxi
coeff.z-ValueP Valuecoeff.z-Valuep Value
Constant2.003**2.409 0.016 0.2730.3710.710
Ridership Characteristics
Trip time: EP/MP−0.063***−4.982 0.000 0.179***10.448 0.000
Trip type: FTM/TTM−0.107***−5.540 0.000 −0.010 −0.631 0.528
Socioeconomic values
Population density0.02460.757 0.448 0.080***2.1550.003
Gender ratio:male−0.703 −1.327 0.184 −1.675***−3.5110.000
Housing price−0.396***−3.066 0.002 0.196*1.712 0.086
Metro station characteristics
Located in urban area0.007 0.205 0.837 0.054***3.277 0.001
Contain hot commuting line0.104**1.993 0.046 0.071***3.381 0.001
No. of metro lines0.083***3.605 0.000 0.016 0.707 0.480
No. of entrances−0.073 −1.283 0.199 0.108*1.676 0.093
No. of nearby metro stations−0.154*−1.725 0.085 −0.327***−4.016 0.000
Bus transit accessibility
No. of bus stops−0.141*−1.775 0.076 0.191***5.609 0.000
Length of bus lines−0.188***−2.714 0.006 −0.046−0.7490.454
Motorization service
No. of parking lots0.0350.419 0.675 0.429***5.511 0.000
Land use
No. of residences0.312***2.928 0.003 0.206**2.177 0.029
No. of offices0.224***4.154 0.000 0.131***2.771 0.006
No. of commerce−0.069−0.7500.453 −0.610***−7.076 0.000
No. of parks−0.071*−1.770 0.078 0.012 0.267 0.710
Roadway infrastructure
Length of arterial roads0.005 0.059 0.952 0.156***4.677 0.000
Length of branches 0.527**2.023 0.043 −0.091*−1.819 0.068
No. of signalized intersections−0.259***−2.702 0.007 0.165**2.6110.010
Wy0.556***27.8110.000 0.519 ***24.237 0.000
Log likelihood−341.888−208.573
AIC727.777461.147
R20.7250.758
Note: A smaller P value means the corresponding variable is significant, p < 0.01 ***, p < 0.05 **, p < 0.1 *.

